

物联网 | TensorFlow 气象站预测降雨强度
组件和用品
| × | 1 | ||||
 |
| × | 1 | |||
| × | 1 | ||||
 |
| × | 1 | |||
 |
| × | 1 | |||
 |
| × | 1 | |||
 |
| × | 2 |
必要的工具和机器
 |
|
应用和在线服务
 |
| |||
 |
| |||
 |
|
关于这个项目
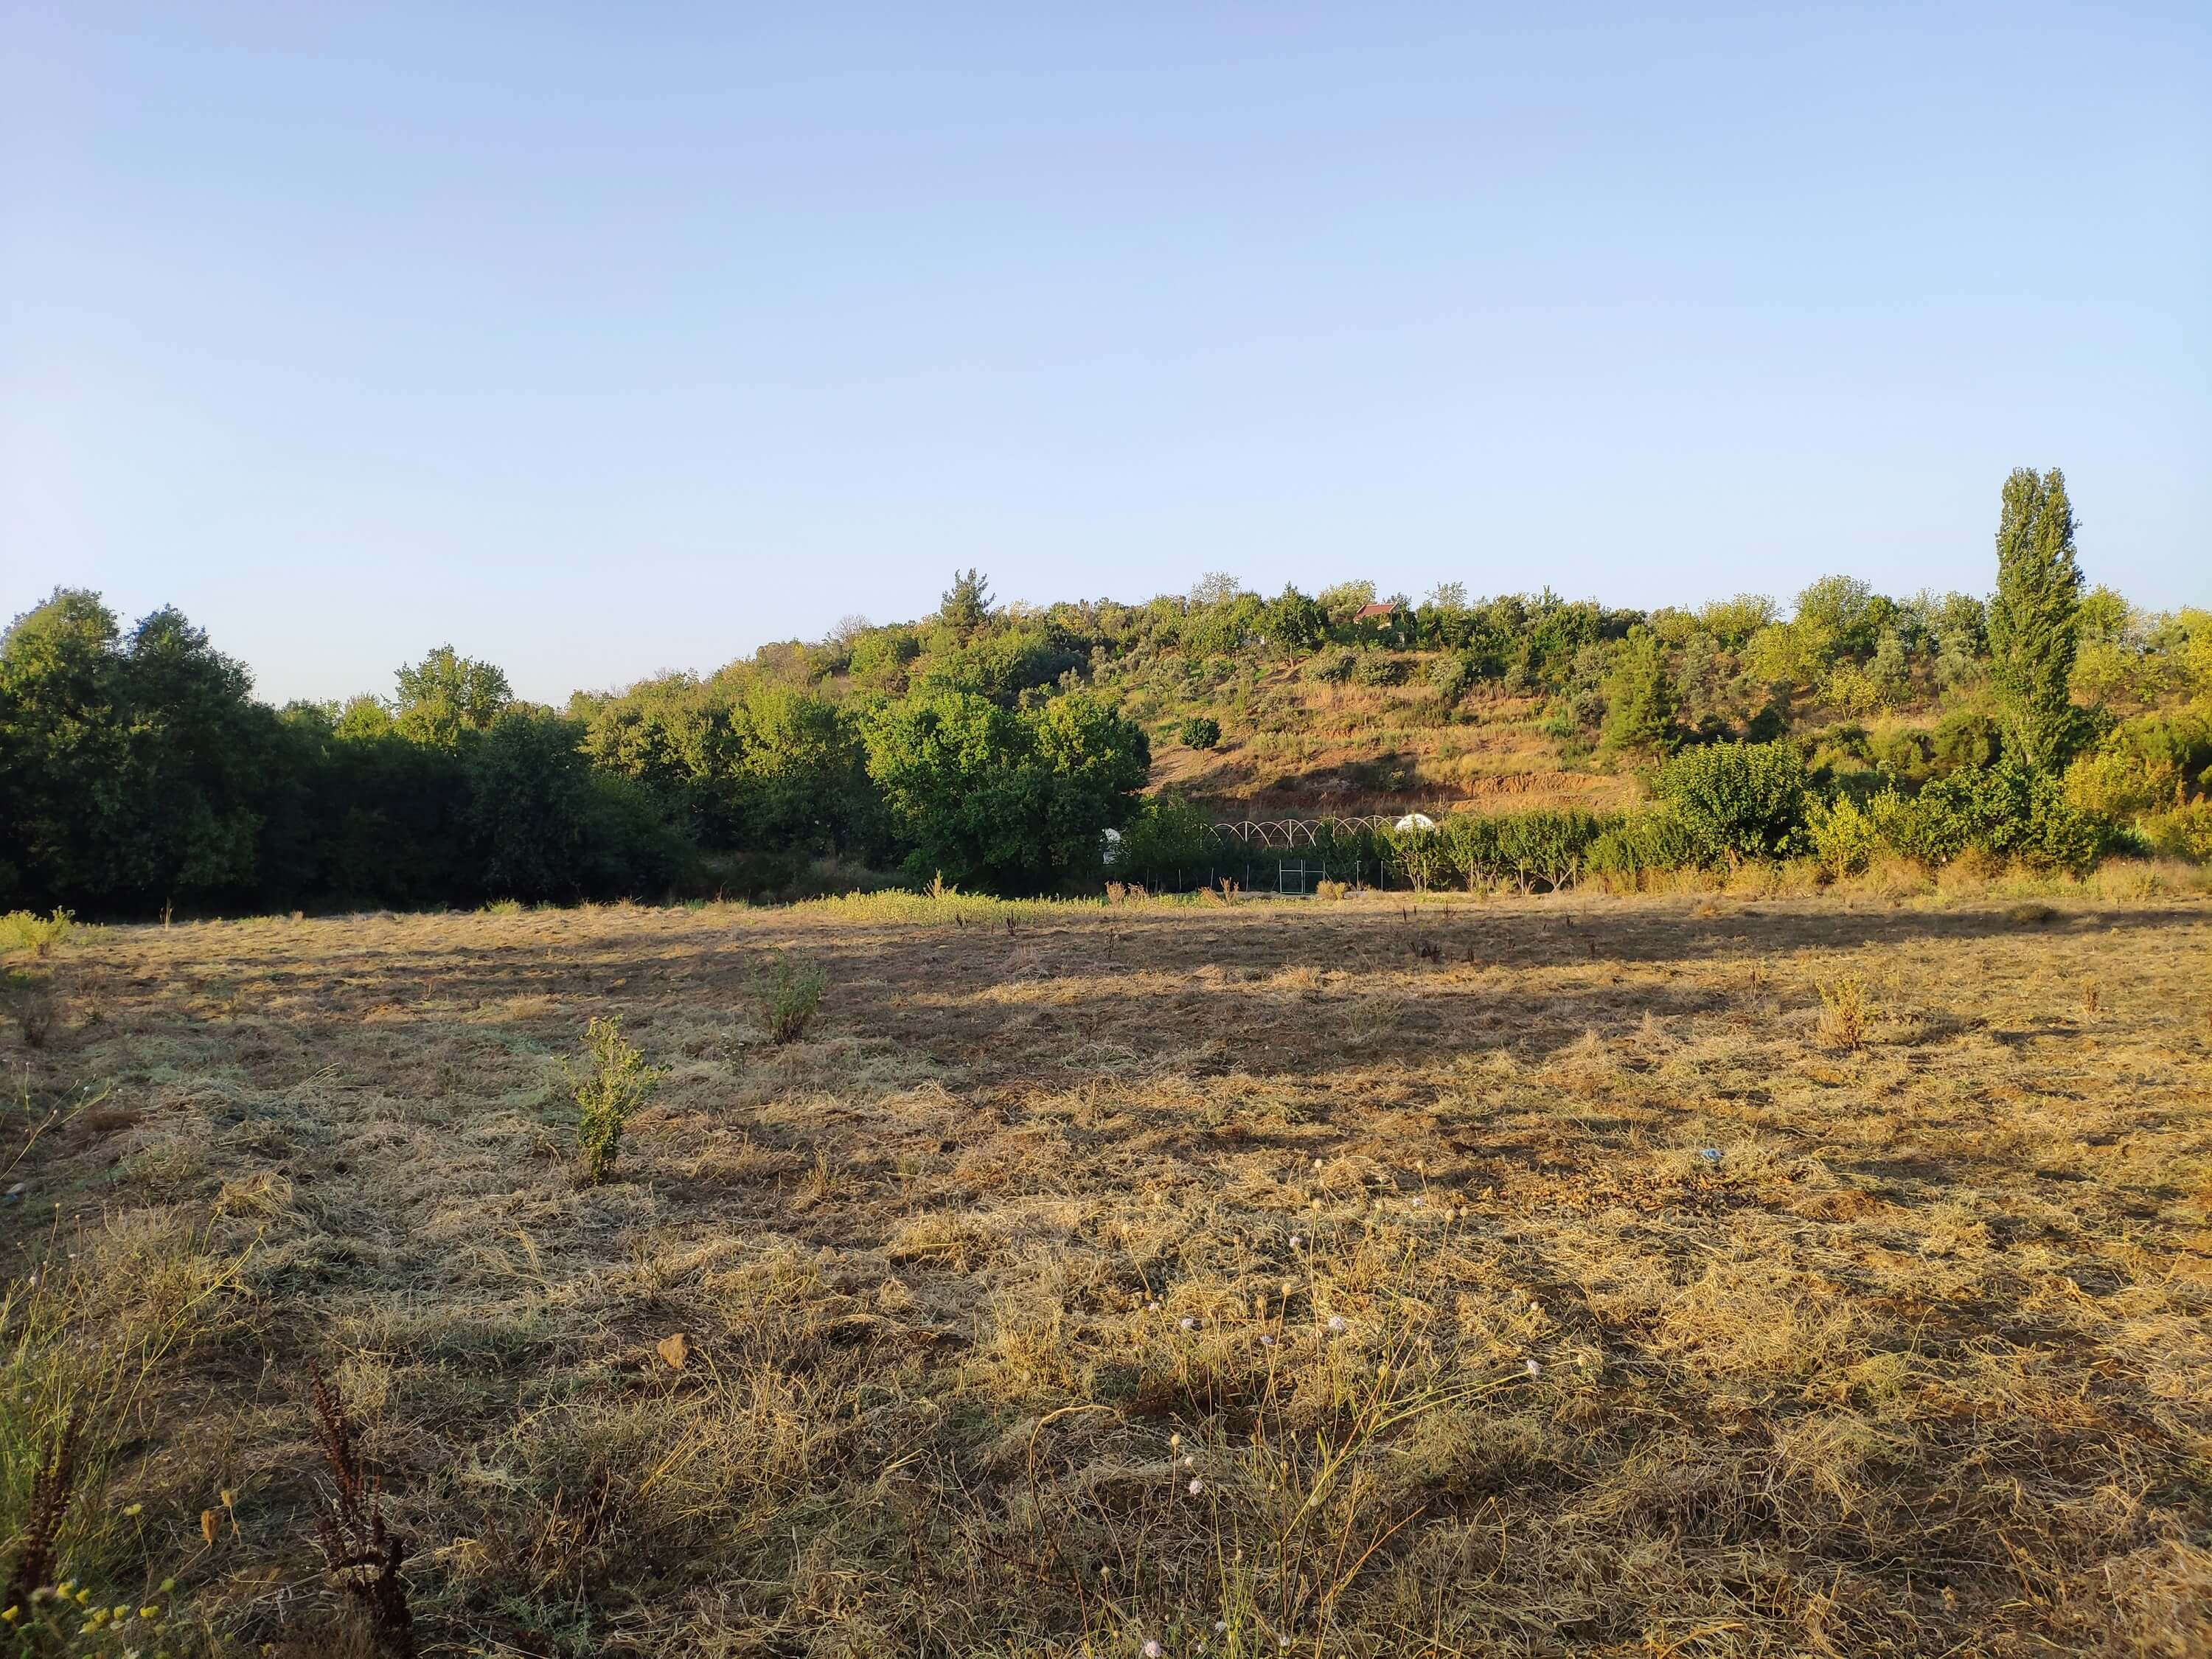
尤其是2020年,突如其来的猛烈暴雨,对我国的温室大棚和农作物产量造成了不利影响。不幸的是,这些天意外和过多的降雨发生得更加频繁,并且由于某些地区的气候变化而变得相对普遍。与此同时,其他地区遭受干旱。随着 2020 年的过去,我所在地区记录了超过 35 起因暴雨和猛烈降雨而导致农作物和牲畜损失的事件。为了帮助解决和避免过度降雨引发的农业生产力损失等问题,我考虑将这个项目作为一个起点。
在这个项目中,我主要关注过度降雨对农业的影响。然而,过多的降雨会导致许多危害,例如[1]:
- 洪水,包括对人类生命的威胁,
- 对建筑物和基础设施的损坏,
- 农作物和牲畜的损失,
- 山体滑坡可能威胁人类生命,破坏交通和通讯。
最新研究表明,过度降雨会以多种方式影响作物生产力,包括直接物理损害、种植和收获延迟、根系生长受限、缺氧和养分流失。因此,对于农业而言,过多的降雨可能与干旱一样危险:“过去三十年的数据表明,过多的降雨会像过热和干旱一样影响作物产量。在一项新研究中,来自美国农业部的一个跨学科团队伊利诺伊大学将 1981 年至 2016 年的作物保险、气候、土壤和玉米产量数据联系起来。该研究发现,在某些年份,过度降雨使美国玉米产量相对于预期产量降低了 34%。数据表明,干旱和过热导致某些年份的产量损失高达 37% [2]" .
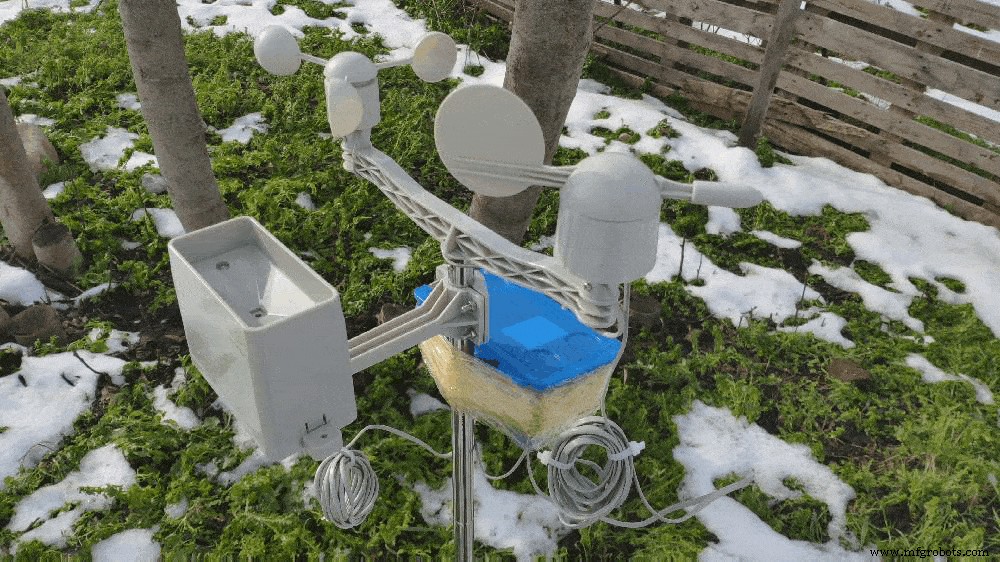
不幸的是,如果每个温室或农场没有足够的初步当地天气数据,早期预警系统不足以完全防止过度降雨对农产品和加工过程的加剧影响。因此,为了避免过度降雨对农业的不利影响,我决定创建这个项目作为预算友好的远程气象站,以收集和解释当地的天气信息,以便更准确地预测降雨强度。
在对深度学习和神经网络做了一些研究之后,我决定建立一个基于分类模型的人工神经网络(ANN)来解释积累的当地天气数据,根据给定的类别预测降雨强度。正如以下研究所示,研究人员应用了不同的神经网络模型和类型来预测降雨量和天气现象:“许多实验使用神经网络来预测不同位置和前瞻范围的定量降雨量。对于例如,泰国的研究人员能够使用前馈神经网络获得高度准确的预测,以预测一到三小时前瞻范围内的定量降雨量,从而预测可能的洪水危险。神经网络也被用于预测除了传统预报值之外的天气现象,例如降雨概率/数量、风速、气压等。它们已被非常成功地用于预测龙卷风。此外,澳大利亚的研究人员成功地使用神经网络在各种预报中识别雾范围从堪培拉国际机场 3 小时到 18 小时不等 [3]。”
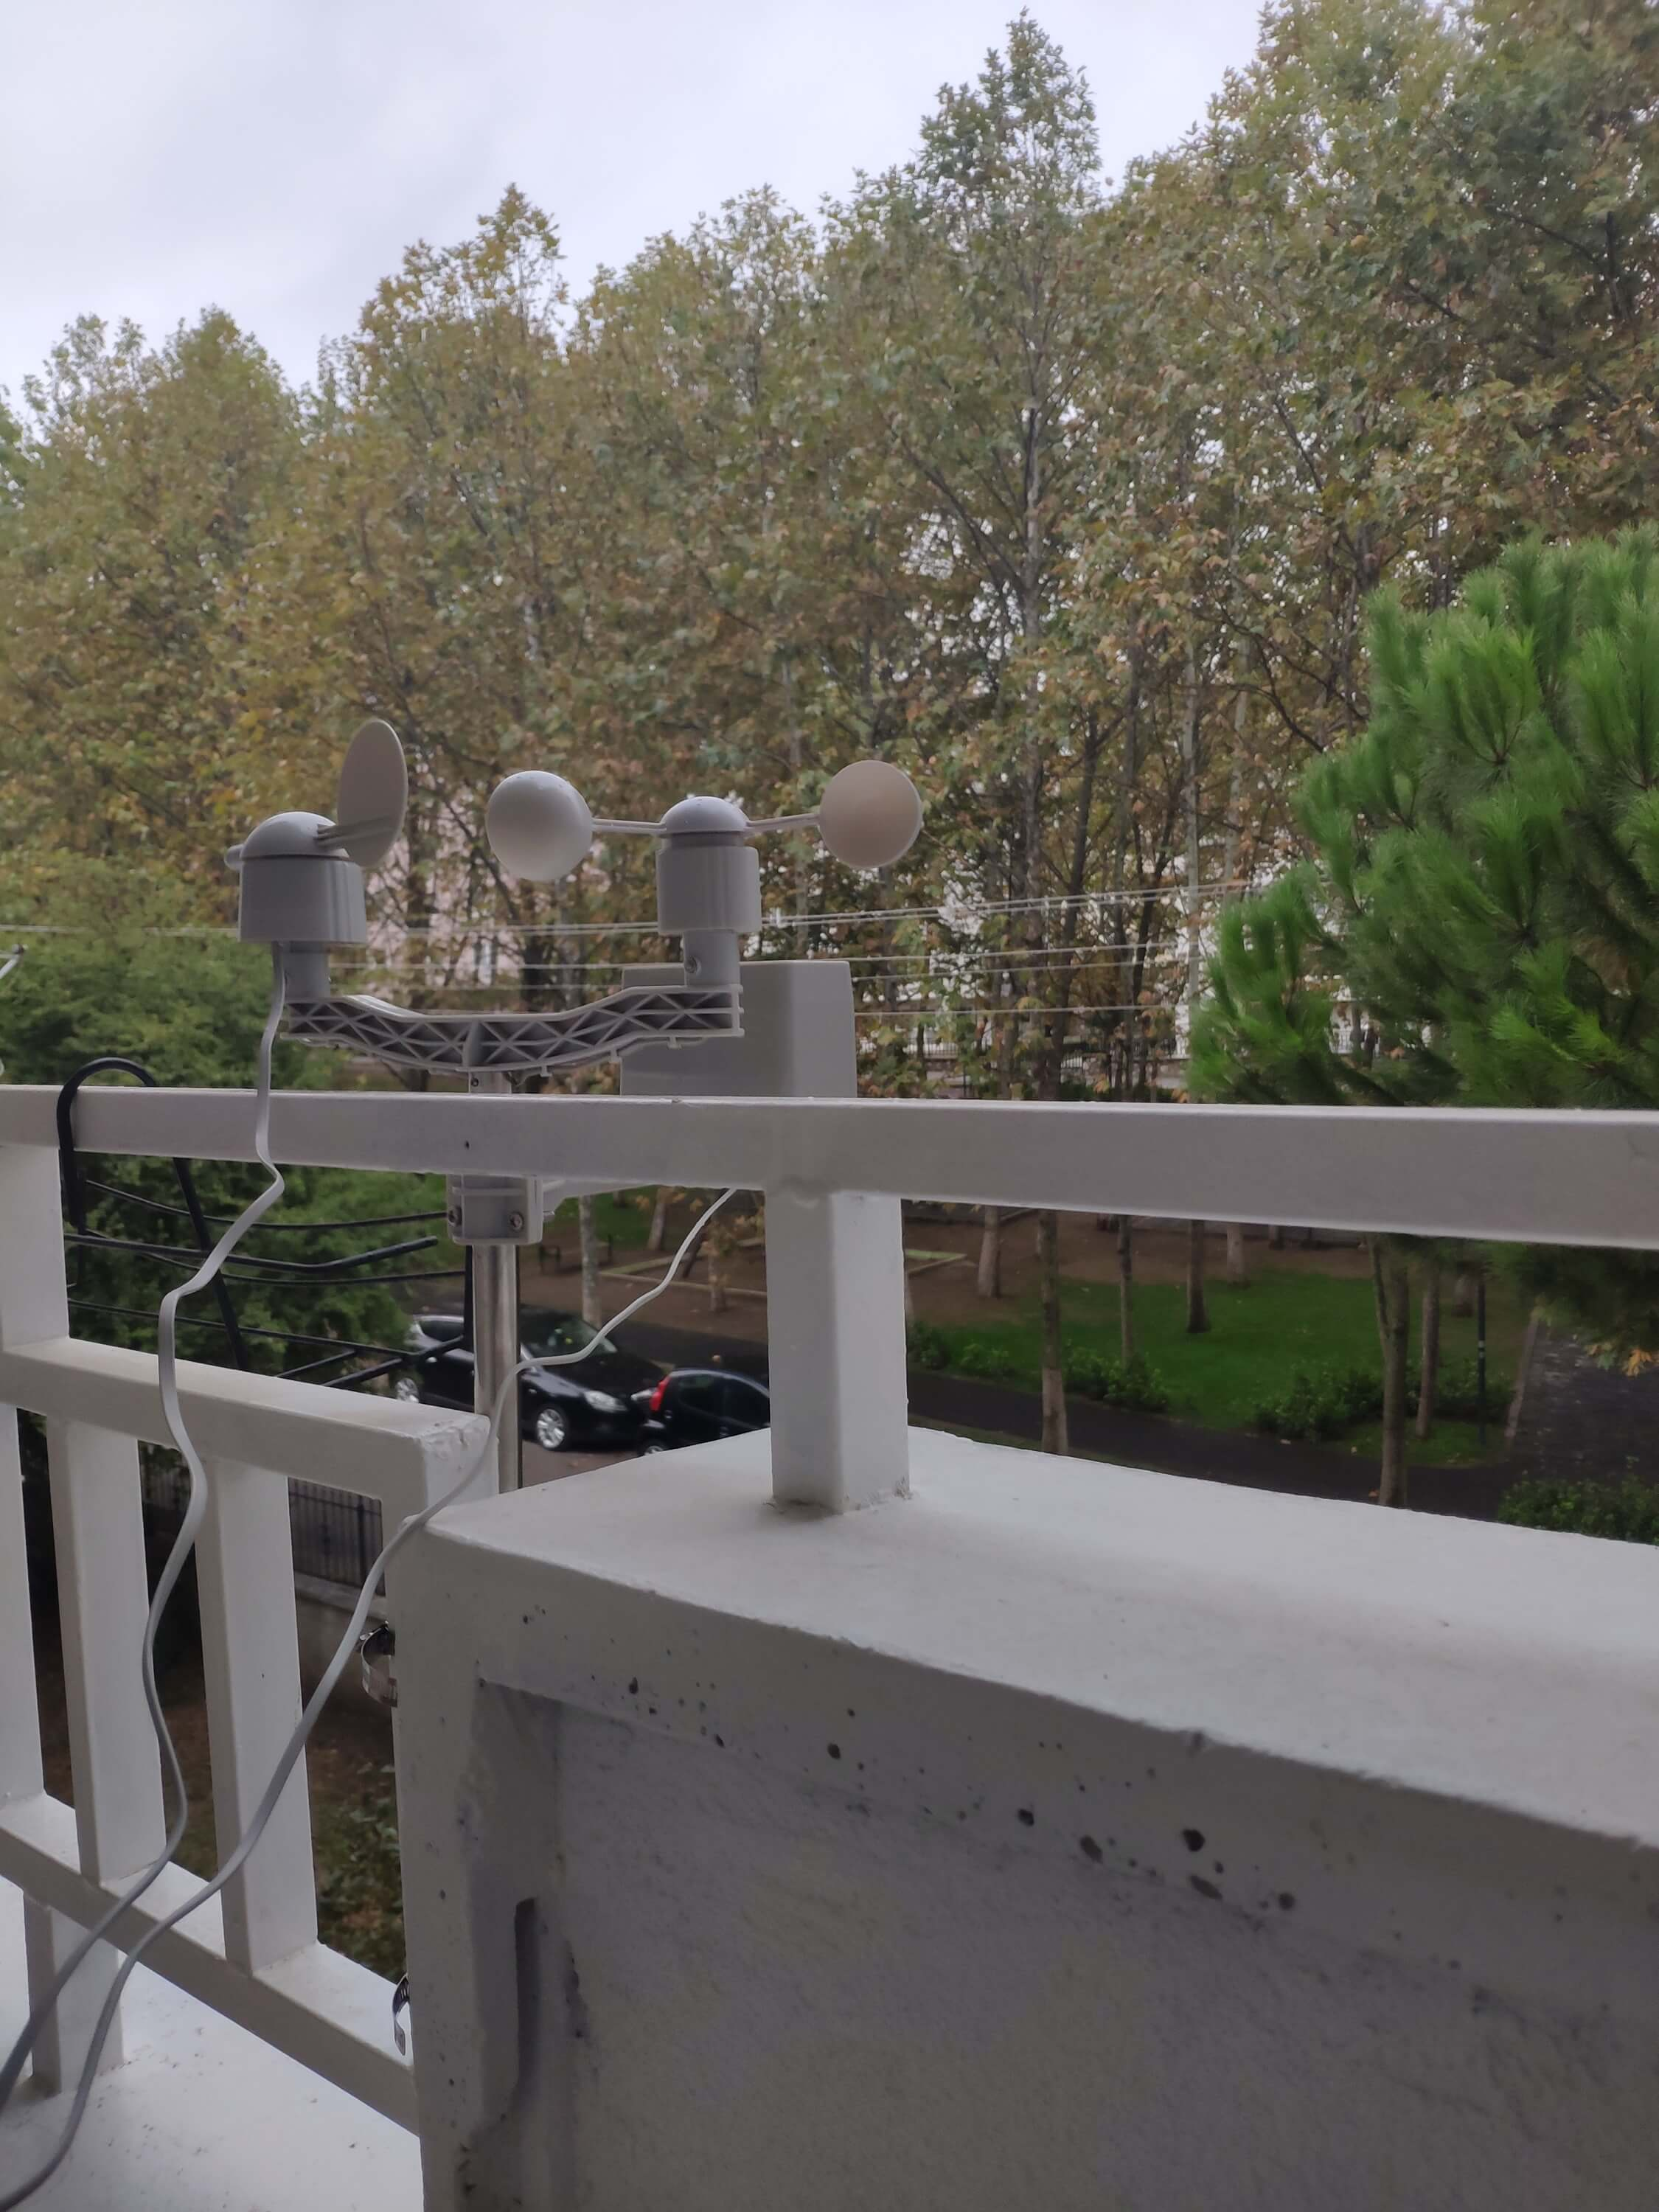
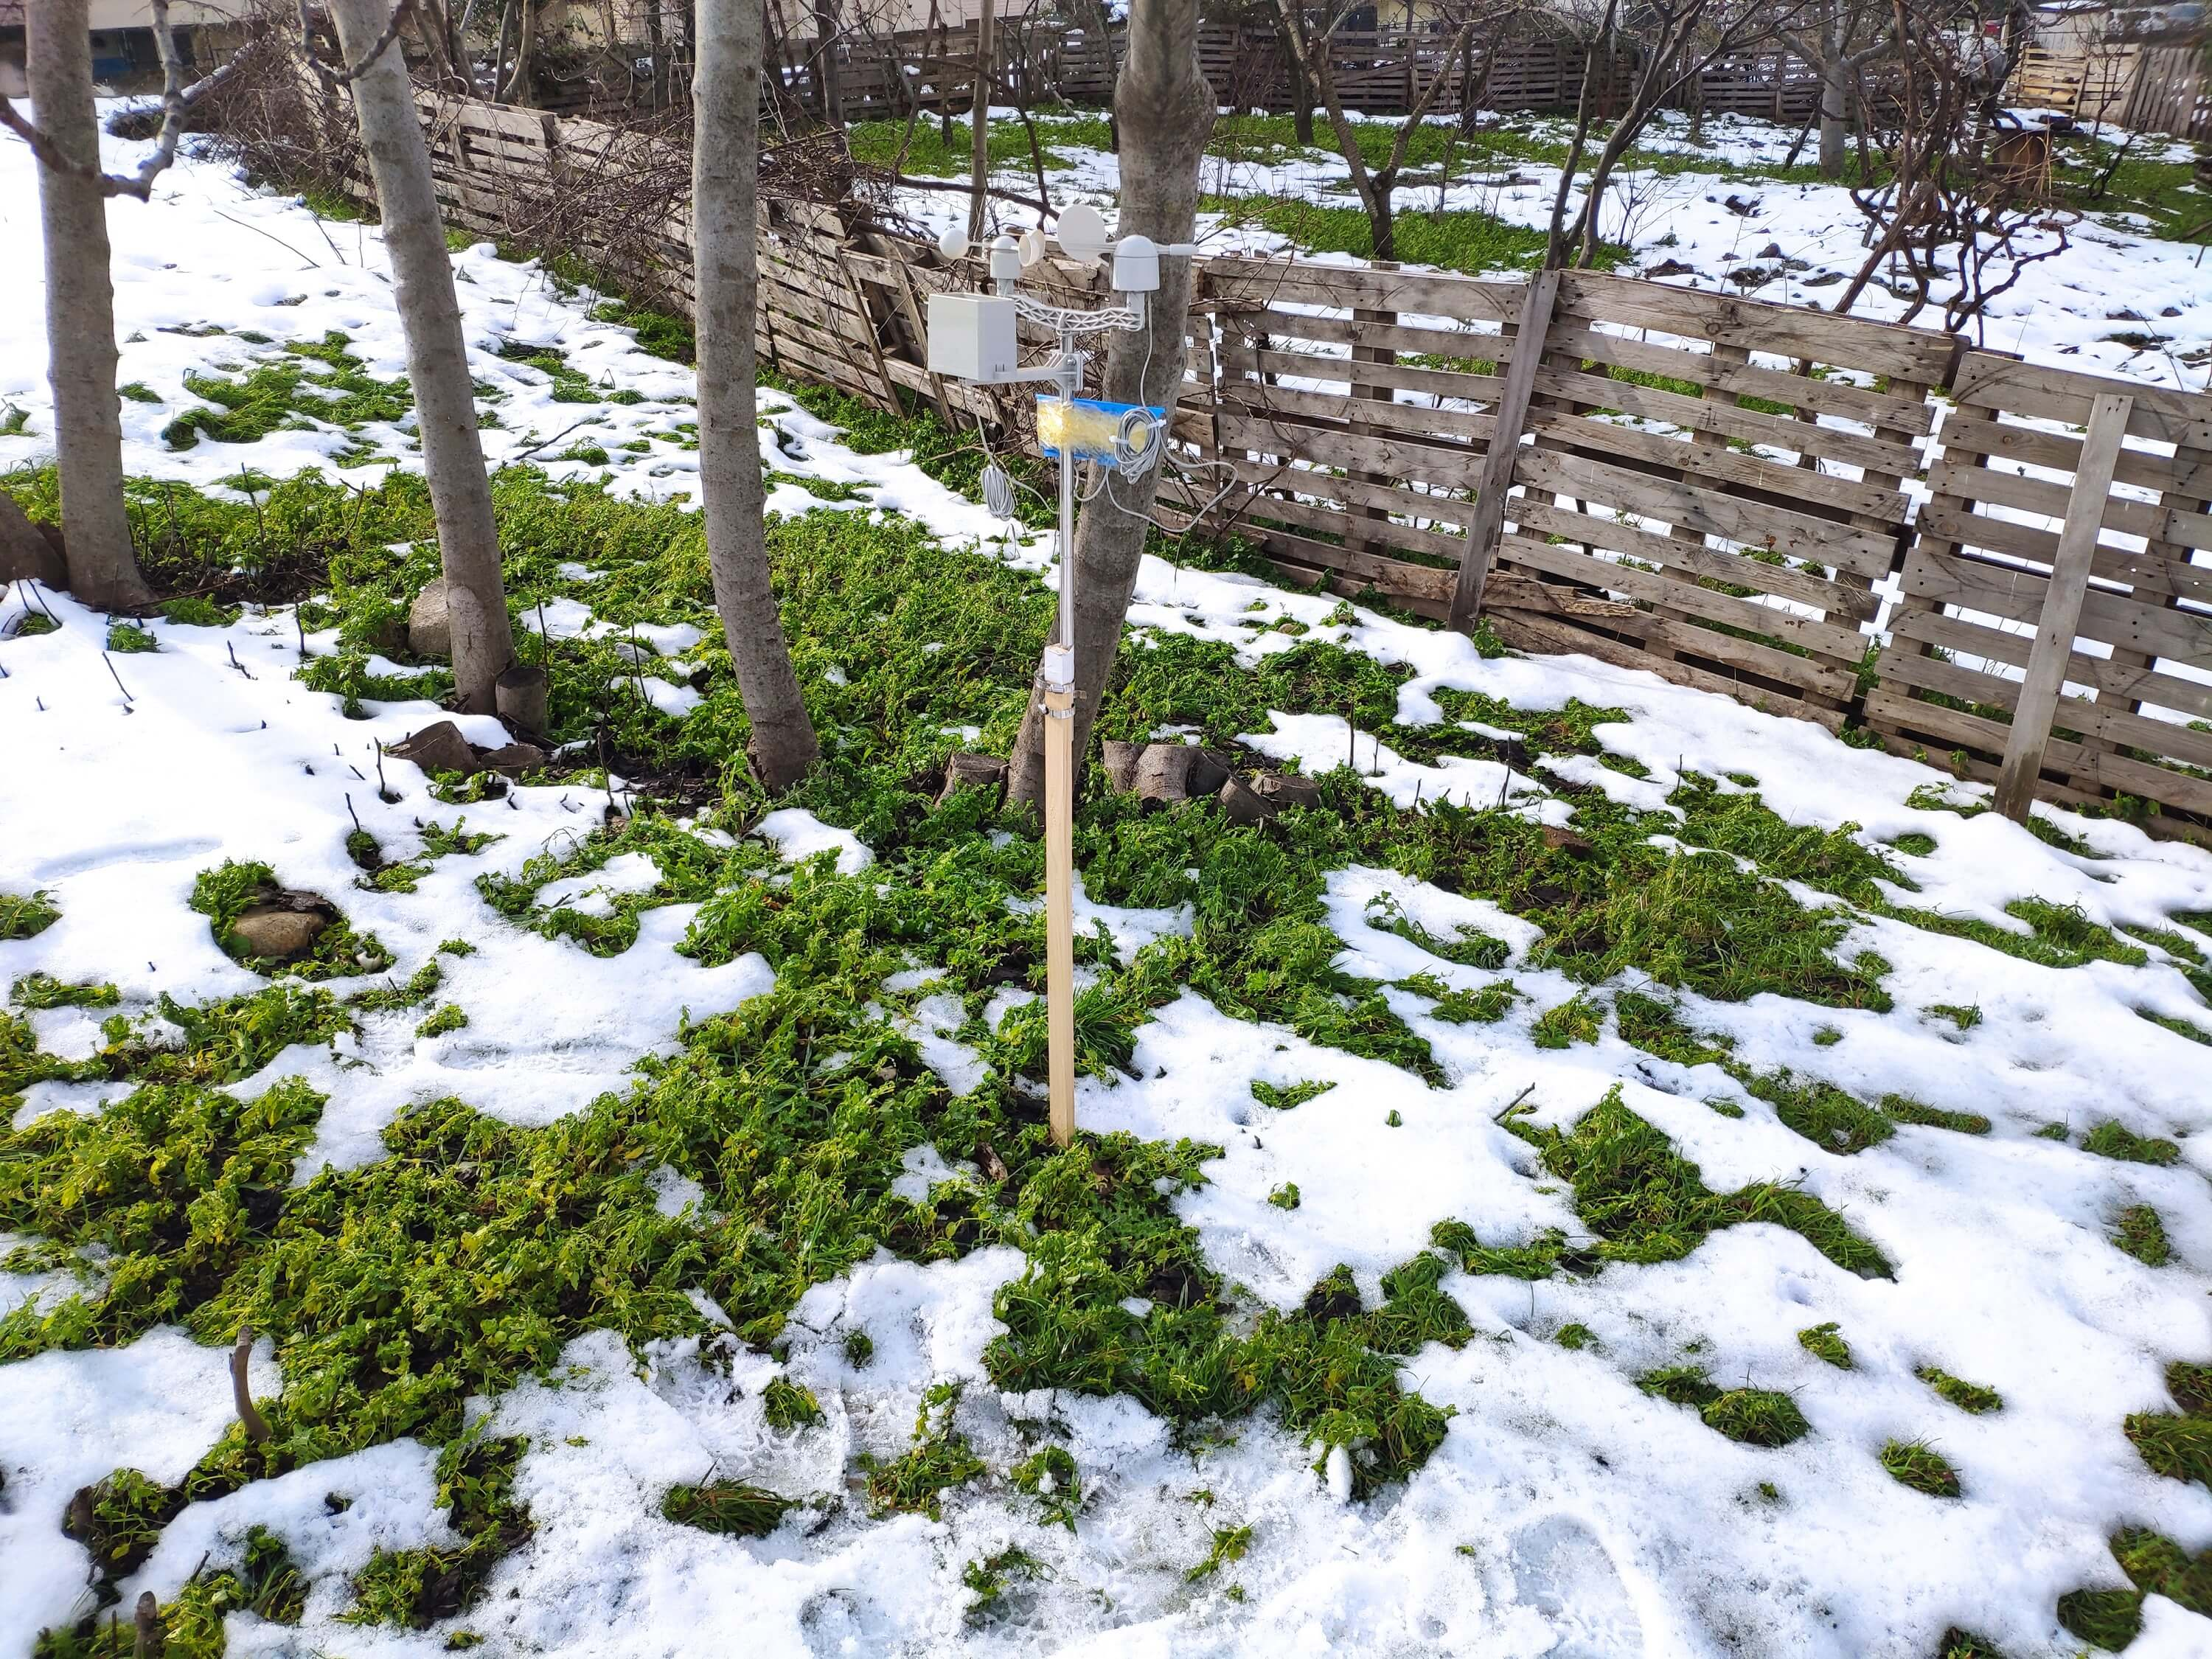
在构建和测试我的神经网络模型之前,我在我的阳台和后院以三公里为半径收集了三个多月的天气数据,以创建一个本地天气数据集,显示我附近的天气信息。为了即使在极端天气条件下也能获取天气信息,我使用了带有风速计、风向标和雨桶的 DFRobot 气象站套件和两个不同的开发板:
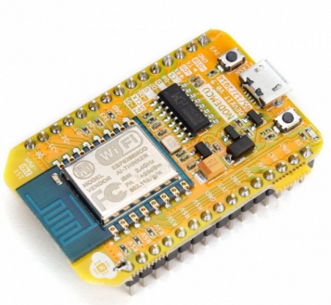
- NodeMCU ESP-12E(支持 WiFi)
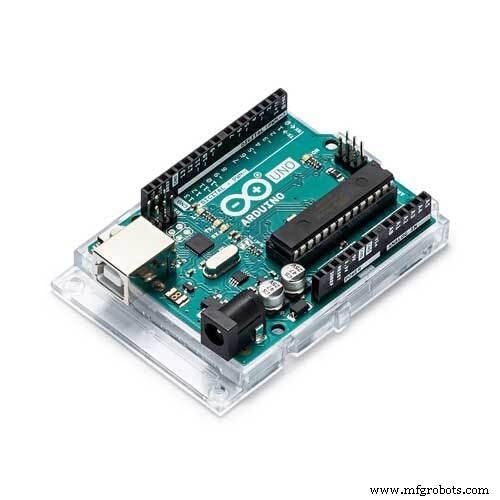
- Arduino Uno + DFRobot SIM808 GPS/GPRS/GSM Shield(启用GPRS)
因此,如果我的路由器和气象站之间的距离太远,我可以通过阳台上的 WiFi 或 GPRS 传输天气数据。
我决定使用基于云的电子表格程序 Google Sheets 来整理气象站生成的天气数据,因为使用 Google Sheets API 创建大数据集和附加新信息很简单。因此,我用 PHP 开发了一个 Web 应用程序,以获取开发板传输的天气数据并将其附加到 Google Sheets 上的电子表格中。
在每五分钟完成三个月以上的天气数据收集后,我用 TensorFlow 构建了一个人工神经网络 (ANN) 模型来对降雨强度进行预测。从理论上讲,在对数据集进行缩放和归一化之后,我为每个读数分配了一个降雨强度等级。然后,我训练神经网络模型对这些类进行分类:
- 无降雨
- 小雨
- 中雨
- 强降雨
- 猛烈降雨
所以,简而言之,这就是我的项目😃
在以下步骤中,您可以找到有关编码、本地天气数据收集以及使用 TensorFlow 构建人工神经网络 (ANN) 模型的更多详细信息。
非常感谢DFRobot赞助这个项目。
DFRobot 赞助的产品:
⭐ 带风速计/风向标/雨桶的气象站套件|检查
⭐ SIM808 GPS/GPRS/GSM Shield For Arduino |检查
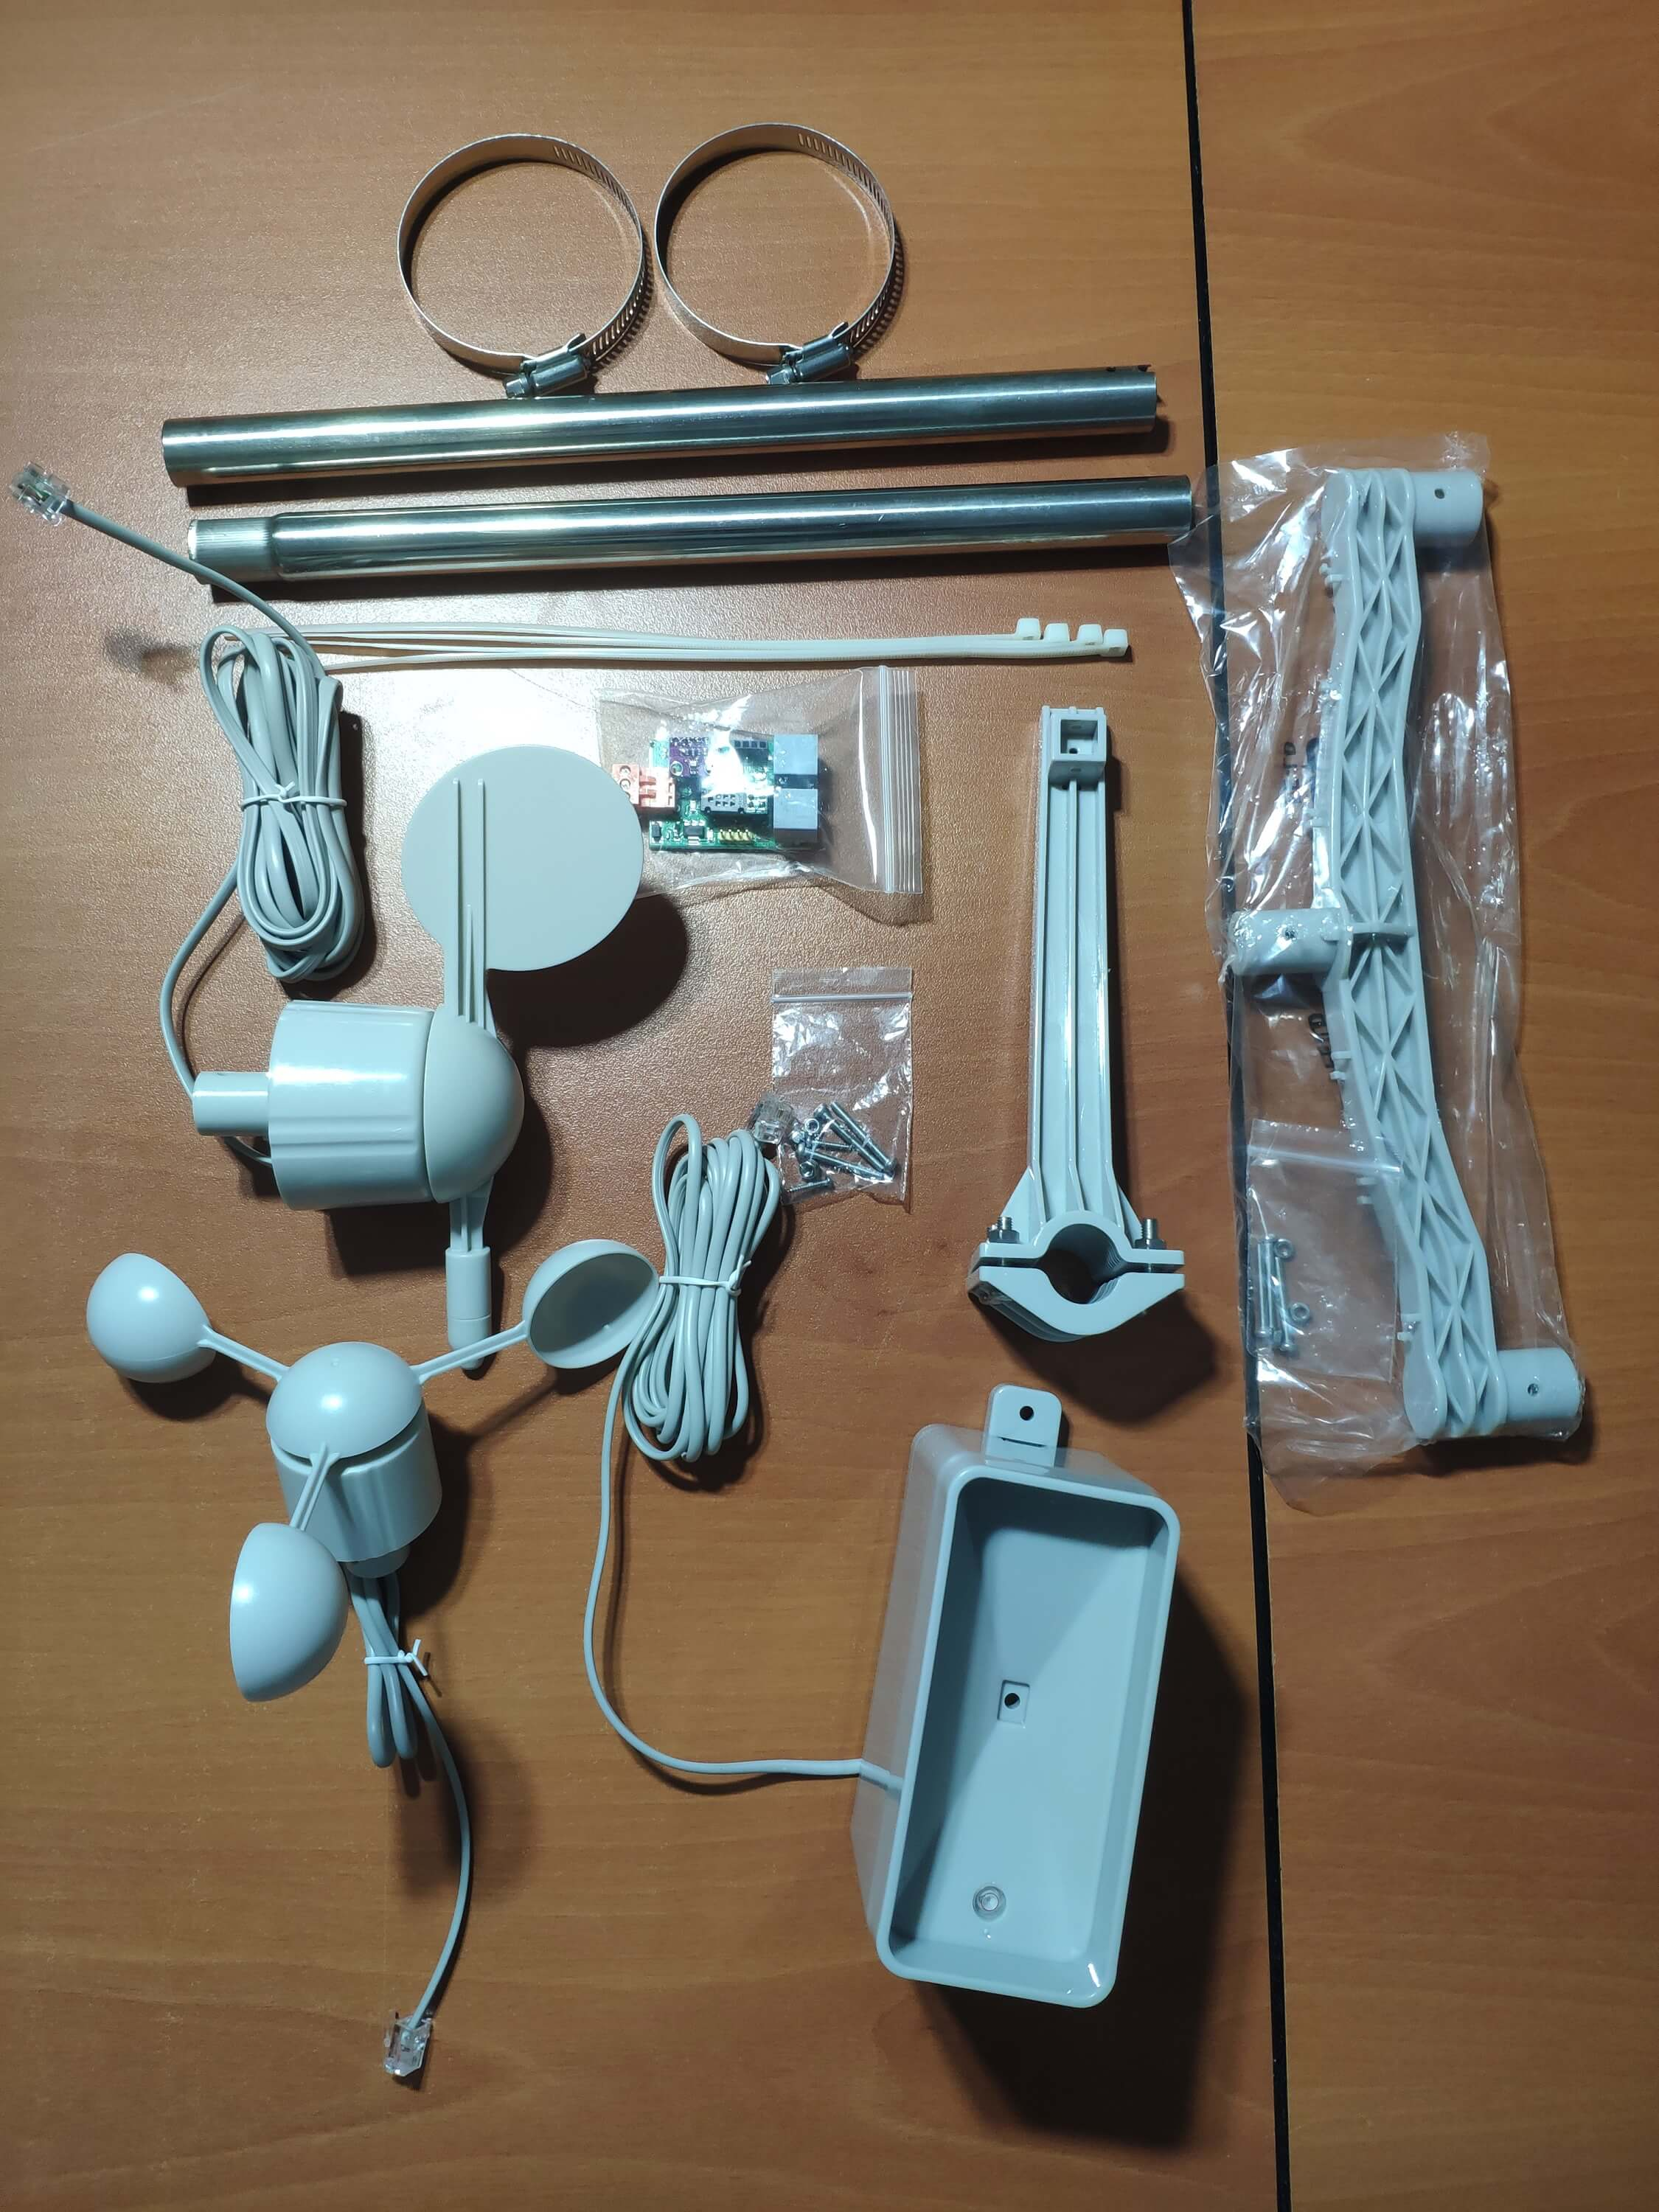
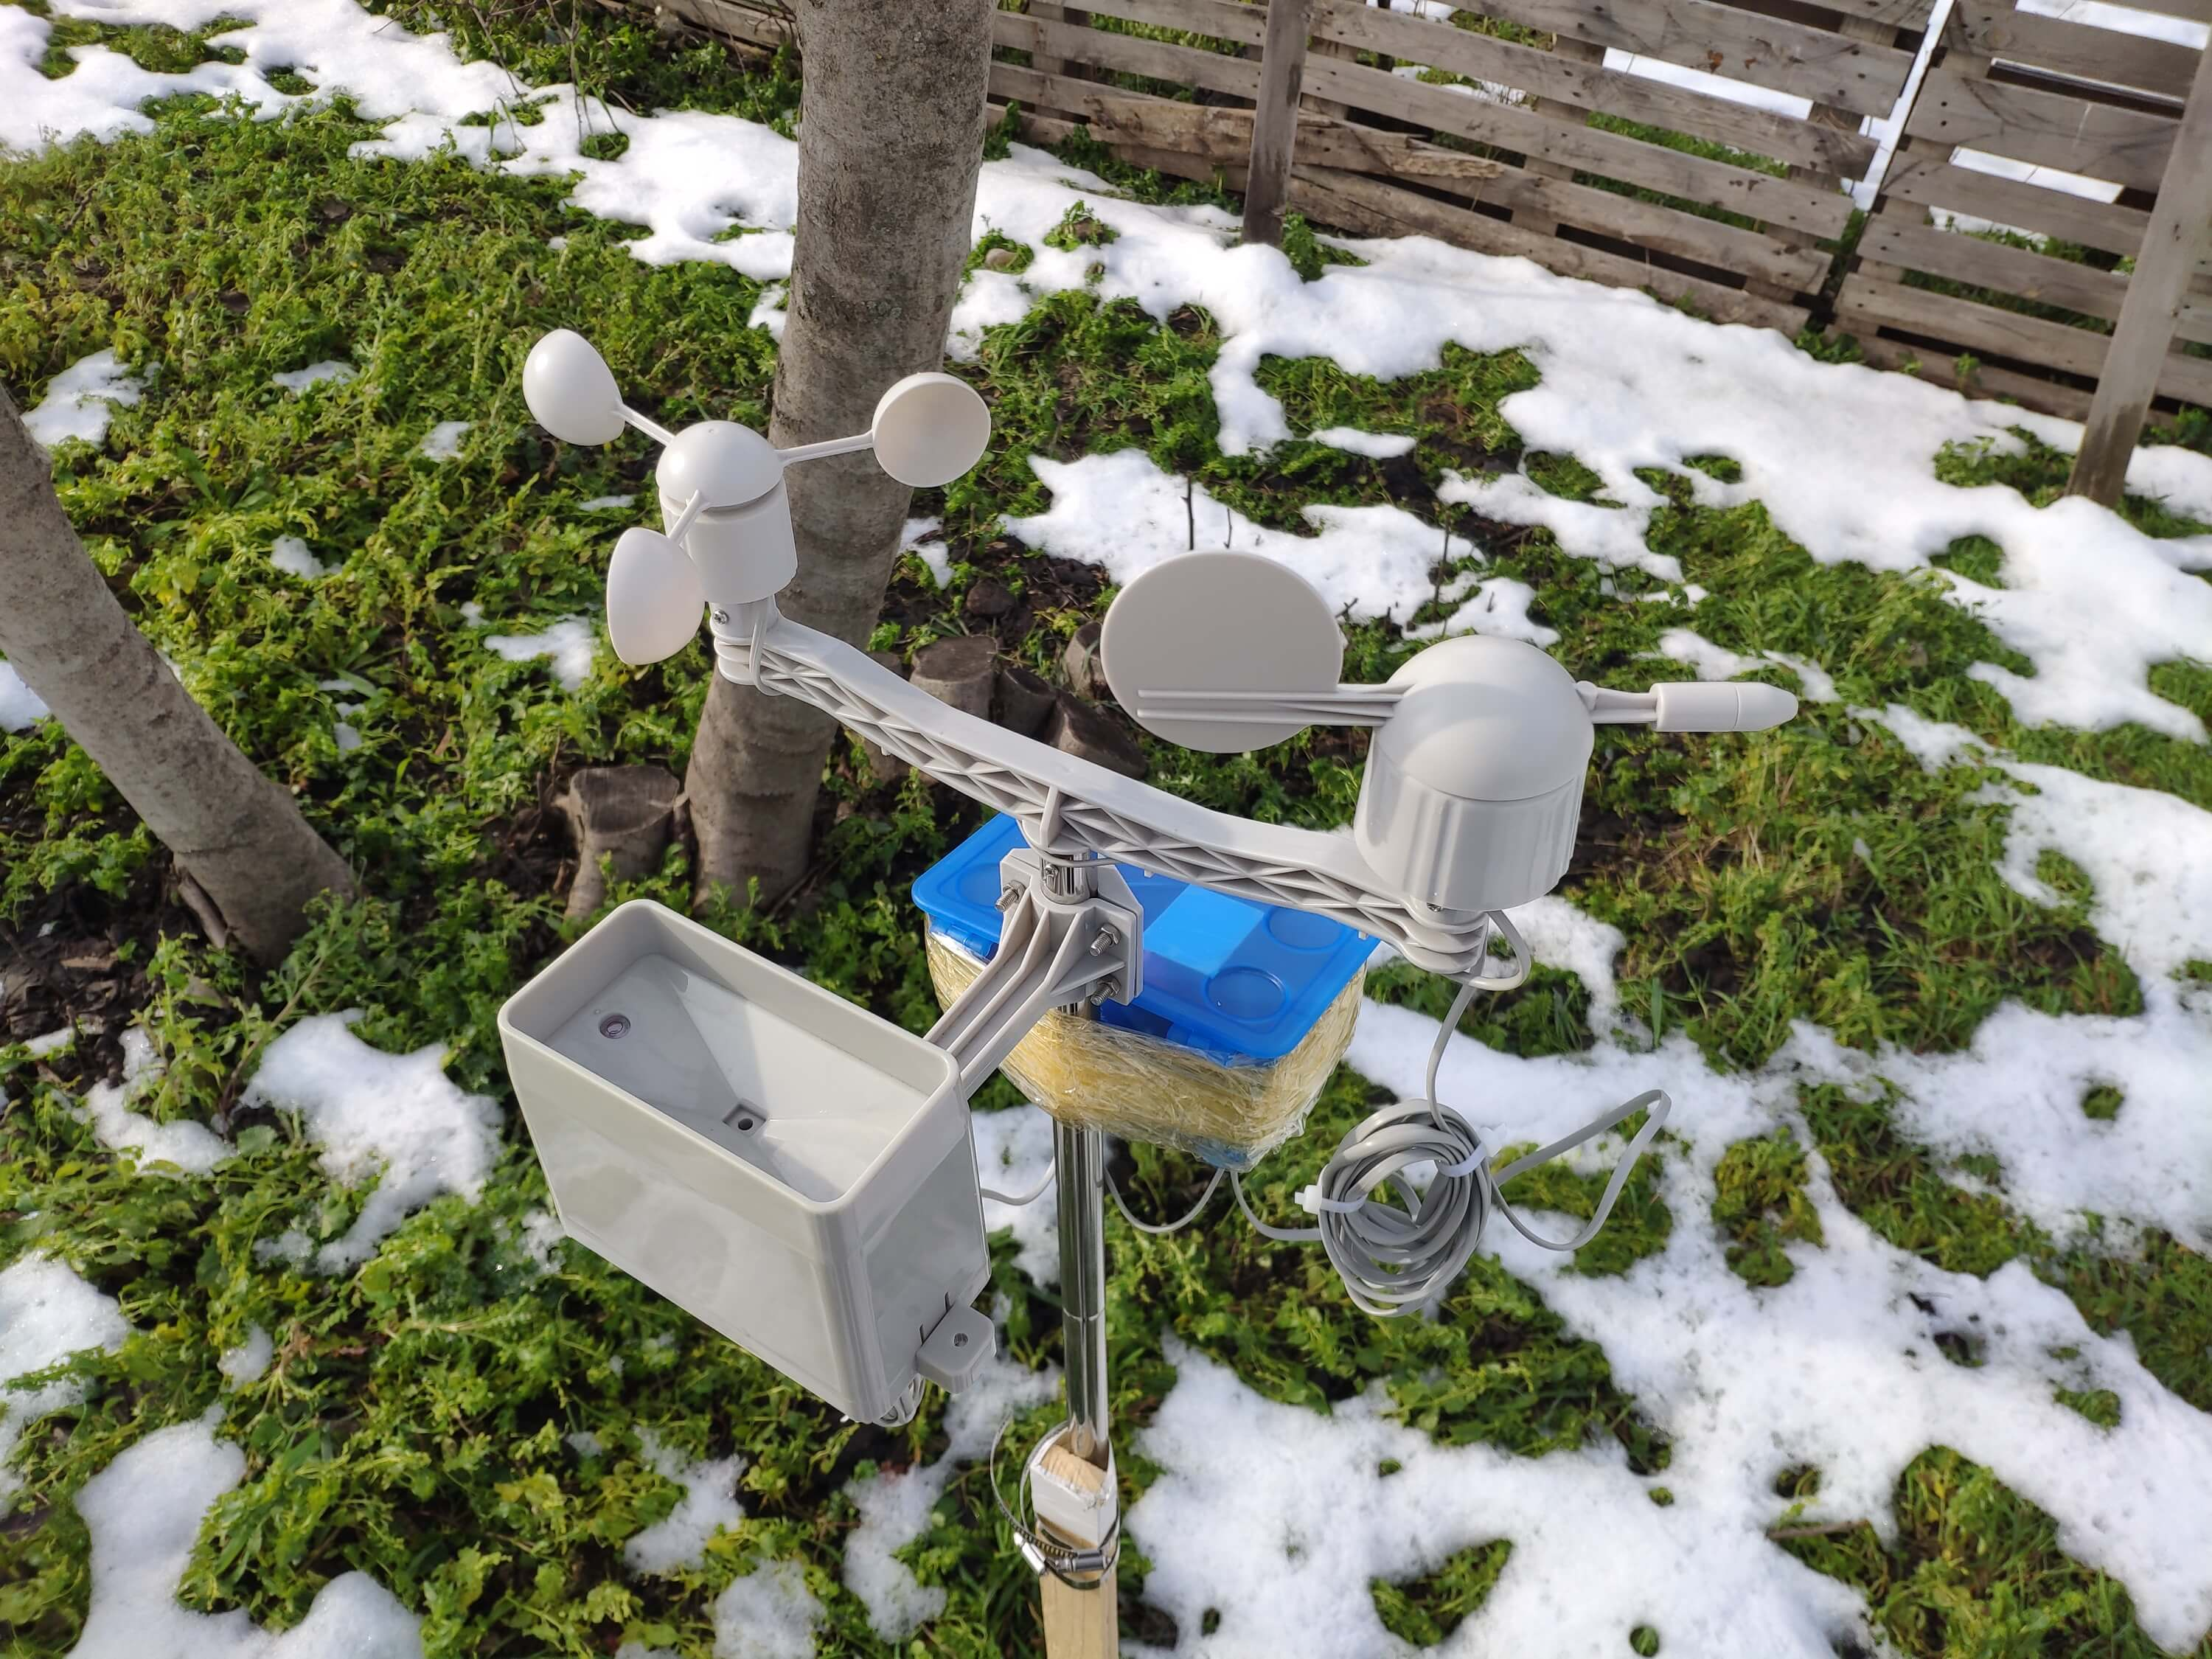
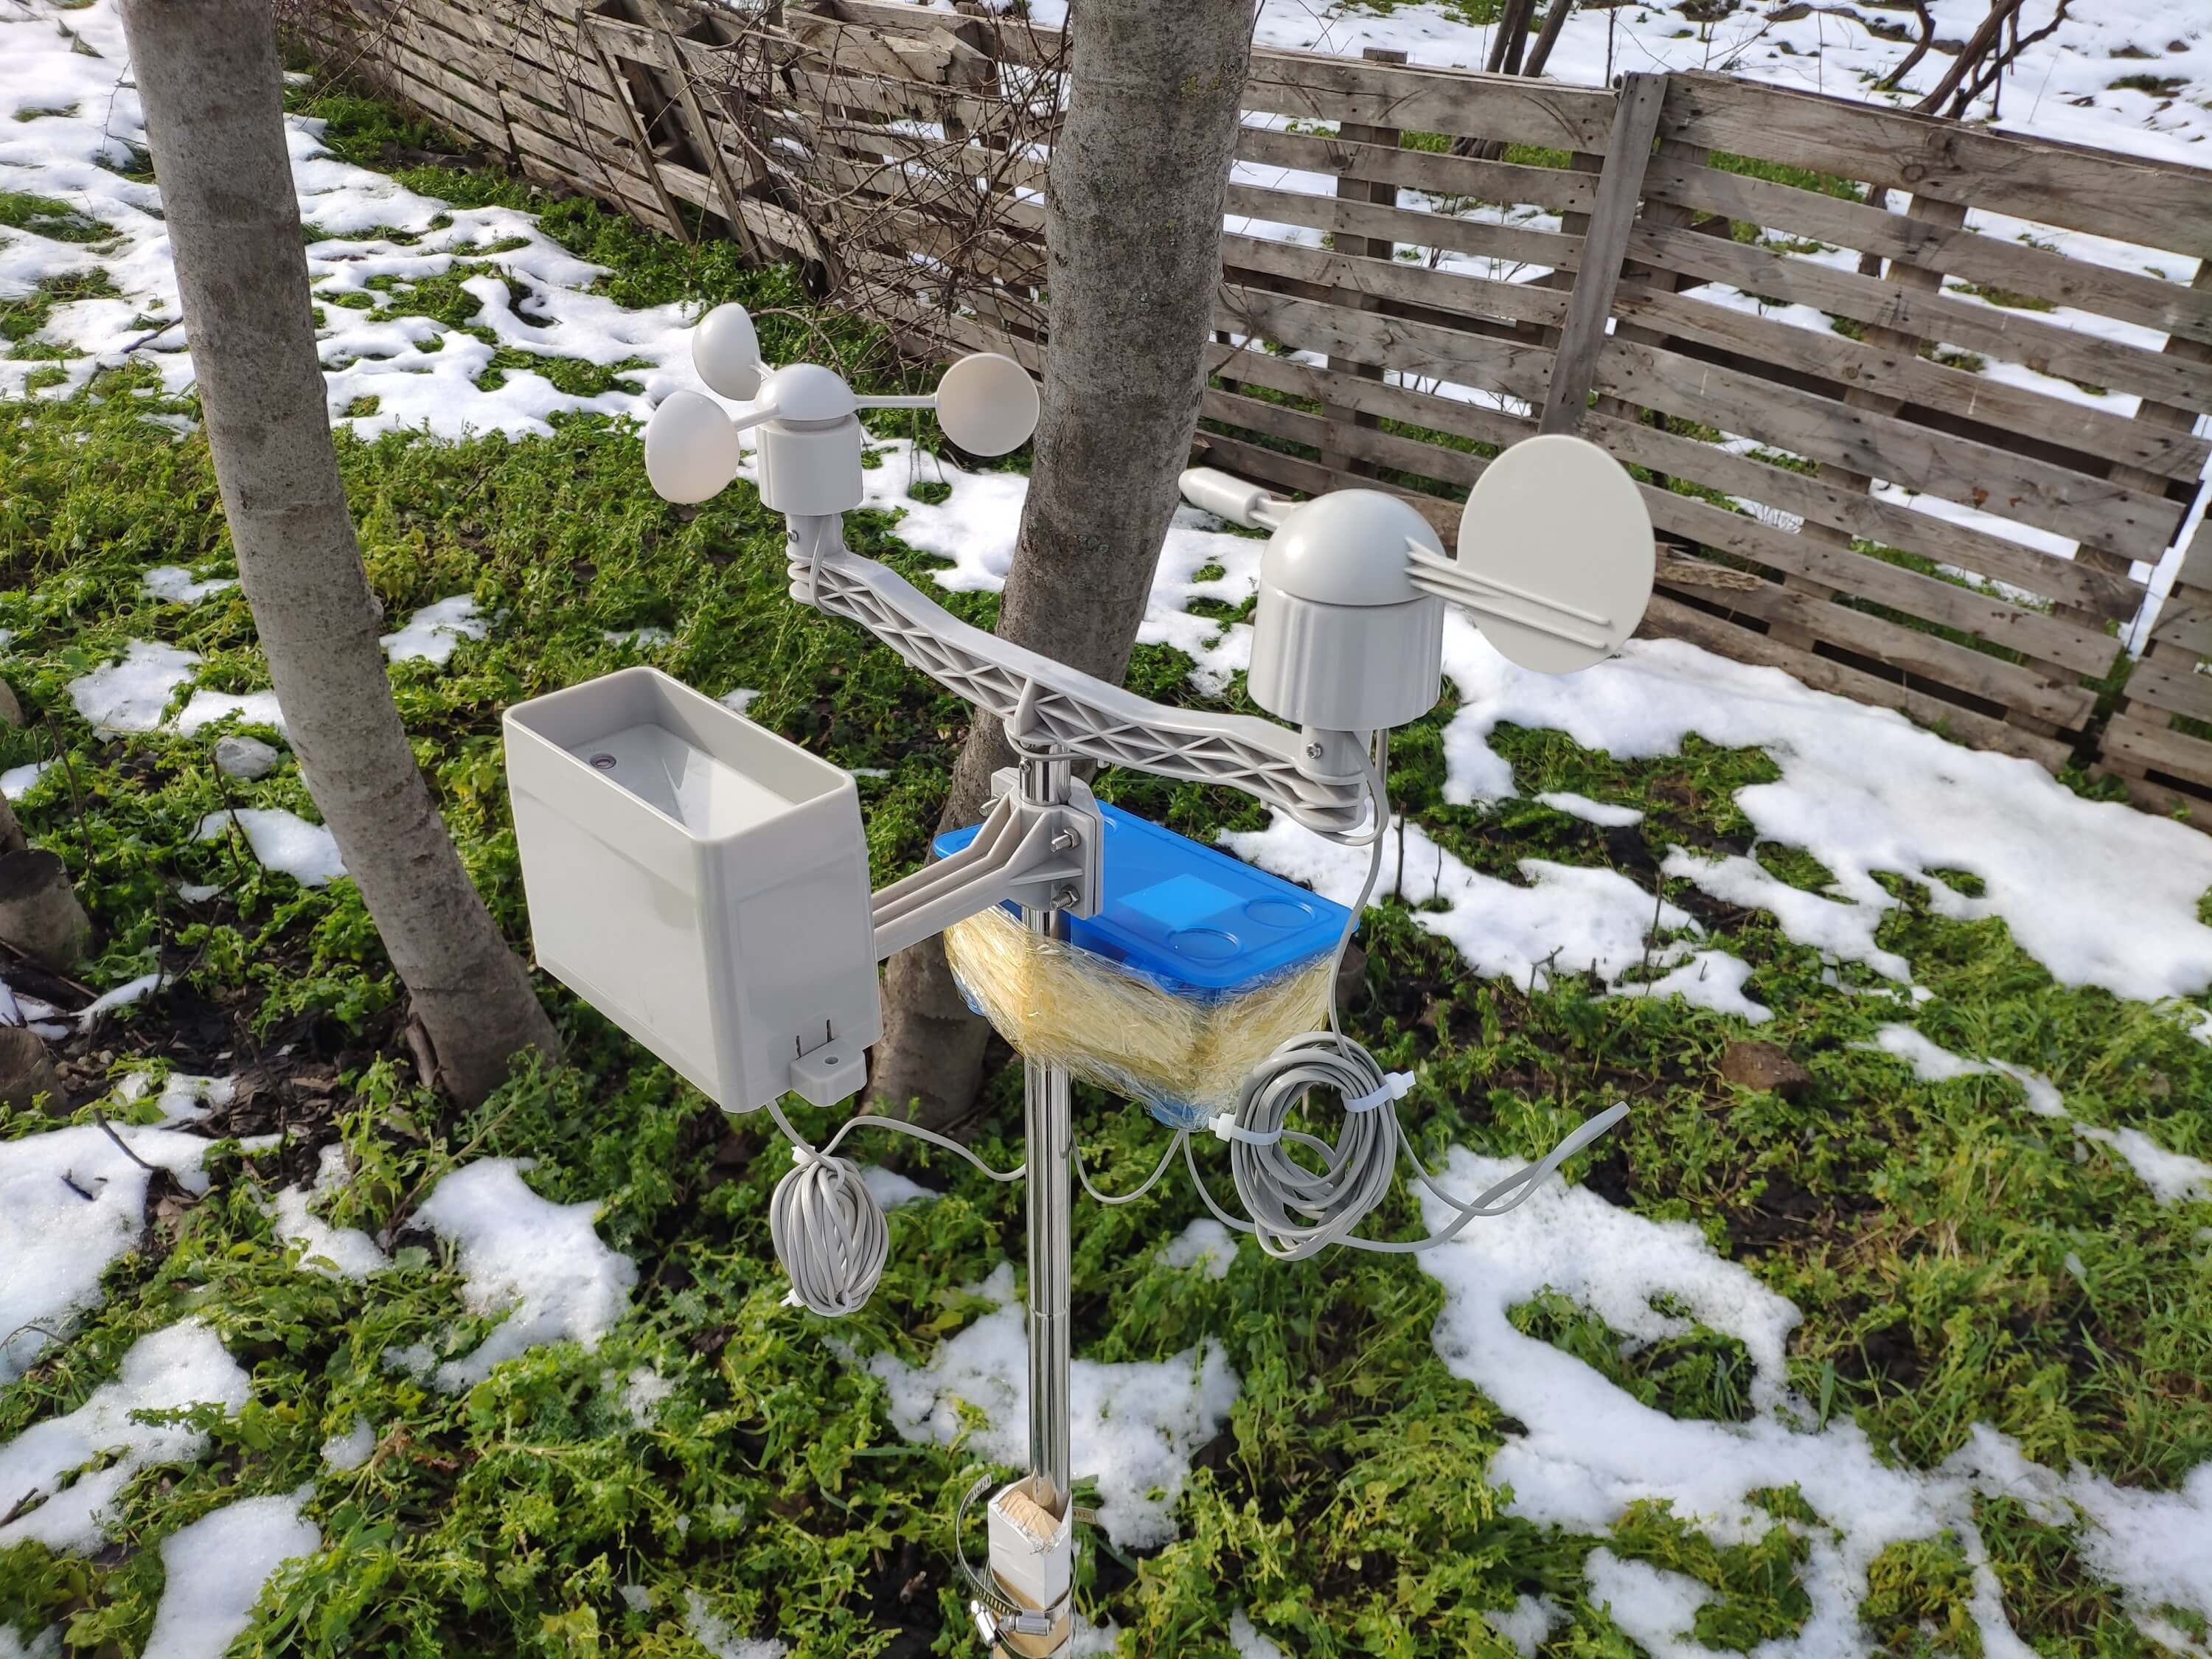
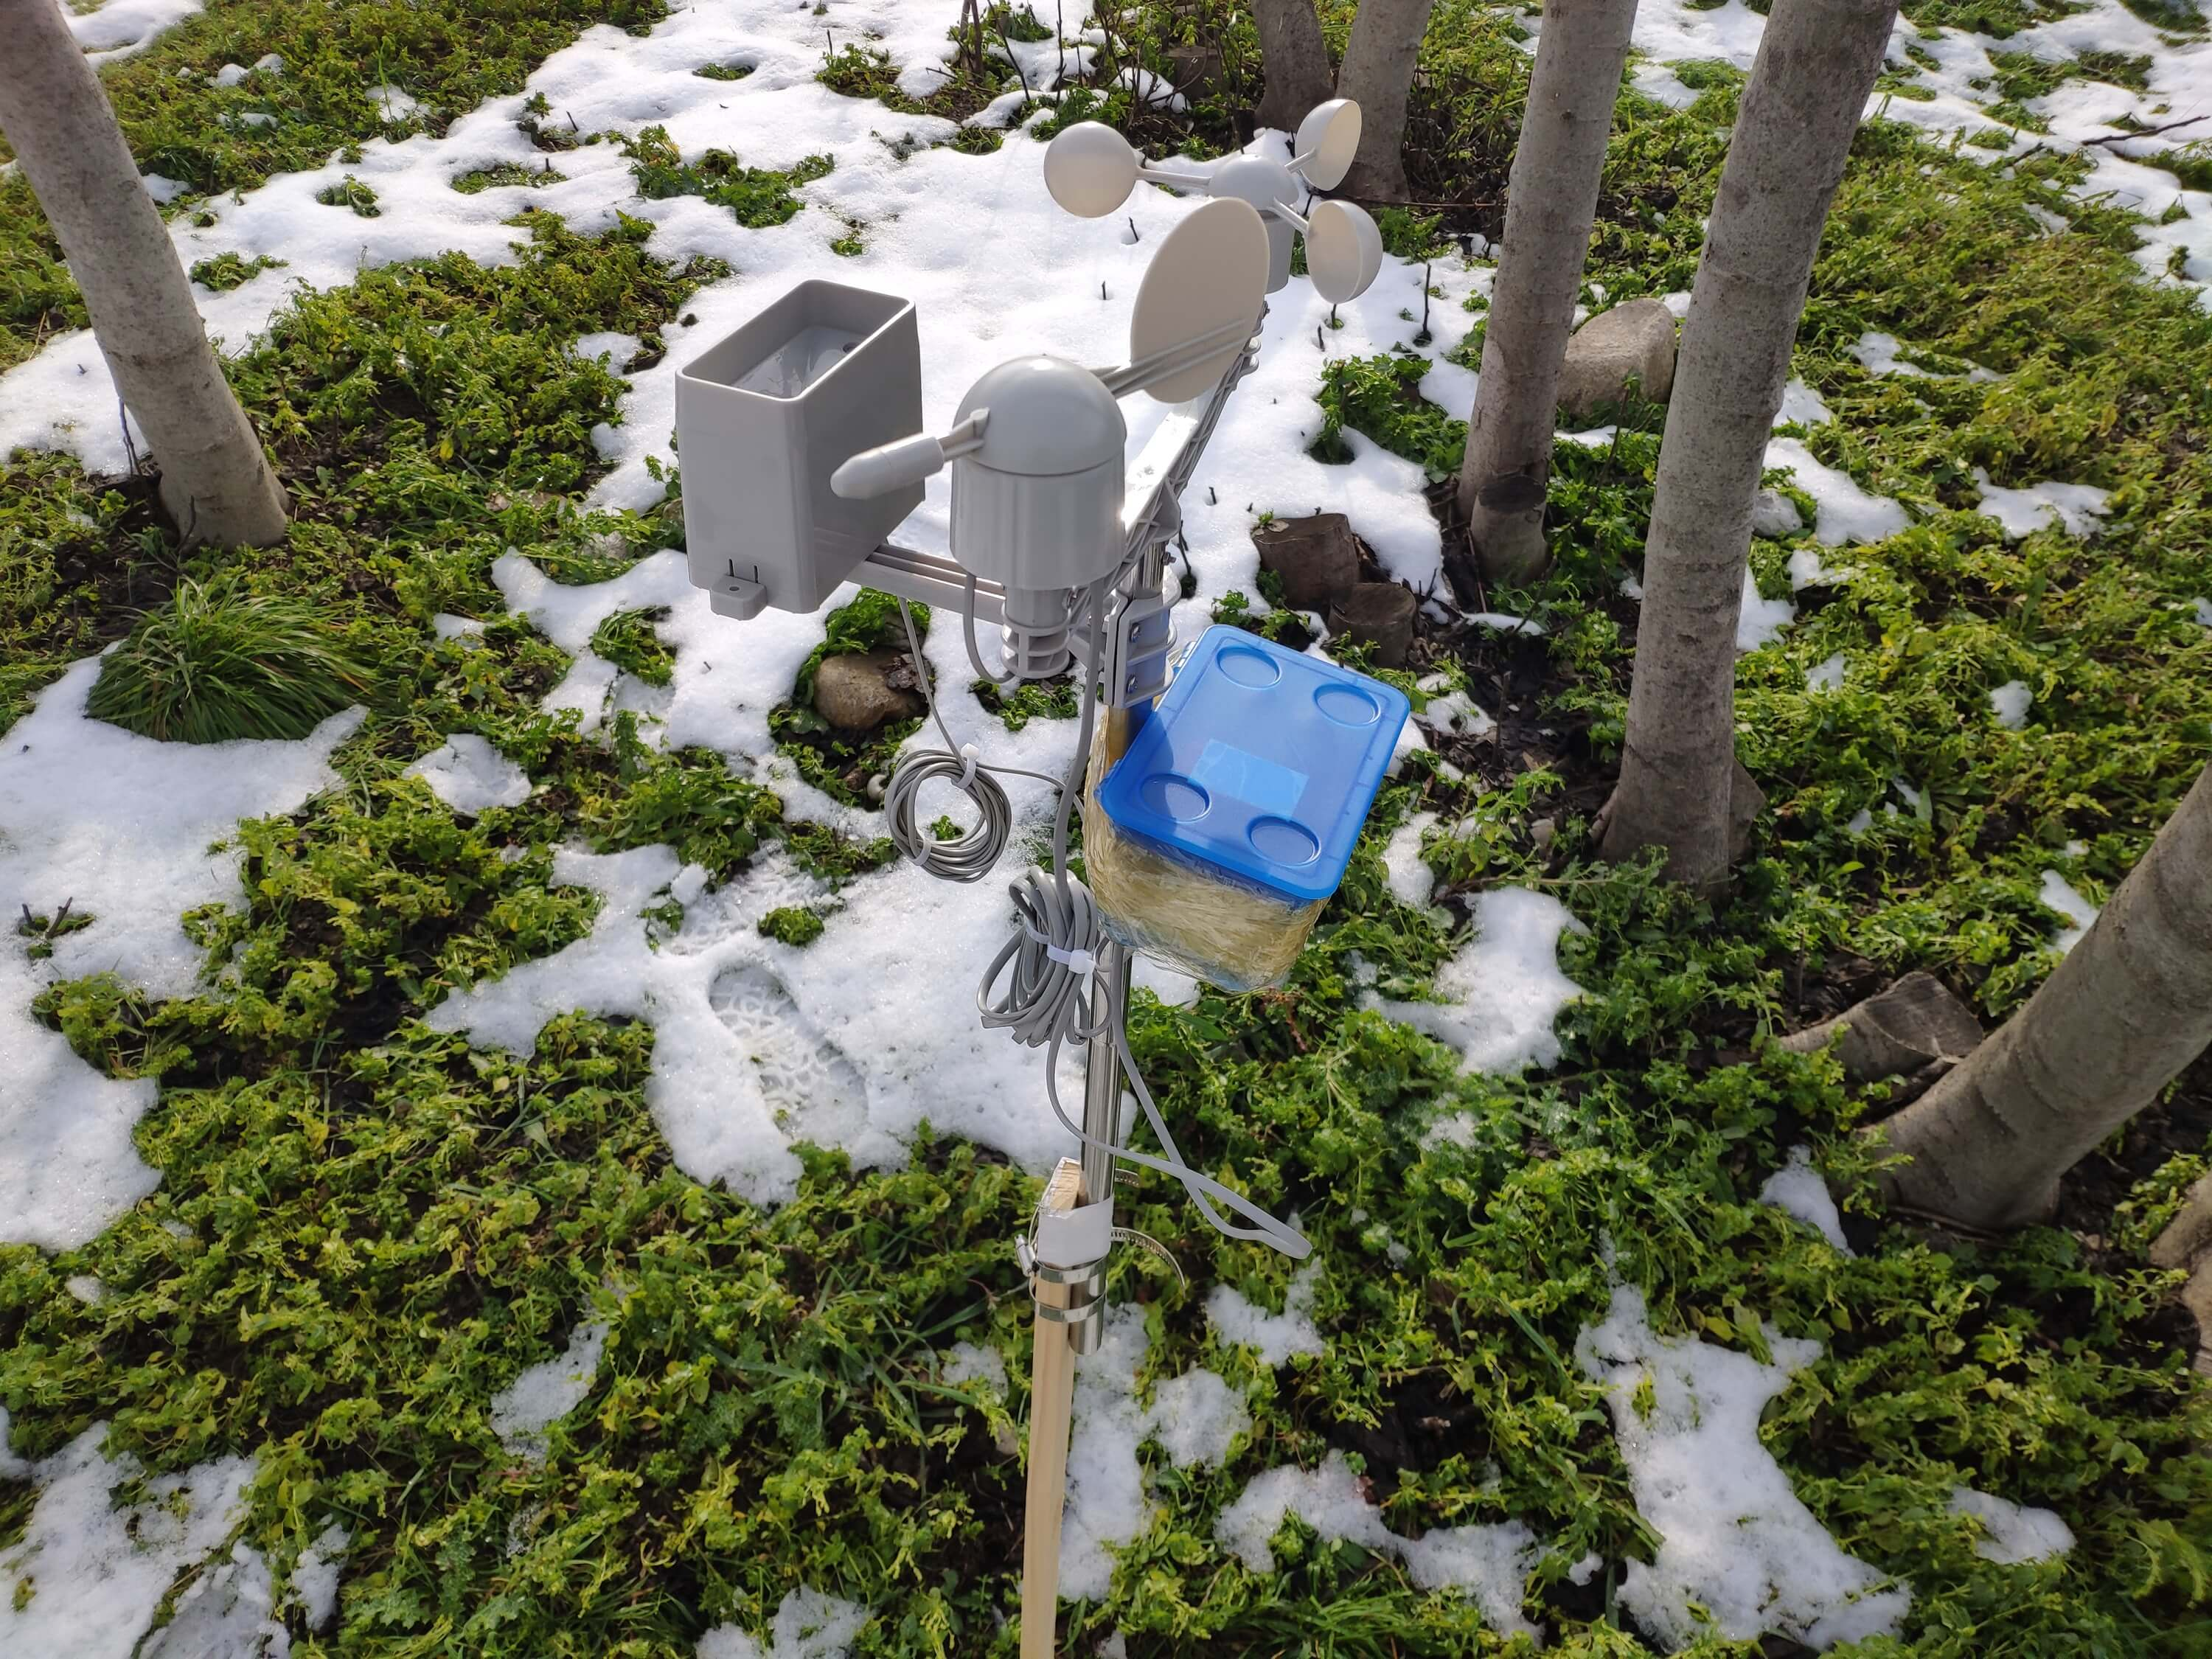
步骤 1:使用风速计、风向标和雨桶组装气象站套件
该气象站套件包括风速计、风藤、雨桶和传感器板,用于通过串行通信协议发送天气数据。因此,可以很容易地与开发板一起使用来收集当地的天气数据。
它每秒输出 37 个字节,包括结束 CR/LF .
c000s000g000t086r000p000h53b10020 数据解析器:
- c000 : 风向,度数
- s000 : 空速(平均),每小时 0.1 英里
- g000 : 空速(最大),每小时 0.1 英里
- t086 : 温度,华氏度
- r000 :降雨量(1小时),0.01英寸
- p000 :降雨量(24小时),0.01英寸
- h53 : 湿度,% (00%=100)
- b10020 : 大气,0.1 hPa
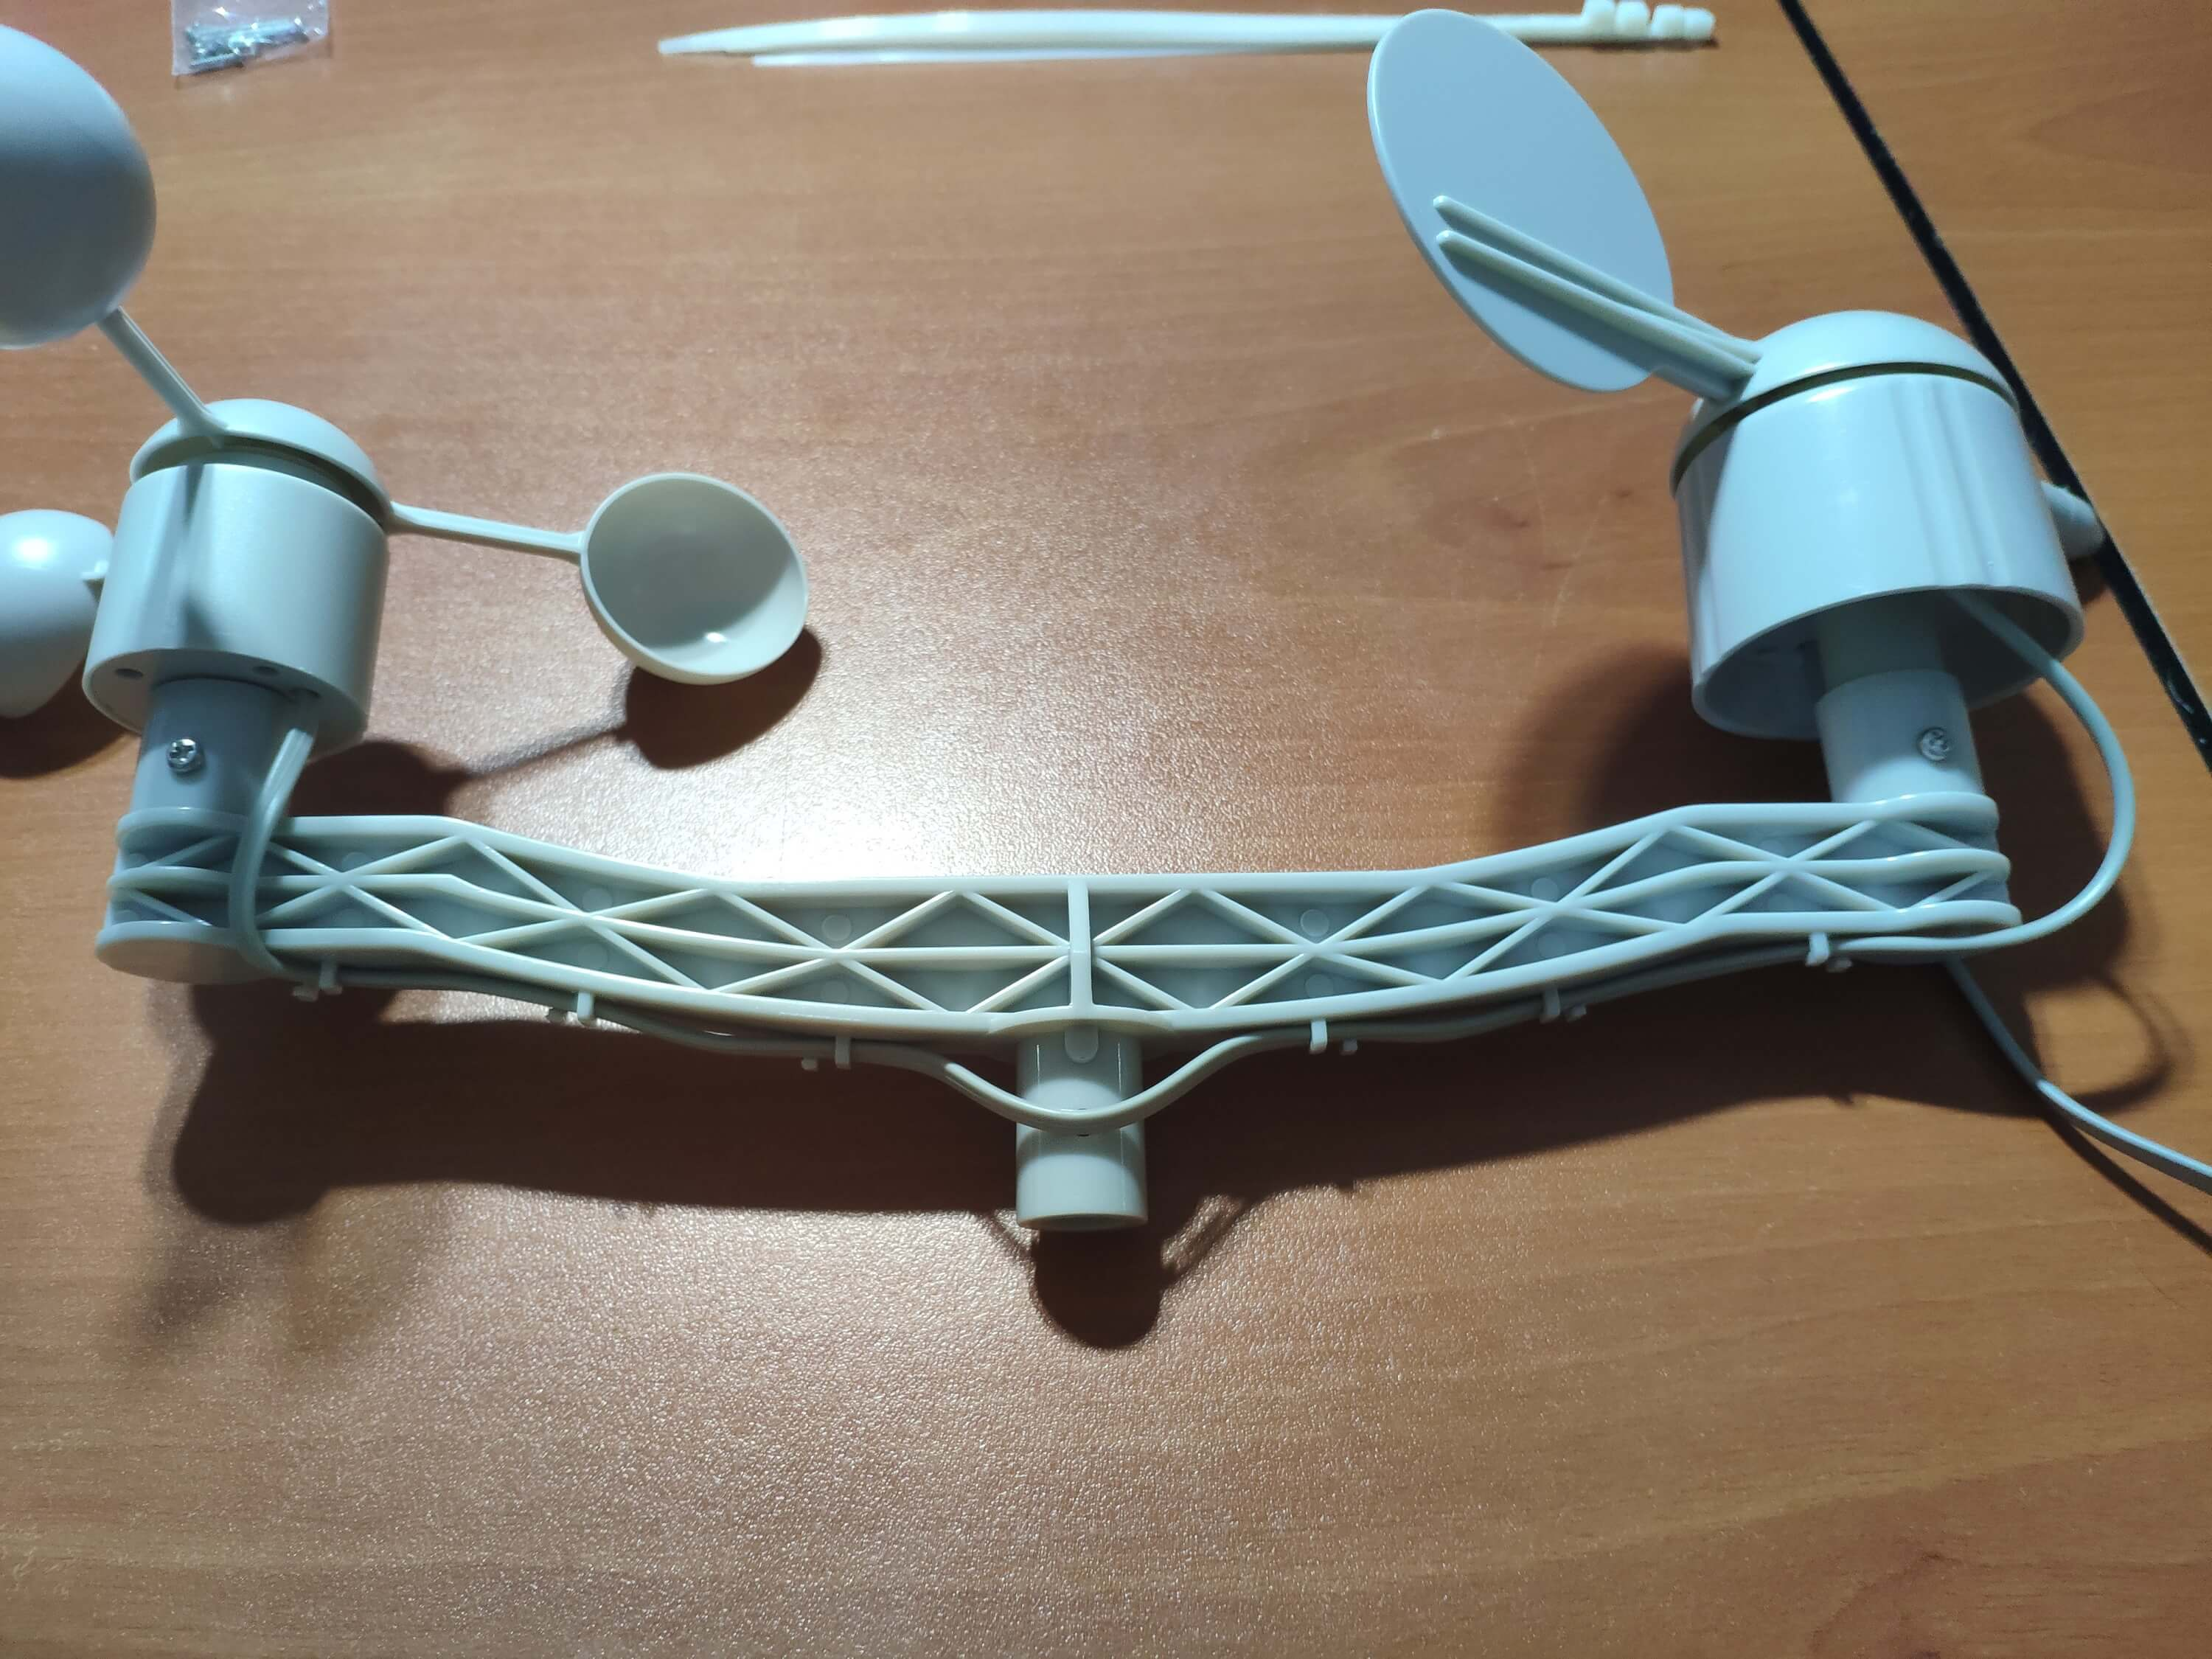
⭐首先,用螺丝和螺母将风速计和风向标固定在桥上。
⭐使用RJ11电话线将风向标连接到风速计并在桥下拧紧。
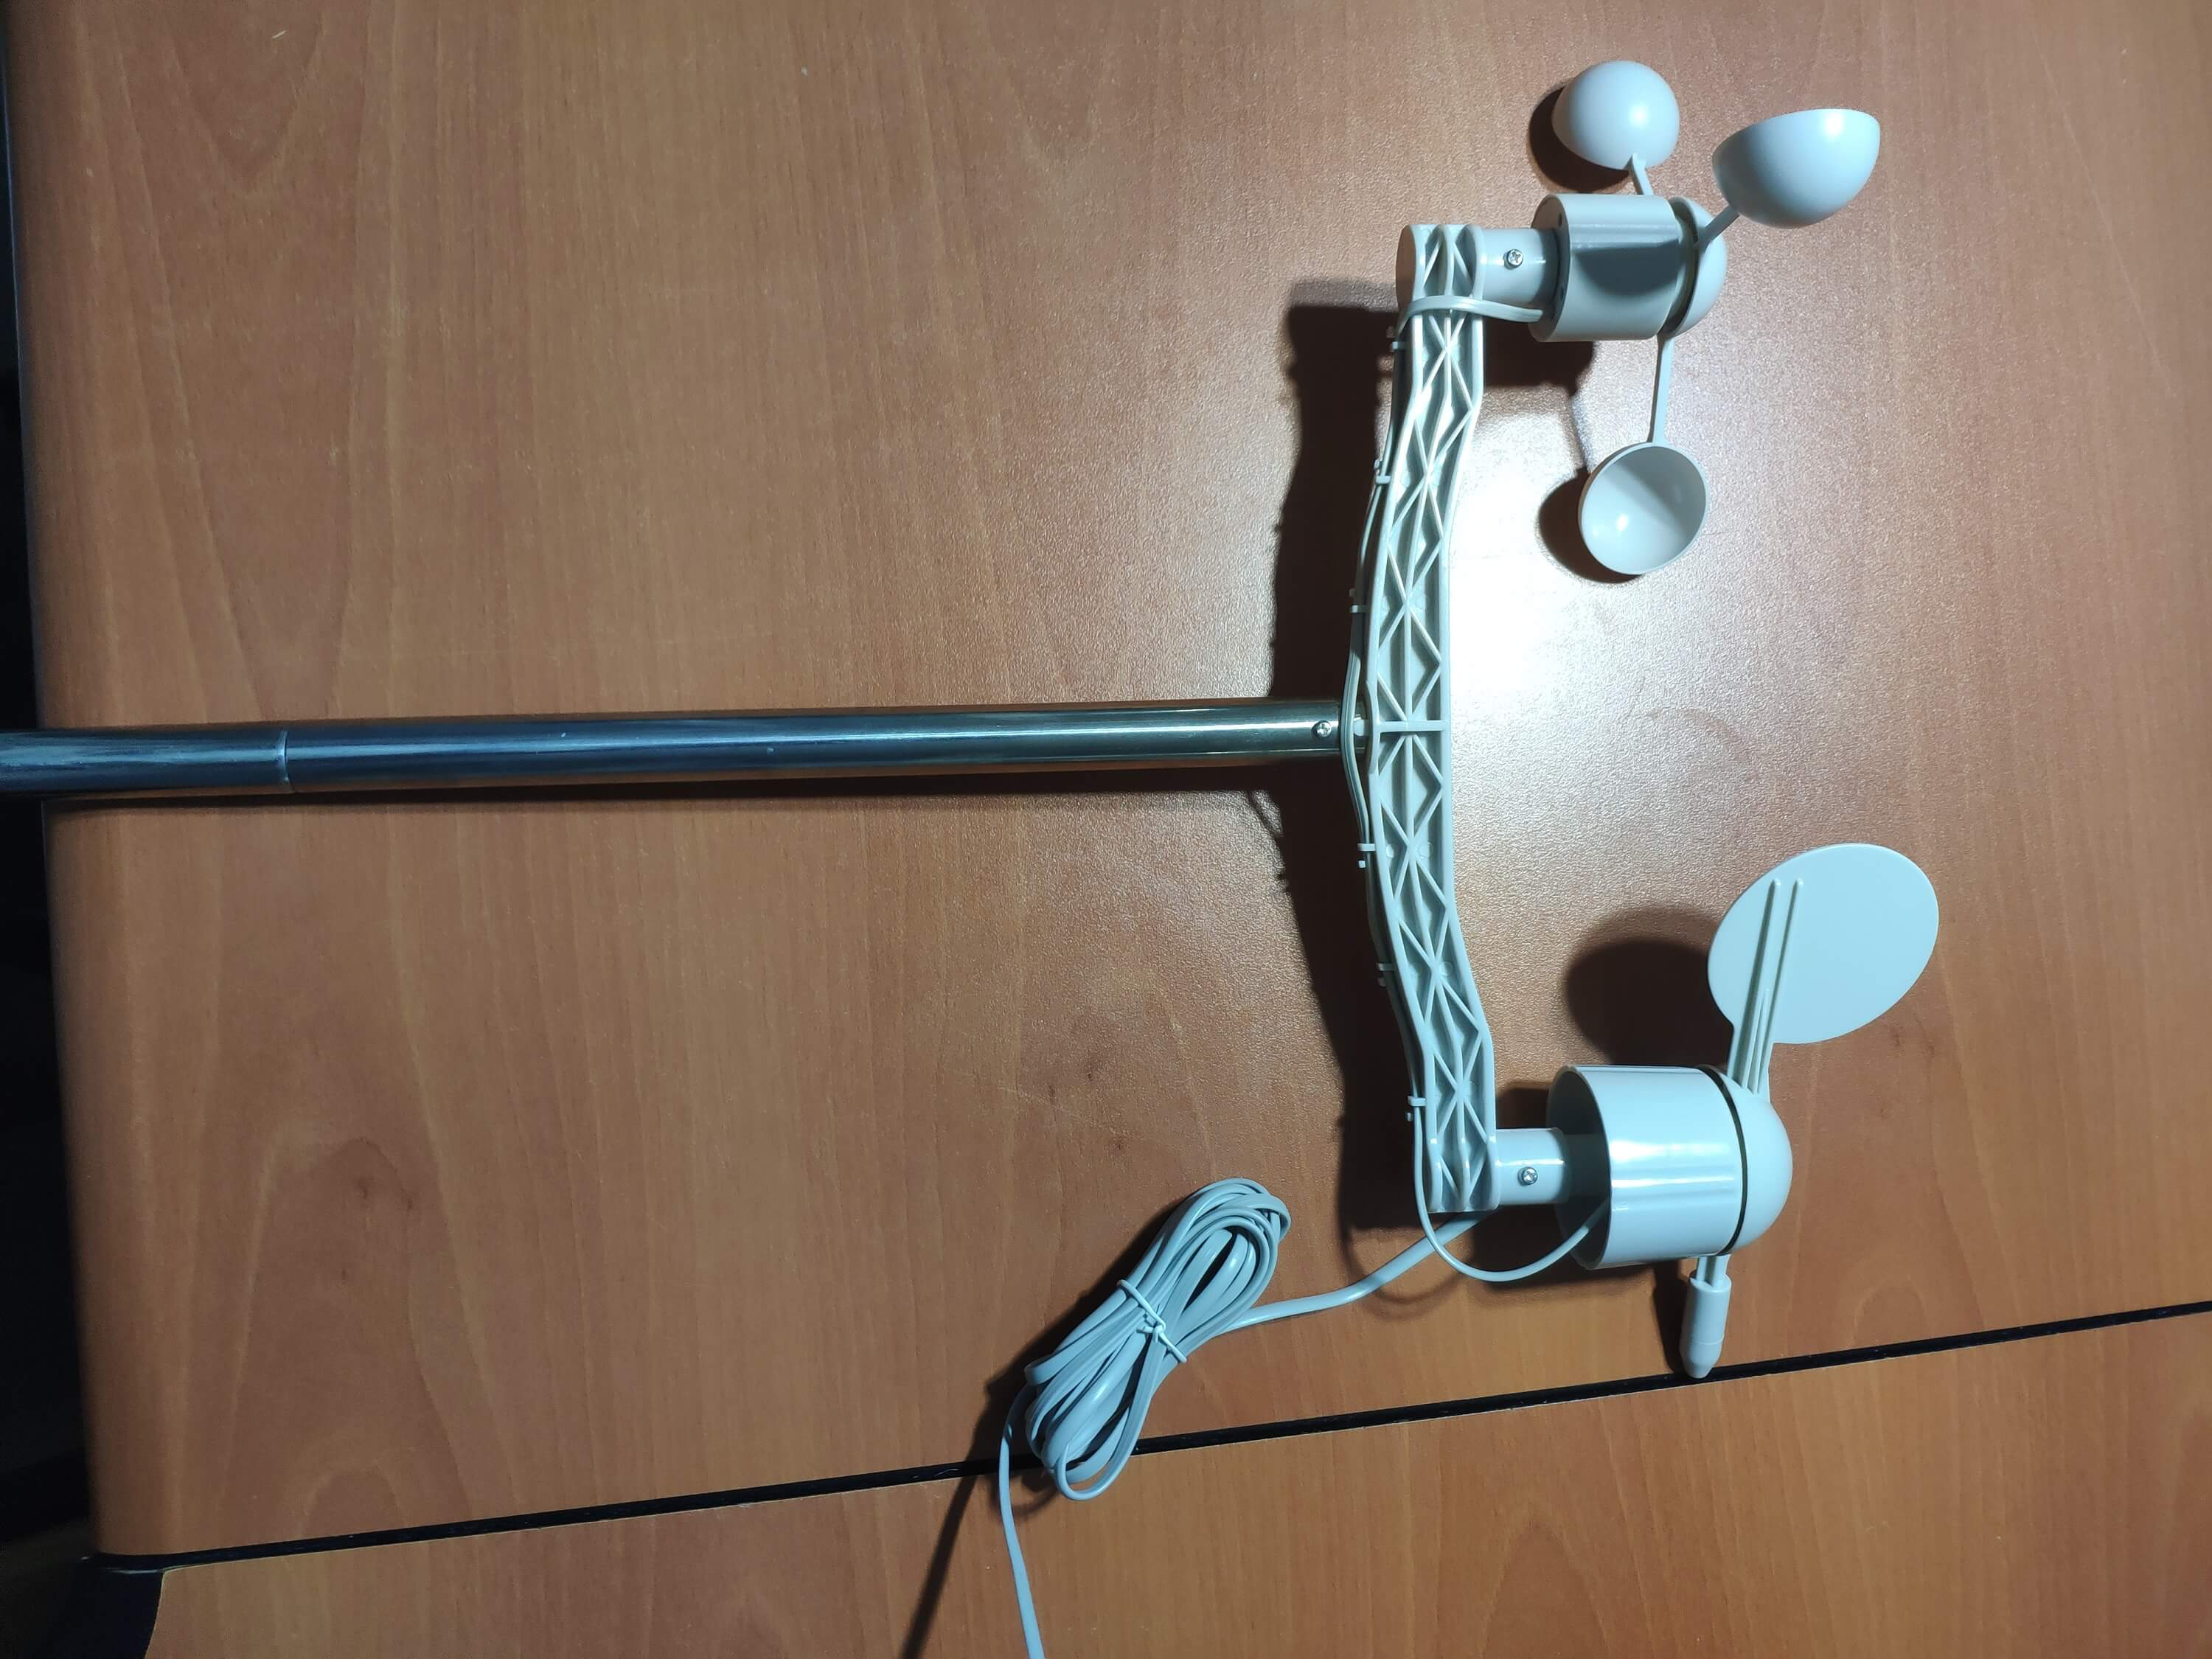
⭐然后,用螺丝将不锈钢棒安装到琴桥上。
⭐ 用螺丝将雨水斗接头安装在雨水斗下方。
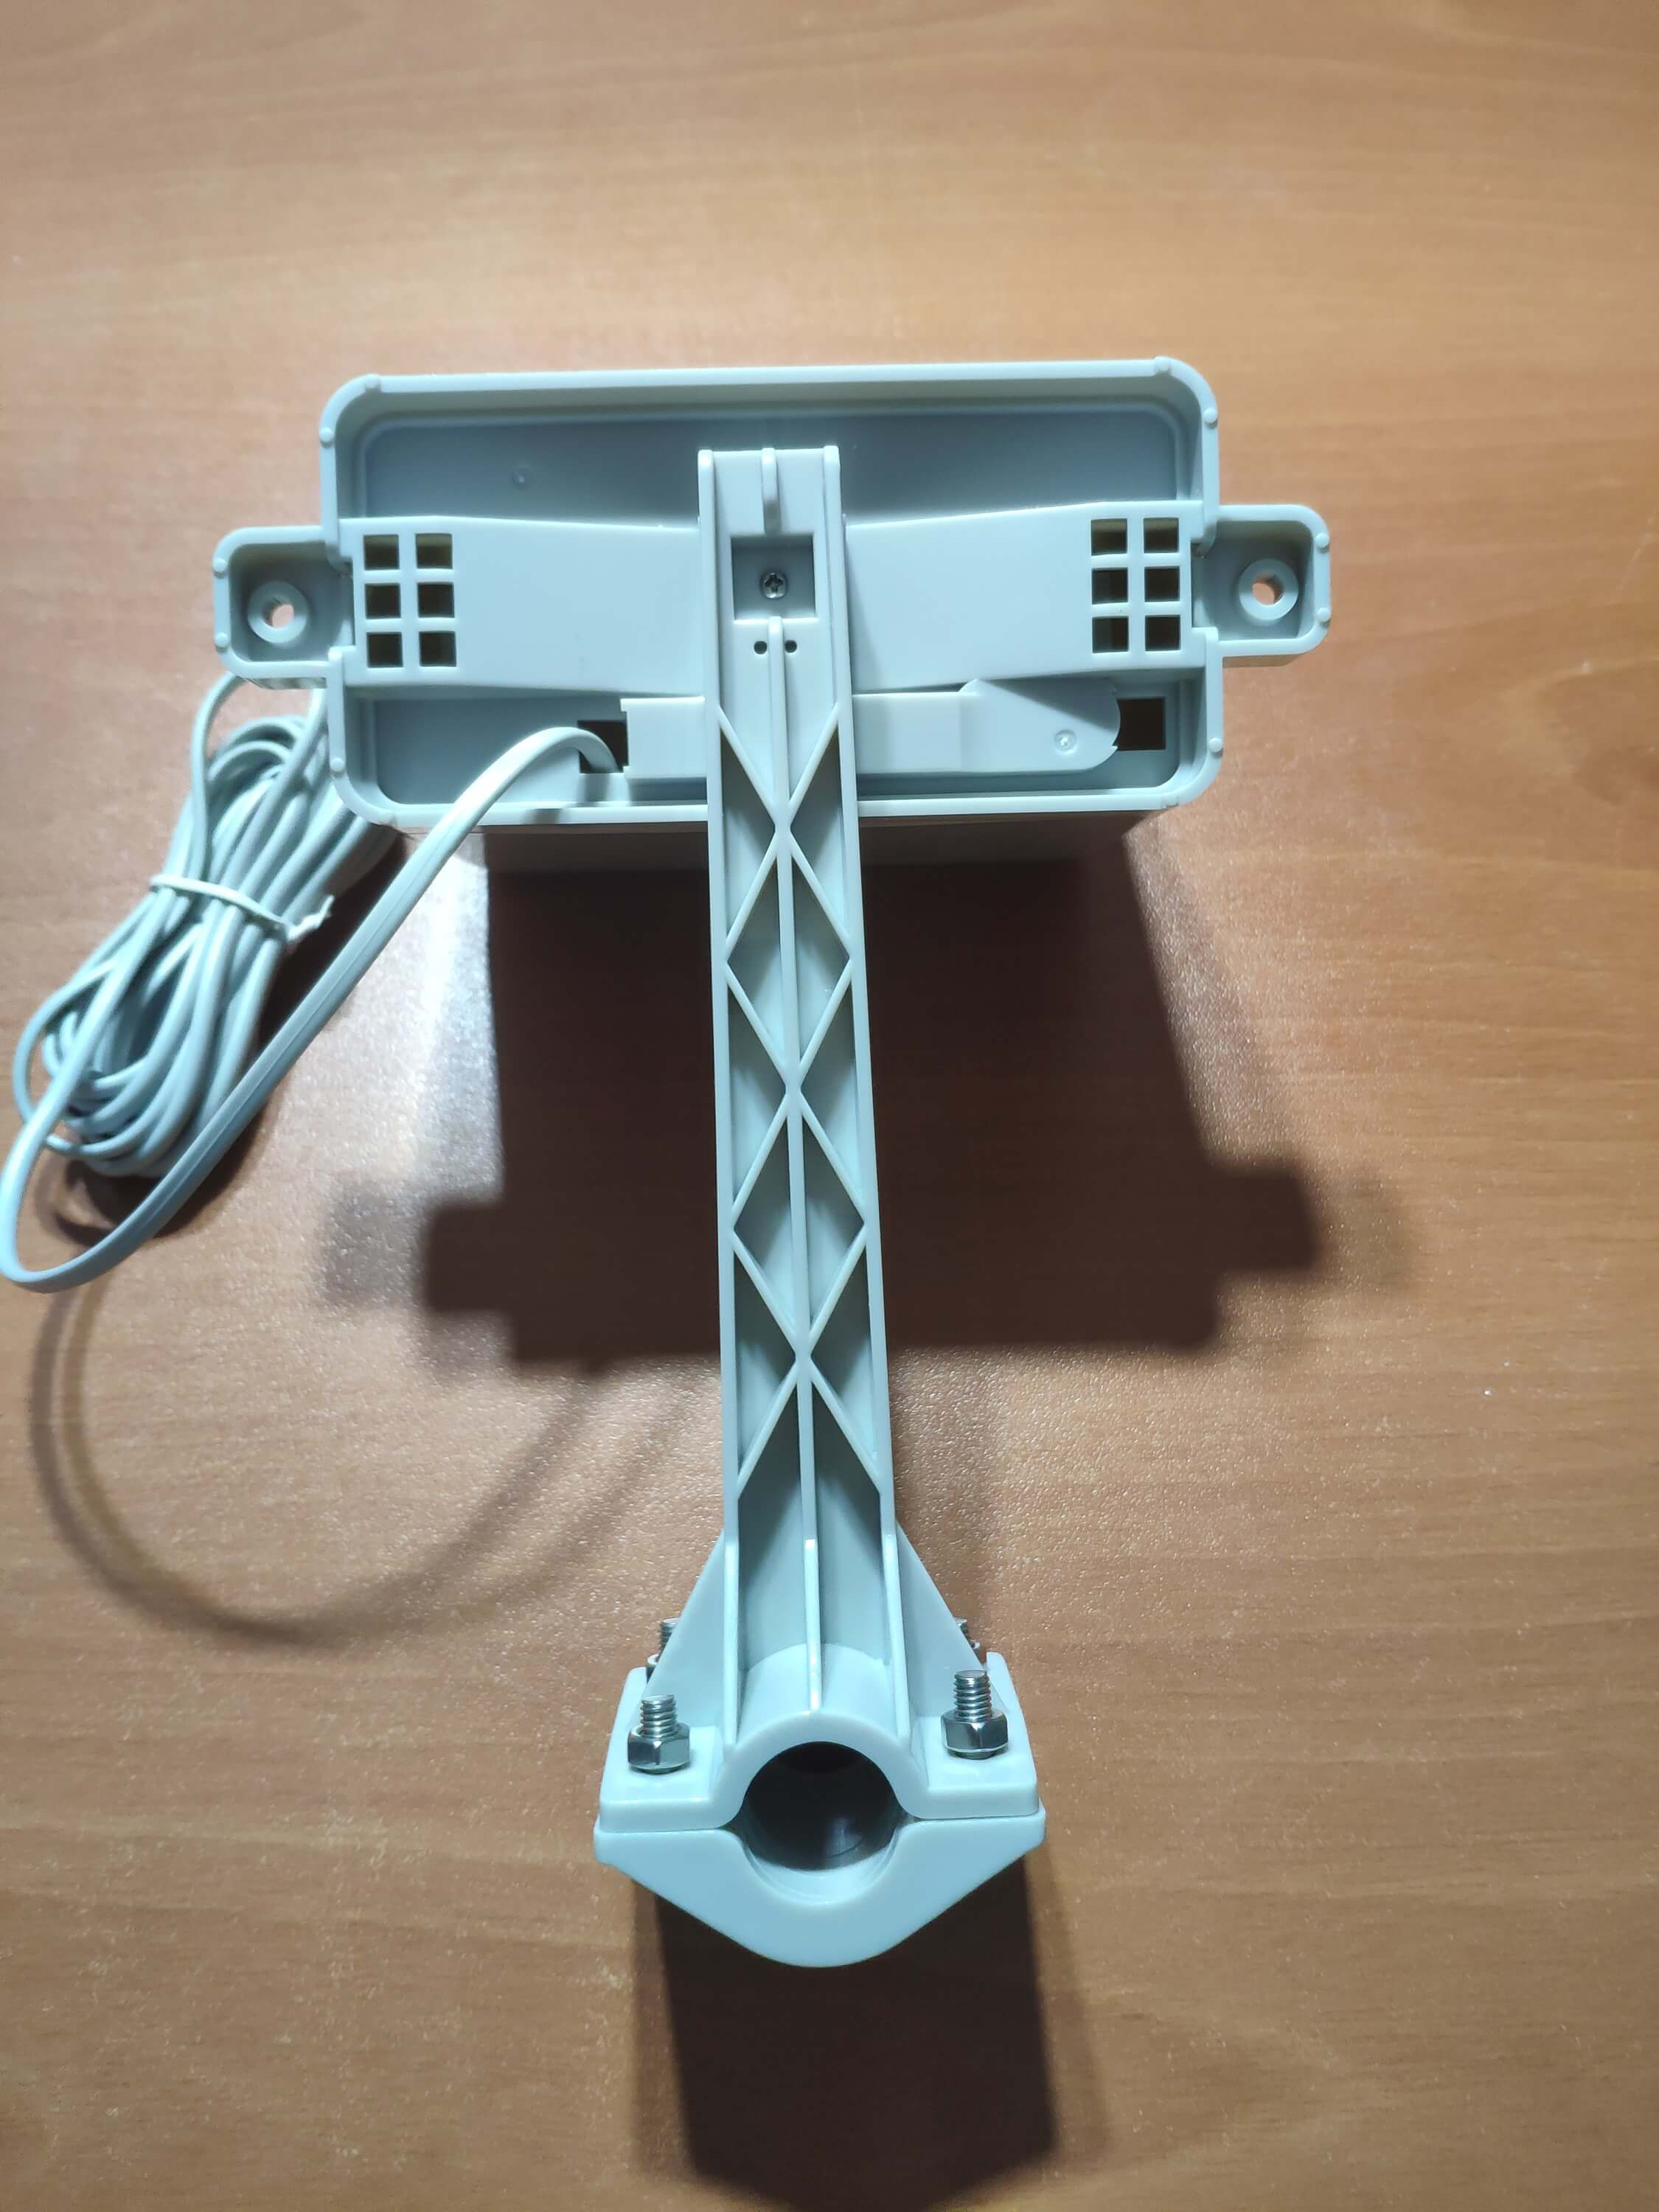
⭐最后,用螺丝和螺母将雨水桶放在不锈钢棒上。
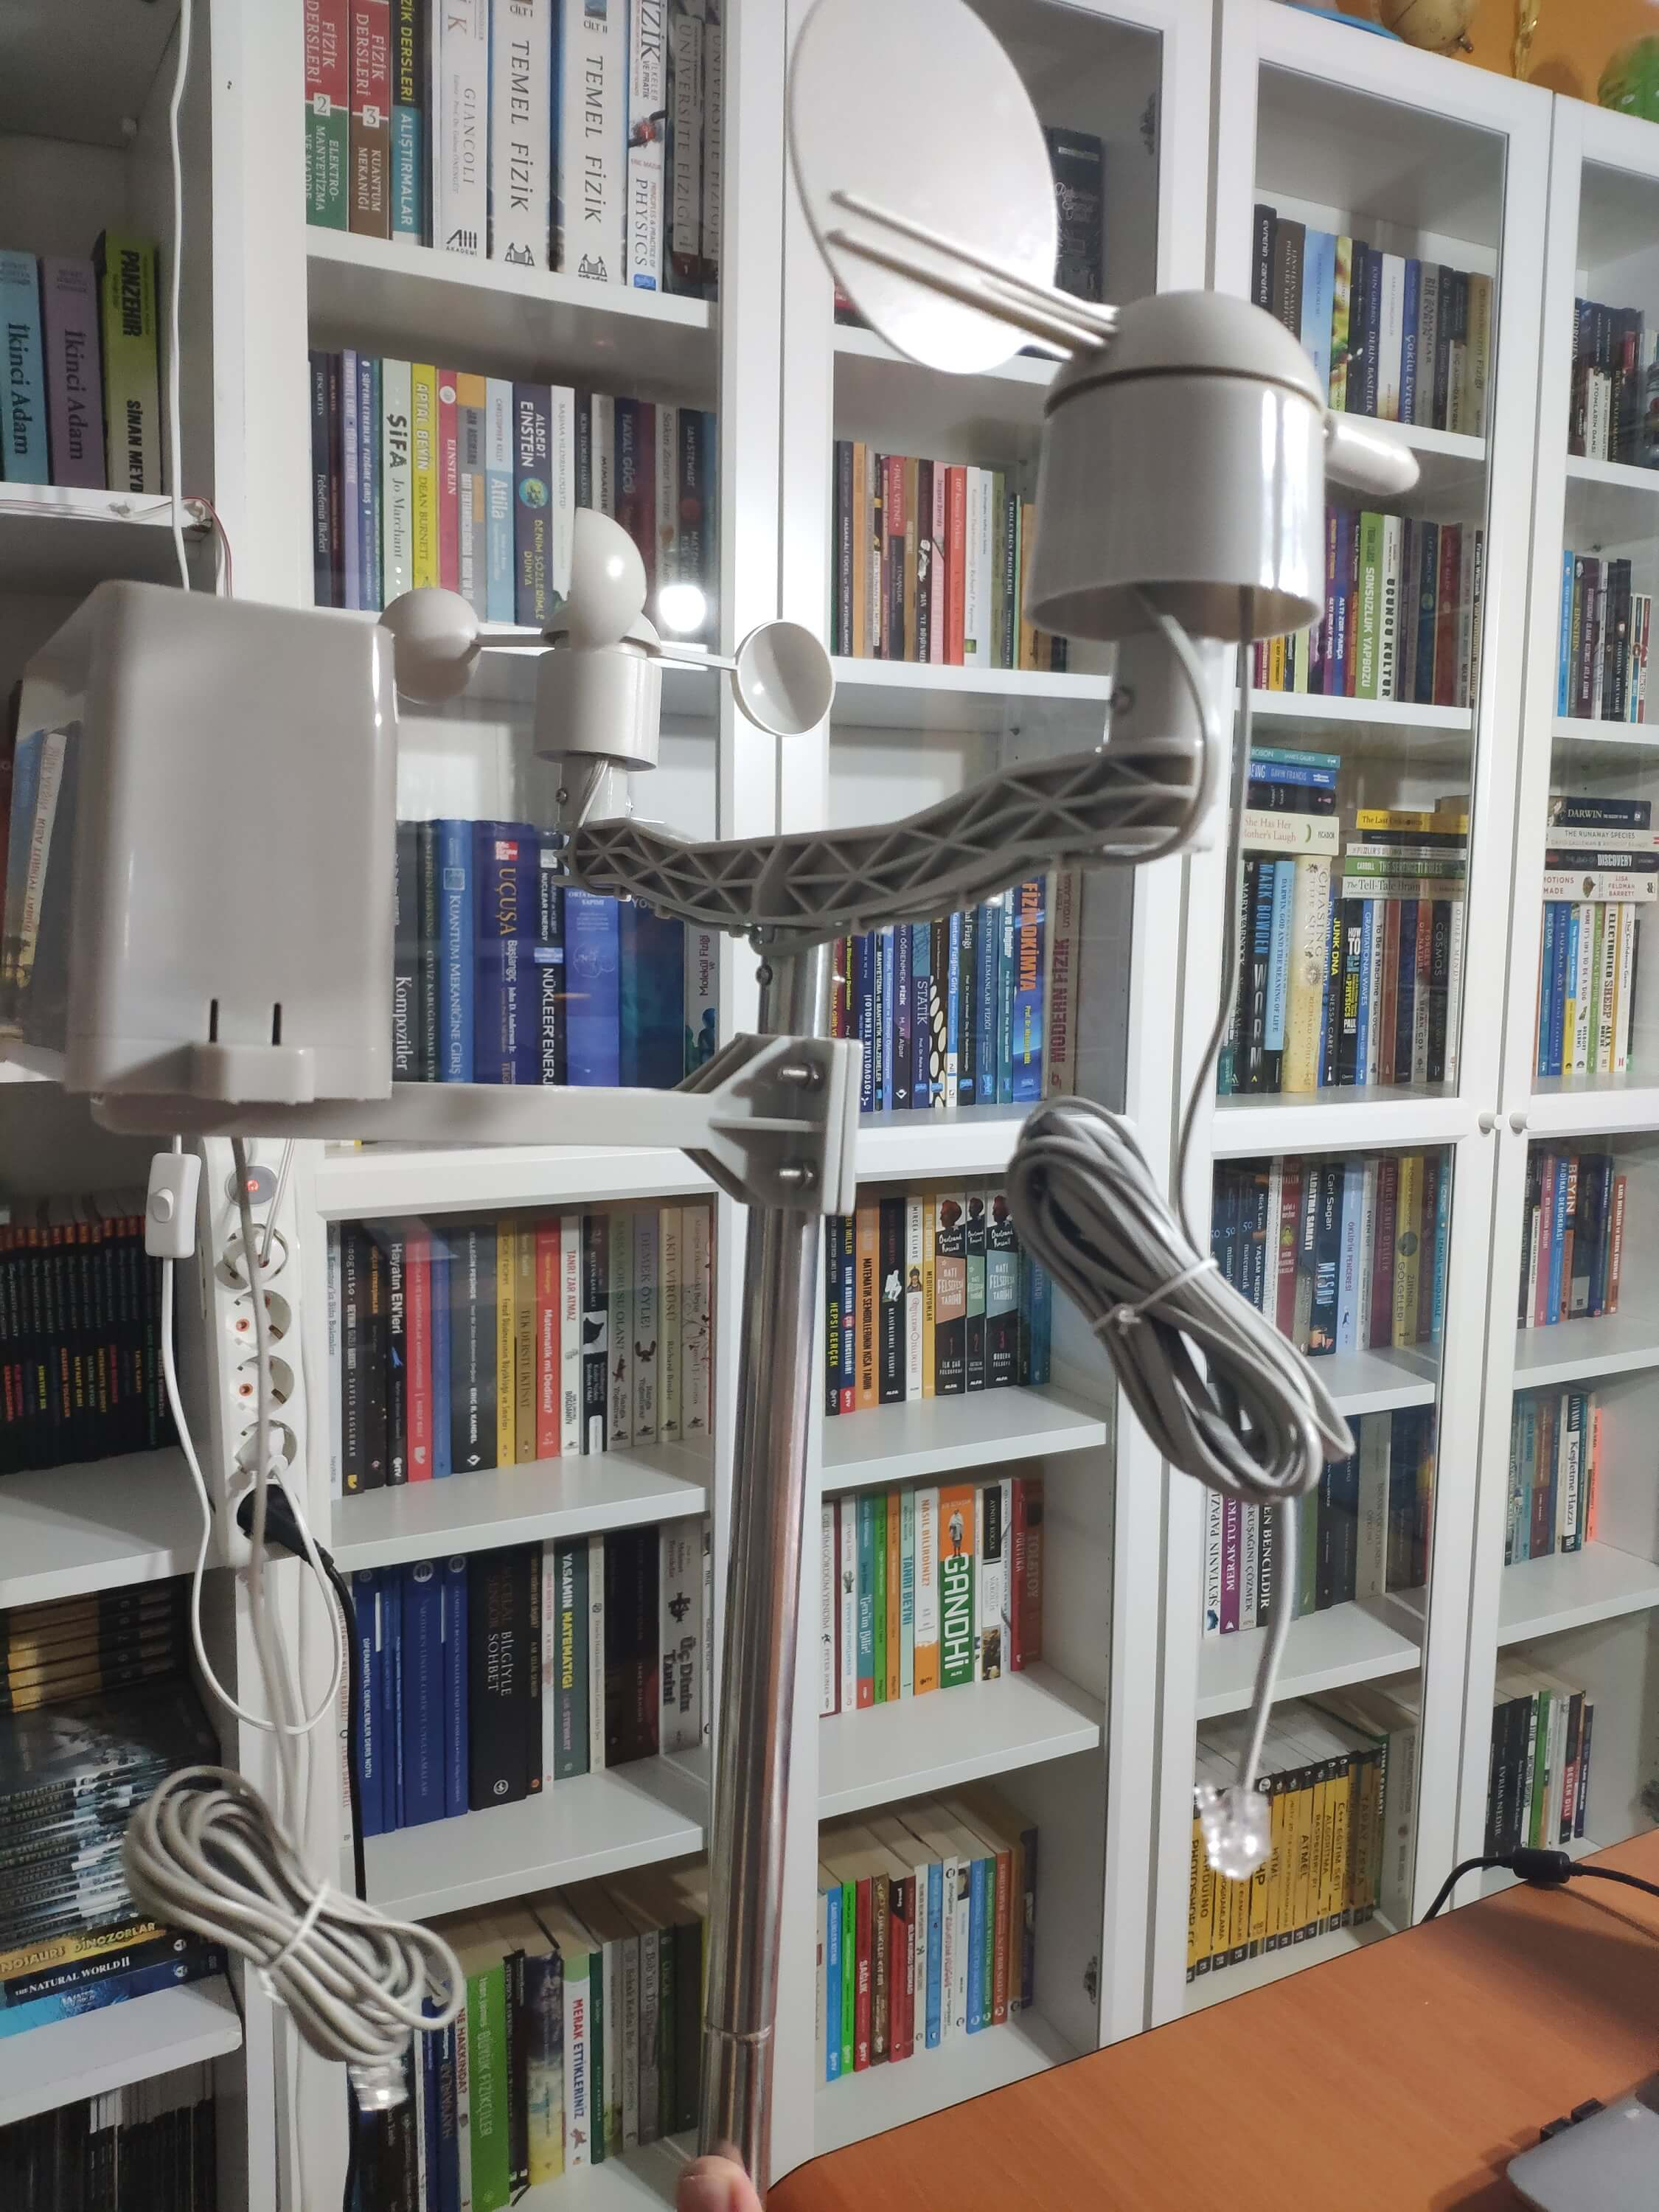
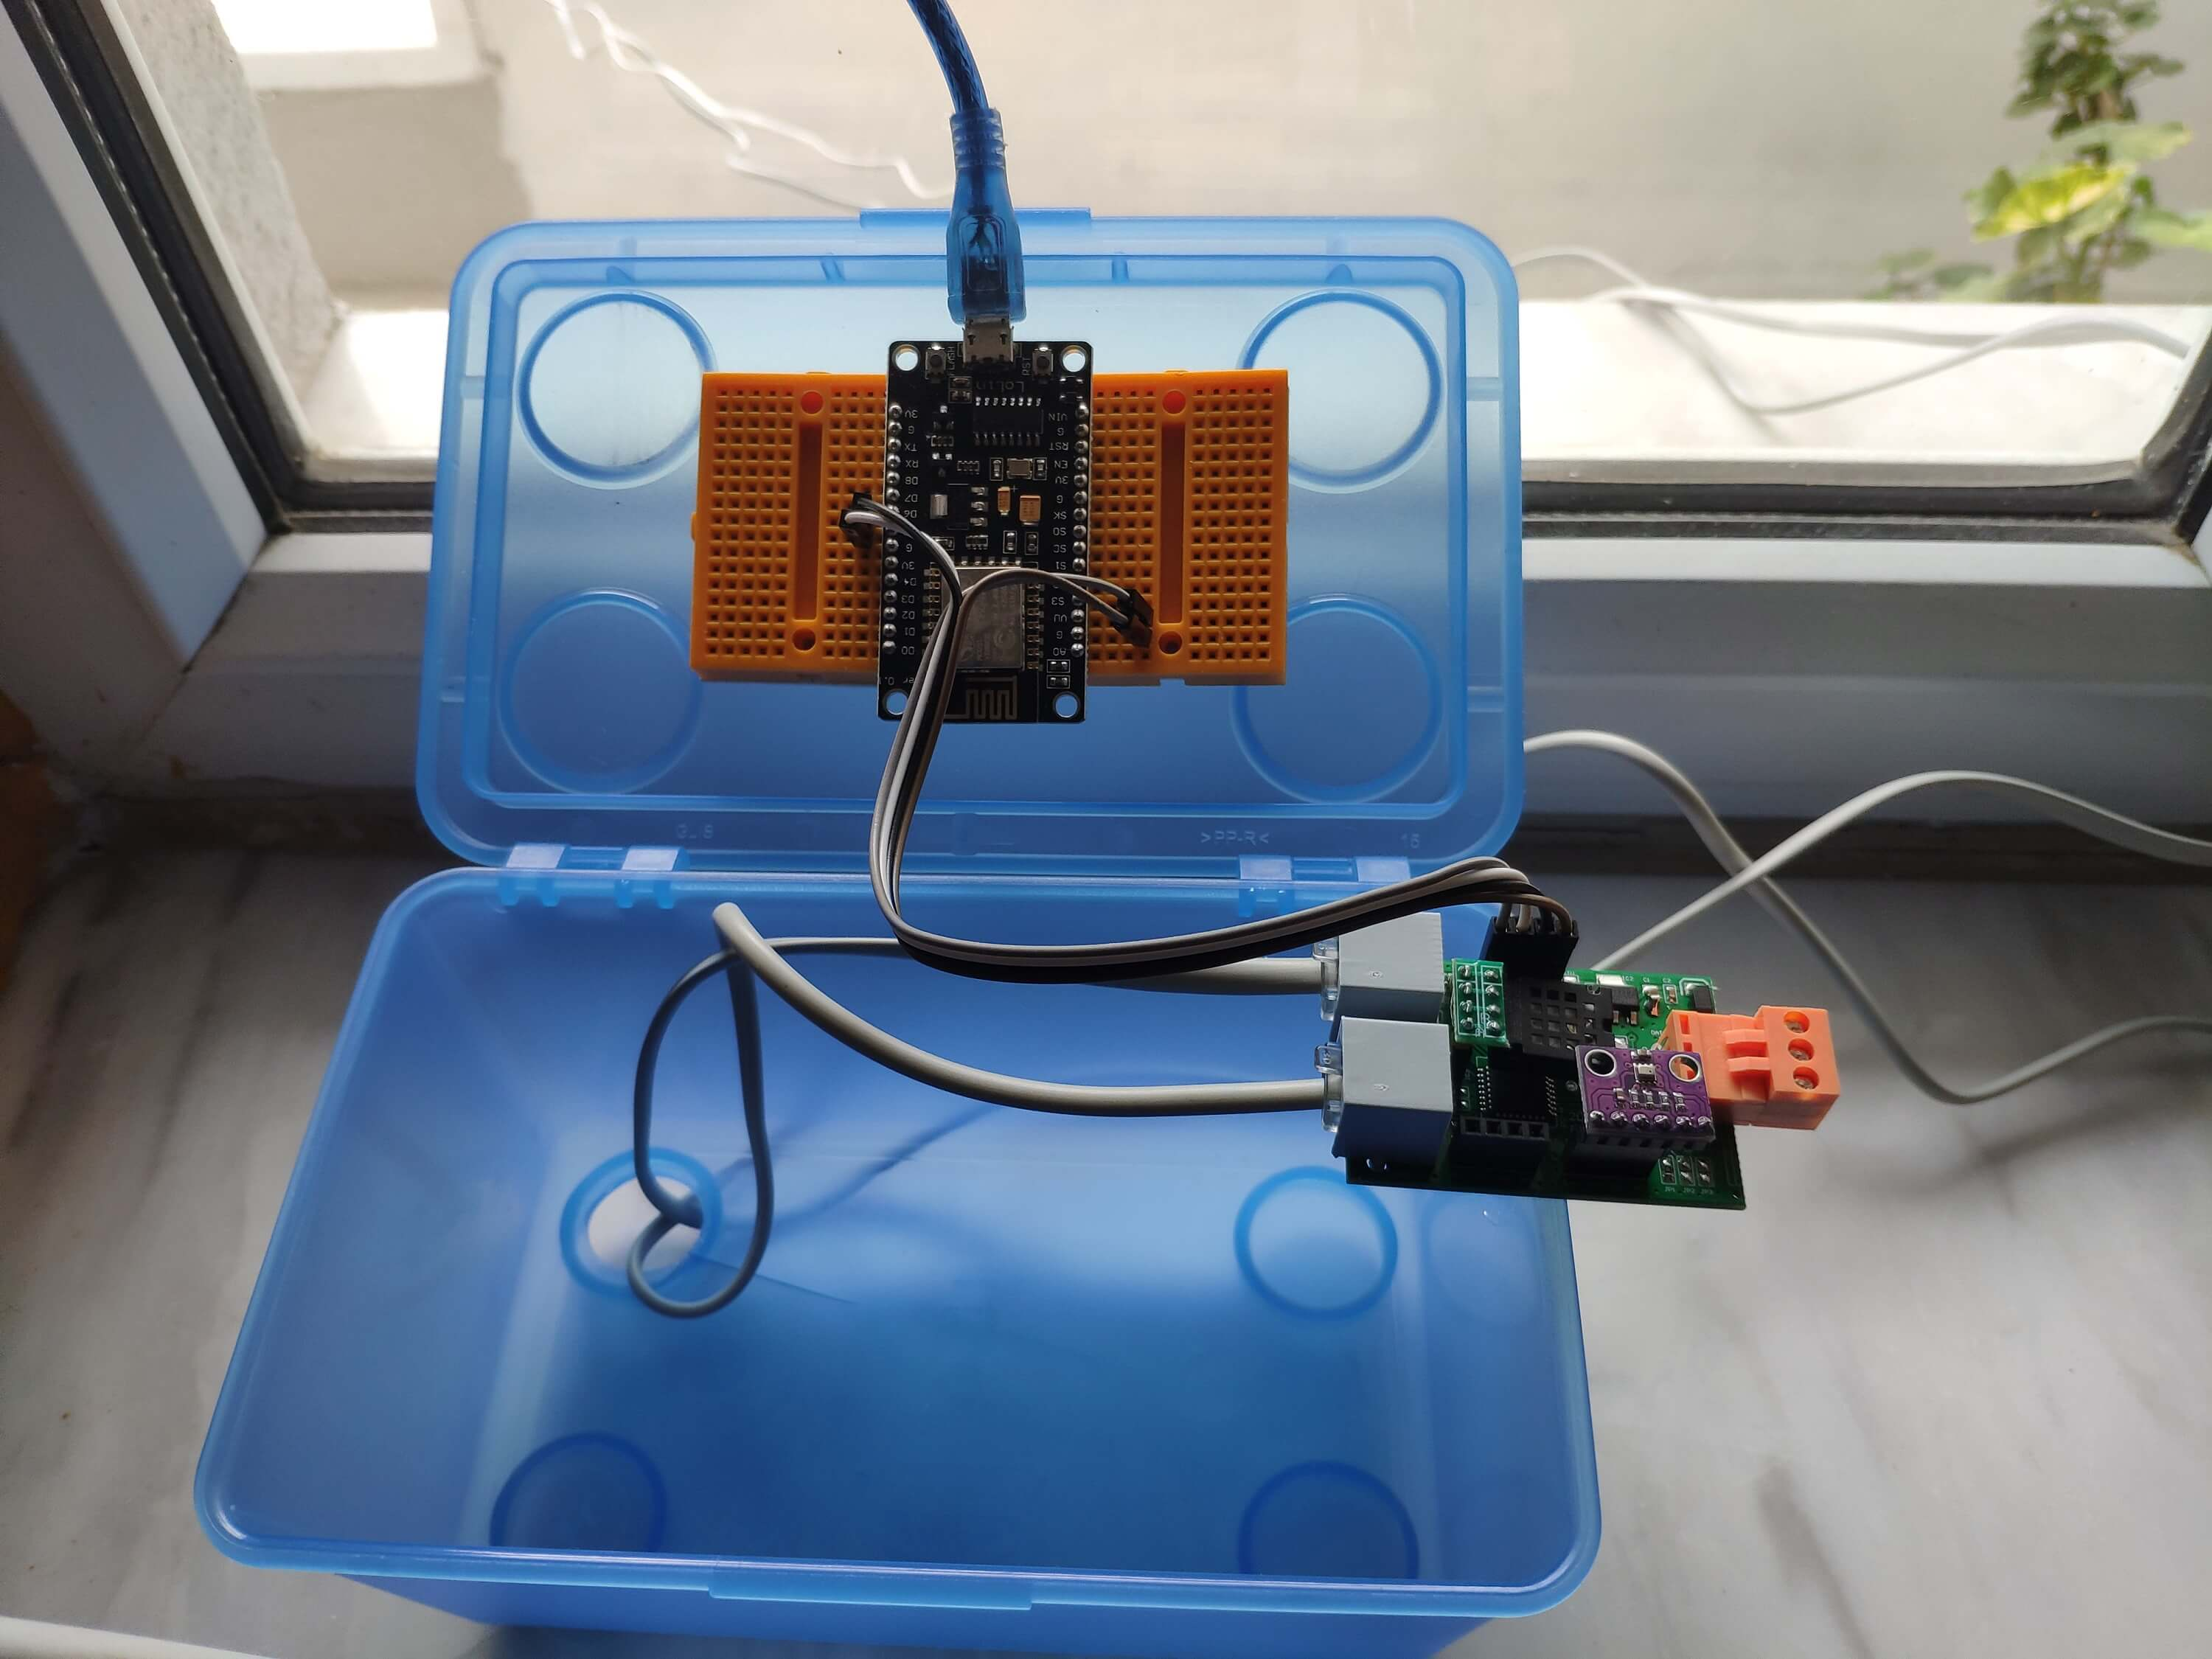
⭐现在,即使在极端天气条件下也可以收集天气数据。但是传感器(转换器)板不防风雨,所以我在气象站里加了一个塑料盒来保护传感器板和 SIM808 的屏蔽罩在户外。
第 2 步:在 Google 表格上收集天气数据
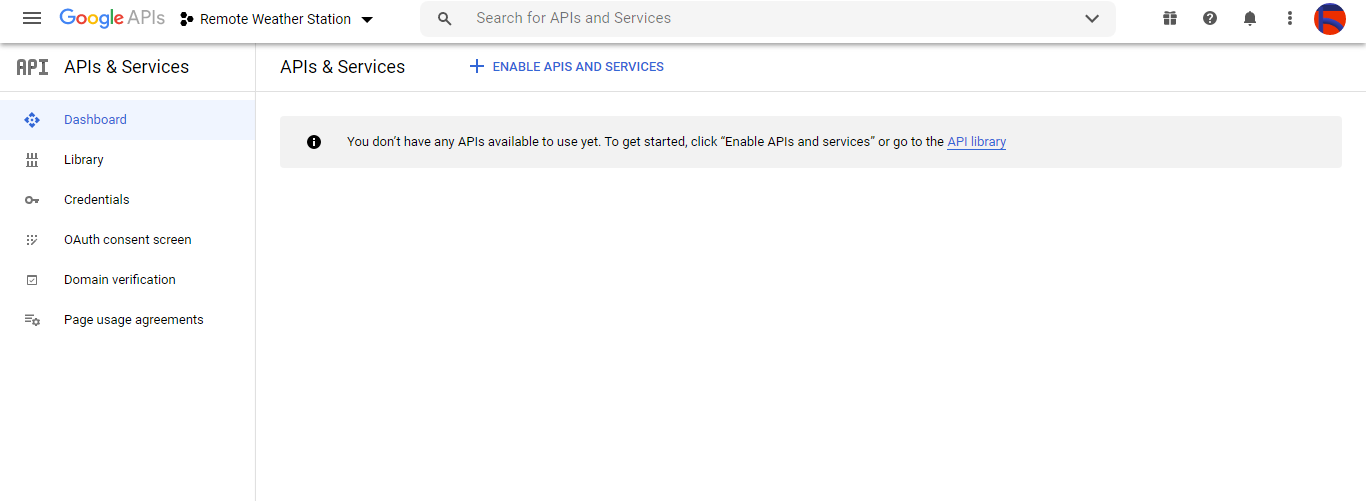
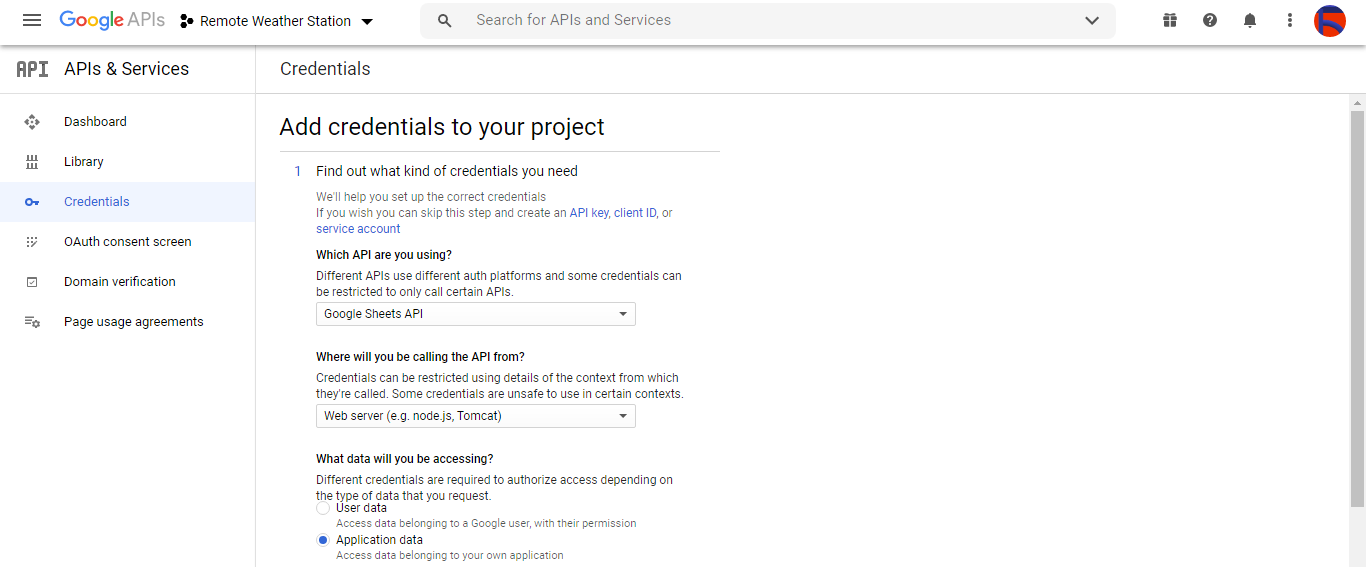
为了能够将信息发送到 Google Sheets 上的电子表格,您需要在 Google Developer Console 中创建一个新应用程序并获取验证凭据以使用 Google Sheets API。如果您是使用 Google Developer Console 创建应用程序的新手,请按照以下说明操作。
⭐ 转到 Google Developer Console,然后单击“新项目”按钮。输入项目名称为远程气象站 .

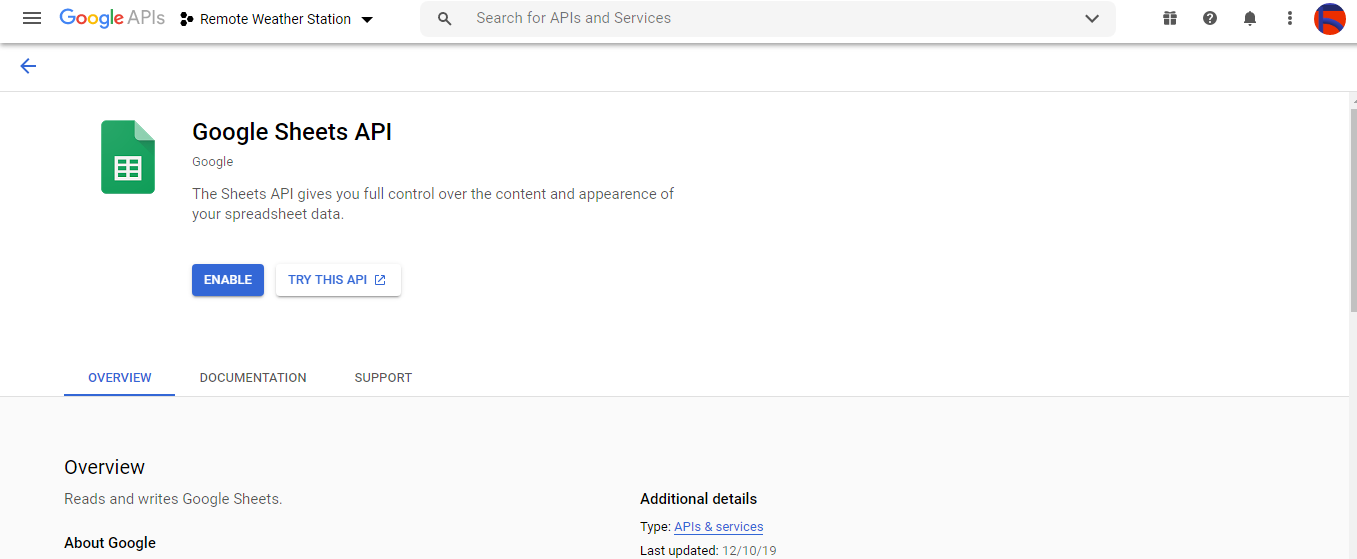
⭐ 转到API 和服务 并点击 API 库以启用 Google Sheets API。
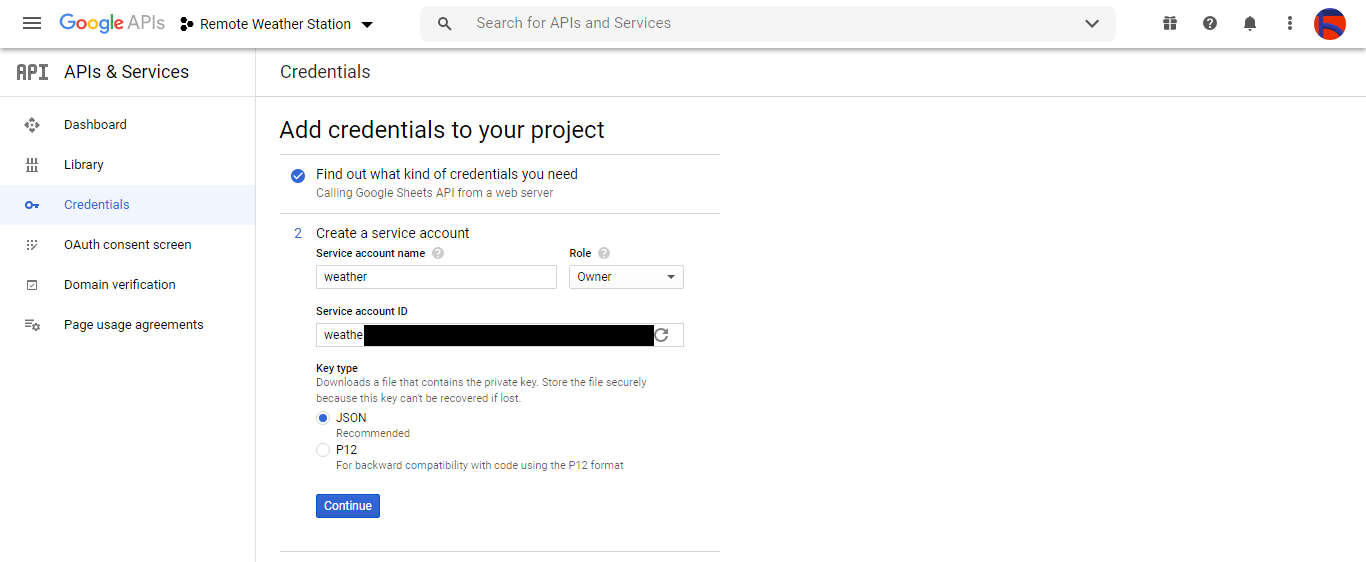
第 2.1 步:获取凭据以使用 Google Sheets API
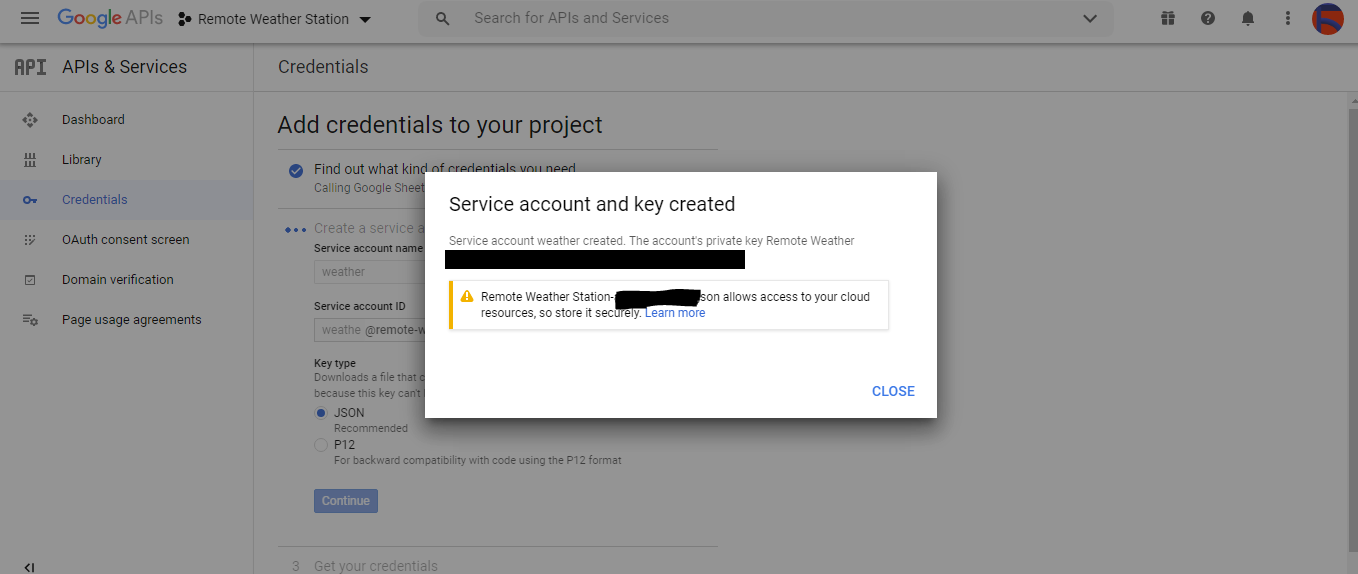
⭐ 打开项目仪表板并单击 Credentials 按钮。然后,填写如下所示的表单以创建服务帐户和密钥。
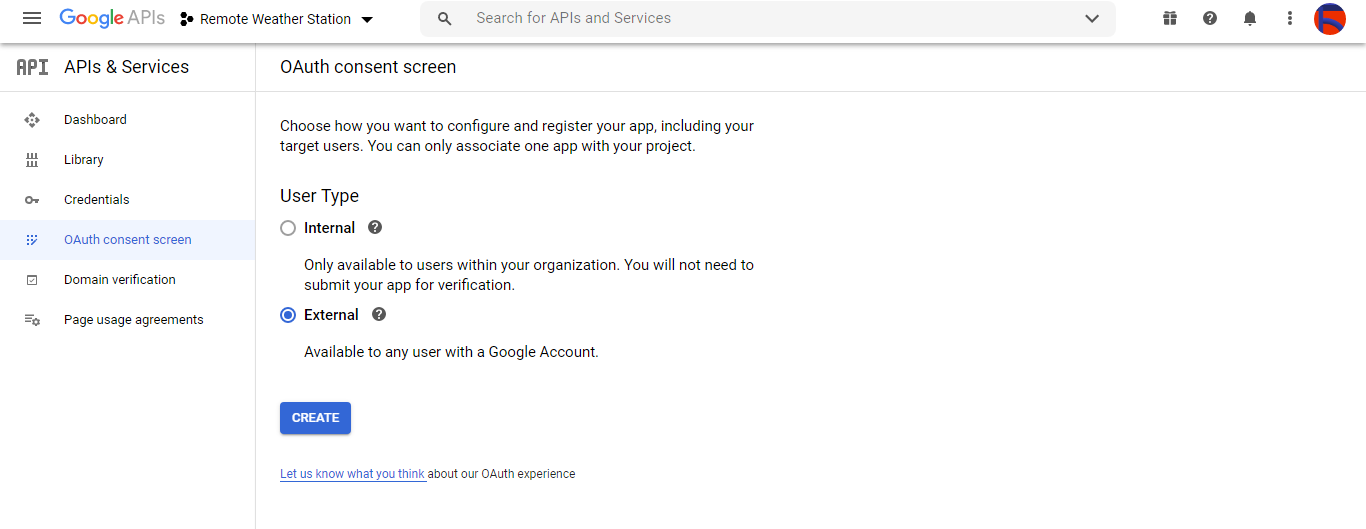
⭐ 单击创建凭据 按钮并配置同意屏幕以创建 OAuth 客户端 ID。
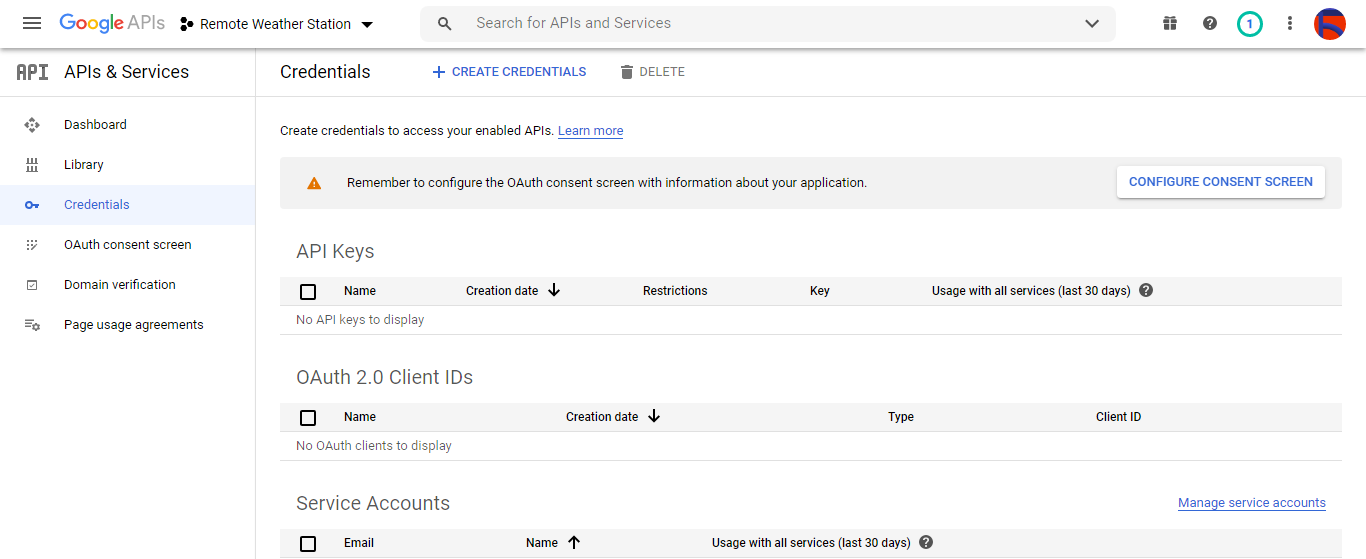
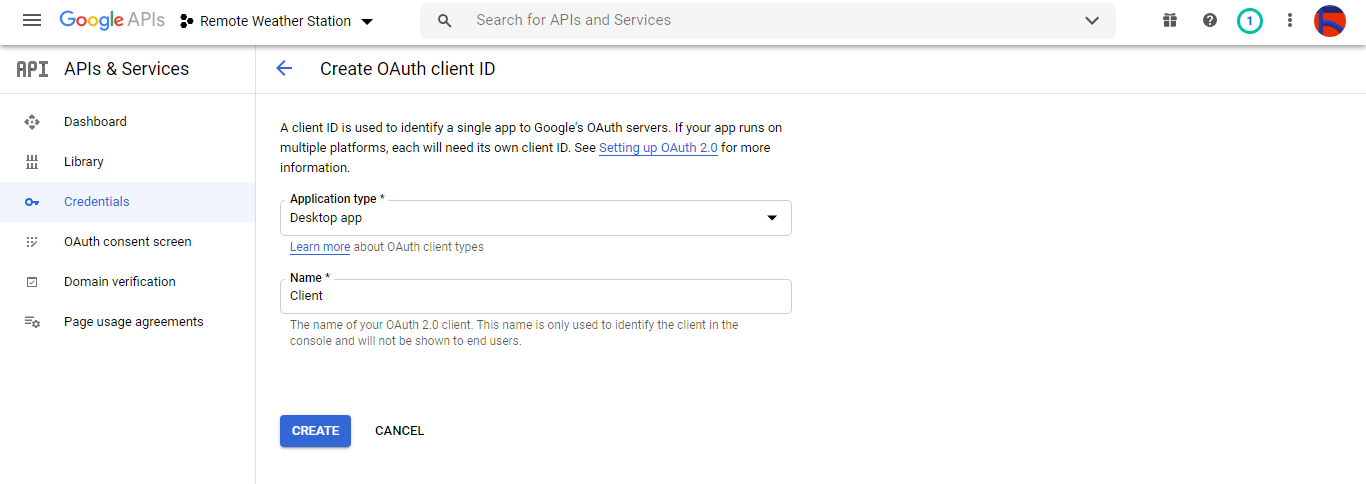
⭐ 然后,创建一个名为 Client 的新 OAuth 客户端 ID 在桌面应用下 (应用类型)。
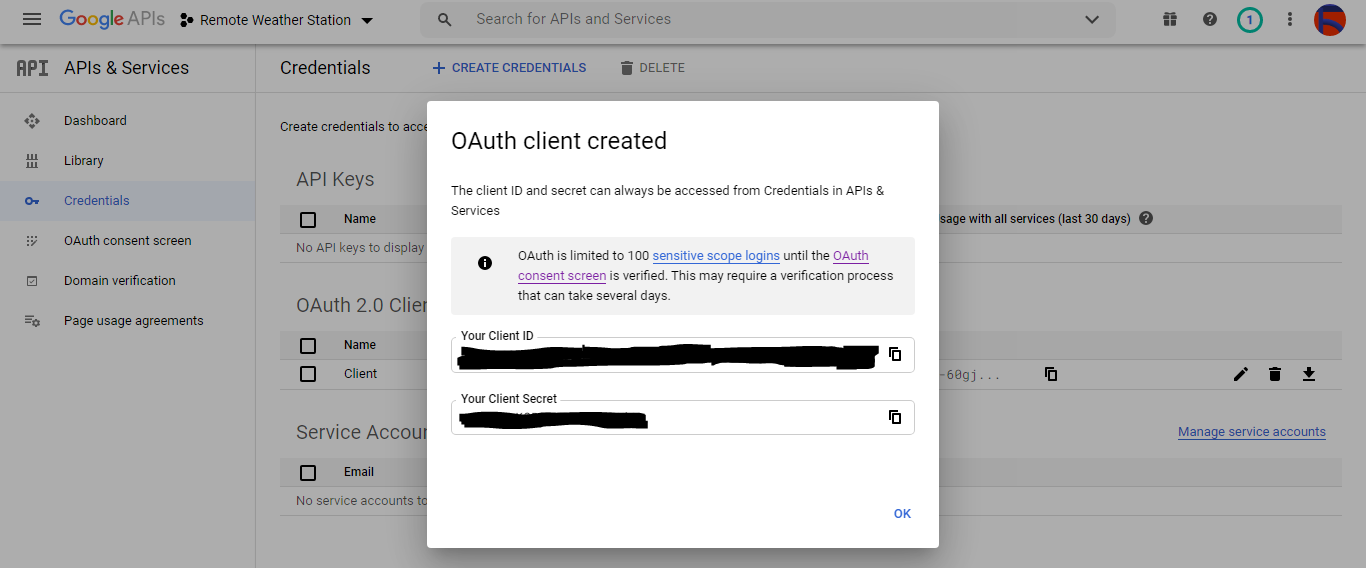
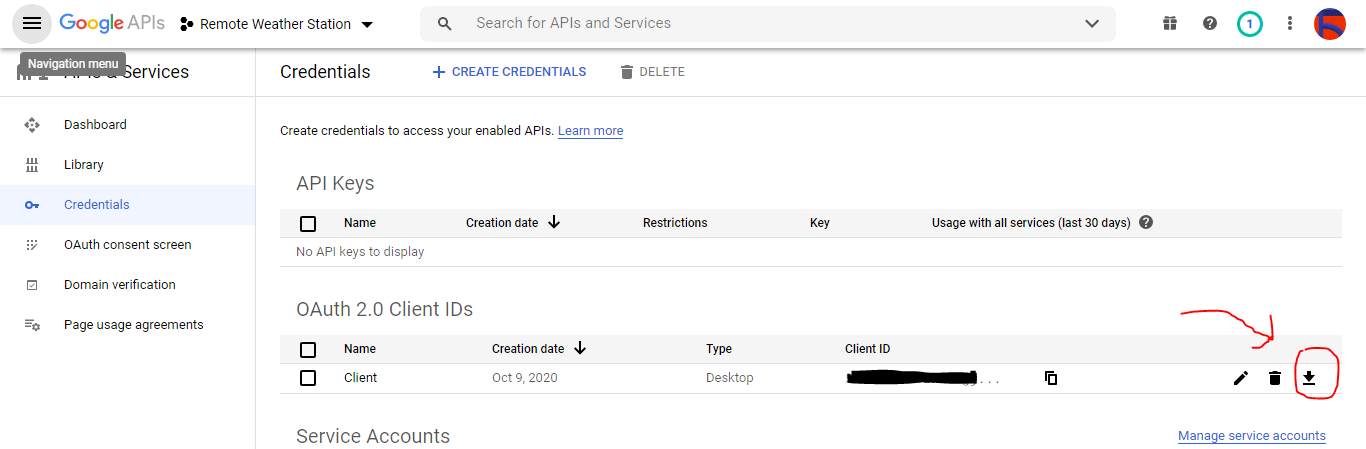
⭐ 创建 OAuth 客户端 ID (Client) 后 下载凭据(ID 和 Secret)并将文件命名为 credentials.json .
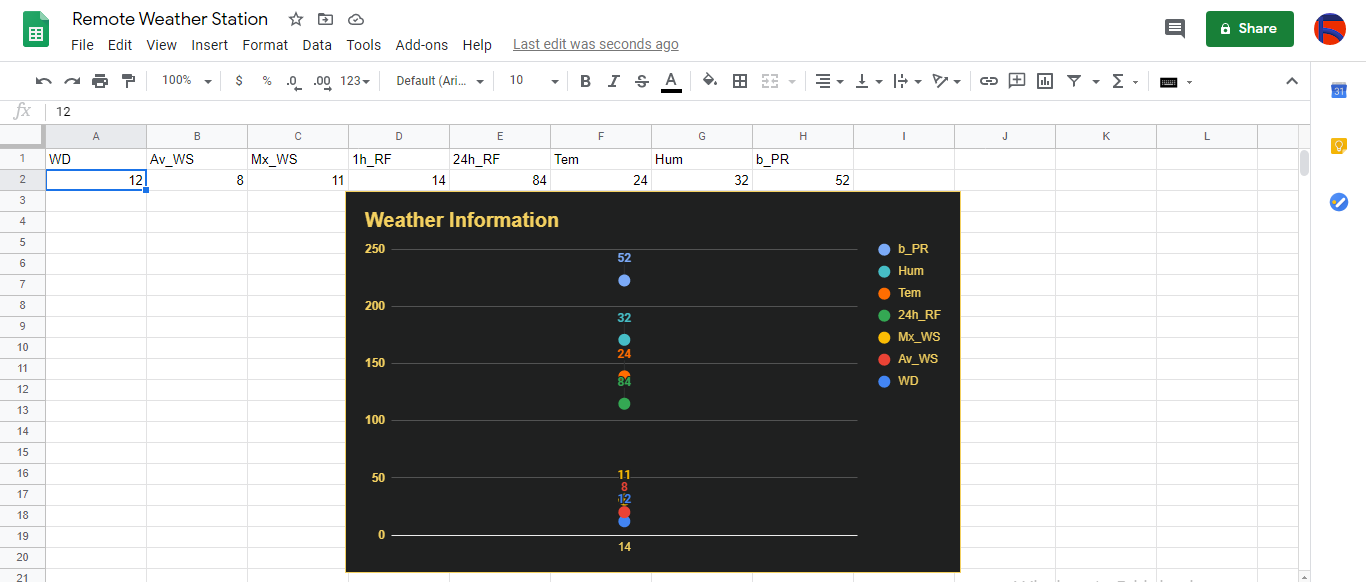
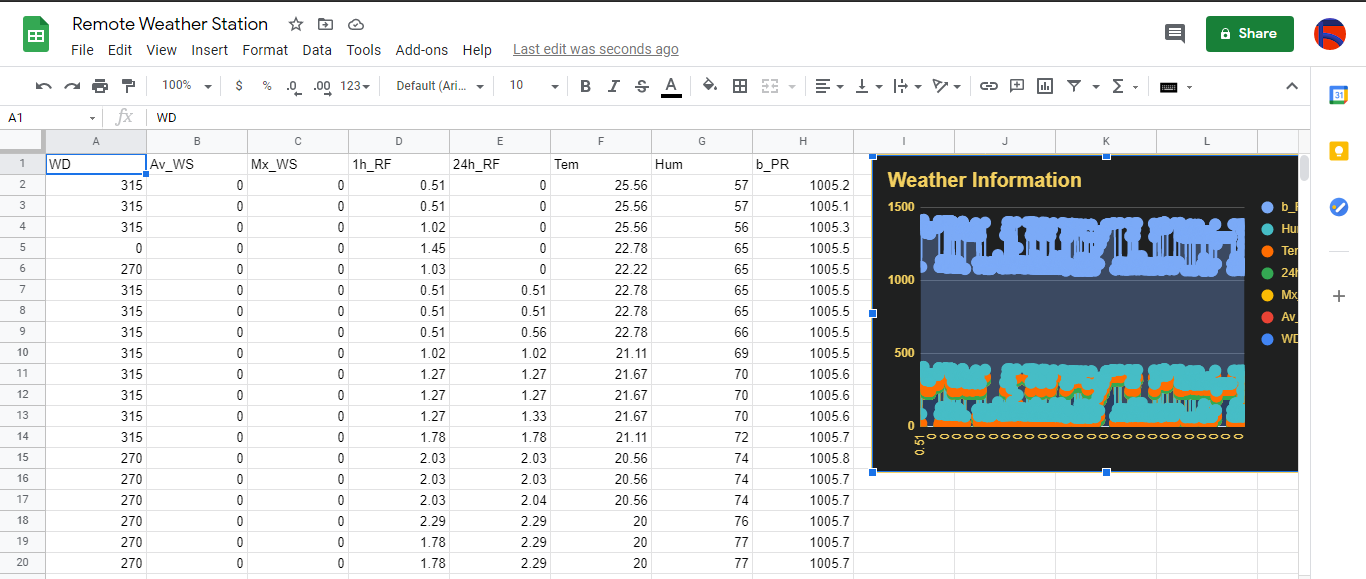
第 2.2 步:在 Google 表格上创建电子表格
⭐ 转到 Google 表格并选择个人 .

⭐ 创建一个空白 电子表格并将其命名为远程气象站 .
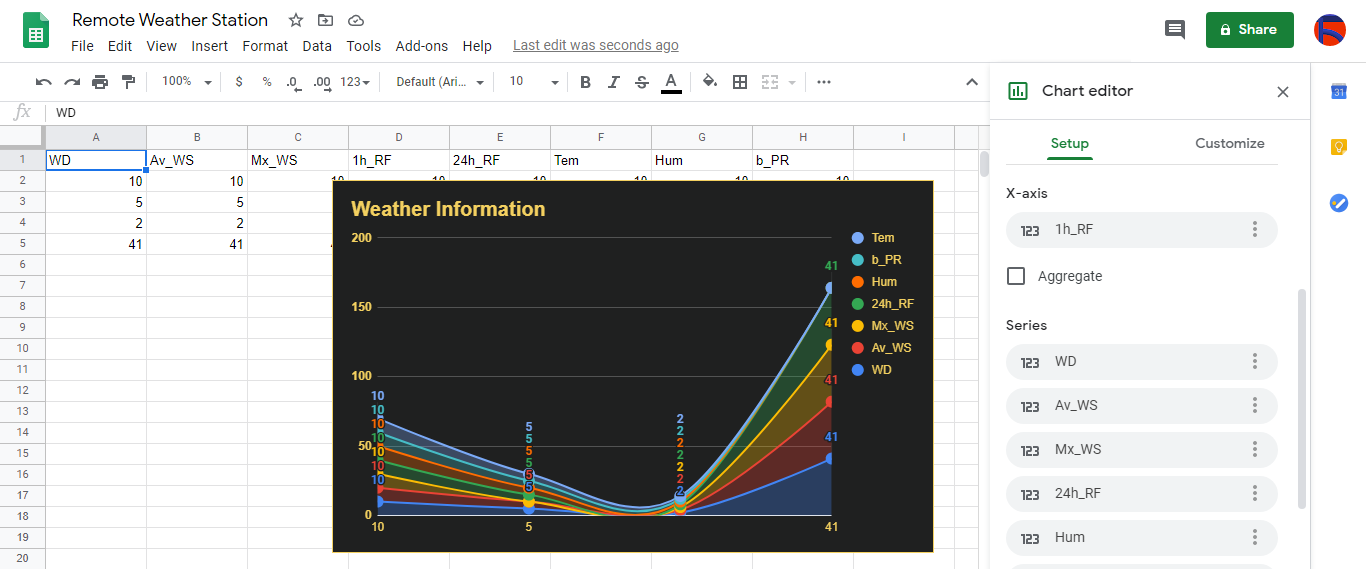
⭐ 然后,将列名定义为第一行:
- WD
- Av_WS
- Mx_WS
- 1h_RF
- 24h_RF
- 特姆
- 嗯
- b_PR
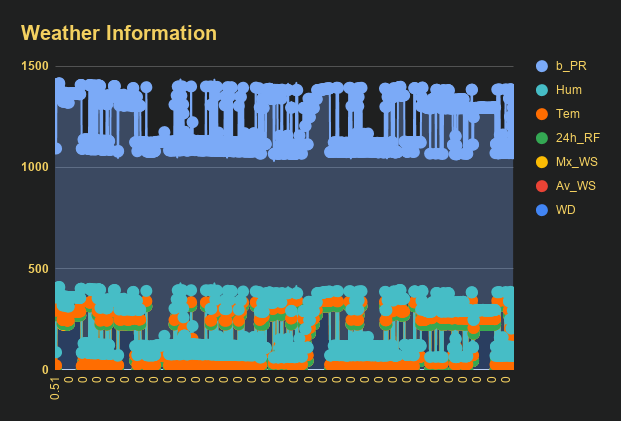
⭐如果需要,修改图表以检查收集的数据,就像我一样。
第 3 步:使用 PHP 开发 Web 应用程序以将天气数据附加到电子表格
此 PHP 网络应用程序用于通过 HTTP Get 请求获取开发板(ESP8266 和 SIM808)传输的天气数据,并将该数据附加到 Google 表格上的给定电子表格(按 ID)中,并使用经过验证的凭据和令牌。
Web 应用程序需要适用于 PHP 的 Google 客户端库,才能将天气数据附加到 Google 表格上的给定电子表格中。
⭐ 所以,首先,创建一个名为 remote_weather_station 的文件夹 并在其中安装适用于 PHP 的 Google 客户端库。
remote_weather_station 除了 Google 客户端库之外,文件夹还应包含这四个文件才能工作:
- index.php
- account_verification_token.php
- credentials.json (步骤 2.1)
- token.json (步骤 3.1)
在这一步中,我将讨论前两个文件 - index.php 和 account_verification_token.php:
💻 index.php
⭐ 通过 Get 请求从气象站获取当地天气数据:
// 风向(wd),平均风速(a_ws),最大风速(m_ws),1hr 降雨量(1_rf),24hr 降雨量(24_rf),温度(tem),湿度(hum),气压 (b_pr).
$variables_from_module;
if(isset($_GET['wd']) &&isset($_GET['a_ws']) &&isset($_GET['m_ws'] ) &&isset($_GET['1_rf']) &&isset($_GET['24_rf']) &&isset($_GET['tem']) &&isset($_GET['hum']) &&isset($_GET) ['b_pr'])){
$variables_from_module =[
"wd" => (int)$_GET['wd'],
"a_ws" => (float)$_GET ['a_ws'],
"m_ws" => (float)$_GET['m_ws'],
"1_rf" => (float)$_GET['1_rf'],
"24_rf" => (float)$_GET['24_rf'],
"tem" => (float)$_GET['tem'],
"hum" => (int)$_GET ['hum'],
"b_pr" => (float)$_GET['b_pr']
];
}else{
$variables_from_module =[
"wd" => "err",
"a_ws" => "err",
"m_ws" => "err",
"1_rf" => "err",
"24_rf" => "err",
"tem" => "err",
"hum" => "err",
"b_pr" => "err"
];
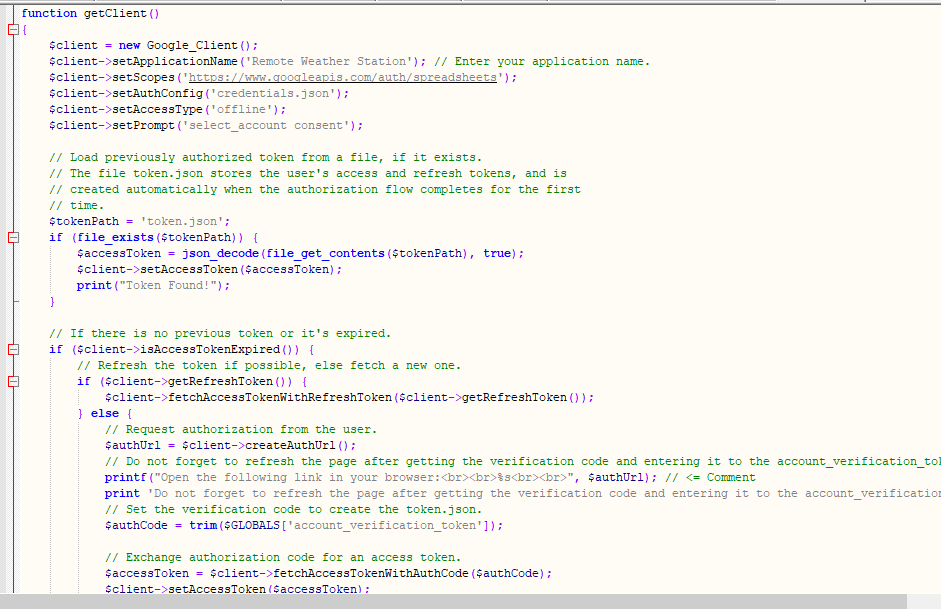
} ⭐ 连接到名为 Remote Weather Station 的 Google Developer Console 应用程序 通过使用 credentials.json 文件 (步骤 2.1) .
$client =new Google_Client();
 $client->setApplicationName('远程气象站'); // 输入您的应用程序名称。
 $client->setScopes('https://www.googleapis.com/auth/spreadsheets');
 $client->setAuthConfig('credentials.json');
 $client->setAccessType('offline');
 $client->setPrompt('select_account同意');
⭐ 从文件 (token.json ),如果存在。
$tokenPath ='token.json';
 if (file_exists($tokenPath)) {
 $accessToken =json_decode(file_get_contents($tokenPath), true);
 $client->setAccessToken($accessToken);
 print("Token Found!");
} ⭐如果没有之前的token或过期,请向用户请求授权并设置验证码以创建token.json 带有 file_put_contents() 的文件 功能。
if ($client->isAccessTokenExpired()) {
// 如果可能,刷新令牌,否则获取新令牌。
if ($client->getRefreshToken()) {
$client->fetchAccessTokenWithRefreshToken($client->getRefreshToken());
} else {
// 请求用户授权。
$authUrl =$client->createAuthUrl ();
...
// 设置验证码创建token.json.
$authCode =trim($GLOBALS['account_verification_token' ]);
...
// 检查是否有错误,是否输入了account_verification_token。
if (array_key_exists('error', $accessToken)) {
throw new Exception(join(', ', $accessToken));
}else{
print("成功!刷新页面。");
}
}
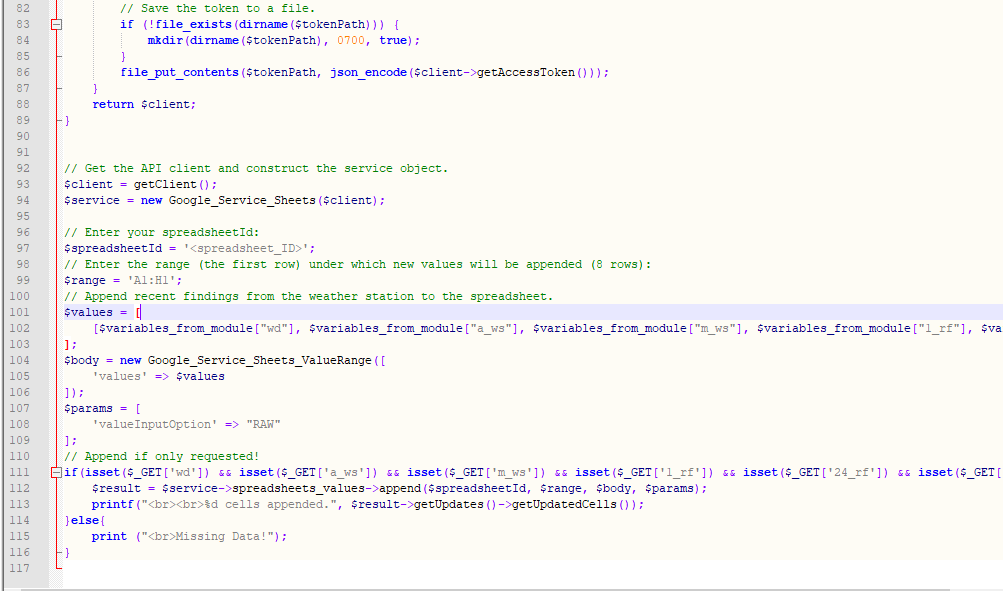
// 将令牌保存到文件中。
if (!file_exists(dirname($tokenPath))) {
mkdir(dirname($tokenPath), 0700 , true);
}
file_put_contents($tokenPath, json_encode($client->getAccessToken()));
} ⭐ 输入电子表格 ID 和范围以将气象站的最新发现附加到电子表格中。
https://docs.google.com/spreadsheets/d/spreadsheetId/edit#gid=0
// 输入您的电子表格 ID:
$spreadsheetId ='';
// 输入将追加新值的范围(第一行)(8 行) :
$range ='A1:H1';
// 将气象站的最新发现添加到电子表格中。
$values =[
 [$variables_from_module["wd" ], $variables_from_module["a_ws"], $variables_from_module["m_ws"], $variables_from_module["1_rf"], $variables_from_module["24_rf"], $variables_from_module["tem"], $variables_from_module["hum $variables_from_module["b_pr"]]
];
$body =new Google_Service_Sheets_ValueRange([
 'values' => $values
]);
$params =[
 'valueInputOption' => "RAW"
];

...

 $result =$service->spreadsheets_values->append( $spreadsheetId, $range, $body, $params);
 printf("

%d 个单元格追加。", $result->getUpdates()->getUpdatedCells());
💻 account_verification_token.php
⭐ 通过创建的 AuthUrl 授权 Web 应用程序后 , 输入给定的验证码以设置访问令牌。
$account_verification_token ="<输入令牌>"; // 授权后输入验证码。
步骤 3.1:在 Raspberry Pi(或任何服务器)上设置 Web 应用程序
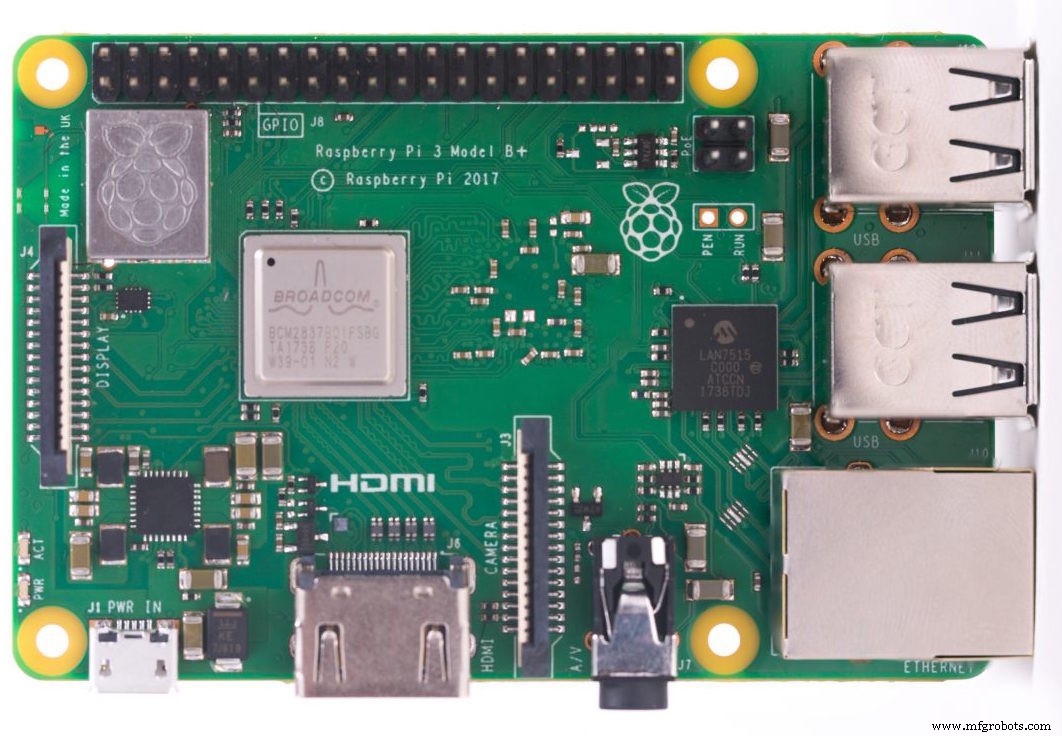
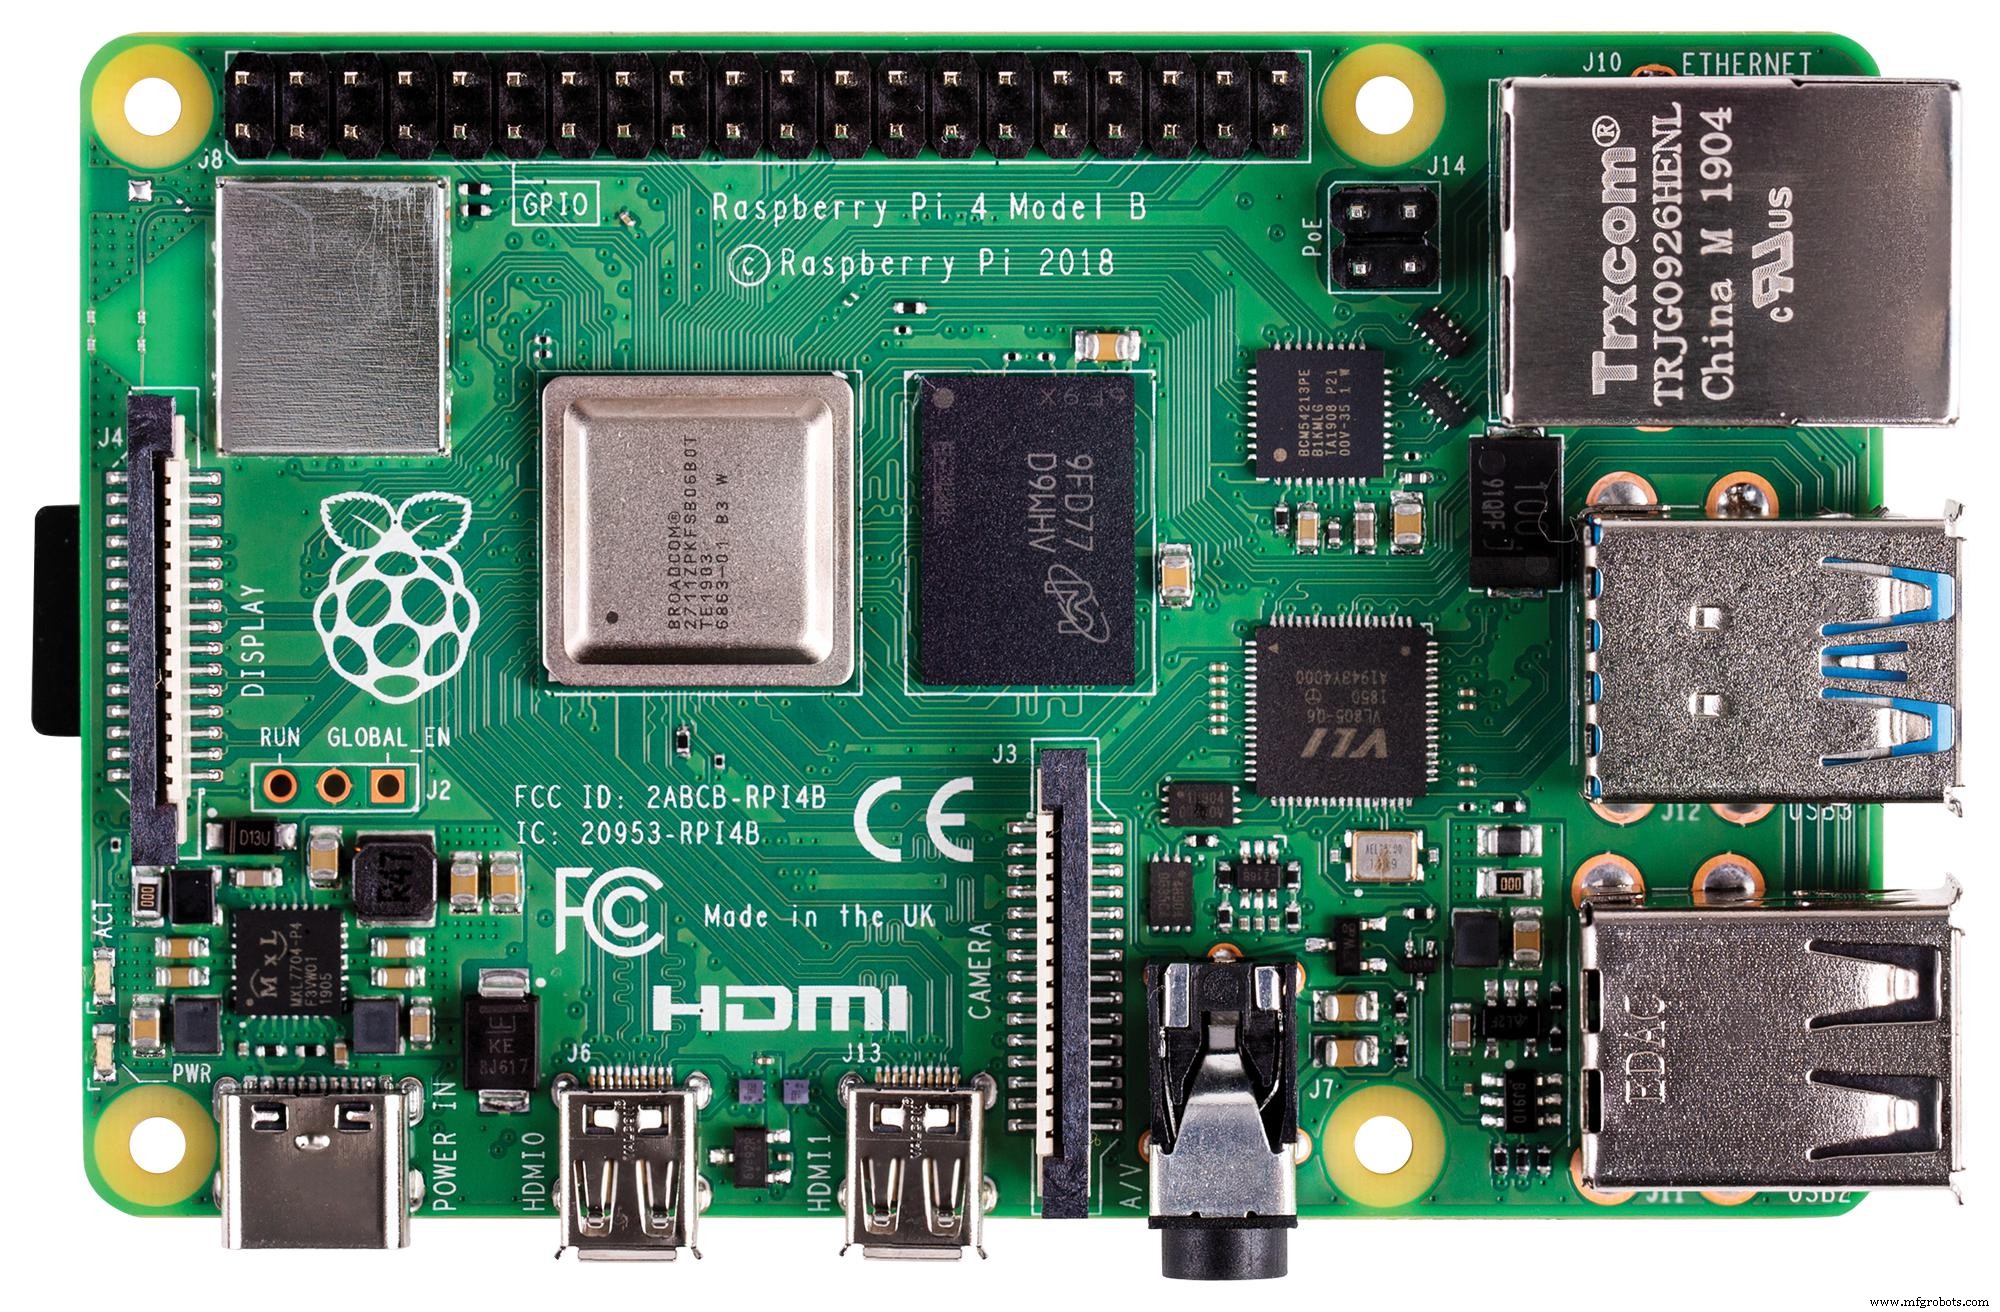
创建 PHP Web 应用程序后,我决定在我的 Raspberry Pi 上运行它,但您可以在任何服务器上运行该应用程序,只要它是 PHP 服务器即可。
如果您想使用树莓派,但不知道如何在树莓派上设置 LAMP 网络服务器,您可以查看本教程。
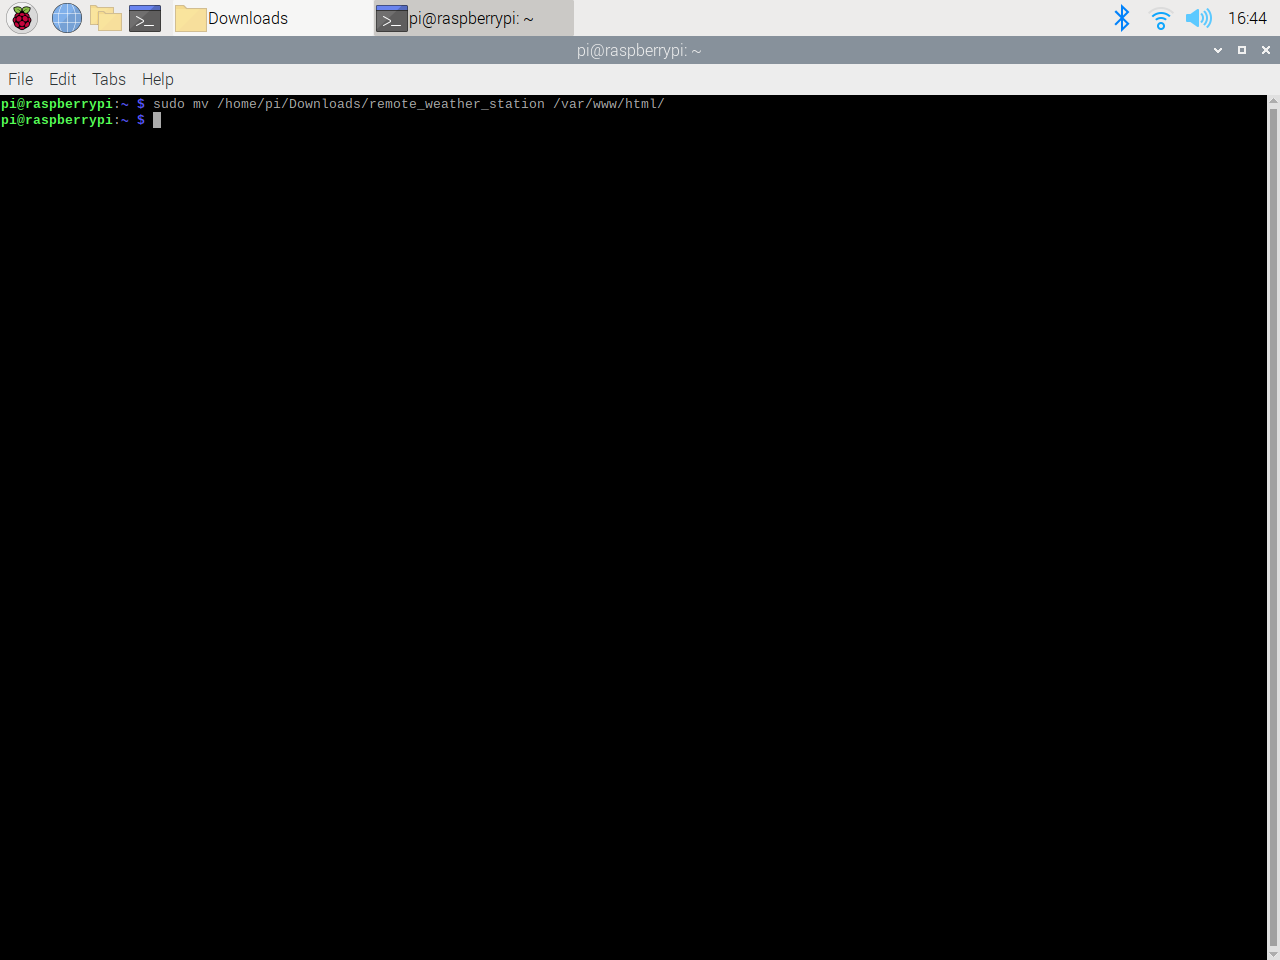
⭐首先,由于apache服务器是受保护的位置,因此使用终端将应用程序文件夹(remote_weather_station)移动到apache服务器(/var/www/html)。
sudo mv /home/pi/Downloads/remote_weather_station /var/www/html/
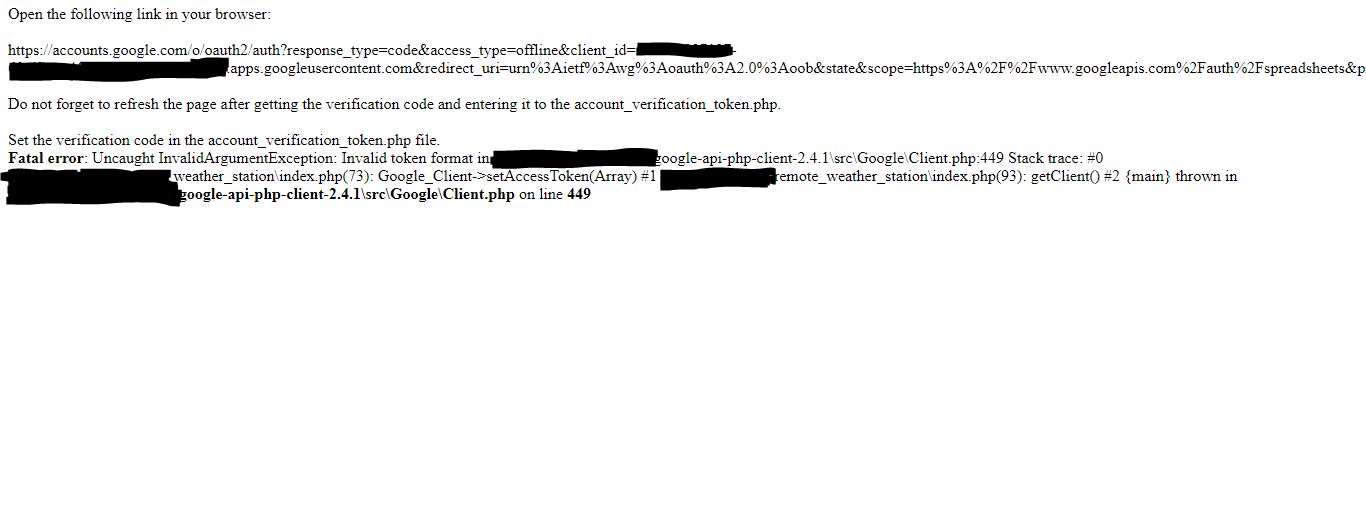
⭐ 由于缺少验证码,Web 应用程序在第一次打开时抛出错误。获取验证码,进入应用生成的授权链接。
⭐然后,点击转到远程气象站(不安全) .
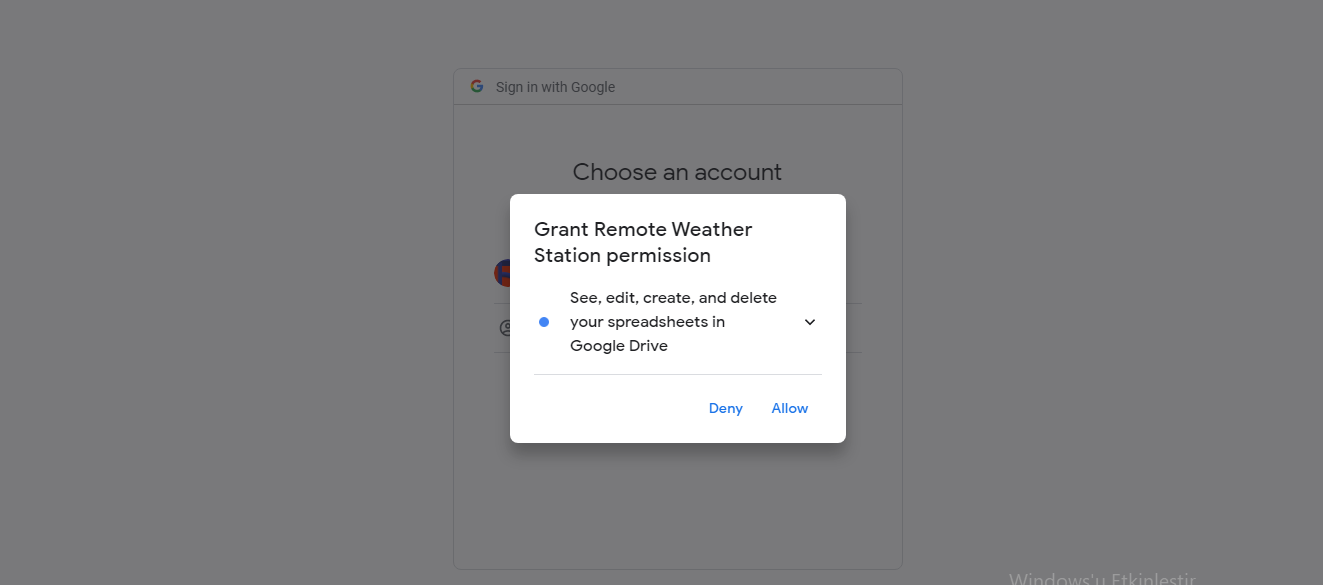
⭐ 授予应用所需的权限。
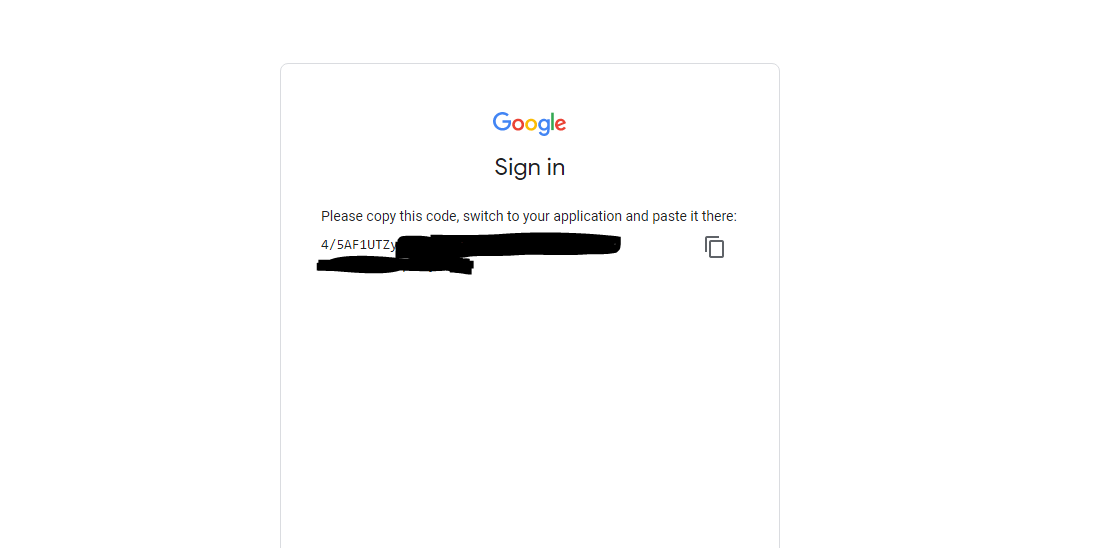
⭐现在,复制验证码并粘贴到account_verification_token.php .
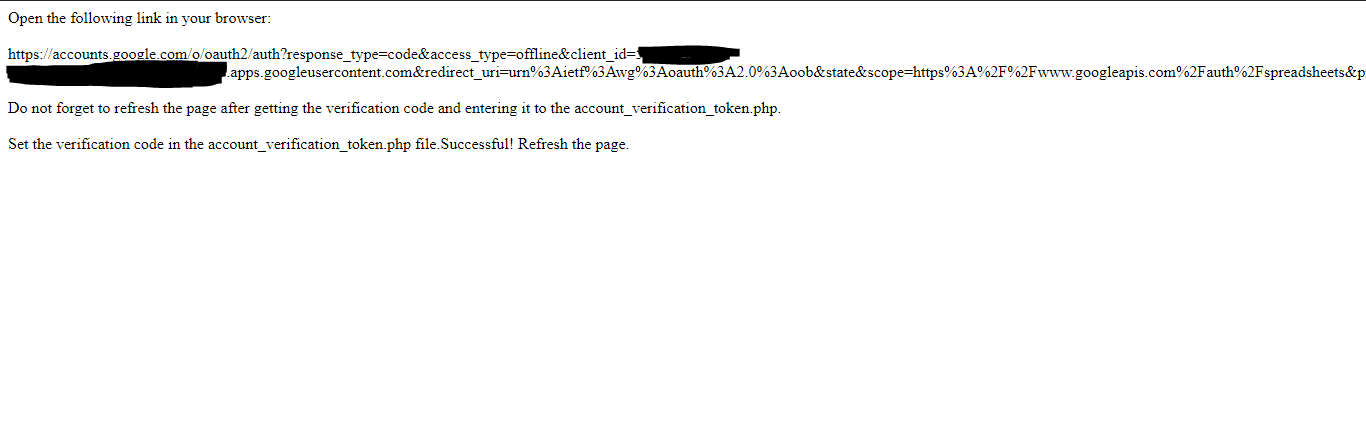
⭐ 返回 Web 应用程序。它应该显示确认消息:成功!刷新页面 .
⭐ 刷新页面后,Web 应用程序使用验证码获取访问令牌并将访问令牌保存在名为 token.json 的文件中 .因此,它不会再次抛出错误。

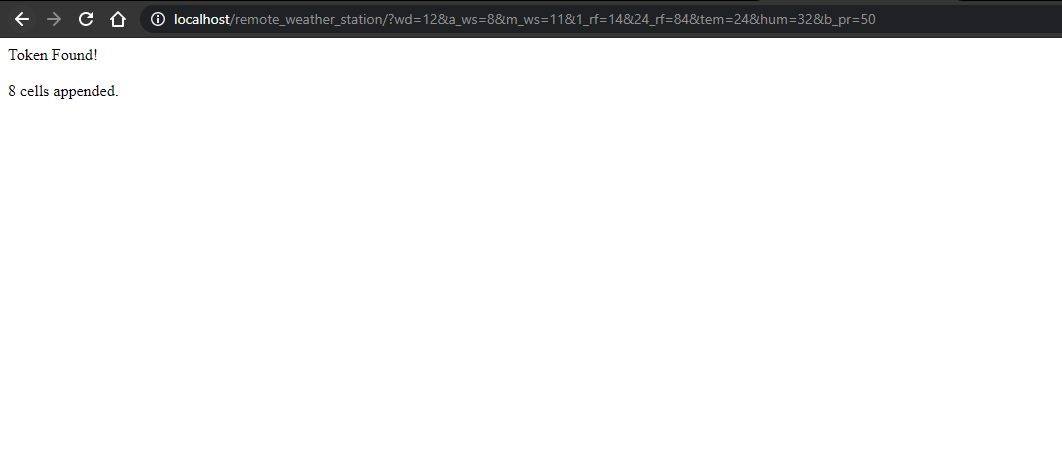
⭐ 要测试 PHP Web 应用程序是否准确地将新数据附加到给定的电子表格:
http://localhost/remote_weather_station/?wd=12&a_ws=8&m_ws=11&1_rf=14&24_rf=84&tem=24&hum=32&b_pr=57
第 4 步:使用 ESP8266(WiFi)读取和发送天气数据
为了在阳台上收集天气数据,我使用了 NodeMCU ESP-12E (ESP8266) 开发板和气象站。
我将其编程为每五分钟向 PHP Web 应用程序发送天气数据。

⭐ 包含所需的库并定义 WiFi 设置。
#include
#include
#include
#include
 #include

// 定义您的 WiFi 设置。
const char *ssid ="";
const char *password =" ";
⭐ 定义气象站设置和串行连接引脚 - D6、D5。
//定义气象站设置:
char databuffer[35];
double temp;
int transfer =0;

//定义串行连接引脚 - RX 和 TX。
SoftwareSerial Serial_1(D6, D5); // (Rx, Tx)
⭐ 在 getBuffer() 中 功能,从气象站获取数据。
void getBuffer(){
int index;
for (index =0;index <35;index ++){
if(Serial_1.available()){
databuffer[index] =Serial_1.read();
if (databuffer[0] !='c'){
index =-1;
}
}
else{
index --;
}
}
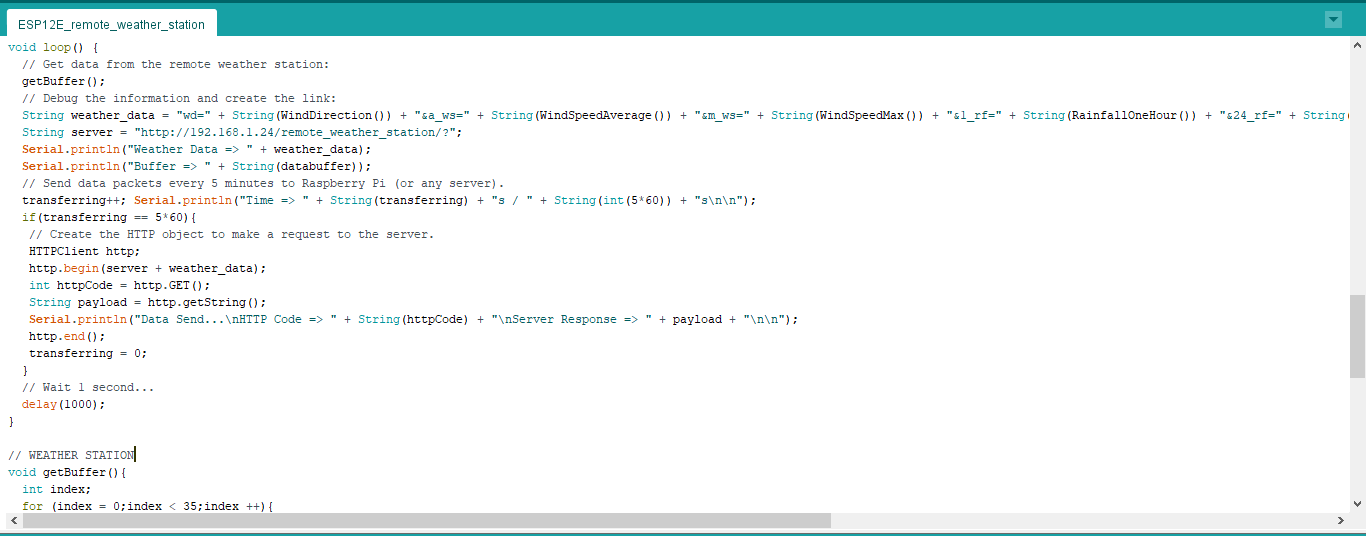
} ⭐ 调试天气数据并创建链接。
String weather_data ="wd=" + String(WindDirection()) + "&a_ws=" + String(WindSpeedAverage()) + "&m_ws=" + String(WindSpeedMax()) + "&1_rf=" + String(RainfallOneHour()) + "&24_rf=" + String(RainfallOneDay()) + "&tem=" + String(Temperature()) + "&hum=" + String(Humidity()) + "&b_pr=" + String( BarPressure());
String server ="http://192.168.1.24/remote_weather_station/?";

...

int WindDirection(){返回 transCharToInt(databuffer,1,3); } // 风向(度)

float WindSpeedAverage(){ temp =0.44704 * transCharToInt(databuffer,5,7);返回温度; } // 平均空速(1 分钟)

float WindSpeedMax(){ temp =0.44704 * transCharToInt(databuffer,9,11);返回温度; } //最大空气速度(5分钟)

float Temperature(){ temp =(transCharToInt(databuffer,13,15) - 32.00) * 5.00 / 9.00;返回温度; } // 温度 ("C")

float RainfallOneHour(){ temp =transCharToInt(databuffer,17,19) * 25.40 * 0.01;返回温度; } // 降雨量(1 小时)

float RainfallOneDay(){ temp =transCharToInt(databuffer,21,23) * 25.40 * 0.01;返回温度; } // 降雨量(24 小时)

int Humidity(){ return transCharToInt(databuffer,25,26); } // 湿度 (%)

float BarPressure(){ temp =transCharToInt(databuffer,28,32);返回温度 / 10.00; } // Barometric Pressure (hPA)
⭐ Send data packets every 5 minutes to Raspberry Pi (or any server).
transferring++; Serial.println("Time => " + String(transferring) + "s / " + String(int(5*60)) + "s\n\n");
 if(transferring ==5*60){
 // Create the HTTP object to make a request to the server.
 HTTPClient http;
 http.begin(server + weather_data);
 int httpCode =http.GET();
 String payload =http.getString();
 Serial.println("Data Send...\nHTTP Code => " + String(httpCode) + "\nServer Response => " + payload + "\n\n");
 http.end();
 transferring =0;
 }
 // Wait 1 second...
 delay(1000);
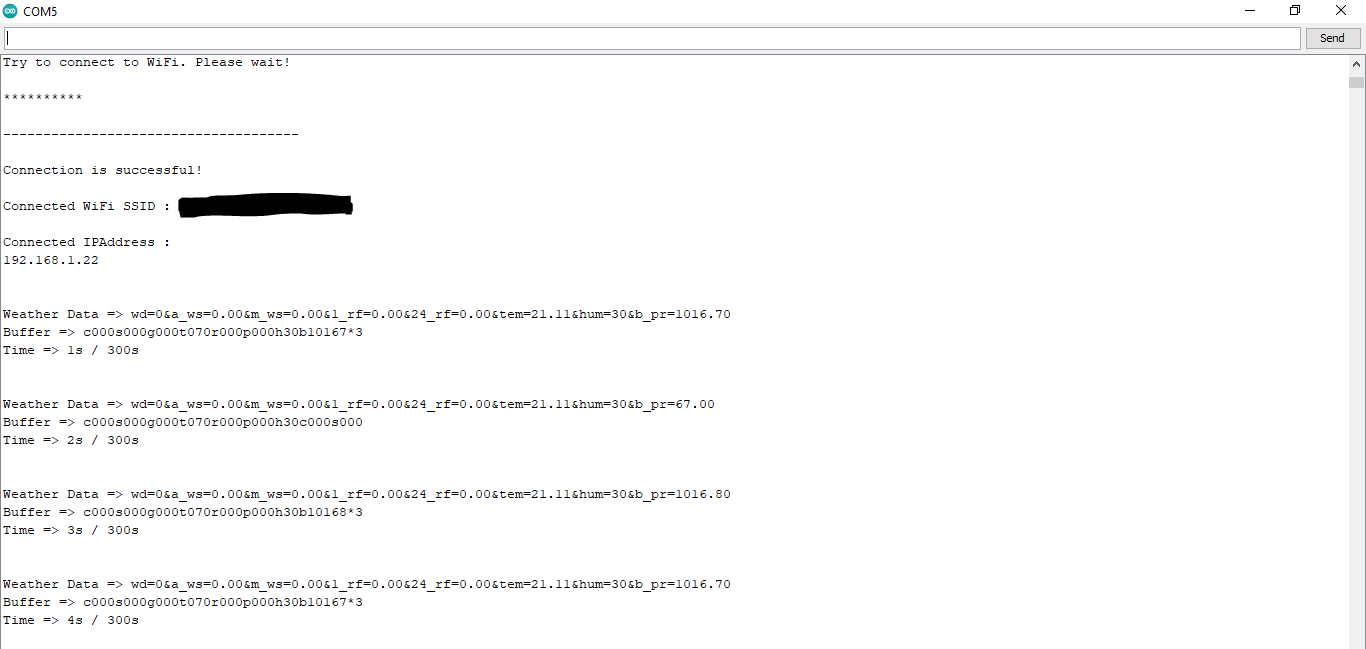
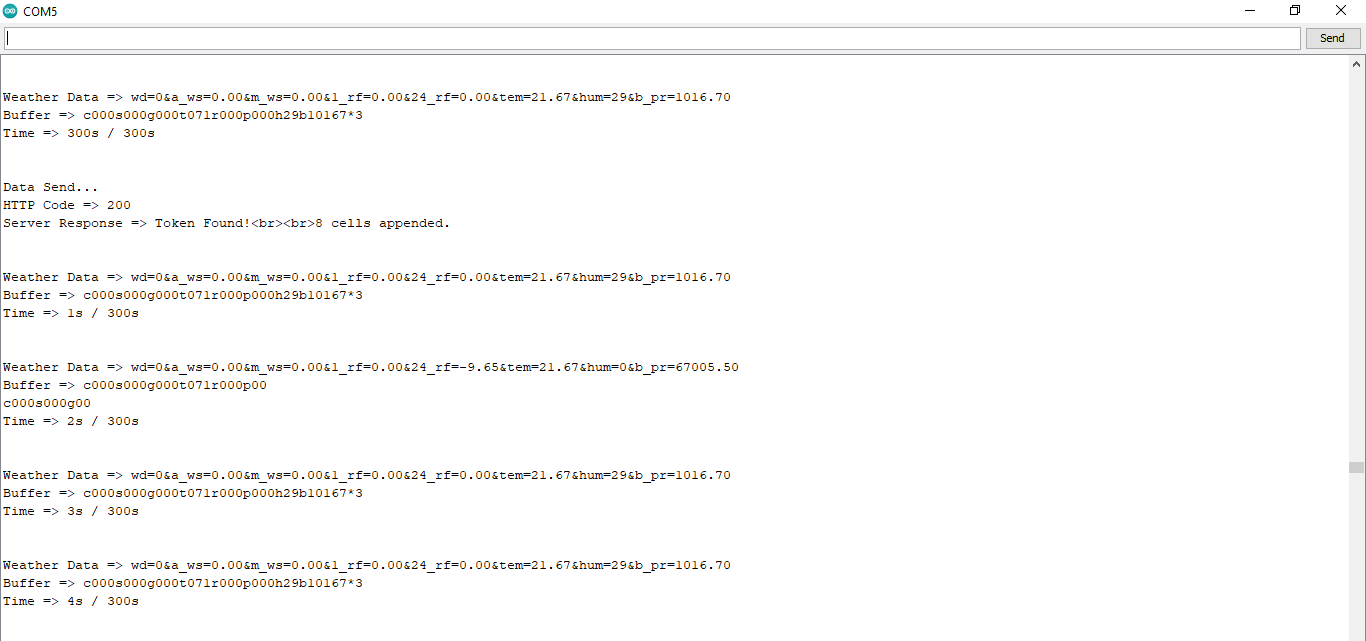
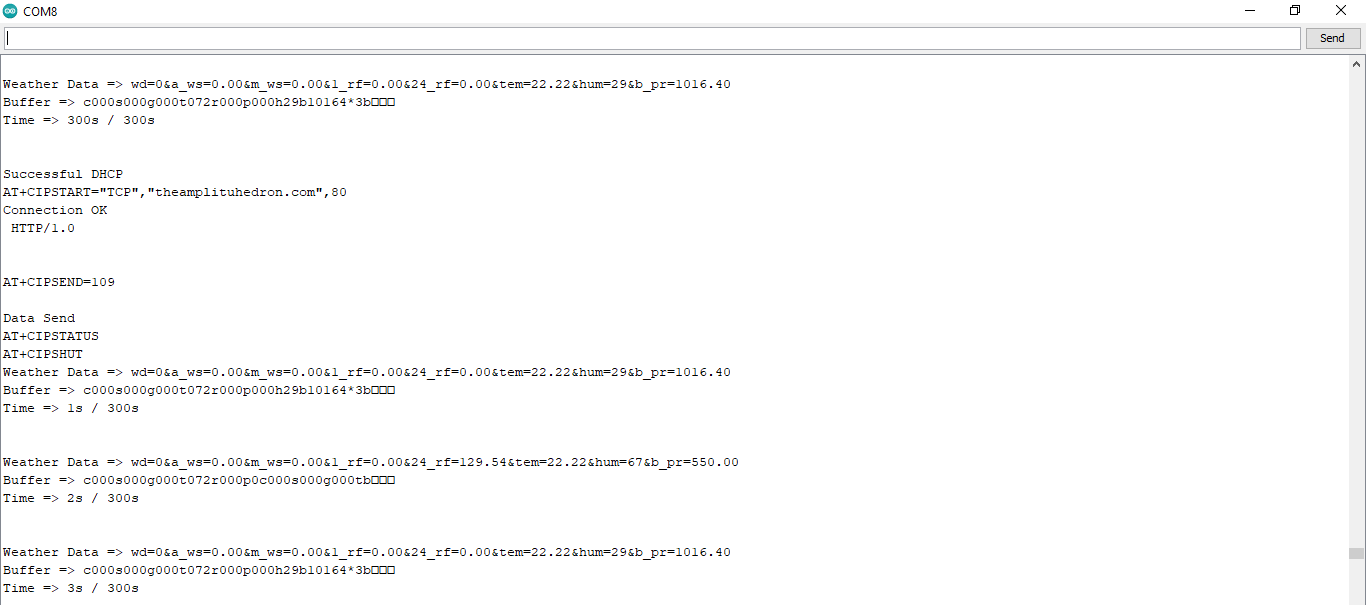
⭐ After uploading the code to the NodeMCU ESP-12E (ESP8266) development board, it displays weather data every second on the serial monitor and sends data packets every five minutes (300 seconds) to the PHP web application.
Connection is successful!

...

Weather Data => wd=0&a_ws=0.00&m_ws=0.00&1_rf=0.00&24_rf=0.00&tem=21.67&hum=29&b_pr=1016.70
Buffer => c000s000g000t071r000p000h29b10167*3
Time => 299s / 300s


Weather Data => wd=0&a_ws=0.00&m_ws=0.00&1_rf=0.00&24_rf=0.00&tem=21.67&hum=29&b_pr=1016.70
Buffer => c000s000g000t071r000p000h29b10167*3
Time => 300s / 300s

...
⭐ Then, it shows the response from the server.
...

Data Send...
HTTP Code => 200
Server Response => Token Found!

8 cells appended.

...
Step 4.1:Reading and sending weather data with SIM808 (GPRS)
To collect weather data in my backyard, I used a SIM808 shield for Arduino Uno if the distance between the weather station and my router is too far away.
Most of the code is the same and covered in the previous step aside from the parts below.
⭐ Include required libraries and define the sim808 object.
For SIM808 GPS/GPRS/GSM Shield | Download
#include
#include

// Define the sim808.
DFRobot_SIM808 sim808(&Serial);
⭐ Initialize the SIM808 module and continue if it is working accurately.
//******** Initialize sim808 module *************
 while(!sim808.init()) {
 delay(1000);
 Serial.print("Sim808 init error\r\n");
 }
 delay(2000);
 // Continue if the SIM808 Module is working accurately.
 Serial.println("Sim808 init success");
 delay(5000);
⭐ Send data packets every 5 minutes to the server by establishing a TCP connection to make a GET request.
transferring++; Serial.println("Time => " + String(transferring) + "s / " + String(int(5*60)) + "s\n\n");
if(transferring ==5*60){
//*********** Attempt DHCP *******************
while(!sim808.join(F("cmnet"))) {
Serial.println("Sim808 join network error!");
delay(2000);
}
//************ Successful DHCP ****************
delay(5000);
Serial.println("Successful DHCP");
//*********** Establish a TCP connection ************
if(!sim808.connect(TCP,"192.168.1.24", 80)) { // Change it with your server.
Serial.println("Connection Error");
}else{
Serial.println("Connection OK");
}
delay(2000);
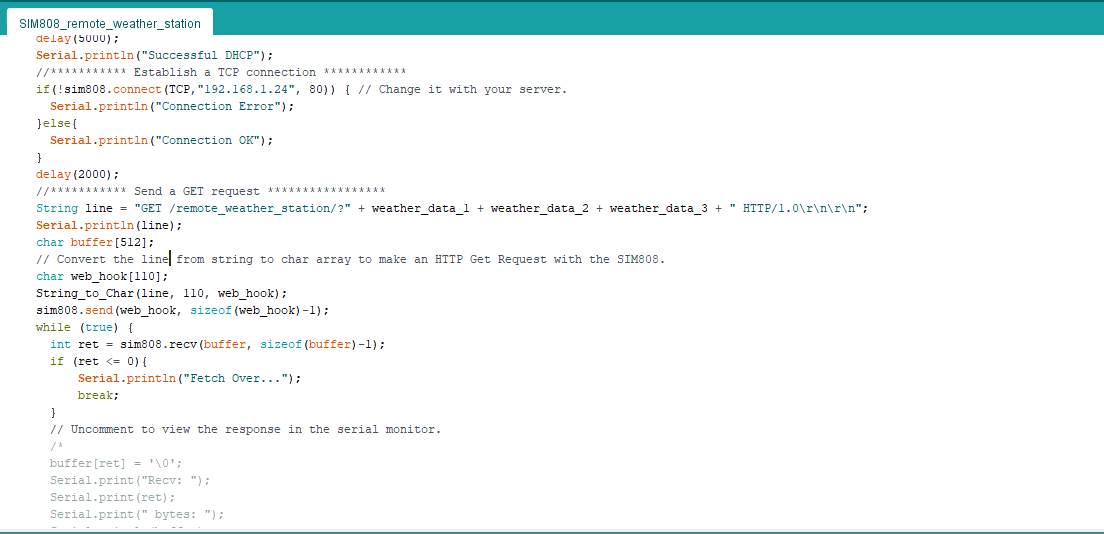
... ⭐ After creating the line string, convert it from string to char array to make an HTTP Get Request with the SIM808.
...

 String line ="GET /remote_weather_station/?" + weather_data_1 + weather_data_2 + weather_data_3 + " HTTP/1.0\r\n\r\n";
 Serial.println(line);
 char buffer[512];
 // Convert the line from string to char array to make an HTTP Get Request with the SIM808.
 char web_hook[110];
 String_to_Char(line, 110, web_hook);
 sim808.send(web_hook, sizeof(web_hook)-1);
 while (true) {
 int ret =sim808.recv(buffer, sizeof(buffer)-1);
 if (ret <=0){
 Serial.println("Fetch Over...");
 break;
 }

 ...
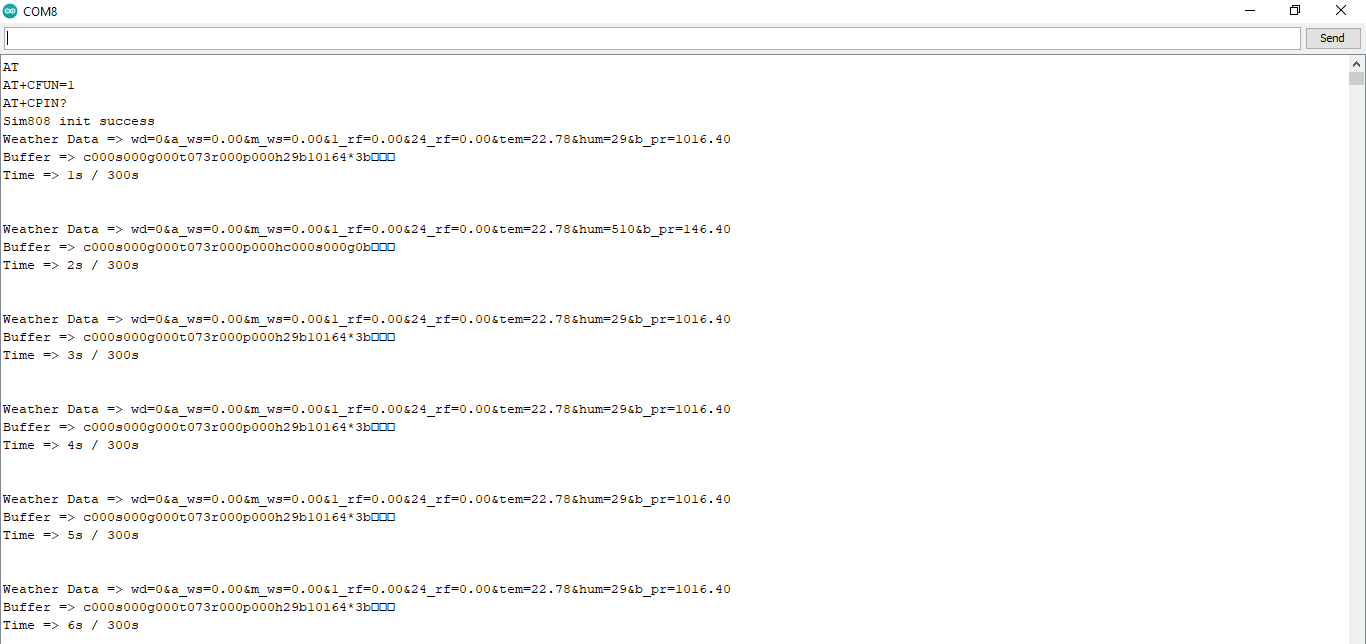
⭐ After uploading the code to the SIM808 shield, it displays weather data every second on the serial monitor and sends data packets every five minutes (300 seconds) to the PHP web application.
Step 4.2:Creating the weather data set for more than three months
After finishing coding, I started to collate weather data on Google Sheets every five minutes for more than three months to build a neural network model and make predictions on the rainfall intensity.
Collected Weather Data:
- Wind Direction (deg)
- Average Wind Speed (m/s)
- Max Wind Speed (m/s)
- One-Hour Rainfall (mm)
- 24-Hours Rainfall (mm)
- Temperature (°C)
- Humidity (%)
- Barometric Pressure (hPa)
Then, I downloaded the spreadsheet as Remote Weather Station.csv , consisting of 32219 rows as my preliminary local weather data set. I am still collating weather data to improve my data set and model :)
Step 5:Building an Artificial Neural Network (ANN) with TensorFlow
When I completed collating my preliminary local weather data set, I started to work on my artificial neural network (ANN) model to make predictions on the rainfall intensity.
I decided to create my neural network model with TensorFlow in Python. So, first of all, I followed the steps below to grasp a better understanding of the weather data:
- Data Visualization
- Data Scaling (Normalizing)
- Data Preprocessing
- Data Splitting
After applying these steps, I decided to use my neural network model to classify different rainfall intensity classes theoretically assigned as labels (outputs) for each input (row). I created my classes according to the rate of precipitation, which depends on the considered time.
The following categories are used to classify rainfall intensity by the rate of precipitation (rainfall):
- Light rain — when the precipitation rate is <2.5 mm per hour
- Moderate rain — when the precipitation rate is between 2.5 mm and 7.6 mm per hour
- Heavy rain — when the precipitation rate is between 7.6 mm and 50 mm per hour
- Violent rain — when the precipitation rate is> 50 mm per hour
According to the precipitation (rainfall) rates, I preprocessed the weather data to assign one of these five classes for each input as its label:
- 0 (None)
- 1 (Light Rain)
- 2 (Moderate Rain)
- 3 (Heavy Rain)
- 4 (Violent Rain)
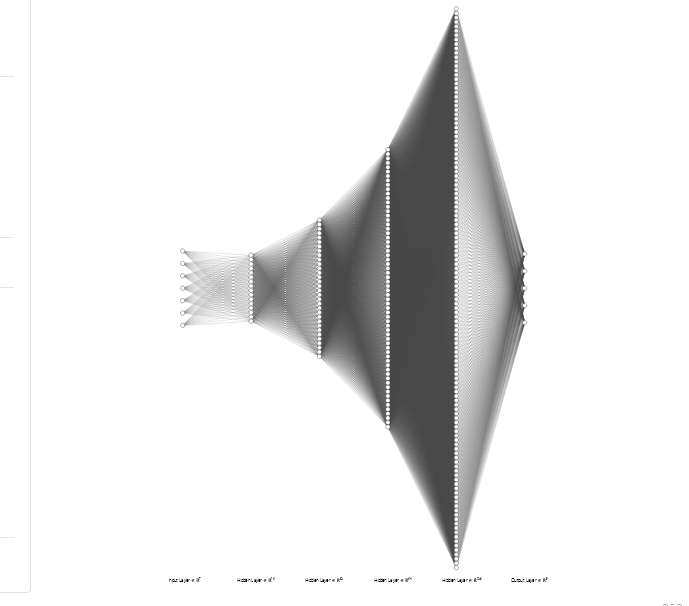
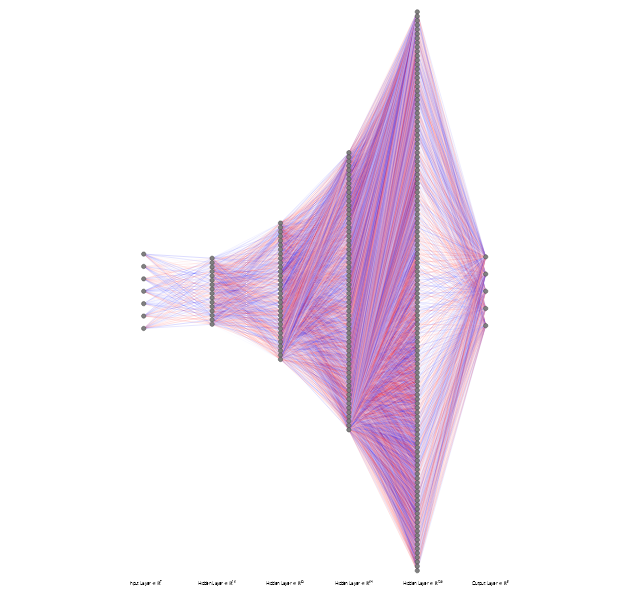
After scaling (normalizing) and preprocessing the weather data, I elicited seven input variables and one label for each reading, classified with the five mentioned classes. Then, I built an artificial neural network model with TensorFlow to obtain the best possible results and predictions with my preliminary data set.
Layers:
- 7 [Input]
- 16 [Hidden]
- 32 [Hidden]
- 64 [Hidden]
- 128 [Hidden]
- 5 [Output]
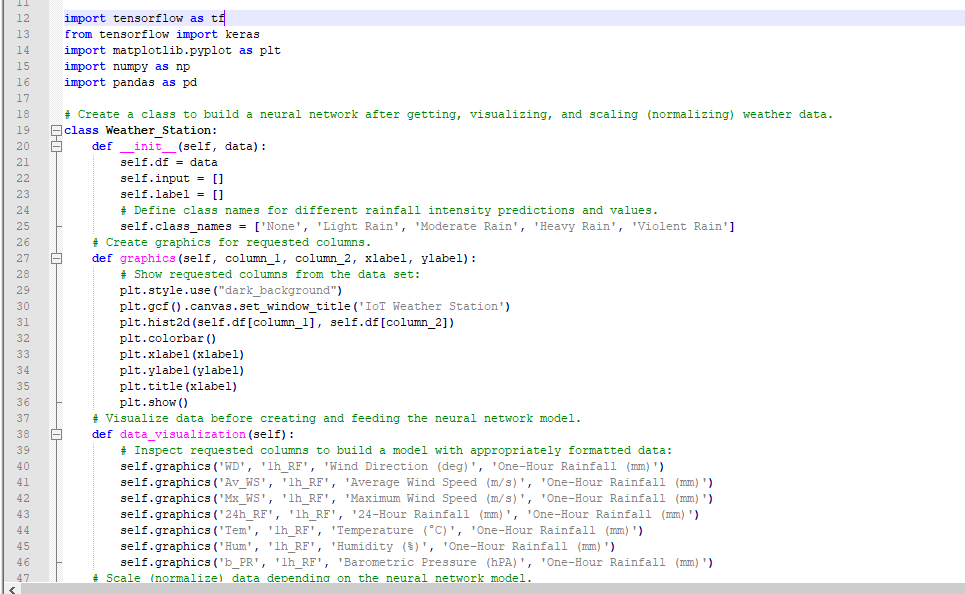
To execute all steps above, I created a class named Weather_Station in Python after including the required libraries:
import tensorflow as tf
from tensorflow import keras
import matplotlib.pyplot as plt
import numpy as np
import pandas as pd
Subsequently, I will discuss coding in Python for each step I mentioned above.
Also, you can download IoT_weather_station_neural_network.py to inspect coding.
Step 5.1:Visualizing and scaling (normalizing) the weather data
Before diving in to build a model, it is important to understand the weather data to pass the model appropriately formatted data.
So, in this step, I will show you how to visualize weather data and scale (normalize) in Python.
⭐ First of all, read the weather data from Remote Weather Station.csv .
csv_path ="E:\PYTHON\Remote Weather Station.csv"
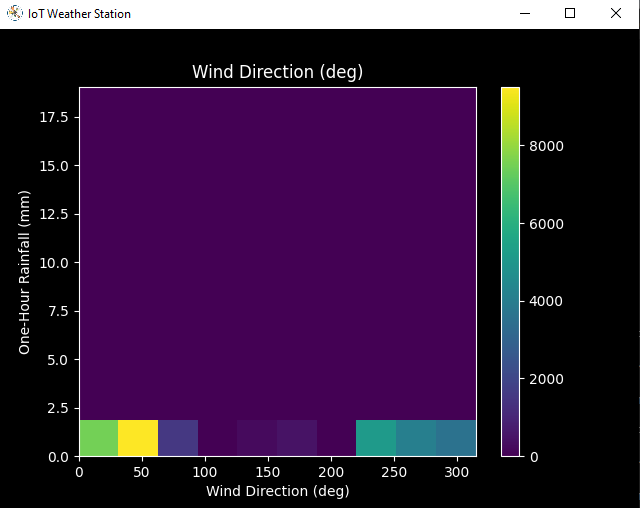
df =pd.read_csv(csv_path) ⭐ In the graphics() function, visualize the requested columns from the weather data set by using the Matplotlib library.
def graphics(self, column_1, column_2, xlabel, ylabel):
# Show requested columns from the data set:
plt.style.use("dark_background")
plt.gcf().canvas.set_window_title('IoT Weather Station')
plt.hist2d(self.df[column_1], self.df[column_2])
plt.colorbar()
plt.xlabel(xlabel)
plt.ylabel(ylabel)
plt.title(xlabel)
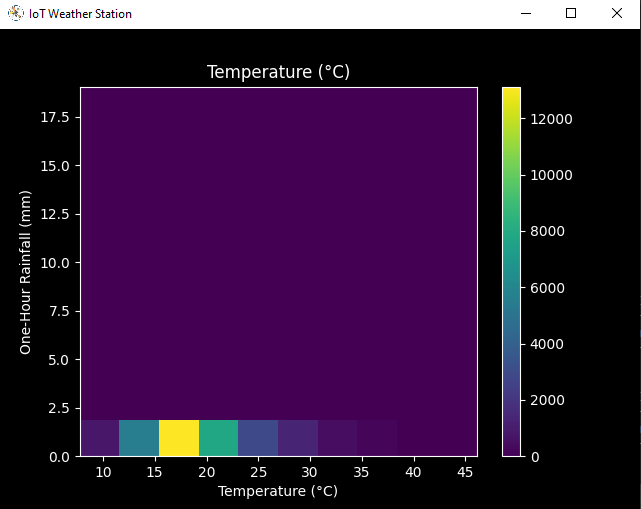
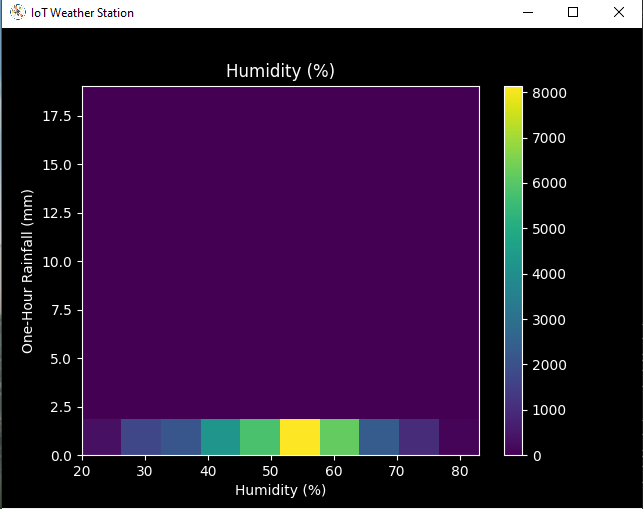
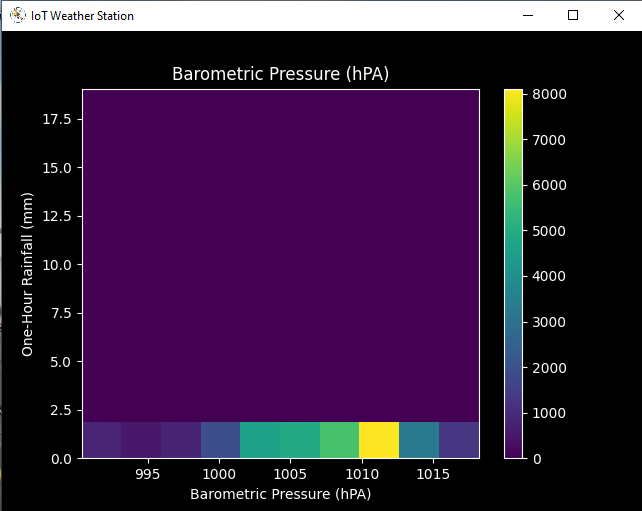
plt.show() ⭐ In the data_visualization() function, inspect all columns before scaling weather data to build a model with appropriately formatted data.
def data_visualization(self):
 # Inspect requested columns to build a model with appropriately formatted data:
 self.graphics('WD', '1h_RF', 'Wind Direction (deg)', 'One-Hour Rainfall (mm)')
 self.graphics('Av_WS', '1h_RF', 'Average Wind Speed (m/s)', 'One-Hour Rainfall (mm)')
 self.graphics('Mx_WS', '1h_RF', 'Maximum Wind Speed (m/s)', 'One-Hour Rainfall (mm)')
 self.graphics('24h_RF', '1h_RF', '24-Hour Rainfall (mm)', 'One-Hour Rainfall (mm)')
 self.graphics('Tem', '1h_RF', 'Temperature (°C)', 'One-Hour Rainfall (mm)')
 self.graphics('Hum', '1h_RF', 'Humidity (%)', 'One-Hour Rainfall (mm)')
 self.graphics('b_PR', '1h_RF', 'Barometric Pressure (hPA)', 'One-Hour Rainfall (mm)')
After visualizing weather data, I scaled (normalized) each column to format it properly.
Normally, each row (reading) looked like this before scaling:
- 315, 0.45, 0, 0.51, 0.51, 22.78, 65, 1005.5
⭐ In the scale_data() function:
⭐ The wind direction in units of degrees and angles do not make good model inputs. 360° and 0° should be close to each other and wrap around smoothly. The direction should not matter if the wind is not blowing. Thus, convert the wind direction and velocity columns to a wind vector to interpret them easily with a neural network model.
def scale_data(self):
 # Wind Direction and Speed:
 wv =self.df.pop('Av_WS')
 max_wv =self.df.pop('Mx_WS')
 # Convert to radians.
 wd_rad =self.df.pop('WD')*np.pi / 180
 # Calculate the wind x and y components.
 self.df['scaled_WX'] =wv*np.cos(wd_rad)
 self.df['scaled_WY'] =wv*np.sin(wd_rad)
 # Calculate the max wind x and y components.
 self.df['scaled_max_WX'] =max_wv*np.cos(wd_rad)
 self.df['scaled_max_WY'] =max_wv*np.sin(wd_rad)

 ...
⭐ For the remaining columns except for 1h_RF , divide them into average reading values to scale (normalize) and format.
...

 # Temperature:
 tem =self.df.pop('Tem')
 self.df['scaled_Tem'] =tem / 25
 # Humidity:
 hum =self.df.pop('Hum')
 self.df['scaled_Hum'] =hum / 70
 # Barometric Pressure:
 bPR =self.df.pop('b_PR')
 self.df["scaled_bPR"] =bPR / 1013
 # 24 Hour Rainfall (Approx.)
 rain_24 =self.df.pop('24h_RF')
 self.df['scaled_24h_RF'] =rain_24 / 24
After completing scaling (normalizing), I extracted these new columns from the weather data set:
- scaled_WX
- scaled_WY
- scaled_max_WX
- scaled_max_WY
- scaled_Tem
- scaled_Hum
- scaled_bPR
- scaled_24h_RF
Step 5.2:Training the model (ANN) on the rainfall intensity classes
Before building and training a neural network model in TensorFlow, I needed to create the input array and the label array by preprocessing the scaled and normalized weather data set.
⭐ In the create_input_and_label() function:
⭐ Firstly, append each input element as a NumPy array to the input array and convert it to a NumPy array by using the asarray() function.
⭐ Each input element includes seven variables [shape=(7, )]:
- [scaled_WX, scaled_WY, scaled_max_WX, scaled_max_WY, scaled_Tem, scaled_Hum, scaled_bPR]
def create_input_and_label(self):
 n =len(self.df)
 # Create the input array using the scaled variables:
 for i in range(n):
 self.input.append(np.array([self.df['scaled_WX'][i], self.df['scaled_WY'][i], self.df['scaled_max_WX'][i], self.df['scaled_max_WY'][i], self.df['scaled_Tem'][i], self.df['scaled_Hum'][i], self.df['scaled_bPR'][i]]))
 self.input =np.asarray(self.input)

 ...
⭐ Then, evaluate the approximate rainfall (precipitation) rate for each reading (row).
approx_RF_rate =(1h_RF + scaled_24h_RF) * 100
⭐ According to the rainfall rate, assign a class [0 - 4] for each input element and append them to the label array.
...
for i in range(n):
_class =0
# Evaluate the approximate rainfall rate:
approx_RF_rate =(self.df['1h_RF'][i] + self.df['scaled_24h_RF'][i]) * 100
# As labels, assign classes of rainfall intensity according to the approximate rainfall rate (mm):
if approx_RF_rate ==0:
_class =0
elif approx_RF_rate <2.5:
_class =1
elif 2.5
elif 7.6
else:
_class =4
self.label.append(_class)
self.label =np.asarray(self.label) After preprocessing the scaled weather data to create input and label arrays, I split them as training (60%) and test (40%) data sets:
def split_data(self):
n =len(self.df)
# (60%, 40%) - (training, test)
self.train_input =self.input[0:int(n*0.6)]
self.test_input =self.input[int(n*0.6):]
self.train_label =self.label[0:int(n*0.6)]
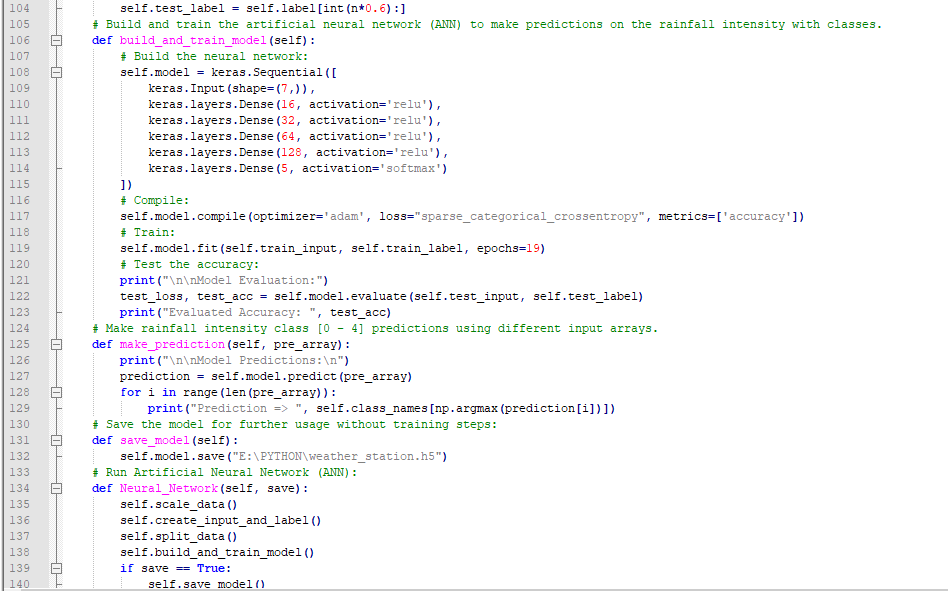
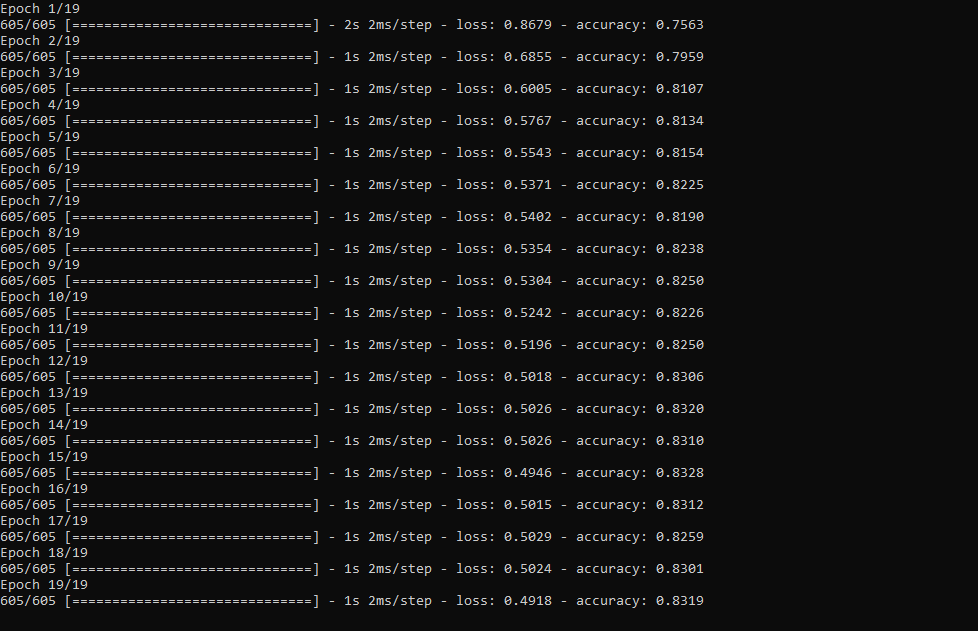
self.test_label =self.label[int(n*0.6):] Then, I built my artificial neural network (ANN) model by using Keras and trained it with the training data set for nineteen epochs.
You can inspect these tutorials to learn about activation functions, loss functions, epochs, etc.
def build_and_train_model(self):
 # Build the neural network:
 self.model =keras.Sequential([
 keras.Input(shape=(7,)),
 keras.layers.Dense(16, activation='relu'),
 keras.layers.Dense(32, activation='relu'),
 keras.layers.Dense(64, activation='relu'),
 keras.layers.Dense(128, activation='relu'),
 keras.layers.Dense(5, activation='softmax')
 ])
 # Compile:
 self.model.compile(optimizer='adam', loss="sparse_categorical_crossentropy", metrics=['accuracy'])
 # Train:
 self.model.fit(self.train_input, self.train_label, epochs=19)

 ...
After training with the preliminary training data set, the accuracy of the model is between 0.83 and 0.85 .
Step 5.3:Evaluating the model and making predictions on the rainfall intensity
After building and training my artificial neural network model, I tested its accuracy by using the preliminary testing data set.
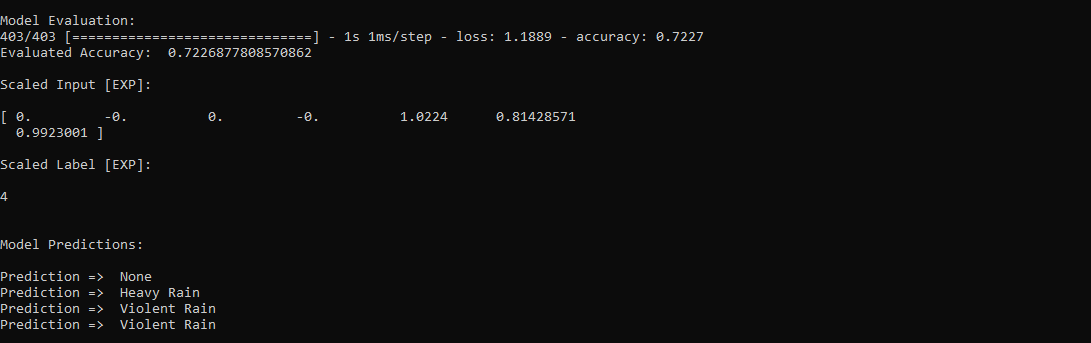
For now, the evaluated accuracy of the model is between 0.72 and 0.73 due to inadequate testing data set overfitting the model. However, I am still collecting weather data to improve the model accuracy.
...

 # Test the accuracy:
 print("\n\nModel Evaluation:")
 test_loss, test_acc =self.model.evaluate(self.test_input, self.test_label)
 print("Evaluated Accuracy:", test_acc)
Then, I used my neural network model to make predictions on the rainfall intensity with a given prediction array consisting of readings from the weather station after the training of the model. As a starting point, the model works fine :)
The model predicts possibilities of labels for each input element as an array of 5 numbers. They represent the model's "confidence" that the given input element corresponds to each of the five different classes of rainfall intensity [0 - 4].
⭐ In the make_prediction() function, make a prediction for each input element in a given array and get the most accurate label [0 - 4] by using the argmax() function to display its class name.
def make_prediction(self, pre_array):
 print("\n\nModel Predictions:\n")
 prediction =self.model.predict(pre_array)
 for i in range(len(pre_array)):
 print("Prediction => ", self.class_names[np.argmax(prediction[i])])
Prediction Inputs:
- [0, 0, 0.31819805, 0.31819805, 0.6988, 0.81498571, 0.99349753]
- [0, -0, 0, -0, 0.8444, 1, 0.96835143]
- [0, 0, 0.45, 0, 0.87577, 0.95857143, 1.00128332]
- [-0, -0, -0, -0, 0.8224, 1.05714286, 0.99279368]
Prediction Outputs:
- 0 [None]
- 3 [Heavy Rain]
- 4 [Violent Rain]
- 4 [Violent Rain]

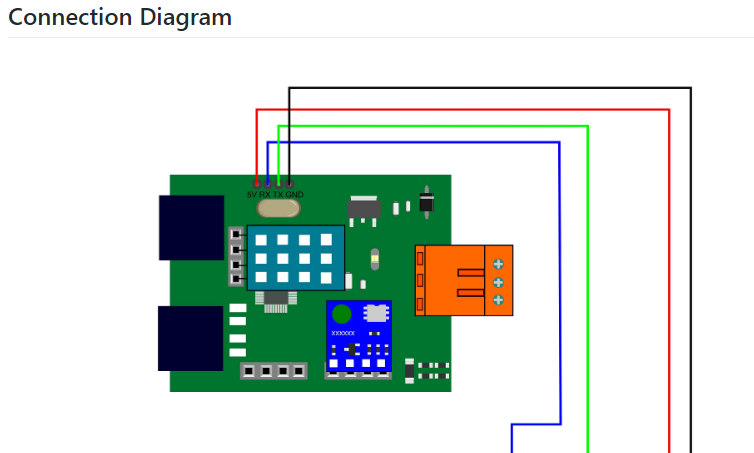
Connections and Adjustments (ESP8266)
// Connections
// NodeMCU ESP-12E (ESP8266) :
// Weather Station
// VV --------------------------- 5V
// D5 --------------------------- RX
// D6 --------------------------- TX
// G --------------------------- GND
I connected the sensor (converter) board to the NodeMCU ESP-12E (ESP8266) development board and fastened them to a plastic box while collecting weather data at my balcony.
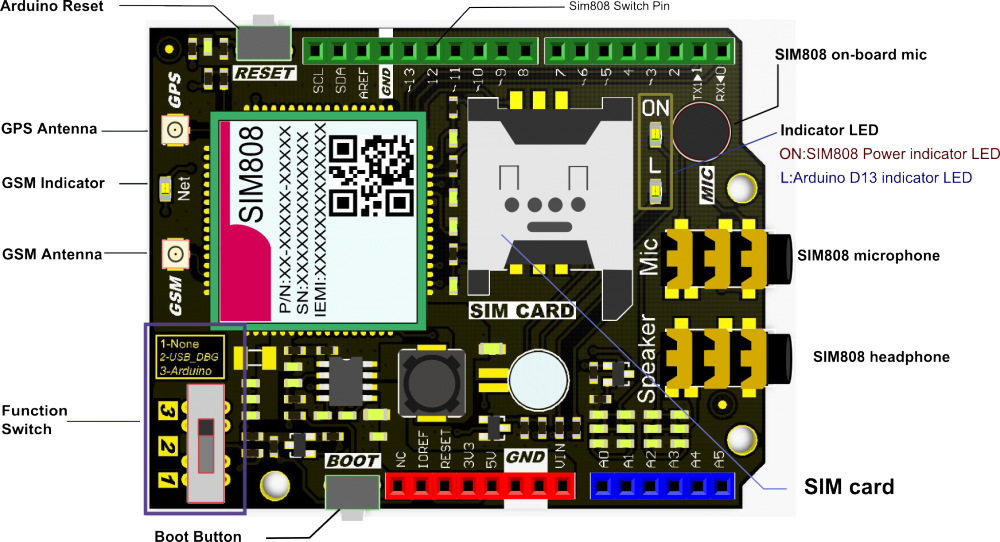
Connections and Adjustments (SIM808)
// Connections
// Arduino Uno:
// SIM808 GPS/GPRS/GSM Shield For Arduino
// D0 --------------------------- RX
// D1 --------------------------- TX
// D12 --------------------------- POWER
// Weather Station
// 5V --------------------------- 5V
// D5 --------------------------- RX
// D6 --------------------------- TX
// GND --------------------------- GND
⭐ Note:D0, D1, D12 pins are occupied by the SIM808 GPS/GPRS/GSM Shield.
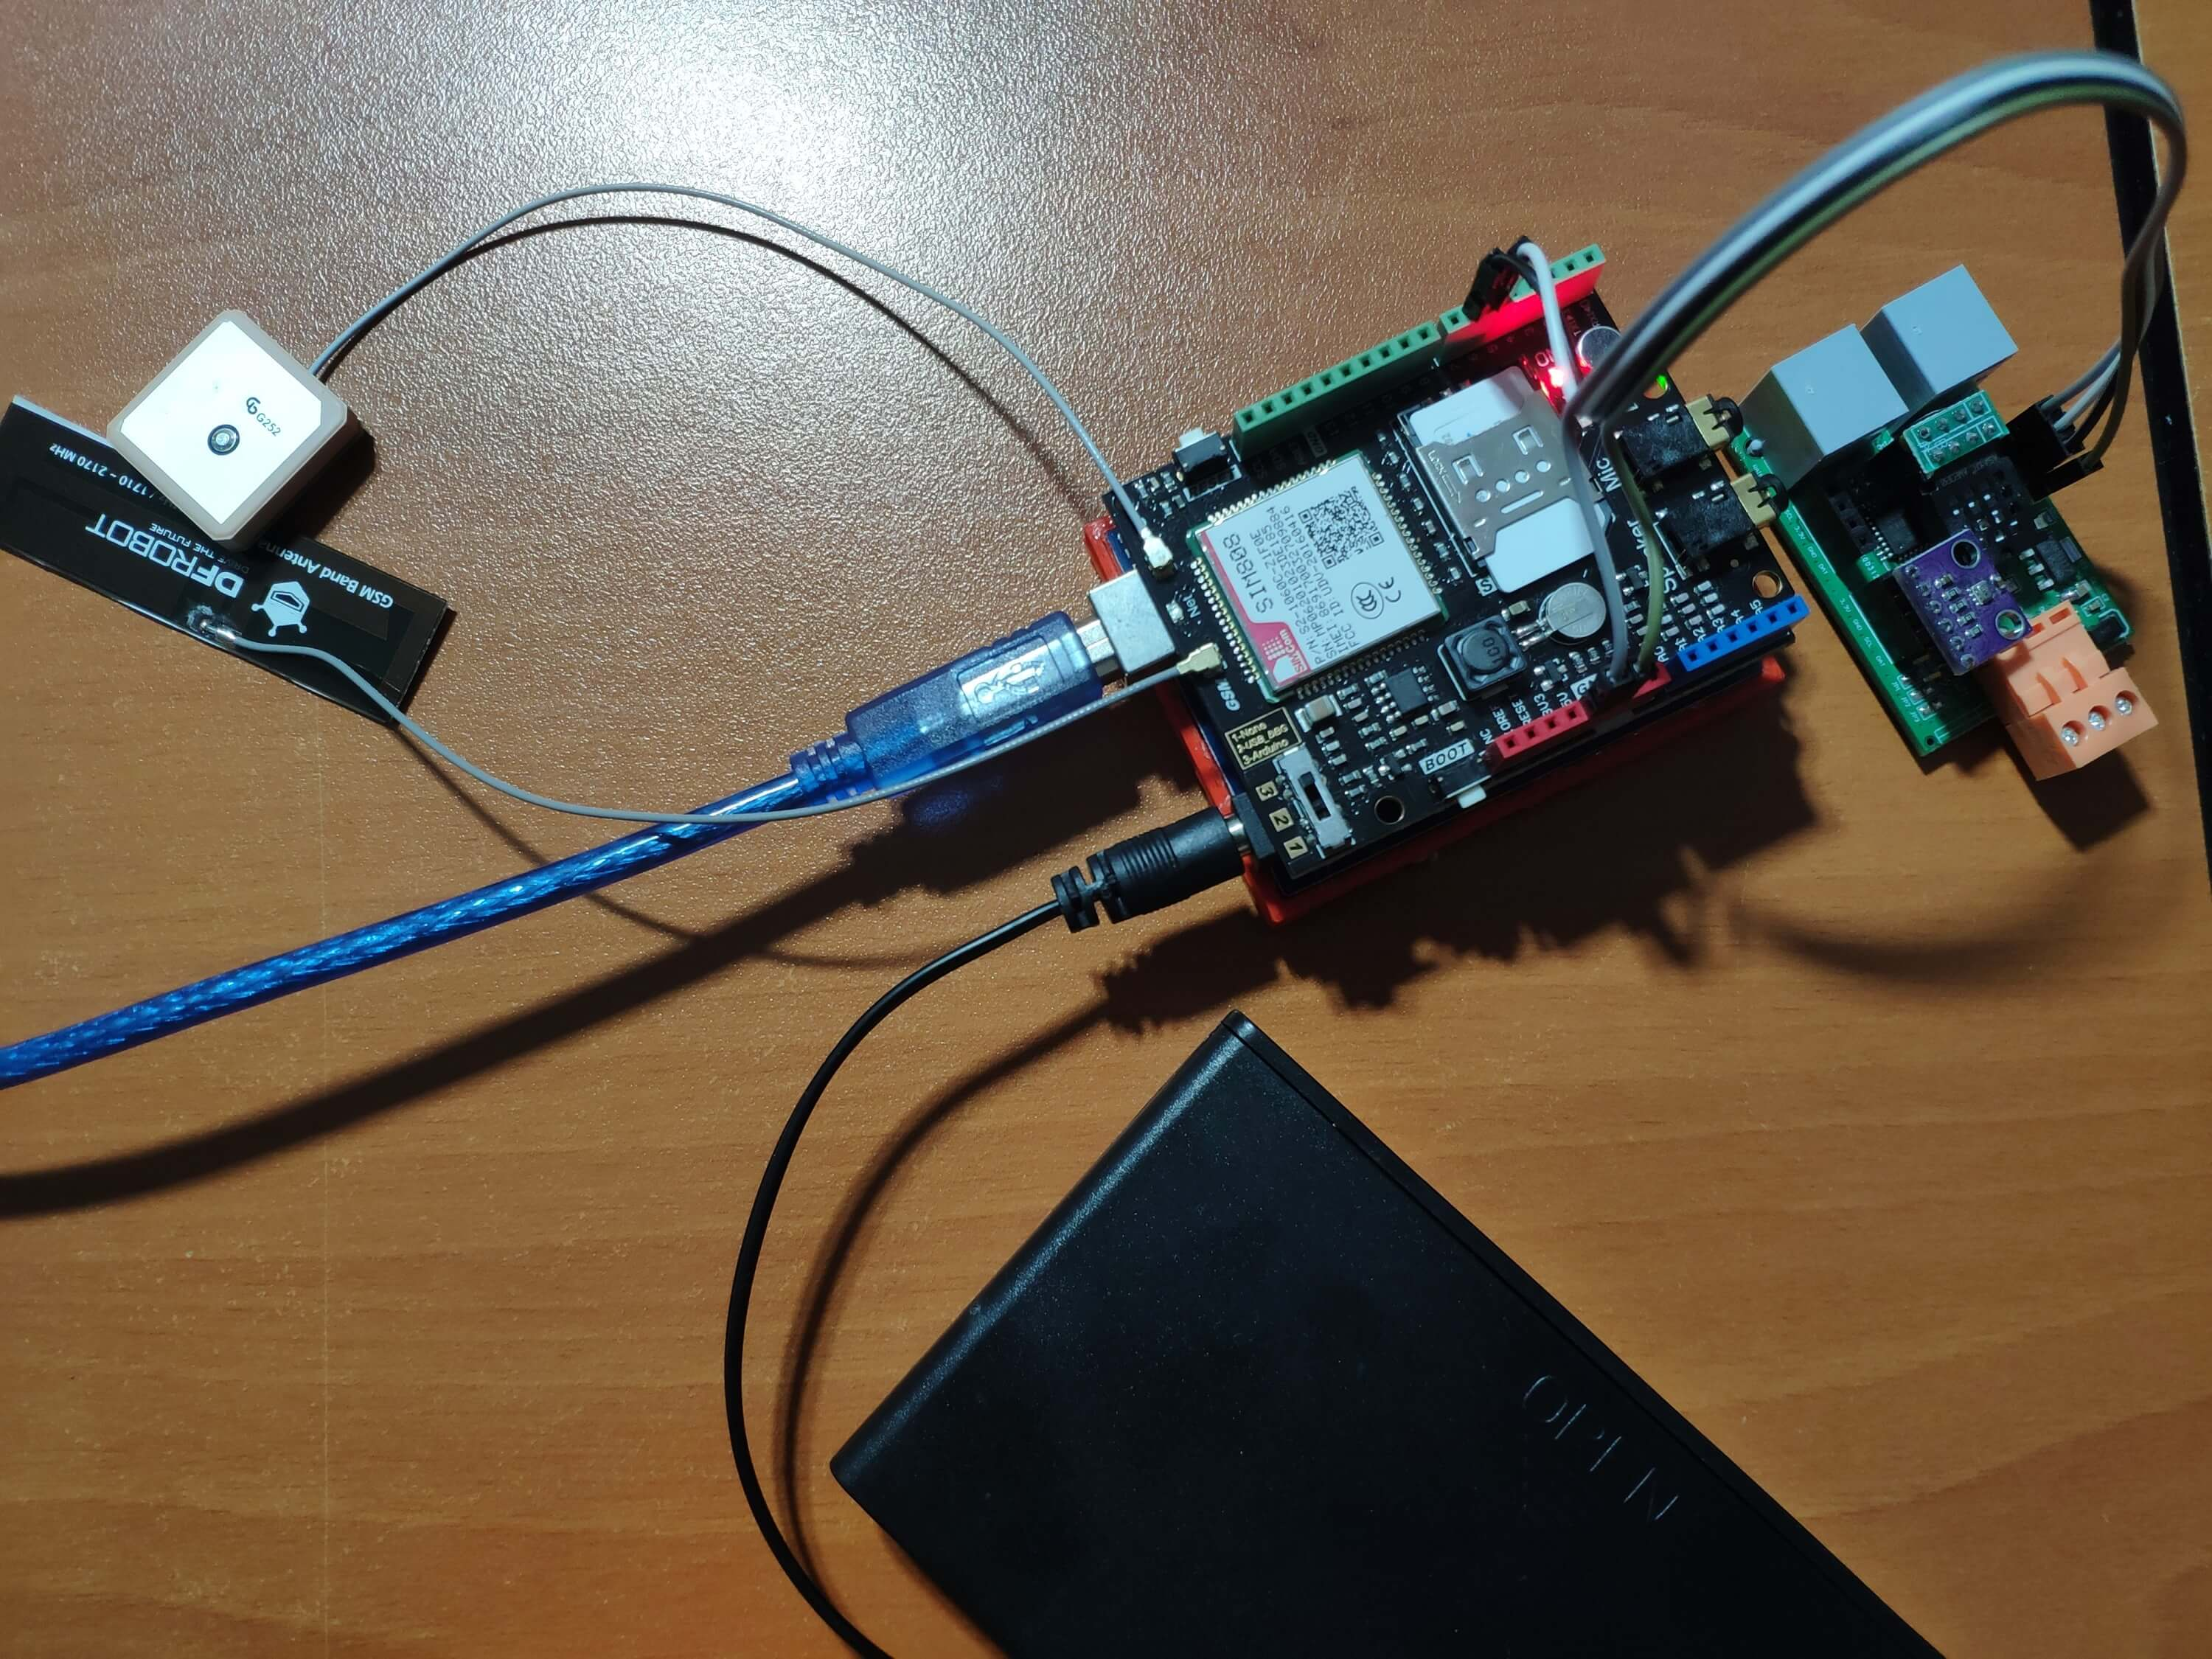
⭐ Connect an external battery (7-23V) for the SIM808 module to work properly.
⭐ Attach the GPS antenna and the GSM antenna to the SIM808 shield.
⭐ Insert a SIM card into the SIM slot on the SIM808 shield.
⭐ Before uploading the code, set the function switch on the shield to None (1).
⭐ Upload the code.
⭐ Then, set the function switch to Arduino (3).
⭐ Press the Boot button on the shield until seeing the Net indicator LED flashing every 1 second and wait for the SIM card to register the network - the Net indicator LED will slowly flash every 3 seconds.
⭐ Click here to get more information about the SIM808 GSM/GPS/GPRS Shield.
After setting up the SIM808 shield with Arduino Uno, I connected the sensor (converter) board to it.
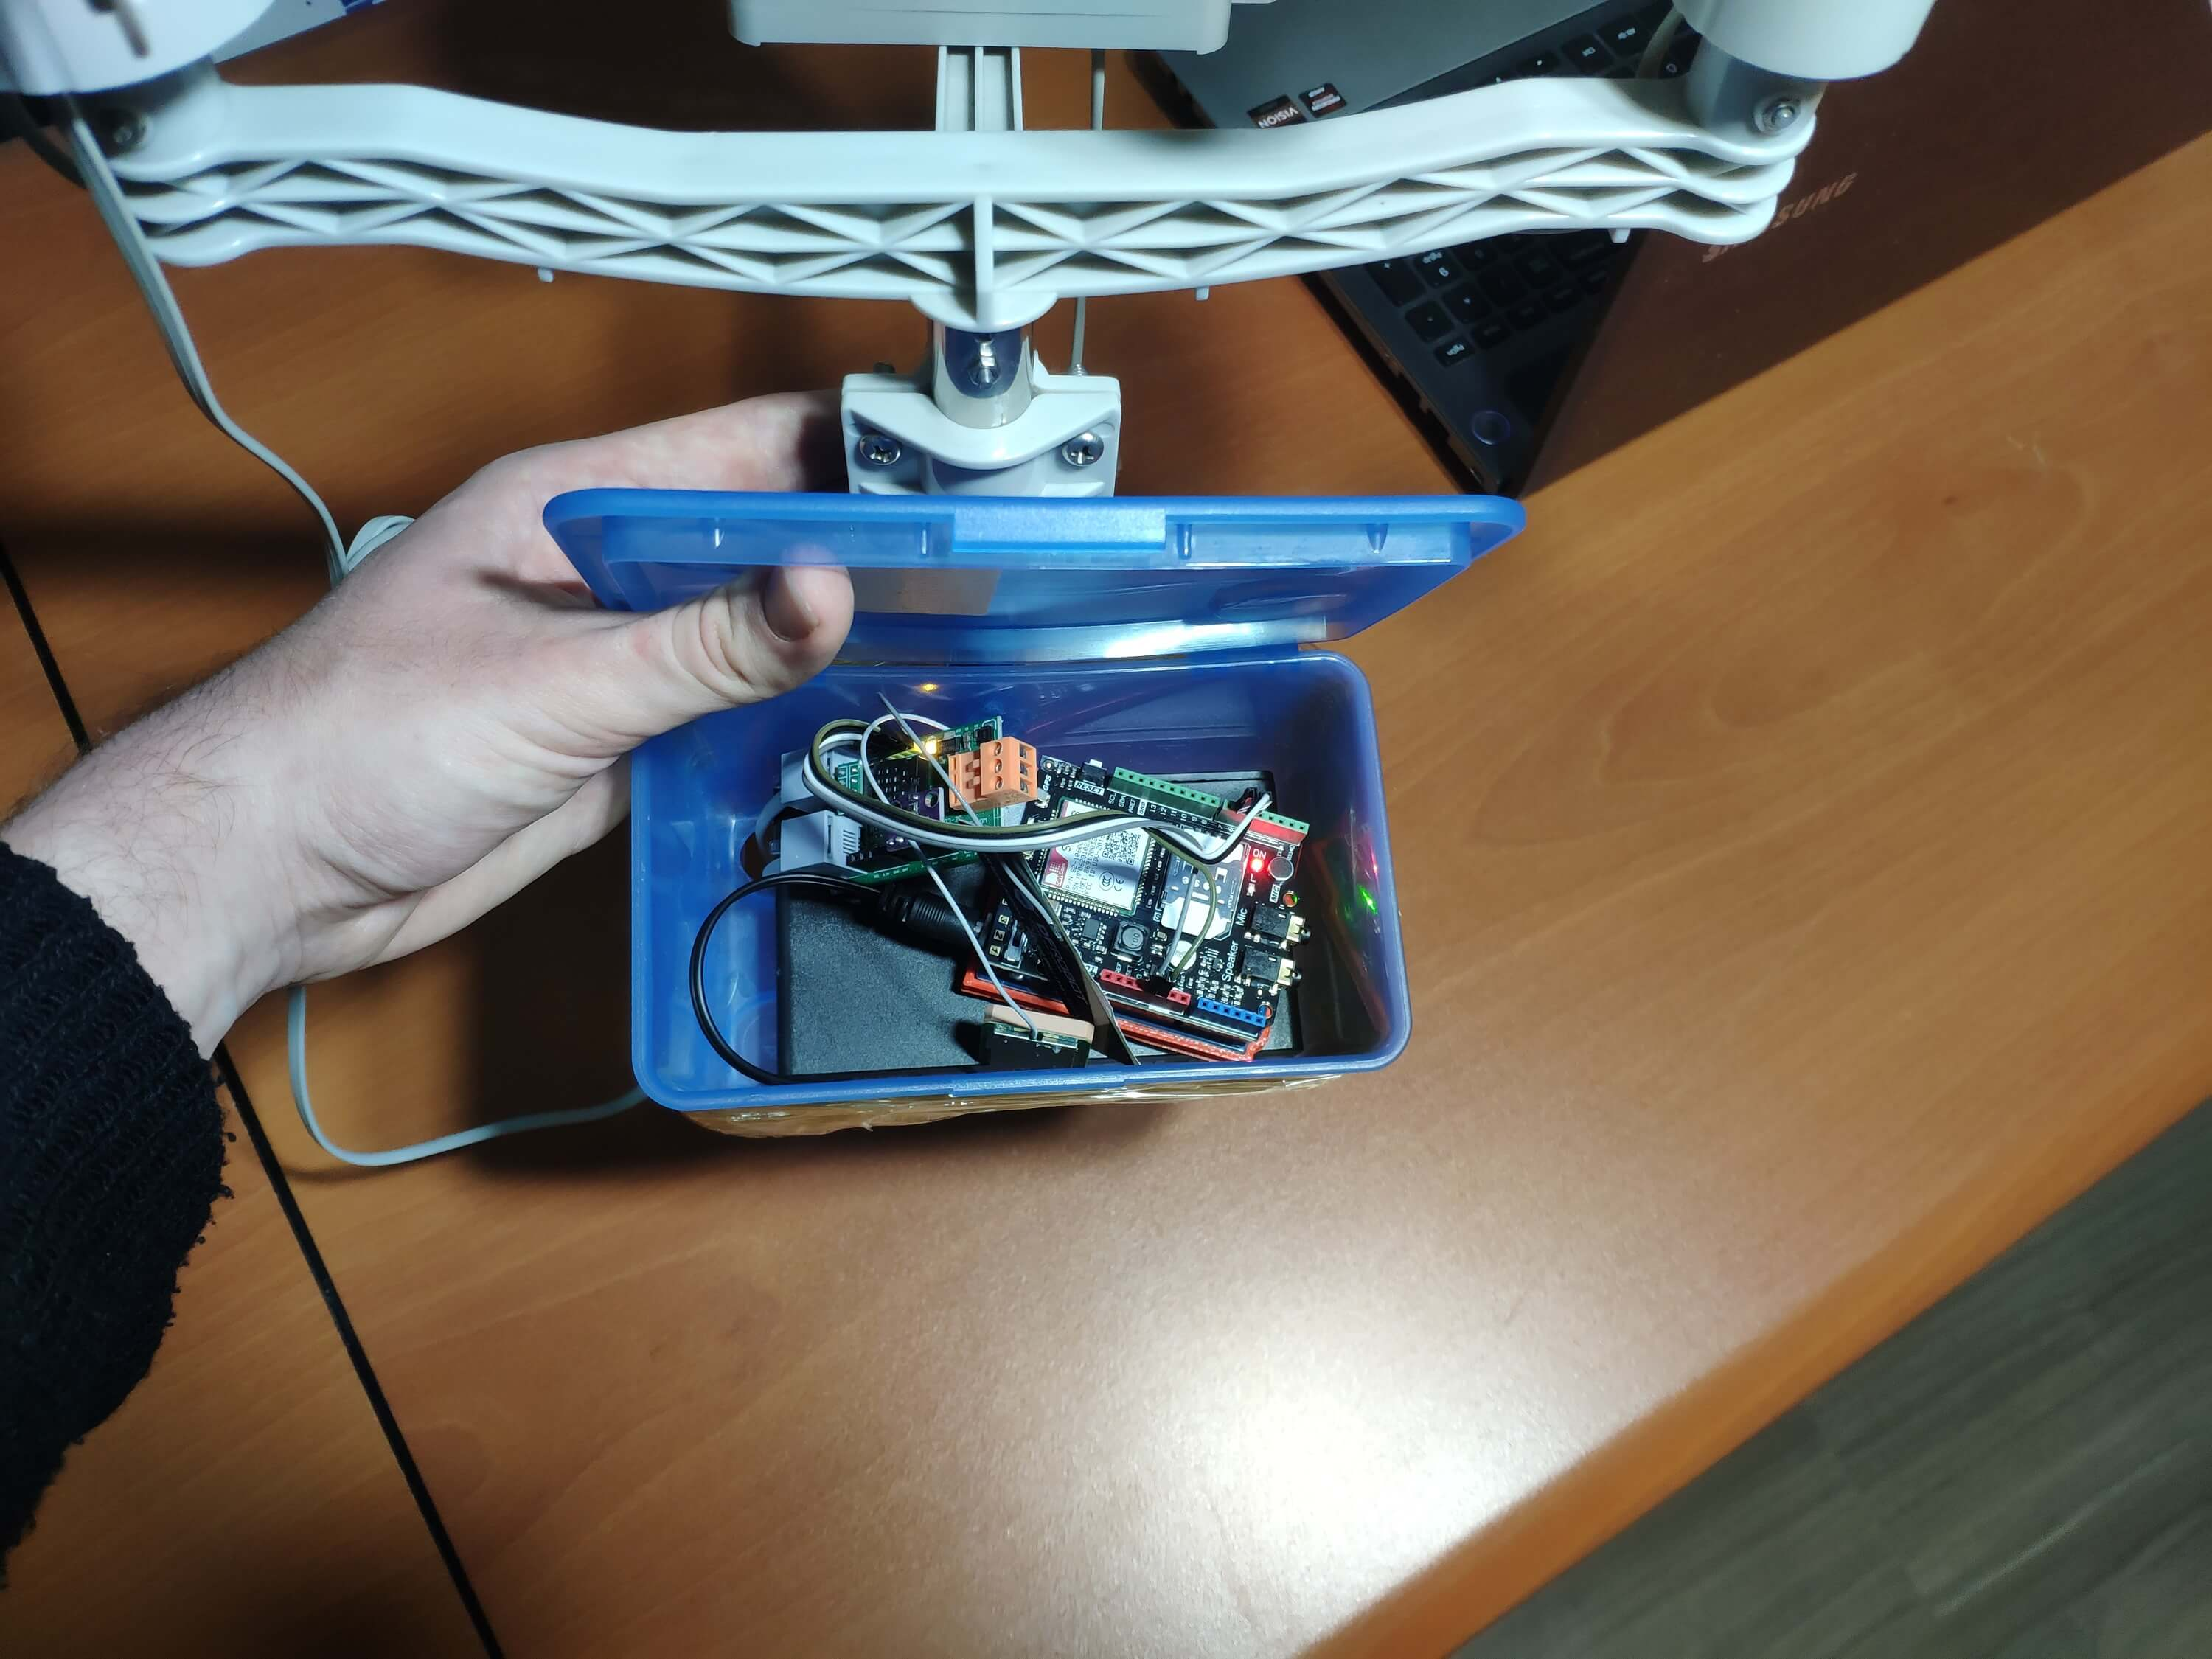
I placed all components into a plastic box to collect weather data outside, even in extreme weather conditions, since the sensor board is not weather-proof.
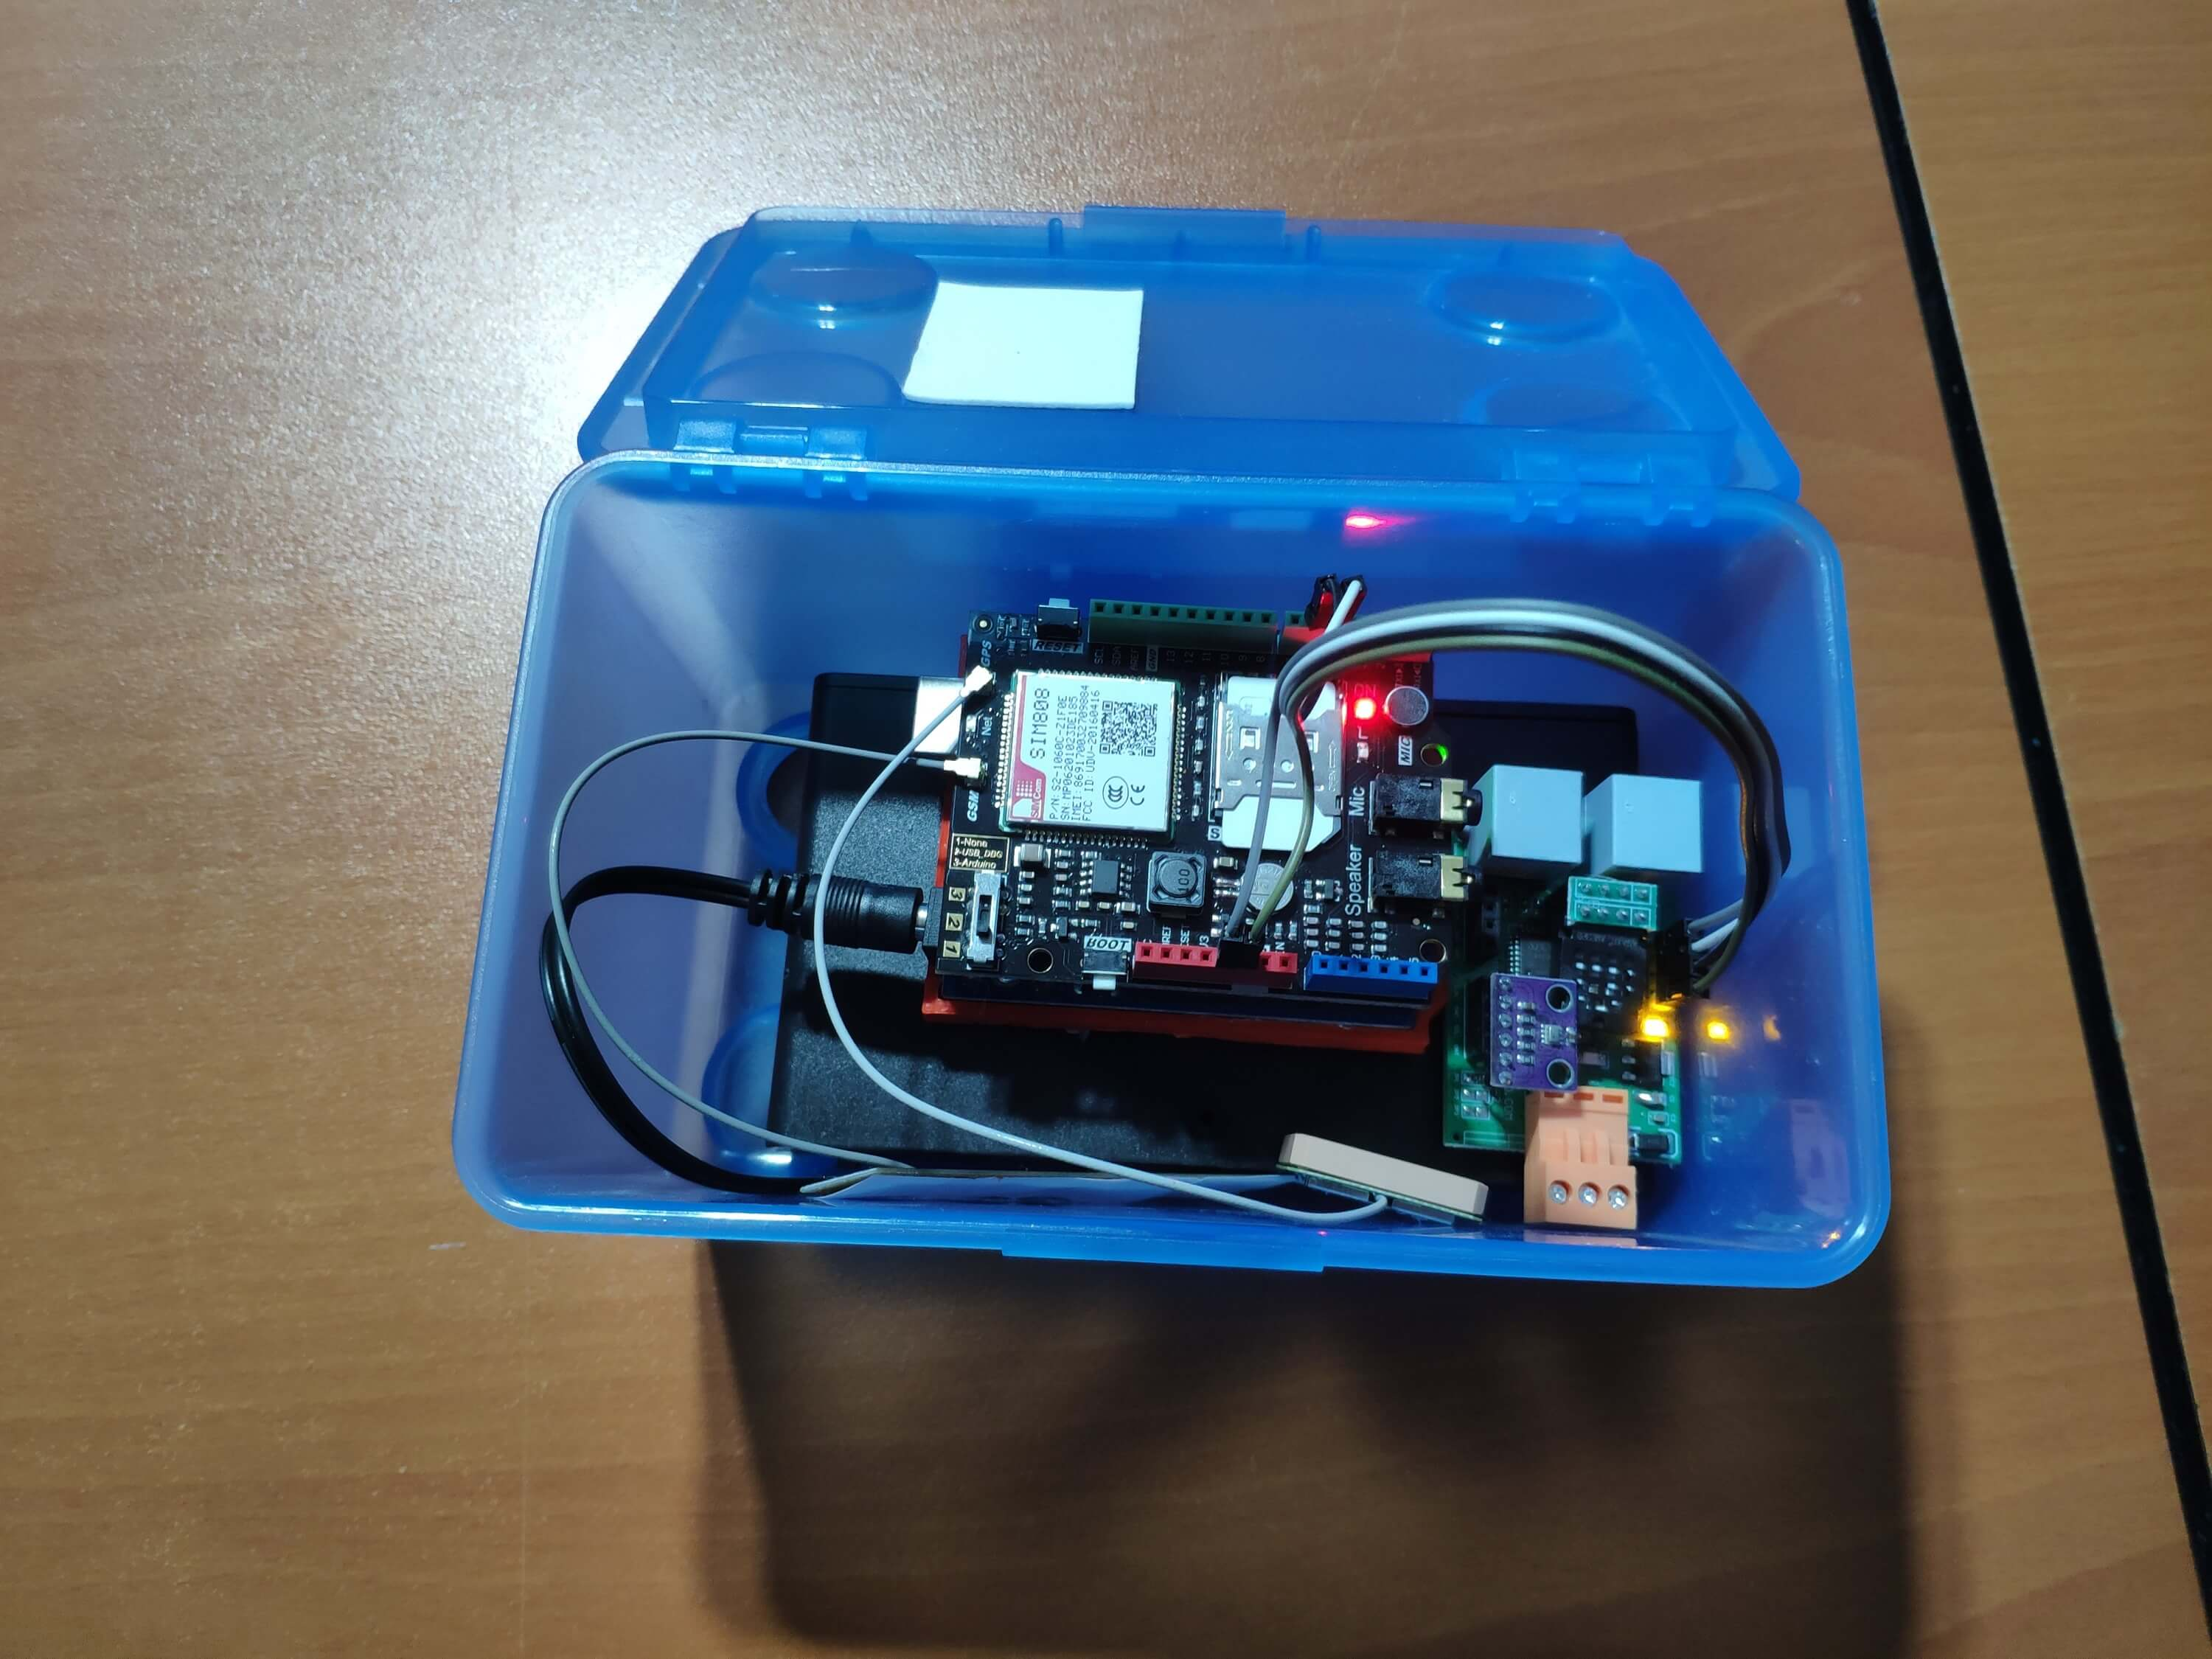
Then, I fastened the plastic box to the weather station.
Videos and Conclusion
After completing coding and assembling the weather station, I collated local weather data for more than three months every five minutes to build my neural network model successfully.
I am still collecting weather data at my balcony and backyard to improve my neural network model and its accuracy :)
Further Discussions
☔ 💧 Since we need local weather data sets to get more accurate predictions on weather phenomena, budget-friendly NN-enabled weather stations like this can be placed on farms and greenhouses to avert the detrimental effects of excessive rainfall on agriculture.
☔ 💧 As early warning systems working with neural networks, we can use them simultaneously to create a swarm of weather stations communicating and feeding each other to forecast rainfall intensity precisely in local areas.
☔ 💧 Also, we can utilize that information for assessing:
- vital water resources,
- agriculture,
- crop productivity,
- ecosystems,
- hydrology.
References
[1] Extreme weather - heavy rainfall , NIWA, https://niwa.co.nz/natural-hazards/extreme-weather-heavy-rainfall
[2] University of Illinois at Urbana-Champaign, News Bureau. "Excessive rainfall as damaging to corn yield as extreme heat, drought. " ScienceDaily. ScienceDaily, 30 April 2019. www.sciencedaily.com/releases/2019/04/190430121744.htm.
[3] Andrew Culclasure, Using Neural Networks to Provide Local Weather Forecasts , Georgia Southern University, Spring 2013, 29https://digitalcommons.georgiasouthern.edu/cgi/viewcontent.cgi?article=1031&context=etd.
代码
- IoT_weather_station_neural_network.py
- ESP12E_remote_weather_station.ino
- SIM808_remote_weather_station.ino
- index.php (web application)
- account_verification_token.php (web application)
IoT_weather_station_neural_network.pyPython
# IoT Weather Station Predicting Rainfall Intensity w/ TensorFlow# Windows, Linux, or Ubuntu# By Kutluhan Aktar# Collates weather data on Google Sheets and interprets it with a neural network built in TensorFlow to make predictions on the rainfall intensity. # For more information:# https://www.theamplituhedron.com/projects/IoT_Weather_Station_Predicting_Rainfall_Intensity_with_TensorFlowimport tensorflow as tffrom tensorflow import kerasimport matplotlib.pyplot as pltimport numpy as npimport pandas as pd# Create a class to build a neural network after getting, visualizing, and scaling (normalizing) weather data.class Weather_Station:def __init__(self, data):self.df =data self.input =[] self.label =[] # Define class names for different rainfall intensity predictions and values. self.class_names =['None', 'Light Rain', 'Moderate Rain', 'Heavy Rain', 'Violent Rain'] # Create graphics for requested columns. def graphics(self, column_1, column_2, xlabel, ylabel):# Show requested columns from the data set:plt.style.use("dark_background") plt.gcf().canvas.set_window_title('IoT Weather Station') plt.hist2d(self.df[column_1], self.df[column_2]) plt.colorbar() plt.xlabel(xlabel) plt.ylabel(ylabel) plt.title(xlabel) plt.show() # Visualize data before creating and feeding the neural network model. def data_visualization(self):# Inspect requested columns to build a model with appropriately formatted data:self.graphics('WD', '1h_RF', 'Wind Direction (deg)', 'One-Hour Rainfall (mm)') self.graphics('Av_WS', '1h_RF', 'Average Wind Speed (m/s)', 'One-Hour Rainfall (mm)') self.graphics('Mx_WS', '1h_RF', 'Maximum Wind Speed (m/s)', 'One-Hour Rainfall (mm)') self.graphics('24h_RF', '1h_RF', '24-Hour Rainfall (mm)', 'One-Hour Rainfall (mm)') self.graphics('Tem', '1h_RF', 'Temperature (C)', 'One-Hour Rainfall (mm)') self.graphics('Hum', '1h_RF', 'Humidity (%)', 'One-Hour Rainfall (mm)') self.graphics('b_PR', '1h_RF', 'Barometric Pressure (hPA)', 'One-Hour Rainfall (mm)') # Scale (normalize) data depending on the neural network model. def scale_data(self):# Wind Direction and Speed:wv =self.df.pop('Av_WS') max_wv =self.df.pop('Mx_WS') # Convert to radians. wd_rad =self.df.pop('WD')*np.pi / 180 # Calculate the wind x and y components. self.df['scaled_WX'] =wv*np.cos(wd_rad) self.df['scaled_WY'] =wv*np.sin(wd_rad) # Calculate the max wind x and y components. self.df['scaled_max_WX'] =max_wv*np.cos(wd_rad) self.df['scaled_max_WY'] =max_wv*np.sin(wd_rad) # Temperature:tem =self.df.pop('Tem') self.df['scaled_Tem'] =tem / 25 # Humidity:hum =self.df.pop('Hum') self.df['scaled_Hum'] =hum / 70 # Barometric Pressure:bPR =self.df.pop('b_PR') self.df["scaled_bPR"] =bPR / 1013 # 24 Hour Rainfall (Approx.) rain_24 =self.df.pop('24h_RF') self.df['scaled_24h_RF'] =rain_24 / 24 # Define the input and label arrays. def create_input_and_label(self):n =len(self.df) # Create the input array using the scaled variables:for i in range(n):self.input.append(np.array([self.df['scaled_WX'][i], self.df['scaled_WY'][i], self.df['scaled_max_WX'][i], self.df['scaled_max_WY'][i], self.df['scaled_Tem'][i], self.df['scaled_Hum'][i], self.df['scaled_bPR'][i]])) self.input =np.asarray(self.input) # Create the label array using the one-hour and 24-hour rainfall variables:for i in range(n):_class =0 # Evaluate the approximate rainfall rate:approx_RF_rate =(self.df['1h_RF'][i] + self.df['scaled_24h_RF'][i]) * 100 # As labels, assign classes of rainfall intensity according to the approximate rainfall rate (mm):if approx_RF_rate ==0:_class =0 elif approx_RF_rate <2.5:_class =1 elif 2.5 ", self.class_names[np.argmax(prediction[i])]) # Save the model for further usage without training steps:def save_model(self):self.model.save("E:\PYTHON\weather_station.h5") # Run Artificial Neural Network (ANN):def Neural_Network(self, save):self.scale_data() self.create_input_and_label() self.split_data() self.build_and_train_model() if save ==True:self.save_model() # Example Input and Layer:print("\nScaled Input [EXP]:\n") print(self.train_input[0]) print("\nScaled Label [EXP]:\n") print(self.train_label[0]) # Read data (Remote Weather Station.csv):csv_path ="E:\PYTHON\Remote Weather Station.csv"df =pd.read_csv(csv_path)# Define a new class object named 'station':station =Weather_Station(df)# Visualize data:#station.data_visualization()# Artificial Neural Network (ANN):station.Neural_Network(False)# Enter inputs for making predictions:prediction_array =np.array([ [0, 0, 0.31819805, 0.31819805, 0.6988, 0.81498571, 0.99349753], [0, -0, 0, -0, 0.8444, 1, 0.96835143], [0, 0, 0.45, 0, 0.87577, 0.95857143, 1.00128332], [-0, -0, -0, -0, 0.8224, 1.05714286, 0.99279368]])# Prediction Results:station.make_prediction(prediction_array) ESP12E_remote_weather_station.inoArduino
///////////////////////////////////////////// // IoT Weather Station Predicting // // Rainfall Intensity w/ TensorFlow // // ------------------------ // // NodeMCU (ESP-12E) // // by Kutluhan Aktar // // // ///////////////////////////////////////////////// Collates weather data on Google Sheets and interprets it with a neural network built in TensorFlow to make predictions on the rainfall intensity. //// For more information:// https://www.theamplituhedron.com/projects/IoT_Weather_Station_Predicting_Rainfall_Intensity_with_TensorFlow//// Connections// NodeMCU (ESP-12E) :// Weather Station// VV --------------------------- 5V// D5 --------------------------- RX// D6 --------------------------- TX// G --------------------------- GND// Include required libraries:#include#include #include #include #include // Define your WiFi settings.const char *ssid =" ";const char *password =" ";// Define weather station settings:char databuffer[35];double temp;int transferring =0;// Define the serial connection pins - RX and TX.SoftwareSerial Serial_1(D6, D5); // (Rx, Tx)void setup() { // Wait until connected.延迟(1000); // Initiate serial ports:Serial.begin(115200); Serial_1.begin(9600); // It is just for assuring if connection is alive. WiFi.mode(WIFI_OFF);延迟(1000); // This mode allows NodeMCU to connect any WiFi directly. WiFi.mode(WIFI_STA); // Connect NodeMCU to your WiFi. WiFi.begin(ssid, password); Serial.print("\n\n"); Serial.print("Try to connect to WiFi. Please wait! "); Serial.print("\n\n"); // Halt the code until connected to WiFi. while (WiFi.status() !=WL_CONNECTED) { delay(500); Serial.print("*"); } // If connection is successful:Serial.print("\n\n"); Serial.print("-------------------------------------"); Serial.print("\n\n"); Serial.print("Connection is successful!"); Serial.print("\n\n"); Serial.print("Connected WiFi SSID :"); Serial.print(ssid); Serial.print("\n\n"); Serial.println("Connected IPAddress :"); Serial.println(WiFi.localIP()); Serial.print("\n\n");}void loop() { // Get data from the remote weather station:getBuffer(); // Debug the information and create the link:String weather_data ="wd=" + String(WindDirection()) + "&a_ws=" + String(WindSpeedAverage()) + "&m_ws=" + String(WindSpeedMax()) + "&1_rf=" + String(RainfallOneHour()) + "&24_rf=" + String(RainfallOneDay()) + "&tem=" + String(Temperature()) + "&hum=" + String(Humidity()) + "&b_pr=" + String(BarPressure()); String server ="http://192.168.1.24/remote_weather_station/?"; Serial.println("Weather Data => " + weather_data); Serial.println("Buffer => " + String(databuffer)); // Send data packets every 5 minutes to Raspberry Pi (or any server). transferring++; Serial.println("Time => " + String(transferring) + "s / " + String(int(5*60)) + "s\n\n"); if(transferring ==5*60){ // Create the HTTP object to make a request to the server. HTTPClient http; http.begin(server + weather_data); int httpCode =http.GET(); String payload =http.getString(); Serial.println("Data Send...\nHTTP Code => " + String(httpCode) + "\nServer Response => " + payload + "\n\n"); http.end(); transferring =0; } // Wait 1 second... delay(1000);}// WEATHER STATIONvoid getBuffer(){ int index; for (index =0;index <35;index ++){ if(Serial_1.available()){ databuffer[index] =Serial_1.read(); if (databuffer[0] !='c'){ index =-1; } } else{ index --; } }}int transCharToInt(char *_buffer, int _start, int _stop){ int _index;整数结果 =0; int num =_stop - _start + 1; int _temp[num]; for (_index =_start;_index <=_stop;_index ++){ _temp[_index - _start] =_buffer[_index] - '0'; result =10*result + _temp[_index - _start]; } return result;}int WindDirection(){ return transCharToInt(databuffer,1,3); } // Wind Direction (deg)float WindSpeedAverage(){ temp =0.44704 * transCharToInt(databuffer,5,7); return temp; } // Average Air Speed (1 minute)float WindSpeedMax(){ temp =0.44704 * transCharToInt(databuffer,9,11); return temp; } //Max Air Speed (5 minutes)float Temperature(){ temp =(transCharToInt(databuffer,13,15) - 32.00) * 5.00 / 9.00; return temp; } // Temperature ("C")float RainfallOneHour(){ temp =transCharToInt(databuffer,17,19) * 25.40 * 0.01; return temp; } // Rainfall (1 hour)float RainfallOneDay(){ temp =transCharToInt(databuffer,21,23) * 25.40 * 0.01; return temp; } // Rainfall (24 hours)int Humidity(){ return transCharToInt(databuffer,25,26); } // Humidity (%)float BarPressure(){ temp =transCharToInt(databuffer,28,32); return temp / 10.00; } // Barometric Pressure (hPA)
SIM808_remote_weather_station.inoArduino
///////////////////////////////////////////// // IoT Weather Station Predicting // // Rainfall Intensity w/ TensorFlow // // ------------------------ // // Arduino Uno (SIM808) // // by Kutluhan Aktar // // // ///////////////////////////////////////////////// Collates weather data on Google Sheets and interprets it with a neural network built in TensorFlow to make predictions on the rainfall intensity. //// For more information:// https://www.theamplituhedron.com/projects/IoT_Weather_Station_Predicting_Rainfall_Intensity_with_TensorFlow//// Connections// Arduino Uno:// SIM808 GPS/GPRS/GSM Shield For Arduino// D0 --------------------------- RX// D1 --------------------------- TX// D12 --------------------------- POWER // Weather Station// 5V --------------------------- 5V// D5 --------------------------- RX// D6 --------------------------- TX// GND --------------------------- GND// Include required libraries:#include#include // Define the sim808.DFRobot_SIM808 sim808(&Serial);// Define weather station settings:char databuffer[35];double temp;int transferring =0;// Define the serial connection pins - RX and TX.SoftwareSerial Serial_1(6, 5); // (Rx, Tx)void setup() { // Wait until connected.延迟(1000); // Initiate serial ports:Serial.begin(9600); Serial_1.begin(9600); //******** Initialize sim808 module ************* while(!sim808.init()) { delay(1000); Serial.print("Sim808 init error\r\n"); } delay(2000); // Continue if the SIM808 Module is working accurately. Serial.println("Sim808 init success"); delay(5000);}void loop() { // Get data from the remote weather station:getBuffer(); // Debug the information and create the link:String weather_data_1 ="wd=" + String(WindDirection()) + "&a_ws=" + String(WindSpeedAverage()) + "&m_ws=" + String(WindSpeedMax()); String weather_data_2 ="&1_rf=" + String(RainfallOneHour()) + "&24_rf=" + String(RainfallOneDay()) + "&tem=" + String(Temperature()); String weather_data_3 ="&hum=" + String(Humidity()) + "&b_pr=" + String(BarPressure()); Serial.print("Weather Data => " + weather_data_1); Serial.print(weather_data_2); Serial.println(weather_data_3); Serial.println("Buffer => " + String(databuffer)); // Send data packets every 5 minutes to the server. transferring++; Serial.println("Time => " + String(transferring) + "s / " + String(int(5*60)) + "s\n\n"); if(transferring ==5*60){ //*********** Attempt DHCP ******************* while(!sim808.join(F("cmnet"))) { Serial.println("Sim808 join network error!");延迟(2000); } //************ Successful DHCP **************** delay(5000); Serial.println("Successful DHCP"); //*********** Establish a TCP connection ************ if(!sim808.connect(TCP,"192.168.1.24", 80)) { // Change it with your server. Serial.println("Connection Error"); }else{ Serial.println("Connection OK"); } delay(2000); //*********** Send a GET request ***************** String line ="GET /remote_weather_station/?" + weather_data_1 + weather_data_2 + weather_data_3 + " HTTP/1.0\r\n\r\n"; Serial.println(行); char buffer[512]; // Convert the line from string to char array to make an HTTP Get Request with the SIM808. char web_hook[110]; String_to_Char(line, 110, web_hook); sim808.send(web_hook, sizeof(web_hook)-1); while (true) { int ret =sim808.recv(buffer, sizeof(buffer)-1); if (ret <=0){ Serial.println("Fetch Over...");休息; } // Uncomment to view the response in the serial monitor. /* buffer[ret] ='\0'; Serial.print("Recv:"); Serial.print(ret); Serial.print(" bytes:"); Serial.println(buffer); */ Serial.println("\nData Send");休息; } //************* Close TCP or UDP connections ********** sim808.close(); //*** Disconnect wireless connection, Close Moving Scene ******* sim808.disconnect(); // Exit. transferring =0; } // Wait 1 second... delay(1000);}// WEATHER STATIONvoid getBuffer(){ int index; for (index =0;index <35;index ++){ if(Serial_1.available()){ databuffer[index] =Serial_1.read(); if (databuffer[0] !='c'){ index =-1; } } else{ index --; } }}int transCharToInt(char *_buffer, int _start, int _stop){ int _index;整数结果 =0; int num =_stop - _start + 1; int _temp[num]; for (_index =_start;_index <=_stop;_index ++){ _temp[_index - _start] =_buffer[_index] - '0'; result =10*result + _temp[_index - _start]; } return result;}int WindDirection(){ return transCharToInt(databuffer,1,3); } // Wind Direction (deg)float WindSpeedAverage(){ temp =0.44704 * transCharToInt(databuffer,5,7); return temp; } // Average Air Speed (1 minute)float WindSpeedMax(){ temp =0.44704 * transCharToInt(databuffer,9,11); return temp; } //Max Air Speed (5 minutes)float Temperature(){ temp =(transCharToInt(databuffer,13,15) - 32.00) * 5.00 / 9.00; return temp; } // Temperature ("C")float RainfallOneHour(){ temp =transCharToInt(databuffer,17,19) * 25.40 * 0.01; return temp; } // Rainfall (1 hour)float RainfallOneDay(){ temp =transCharToInt(databuffer,21,23) * 25.40 * 0.01; return temp; } // Rainfall (24 hours)int Humidity(){ return transCharToInt(databuffer,25,26); } // Humidity (%)float BarPressure(){ temp =transCharToInt(databuffer,28,32); return temp / 10.00; } // Barometric Pressure (hPA)void String_to_Char(String _String, int _size, char _convert[]){ for(int i=0;i<_size;i++){ _convert[i] =_String[i]; }}
index.php (web application)PHP
 (int)$_GET['wd'], "a_ws" => (float)$_GET['a_ws'], "m_ws" => (float)$_GET['m_ws'], "1_rf" => (float)$_GET['1_rf'], "24_rf" => (float)$_GET['24_rf'], "tem" => (float)$_GET['tem'], "hum" => (int)$_GET['hum'], "b_pr" => (float)$_GET['b_pr'] ];}else{ $variables_from_module =[ "wd" => "err", "a_ws" => "err", "m_ws" => "err", "1_rf" => "err", "24_rf" => "err", "tem" => "err", "hum" => "err", "b_pr" => "err" ];}/** * Returns an authorized API client. * @return Google_Client the authorized client object */function getClient(){ $client =new Google_Client(); $client->setApplicationName('Remote Weather Station'); // Enter your application name. $client->setScopes('https://www.googleapis.com/auth/spreadsheets'); $client->setAuthConfig('credentials.json'); $client->setAccessType('offline'); $client->setPrompt('select_account consent'); // Load previously authorized token from a file, if it exists. // The file token.json stores the user's access and refresh tokens, and is // created automatically when the authorization flow completes for the first // time. $tokenPath ='token.json'; if (file_exists($tokenPath)) { $accessToken =json_decode(file_get_contents($tokenPath), true); $client->setAccessToken($accessToken); print("Token Found!"); } // If there is no previous token or it's expired. if ($client->isAccessTokenExpired()) { // Refresh the token if possible, else fetch a new one. if ($client->getRefreshToken()) { $client->fetchAccessTokenWithRefreshToken($client->getRefreshToken()); } else { // Request authorization from the user. $authUrl =$client->createAuthUrl(); // Do not forget to refresh the page after getting the verification code and entering it to the account_verification_token.php. printf("Open the following link in your browser:

%s

", $authUrl); // <=Comment print 'Do not forget to refresh the page after getting the verification code and entering it to the account_verification_token.php.

Set the verification code in the account_verification_token.php file.'; // <=Comment // Set the verification code to create the token.json. $authCode =trim($GLOBALS['account_verification_token']); // Exchange authorization code for an access token. $accessToken =$client->fetchAccessTokenWithAuthCode($authCode); $client->setAccessToken($accessToken); // Check to see if there was an error and the account_verification_token is entered. if (array_key_exists('error', $accessToken)) { throw new Exception(join(', ', $accessToken)); }else{ print("Successful! Refresh the page."); } } // Save the token to a file. if (!file_exists(dirname($tokenPath))) { mkdir(dirname($tokenPath), 0700, true); } file_put_contents($tokenPath, json_encode($client->getAccessToken())); } return $client;}// Get the API client and construct the service object.$client =getClient();$service =new Google_Service_Sheets($client);// Enter your spreadsheetId:$spreadsheetId ='';// Enter the range (the first row) under which new values will be appended (8 rows):$range ='A1:H1';// Append recent findings from the weather station to the spreadsheet.$values =[ [$variables_from_module["wd"], $variables_from_module["a_ws"], $variables_from_module["m_ws"], $variables_from_module["1_rf"], $variables_from_module["24_rf"], $variables_from_module["tem"], $variables_from_module["hum"], $variables_from_module["b_pr"]]];$body =new Google_Service_Sheets_ValueRange([ 'values' => $values]);$params =[ 'valueInputOption' => "RAW"];// Append if only requested!if(isset($_GET['wd']) &&isset($_GET['a_ws']) &&isset($_GET['m_ws']) &&isset($_GET['1_rf']) &&isset($_GET['24_rf']) &&isset($_GET['tem']) &&isset($_GET['hum']) &&isset($_GET['b_pr'])){ $result =$service->spreadsheets_values->append($spreadsheetId, $range, $body, $params); printf("

%d cells appended.", $result->getUpdates()->getUpdatedCells());}else{ print ("
Missing Data!");}
account_verification_token.php (web application)PHP
"; // Enter the verification code after authorization. ?>
定制零件和外壳
remote_weather_station_OobOCQNPSW.csv示意图
制造工艺
- 基于树莓派的气象站
- Raspberry Pi 2 气象站
- Raspberry Pi 气象站
- IoT 101 项目:来自 Raspberry Pi 的流温度
- 使用树莓派远程监测天气
- 与您的气象站一起加入 IOT – CWOP
- Java ME 8 + Raspberry Pi + 传感器 =物联网世界(第 1 部分)
- 基于 Raspberry PI 的 IoT 项目连接 DHT11 传感器
- Raspberry Pi 2 上的 Windows 10 IoT Core – Adafruit 传感器数据
- Weather Station V 2.0
- Windows 10 IoT Core for Raspberry Pi 3 Model B+
- 轻松在 Raspberry Pi 4B+ 物联网板上进行并行计算