

故障分析工具:为工作选择合适的工具
有多种故障分析和解决问题的方法可用于分析设备和过程故障。对不同的方法进行了描述和比较,以便维护和可靠性专业人员可以选择正确的故障分析或问题解决工具,以最低成本生成最佳解决方案。
你想让谁在你的设备上工作?从装备精良的工具箱中选择合适的工具并熟练地使用它们快速完成工作而没有错误的人,或者拥有一些基本工具但努力按时无错误地完成工作的人。
什么工具最有效,千分尺或夹子?测量轴承配合需要千分尺,但焊接两块钢时可能需要C形夹。
您的心理工具箱还应包含各种分析工具。您必须选择最适合解决手头问题的分析方法。请记住,每种工具都有自己的优势、劣势和首选应用领域。
问题和失败每天都在发生。通常我们只有时间和资源来提供救济。并非每个问题都需要进行根本原因分析。
我们的工作是将需要缓解的问题和故障与需要防止将来发生的问题和故障分开。为了帮助区分这些,问自己几个问题:
-
该问题目前的实际影响是什么?
-
如果问题不解决,潜在的影响是什么?
-
从道德/法律/合同的角度来看,我们可以承受什么样的风险?
-
平衡风险、成本和收益的可接受结果是什么?
当我们专注于提供所需救济的响应,并在必要时发现根本原因时,我们会变得更有效率。
让我们来看看一些可用的根本原因分析工具,包括它们的优点和缺点,以便您可以选择并使用其中的一个来获得解决问题所需的洞察力。
根本原因分析 (RCA) 不是一个明确定义的方法;有许多不同的过程和方法可以进行 RCA 分析,这些过程和方法由它们的方法或起源领域定义 :
-
安全 – 事故分析、职业安全与健康
-
生产 – 工业制造中的质量控制
-
流程 – 生产范围扩大到包括商业实践
-
设备故障 – 受军队启发,然后按行业定制,用于工程和维护
-
系统 – 包含以上所有内容并添加变更管理
搜索“根本原因分析”将产生数十个结果。不幸的是,没有统一的定义,所以一个基本的方法或过程可能有几个不同的名称和描述。这些方法的范围和复杂性各不相同。使用正确的分析方法同样重要,因此它与问题的范围和复杂性相匹配。
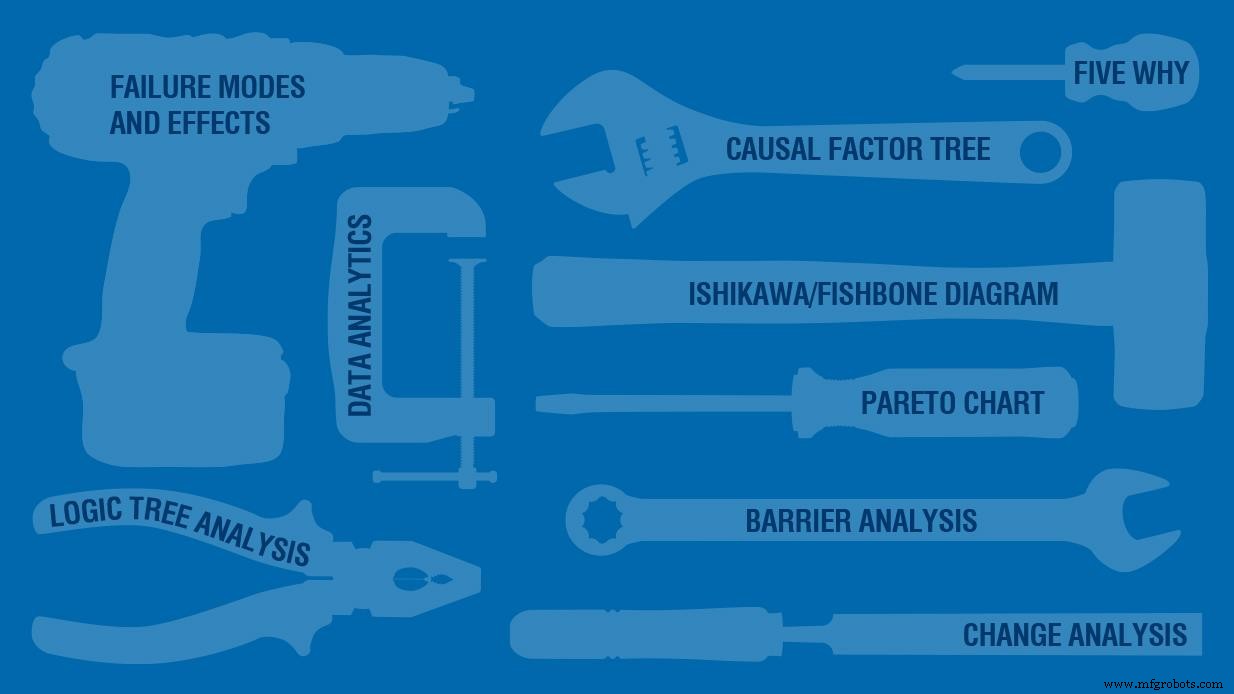
一些常见的根本原因分析 (RCA) 技术包括:
-
五个原因 – 在确定根本原因之前询问原因、原因、原因。
-
石川/鱼骨图 – 原因和结果按类别列出。
-
因果分析/因果树 – 因果关系显示在树上,以便识别因果关系。
-
故障模式和影响/关键性分析 – 定义了可能的故障模式;描述了这些故障的影响和概率,以确定从最关键的设备开始的适当对策。
-
故障或逻辑树分析 – 识别故障并描述和测试故障模式,直到确定根源。
-
障碍分析 – 检查危害影响目标的途径和途径中的障碍。
-
变更分析/Kepner-Tregoe – 将没有出现问题的情况与出现问题的情况进行比较,以确定可以解释发生了什么的变化或差异。
-
帕累托图 – 按顺序显示问题或失败的相对频率,以便流程改进活动可以集中在少数重要的事情上。
-
数据分析 – 是以发现有用信息为目标对数据进行转换和建模的过程。
接下来,让我们更详细地描述这些方法中的每一种,并解释它们的优点和局限性。
五个为什么
五为什么是一种提问技巧,用于确定特定问题或失败的原因和影响。它问为什么。答案构成了下一个问题的基础。你会继续前进,直到你达到一些基本的或完全不受你控制的东西。数字五是基于这样的观察:问“为什么”五次通常可以解决问题。可能只需要 3 次迭代,或者你可能在一个月后仍然在问“为什么”。这取决于问题。

图1 . 五个为什么的场景
并非所有故障都有一个根本原因。要确定其他原因,必须从不同的观察开始重复提问。
优势
不需要一大群人来完成分析。通常,一两个人就足够了。对于组件故障,力学、化学和物理是明确定义的,因此它在这个级别上效果最好。对于人和组织的原因,它不太适用。
该方法很灵活,没有关于要探索哪些问题或搜索其他根本原因需要多长时间的规则。因此,结果取决于相关人员的知识和坚持。
限制
这种方法基于这样一个概念,即每一个结果都有一个单一的原因。如果多种原因可以导致相同的结果,或者需要多种原因的组合才能产生效果,则这些可能会被忽略。很少有每个原因级别的单一原因足以解释所讨论的影响。
当使用多个路径五个为什么时,其中一些原因可能有不止一个答案,并且很容易使分析变得过于复杂。为了解决这个问题,开发了因果树分析。如果您的一个答案是错误的,那可能是有可能的,但不是真正的原因,完全是另一回事。
石川/鱼骨图
石川/鱼骨图(图 2)是一种图形工具,用于识别潜在的根本原因以及哪类过程输入代表了输出中最大的可变性来源。完整的鱼骨图包括一个中央脊椎和类似于鱼骨架的分支。分支用于按过程顺序或功能对原因进行分类。在每个类别中,列出潜在原因,然后使用证据或其他分析工具测试其有效性。
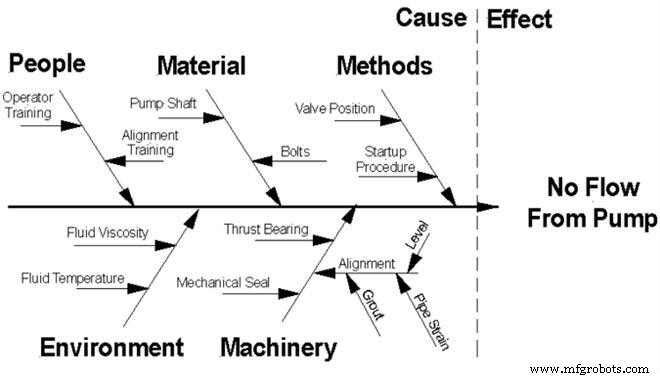
图2 . 石川/鱼骨图
优势
鱼骨图很有用,因为它显示了潜在原因之间的关系,并且是让人们参与解决问题的好方法。单人使用也有效。
限制
在鱼骨图中涉及多个人会限制其有效性,因为它鼓励采用不同的方法,在这种方法中,识别和修复可能导致问题的一切的诱惑很大。为了使鱼骨图成功,需要对导致问题的不充分、必要或存在的原因进行无情剔除。
因果分析/因果树
因果分析将五个为什么中使用的问题与逻辑树或故障树的树结构相结合。将其视为逻辑树格式中的五个为什么方法的扩展会有所帮助。它可以在一个结果上检查多个原因。
问题、失败或偏差(效果)放置在树的顶部或页面左侧的单个项目。通过询问“为什么”,导致这种影响的直接原因显示在其下方并使用分支链接。检验这些原因的必要性、充分性和存在性。不符合此测试的原因从树中删除。
接下来,添加这些因素中的每一个的直接原因。添加到结构中的每个原因必须满足相同的必要性、充分性和存在性要求。
一些分析师以问题陈述开始,回答谁、什么、何时和何地,然后是事件影响的目标列表。然后为每个受影响的目标开发一个因果树。这种同步构建有助于揭示知识差距。
因果树通常有许多端点。需要采取纠正措施的端点是根本原因。
构建因果树有几个优点:
-
提供一种易于遵循的记录原因和证据的结构。
-
可以处理多种场景。
-
非常适合作为主分析技术。
-
可以合并其他工具的结果。
因果树也有局限性:
-
处理和显示时间相关的事件很困难。
-
复杂性使得处理序列依赖性变得更加困难。
-
会发现知识差距,但没有办法填补。
-
停止点可能是任意的。
在图 3 的因果树示例中,单个效应有多个潜在原因。在倒数第三行,有两个原因导致材料的耐久强度被超过。首先是轴上的轴承磨损引起的应力集中。其次是在故障前几个月提高机器速度导致皮带张力增加。尽管其中任何一个都可能是原因,但两者的存在都会加速轴的疲劳断裂。当轴断裂时,这些导致了驱动器的灾难性故障。
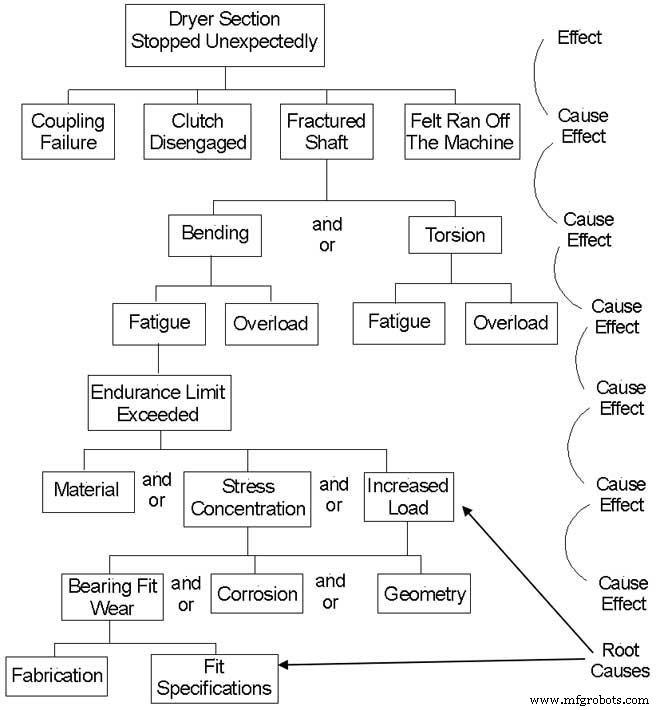
图 3. 纸机干燥部因果树
失效模式和影响分析
故障模式和影响分析 (FMEA) 是迄今为止最全面和最复杂的根本原因分析工具。它可以与关键性分析或故障树分析相结合,以进一步识别具有最大后果概率严重性的故障模式。 这是一个感应过程,可以在组件级别(轴、轴承齿轮等)或功能级别(补油泵、压力机液压系统等)开始。
FMEA 是对问题的高级、详细、“假设”分析。图 4 显示了基本的“假设”分析。它包括使用“假设”问题来识别系统中可能的变化和缺陷的头脑风暴方法。一旦确定,就会对这些问题及其潜在后果进行风险评估。
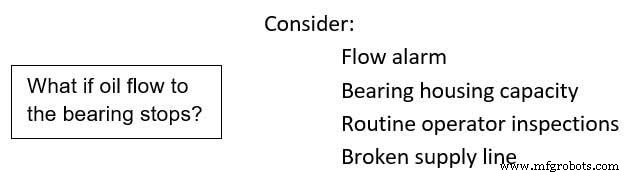
图4 . 一个简单的“假设”语句
将 FMEA 过程视为非常详细和严格的“假设”过程会有所帮助。
FMEA 分析从对要研究的系统的定义开始,然后通过一系列步骤进行,直到做出修正并完成后续评估其有效性的工作。 FMEA 的开发是为了评估系统中组件故障的影响。它用于识别可能发生故障的位置(故障模式)以及此类故障的影响(效果)。
优势
FMEA 在应急计划中最有用,它用于评估各种可能的故障(意外事件)的影响。如果需要更详细的信息,可以使用 FMEA 代替“假设”分析。
当与临界分析相结合时,该分析将系统地建立故障原因和影响以及发生概率之间的关系,并将指出个别故障模式以采取纠正措施。当FMEA用于补充故障树分析时,可以识别更多的故障模式和原因。
限制
FMEA广泛应用于航空及部分行业,但存在以下局限性:
-
完成分析所需的时间和精力
-
用无关紧要的情况稀释工作
-
无法处理组合故障事件
-
通常不包括人际互动
-
它检查与故障相关的危险,而不是正常操作期间的危险
故障或逻辑树分析
一个错误 或逻辑树是发现故障的物理、人为和潜在根源的过程。它以描述失败的问题陈述开始。对故障的准确描述对于逻辑树构建的成功与否至关重要。故障描述为功能或组件。
功能故障描述了与所需状态的差异,例如泵无法提供所需的压力或无法在不增加振动的情况下保持设计速度。应该定量地描述它们。图 4 中的故障树分析从泵的功能故障开始;泵没有流量。如果泵能够产生一定的流量,则应包括流量或压力。
组件故障描述了特定组件的状态。在这种情况下,分析将从一个陈述开始,例如变速箱轴断裂或外侧输送机轴承故障。
第二步在故障描述的正下方列出故障模式。一个常见的错误是列出所有可能的故障模式。需要有洞察力才能列出与失败相关的内容。例如,断裂是轴承的一种失效模式,但如果轴承没有断裂,就不是失效模式。问“怎么能……?”是有帮助的。
为每种模式做出假设,然后使用证据对每个假设进行检验。如果证据不能支持假设,则不使用假设。
重复这个过程,直到达到物理根。需要额外的迭代才能到达人类和潜在的根源。人们必须问:“怎么可能……?”后跟“ 证据证实了什么?”请记住,每个假设都必须经过证据测试和验证。这是许多根本原因分析工作陷入困境的地方。
优势
故障树分析非常擅长显示系统对单个或多个初始故障的抵抗力。它可以从功能或组件级别开始。 OSHA 在其过程安全管理标准中将故障树分析视为可接受的过程危害分析方法。
限制
故障树和逻辑树需要仔细定义问题。根据问题定义,它并不总能找到所有可能的起始故障。如果问题的范围太大,分析过程就会陷入对非后果要素的分析中,变成一种散枪式的方法,试图解决与失败无关的根源。
图 5 中的示例是停止泵送的泵的逻辑树。拆卸泵后发现轴断裂。导致泵失效的疲劳断裂始于应力集中。这是物理根。进一步调查发现泵轴是由印刷品制成的,没有在关键位置指定半径。省略半径是人类的根源之一。泵轴的印刷是为了削减成本,所以泵轴可以由成本最低的投标人制造。努力削减成本是组织或潜在根源之一。
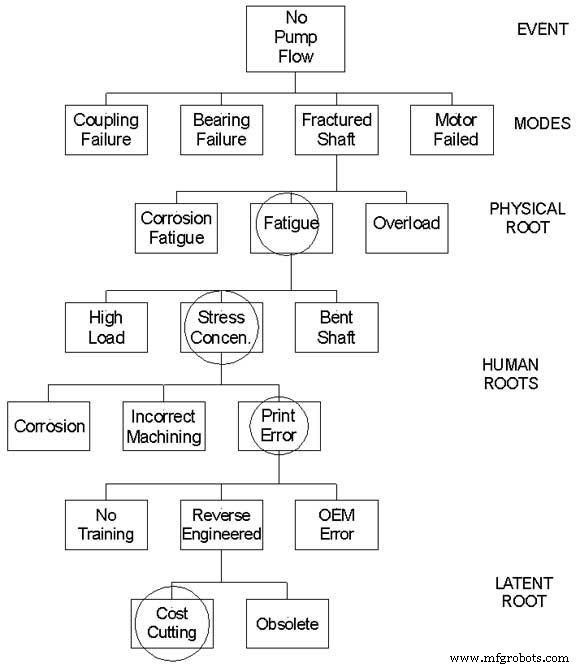
图5 . 泵功能故障的故障树分析
障碍分析
障碍分析检查危害影响目标的途径。它确定用于保护目标的实际或潜在障碍或控制。目标必须存在于一组指定的条件内。目标的概念意味着几乎任何东西都可以成为目标——一件设备、数据、建筑物或人。
其次,目标受到不利影响的方式称为危害。不利影响是将目标转移到其指定条件之外的任何事情。这样就可以通过危害影响目标的途径来唯一识别目标和危害对。
一旦确定了危害、目标和危害影响目标的途径,就可以描述用于保护、减轻对目标的损害和/或将目标维持在一组指定条件下的控制措施和障碍。
障碍和控制通常被设计到系统中以保护人员、设备、数据等。在设计过程中可能无法识别所有危险或存在未识别的路径。现有的障碍和控制可能不存在,或者即使存在,它们也可能不如最初预期的那样有效。因此,目标可能缺乏足够的保护。
障碍分析的目的是确定未受保护的途径或不再有效的障碍和控制。从历史上看,可能造成伤害的能量已被用于表征路径。途径可以包括电气、机械、流体、化学、热、辐射等。因此,障碍和控制是物理的或与物理伤害相关的。
图 6 中的屏障分析是在许多涡轮机上发现的典型润滑监测系统。危险是由于油流量不足而导致液膜轴承损失。预防障碍包括监测温度、流量和油藏油位的仪器。除了监控之外,还使用了备用和应急油泵的附加屏障。当超过警报水平时,缓解开始,需要操作员干预。最后一个障碍是涡轮机紧急停机,可能由轴承温度和油流损失触发。
目标的身体或非身体状况的变化可能是有害的或不需要的。现在,对物理以外的机制的考虑将注意力转向更多基于知识、软件、策略或管理的领域。
优势
障碍分析的优点是概念简单、易于使用、需要最少的资源并且与其他根本原因分析方法配合良好。分析结果很容易转化为纠正措施。
限制
然而,障碍分析本质上是主观的。没有两个分析师是相同的,也不会总是得出相同或相似的结论。也容易混淆原因和对策,因此不应作为确定根本原因的单一方法。
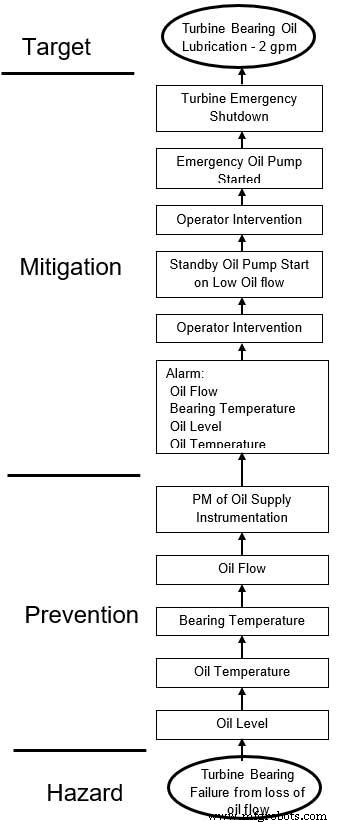
图6. 汽轮机润滑监测系统障碍分析
变化分析/Kepner-Tregoe
变更分析将单个问题或事件的规范与所需情况进行比较,以便通过比较可以发现变更和/或差异。期望的情况可能是之前已正确完成的任务或操作、类似的任务或操作,或者任务或操作的详细模型或模拟。
研究潜在原因,并测试那些需要最少额外假设或条件的原因,以验证哪些是真正的原因。成功取决于偏差规范和验证测试的准确性。
变更分析的优点是:
- 能够找到不明确或隐藏的重要直接原因。
- 分析结果很容易转化为纠正措施。
- 它是对其他方法的补充。
- 它最适合分析功能故障。
的限制 变化分析是:
- 必须有比较的基础。
- 它仅适用于单个特定偏差。
- 它只识别偏差的直接原因。
- 结果可能不是决定性的,需要进行测试。
Kepner-Tregoe 是一种增强的变化分析,它使用四个类别(谁、哪里、何时和范围)和两个过滤器(是和不是)来开发描述偏离条件的特征列表。每个偏离特征或它们的组合成为整体偏离状况的潜在原因。在 Kepner-Tregoe 系统中,变更分析被称为问题分析。这是用于评估问题的三种工具之一。
Kepner-Tregoe 过程通常从情况评估开始,以澄清问题情况(发生了什么),然后使用以下子集之一来完成分析。 这些方法的关系如图7所示。
-
问题分析:这里查找问题的实际原因以及原因和结果之间的关系(为什么会发生)。
-
决策分析:根据决策标准,做出选择以达到潜在的问题解决方案(我们应该如何行动)。
-
潜在问题分析:预测未来可能出现的问题,并制定预防措施(结果是什么)。
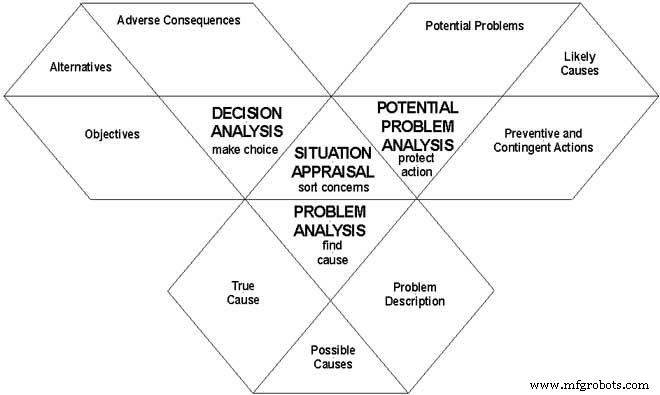
图7 . Kepner-Tregoe 模型
统计工具
有几十种统计方法和工具可用。它们通常用于描述过程和产品变化。统计信息可用于识别设备性能趋势,例如平均故障间隔时间 (MTBF)、平均维修时间 (MTTR)、进度合规性、工作订单积压、工作订单期限等。统计工具通常不被认为是故障分析工具,但它们在识别趋势和偏离预期结果方面的重要性对于成功的维护工作至关重要。帕累托图是设备故障分析中经常使用的一种重要统计工具。
帕累托分析
帕累托理论由意大利经济学家维尔弗雷多·帕累托于 1897 年提出,用以解释财富分配不均。 J.M. Juran 博士开始将这一原则应用于缺陷分析,将“重要的少数”与“琐碎的许多”分开,并将其称为“帕累托图”。这通常被称为 80-20 规则,因为 20% 的问题导致了 80% 的问题,或者相对较少的问题占了绝大多数问题。
帕累托图按等级顺序显示缺陷的相对频率,允许组织可靠性工作以“获得最大收益”或“摘取低垂的果实”。
您几乎可以使用任何电子表格或制图软件生成帕累托图。图 8 中的图表显示了实际帕累托分析的结果。修复图表中的第一项每年减少了超过 100 万美元的维护支出,最重要的是允许将维护资源用于其他可靠性工作。图表中的前五项每年增加了 1800 万美元的收入。
The Pareto chart is a simple-to-use and powerful graphic to identify where most problems in a plant originated. It won’t help with catastrophic failures but is an extremely useful tool for finding the chronic problems that over time consume as much of reliability and maintenance resources as catastrophic failures.
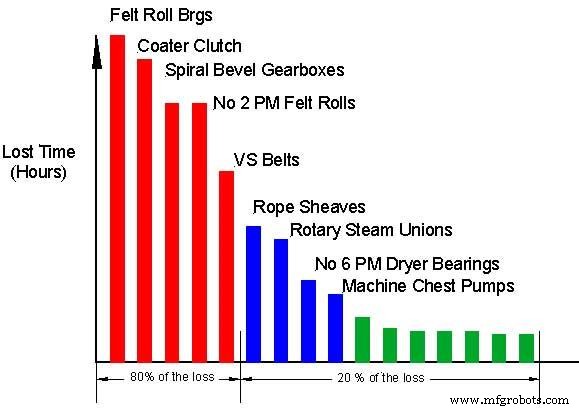
Figure 8. Pareto chart
Data Analytics
In manufacturing and process industries, the Internet of Things (IoT) or data analytics is an application of statistical methods to process data. Data analytics in failure analysis is typically confirmation or disproving of an existing hypothesis or discovering new information in the data.
Data analytics is a process of inspecting, cleansing, transforming and modeling data with the goal of discovering useful information, suggesting conclusions and supporting decision-making (Figure 9).
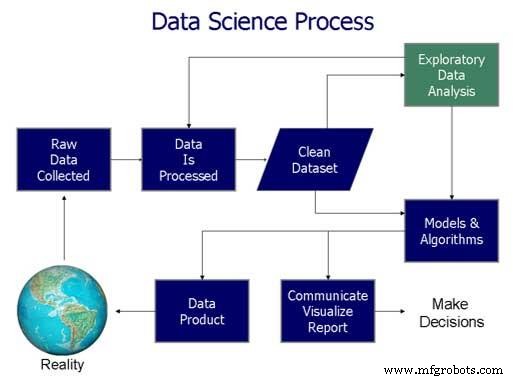
Figure 9. Data science process flow chart from "Doing Data Science" by Cathy O'Neil and Rachel Schutt
When one hears about “big data,” Google, Facebook, Amazon, Apple and other consumer companies come to mind, as organizations that gather enormous amounts of data about us and through data science use it to predict how we will behave in the future. Targeted ads are just one example.
In manufacturing and process industries, the situation is different. The development of wireless sensors has enabled us to inexpensively collect vast amounts of data. We can quickly gather process data and use statistical methods to confirm or discover new relationships in our factories and plants. A decade ago, monitoring a process variable, such as temperature, required installation and wiring a temperature RTD with power and a connection back to a PLC or DCS so data could be captured. Now, it is possible to install a self-powered RTD and transmitter with a wireless data link to the IoT.
A variety of statistical tools can be applied to the data to confirm or refute hypothesis or discover new relationships between process variables. This ability adds a powerful tool to a root cause analysis, particularly of functional failures. Depending on the data quality in maintenance history, it is also possible to discover hidden relationships within the maintenance data using text analytics.
The number of people employed in industry is shrinking. Experience and knowledge is walking out the door in the form of retiring baby boomers. Data analytics shows promise to help close the gap between a shrinking knowledge base and the need for better root cause analysis. In the world of mechanical failure analysis, a gap between the need for spectral vibration data and data analytics still exists. Overall vibration levels can be processed, but data analytics software has considerable room for improvement in the treatment of spectral vibration data.
In the next decade, you can expect to see an accelerating shift toward smart instruments, the IoT and data analytics. For example, think how a control valve positioner can automatically calibrate and configure itself, do diagnostics to maintain loop performance levels, improve control accuracy to reduce process variability, and tell you about it.
Pitfalls in Root Cause Analysis
There is a strong temptation to place blind faith in particular root cause analysis models. After all, they have been proven to work, and why reinvent the wheel? Predefined structured processes can save valuable time. However, it is important to remember that the answers may lie outside a chosen process. Models can be useful because they help strip away unimportant data. If we use models without knowledge of their assumptions and limitations, we may miss important facts and misdirect our analysis.
Do not try to include too much in your analysis. The temptation is strong to add in every possible cause even when they are not necessary, sufficient or present to cause an effect. Remember, inclusivity does not guarantee you are effective or correct.
Verify all the evidence and hypothesis. It is very easy to take the wrong path if a hypothesis is wrong. Be aware that just because the boss has a hypothesis, it isn’t necessarily correct.
Deciding where to start and how you describe the failure has an enormous impact on the time effort and outcome of your investigation. Starting with a functional failure when there has been environmental impact, injury or substantial cost helps with the discovery of the human and organizational root causes that with few exceptions are present and play significant roles in the failure. When a failure does not result in environmental, injury or significant expense, beginning at the component level helps streamline the analysis and typically makes identification of the physical roots easier. As the analysis progresses, the degree of investigation into human and organizational causes can be balanced against the level of risk and cost acceptable to you and the organization.
Making It Happen
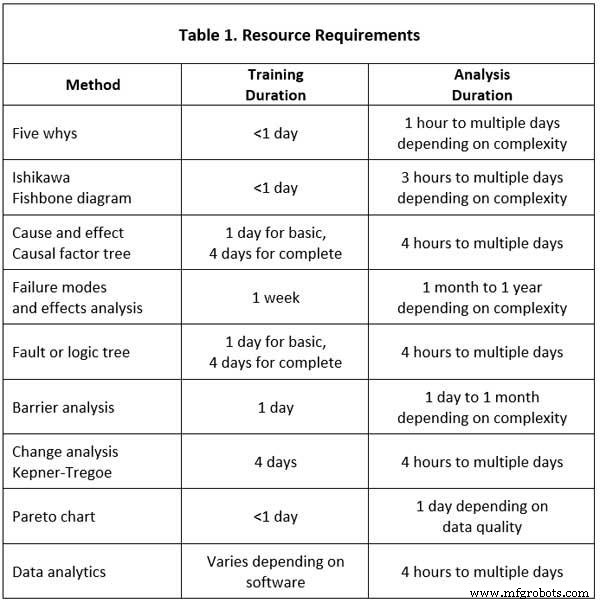
Ideally, it would be nice to have a full complement of root cause analysis tools in your plant. Choices must be made because one doesn’t have unlimited time and money. The choices become easier to make if one takes a moment to consider where the need is, how often a root cause analysis will be needed, and what resources are available. If the need is greatest for functional failures or product quality and efficiency problems, the tools used will be different than those used for component failures. If you are reading this article, it is reasonable to conclude your focus will be on component failures. Table 1 summarizes the time required.
Identifying and understanding the root causes of component failures is best when started on the shop or production floor. Technicians and front-line supervisors who can identify physical failure modes and use basic but powerful analysis tools are often the best means to prevent failures from happening in the future. Technicians and front-line supervisors would have the following skills:
-
Five whys – Learning five why analysis can be done in less than a day. The CMMS must be able to support what is learned from a Five Why analysis either with failure modes or a means to capture causes.
-
Ishikawa/fishbone diagram – This also can be taught in less than a day. It introduces people to a broader cause and effect analysis to identify effects that may have multiple causes.
-
Barrier analysis – An introduction to barrier analysis helps shift culture from simplistic solutions to the concept of risk and risk reduction.
-
Causal factor tree or fault tree analysis – Not everyone needs to be able to construct a tree, but they should be able to participate in the development of one when led by a facilitator. People closest to the point of action have information and insights that are frequently vital to identify root causes and more importantly make changes to prevent future failures. Training to introduce people to either causal factor or fault trees typically takes one day to complete.
-
Failure mode identification – This is frequently considered as a subset of the root cause analysis methods. Frequently, incorrectly identified failure modes lead analysis efforts astray. Technicians, front-line supervisors and reliability engineers must be able to correctly identify physical failure modes. This training takes four days to complete. It also helps a Pareto analysis because failure modes are correctly identified.
In every plant, there should be at least one person who has received facilitator training on causal factor or fault tree analysis and change analysis. This helps ensure consistency and reinforces the use of root cause analysis. Vendors of these methods frequently tout their system as superior to others. They all have certain strengths and weaknesses. Causal factor and fault tree analysis are very similar, so having both may lead to confusion. It is important that one is selected and used. Training for each of these methods usually takes four or five days to complete.
Reliability engineers should receive training on the following:
-
Five whys
-
Ishikawa/fishbone diagrams
-
Cause and effect/causal factor tree
-
Fault or logic tree
-
Pareto chart
-
Change analysis
-
Statistical methods - If they are involved in production issues, training on statistical methods including data analytics should be included.
Unless there is personal injury, an environmental accident or a large cost involved, don’t start every effort with an expensive analysis. You can often be more effective by using the five whys, Ishikawa/fishbone or a simple cause and effect analysis to solve many problems. A situation appraisal may help you select another method when it appears the problem can be solved with a simpler method. Causal factor trees, fault or logic trees can take a substantial amount of time to complete. This can range from a day to several weeks. Failure mode and effect analysis takes weeks or months to complete.
Additional Resource
A resource you may find useful for additional information on root cause analysis:
The Rootisseriet. This website has a wealth of articles on root cause analysis as well as links to additional resources.
物联网技术