

我的摩托车遥测
组件和用品
 |
| × | 1 | |||
| × | 1 | ||||
| × | 1 | ||||
| × | 1 | ||||
 |
| × | 1 | |||
 |
| × | 2 | |||
| × | 1 | ||||
| × | 1 | ||||
 |
| × | 1 | |||
 |
| × | 1 | |||
 |
| × | 1 | |||
 |
| × | 1 | |||
 |
| × | 1 | |||
| × | 1 |
应用和在线服务
 |
| |||
 |
| |||
| ||||
 |
| |||
| ||||
|
关于这个项目
每次我开始一个新项目时,我都会尝试利用与我的热情相关的最新技术来创造一些东西。对于这个项目,我决定将我对摩托车的热情与我最喜欢的爱好(使用 Arduino)结合起来。
想法
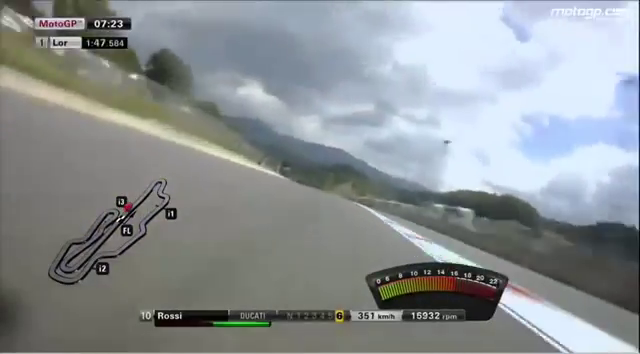
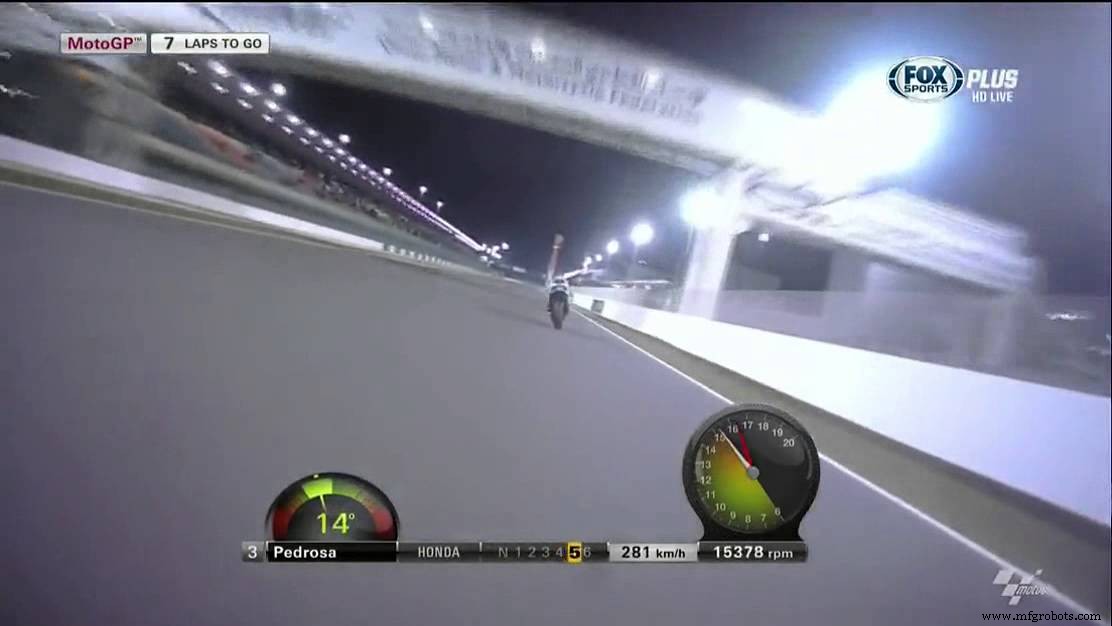
我一直对我在电视上看到的关于 motogp 比赛的遥测图像着迷。看到下面的图片,我想象了如何使用我最喜欢的小工具 (Arduino) 和我的编程知识来构建它。
所以我决定开发一个基于 Arduino 和 Azure 的遥测系统,该系统易于复制,以便所有摩托车爱好者都可以在他们的摩托车上拥有一个。
如下所示,该遥测系统将能够获取有关您的驾驶风格的以下信息:
- 速度 [Km/h]
- GPS 位置(纬度/经度)
- 卫星信息(卫星号、Hdop)
- 海拔高度 [米]
- 倾斜角度
- 车轮角度
- 3 轴上的 G 加速度 [m/s^2]
- 外部温度 [°C]
- 后轮胎温度 [°C]
- 前减震器 [cm]
- 后减震器 [cm]
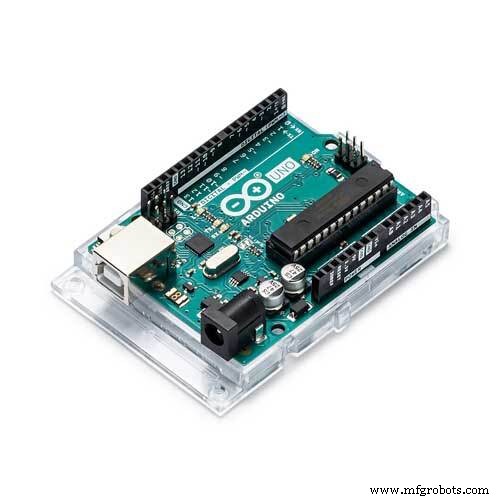
为此,我使用了 Arduino Uno R3、一些传感器、部署在 Windows Phone 中的 UWP 和一些 Azure 服务。
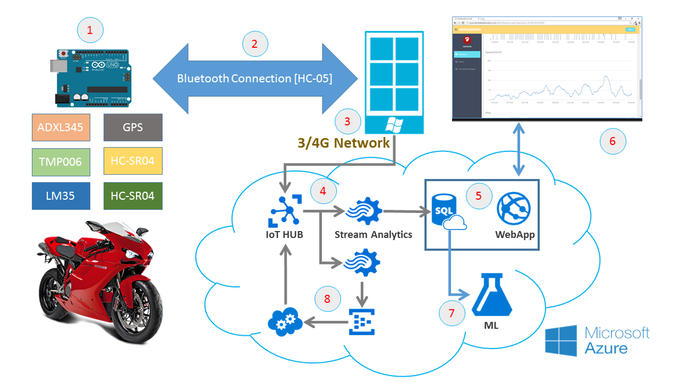
工作流程如下图所示:
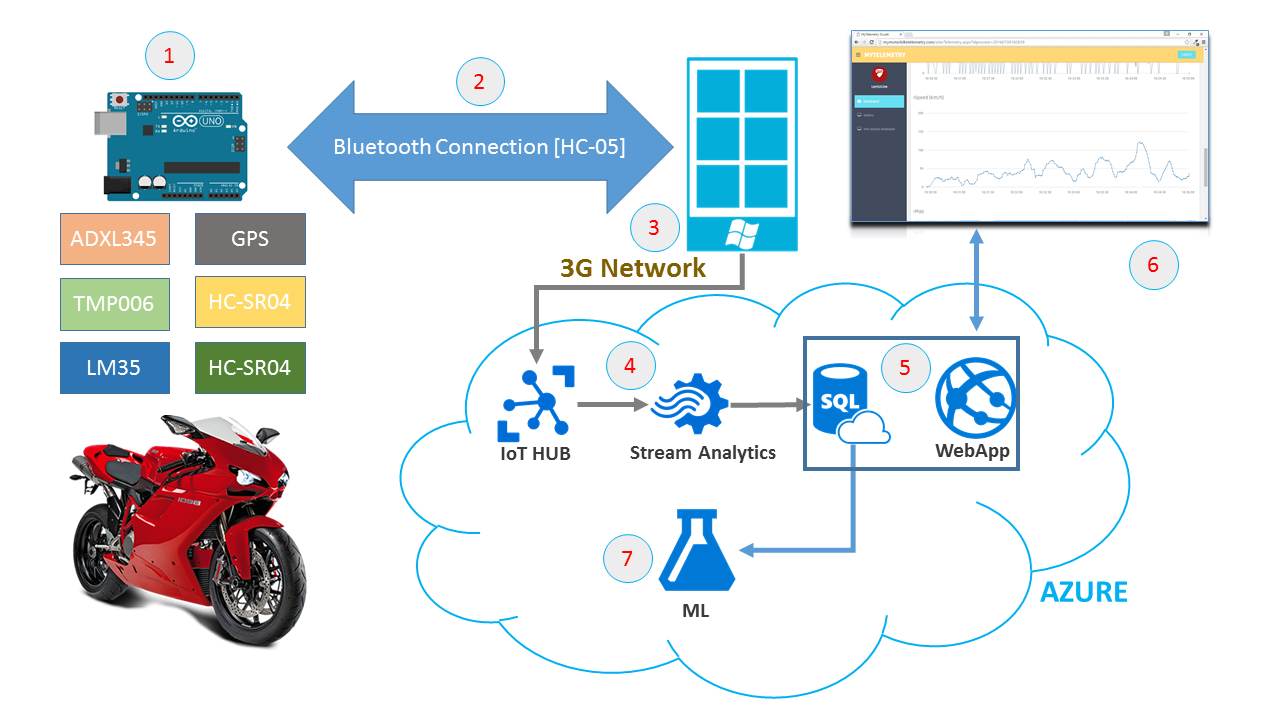
- 第一阶段 - 所有遥测数据均从控制单元</em>获取 大约每秒两次(控制单元位于摩托车上)。
- 第二阶段 - 每次获取数据时,数据通过蓝牙发送 从 Arduino 到 Windows Phone .
- 第三阶段 - 数据显示在手机中(更多详细信息请阅读“软件”部分),然后通过 3G/4G 网络发送到 Azure IoT HUB .
- 第 4 阶段 - 在 azure 上有一个流分析工作 从 IoT HUB 接收数据并将信息保存在 SQL Azure 数据库中。
- 第 5 阶段 - 在 azure 上已经部署了一个 WebApp 使用 SQL 数据库数据以实时显示遥测数据(请阅读 Web App 部分)
- 第 6 阶段 - WebApp ,使用身份验证过程并在图表中显示所有遥测信息。 (所有数据均使用Entity Framework从sql azure数据库中检索)
- 第 7 阶段 - 保存在 SQL azure 数据库中的所有数据均由 机器学习处理 以检索有关您的“驾驶风格”的信息。范围将了解如何根据遥测参数修改您的驾驶风格,以提高您的驾驶性能。
我觉得这很酷!!! 开始描述项目
硬件设置
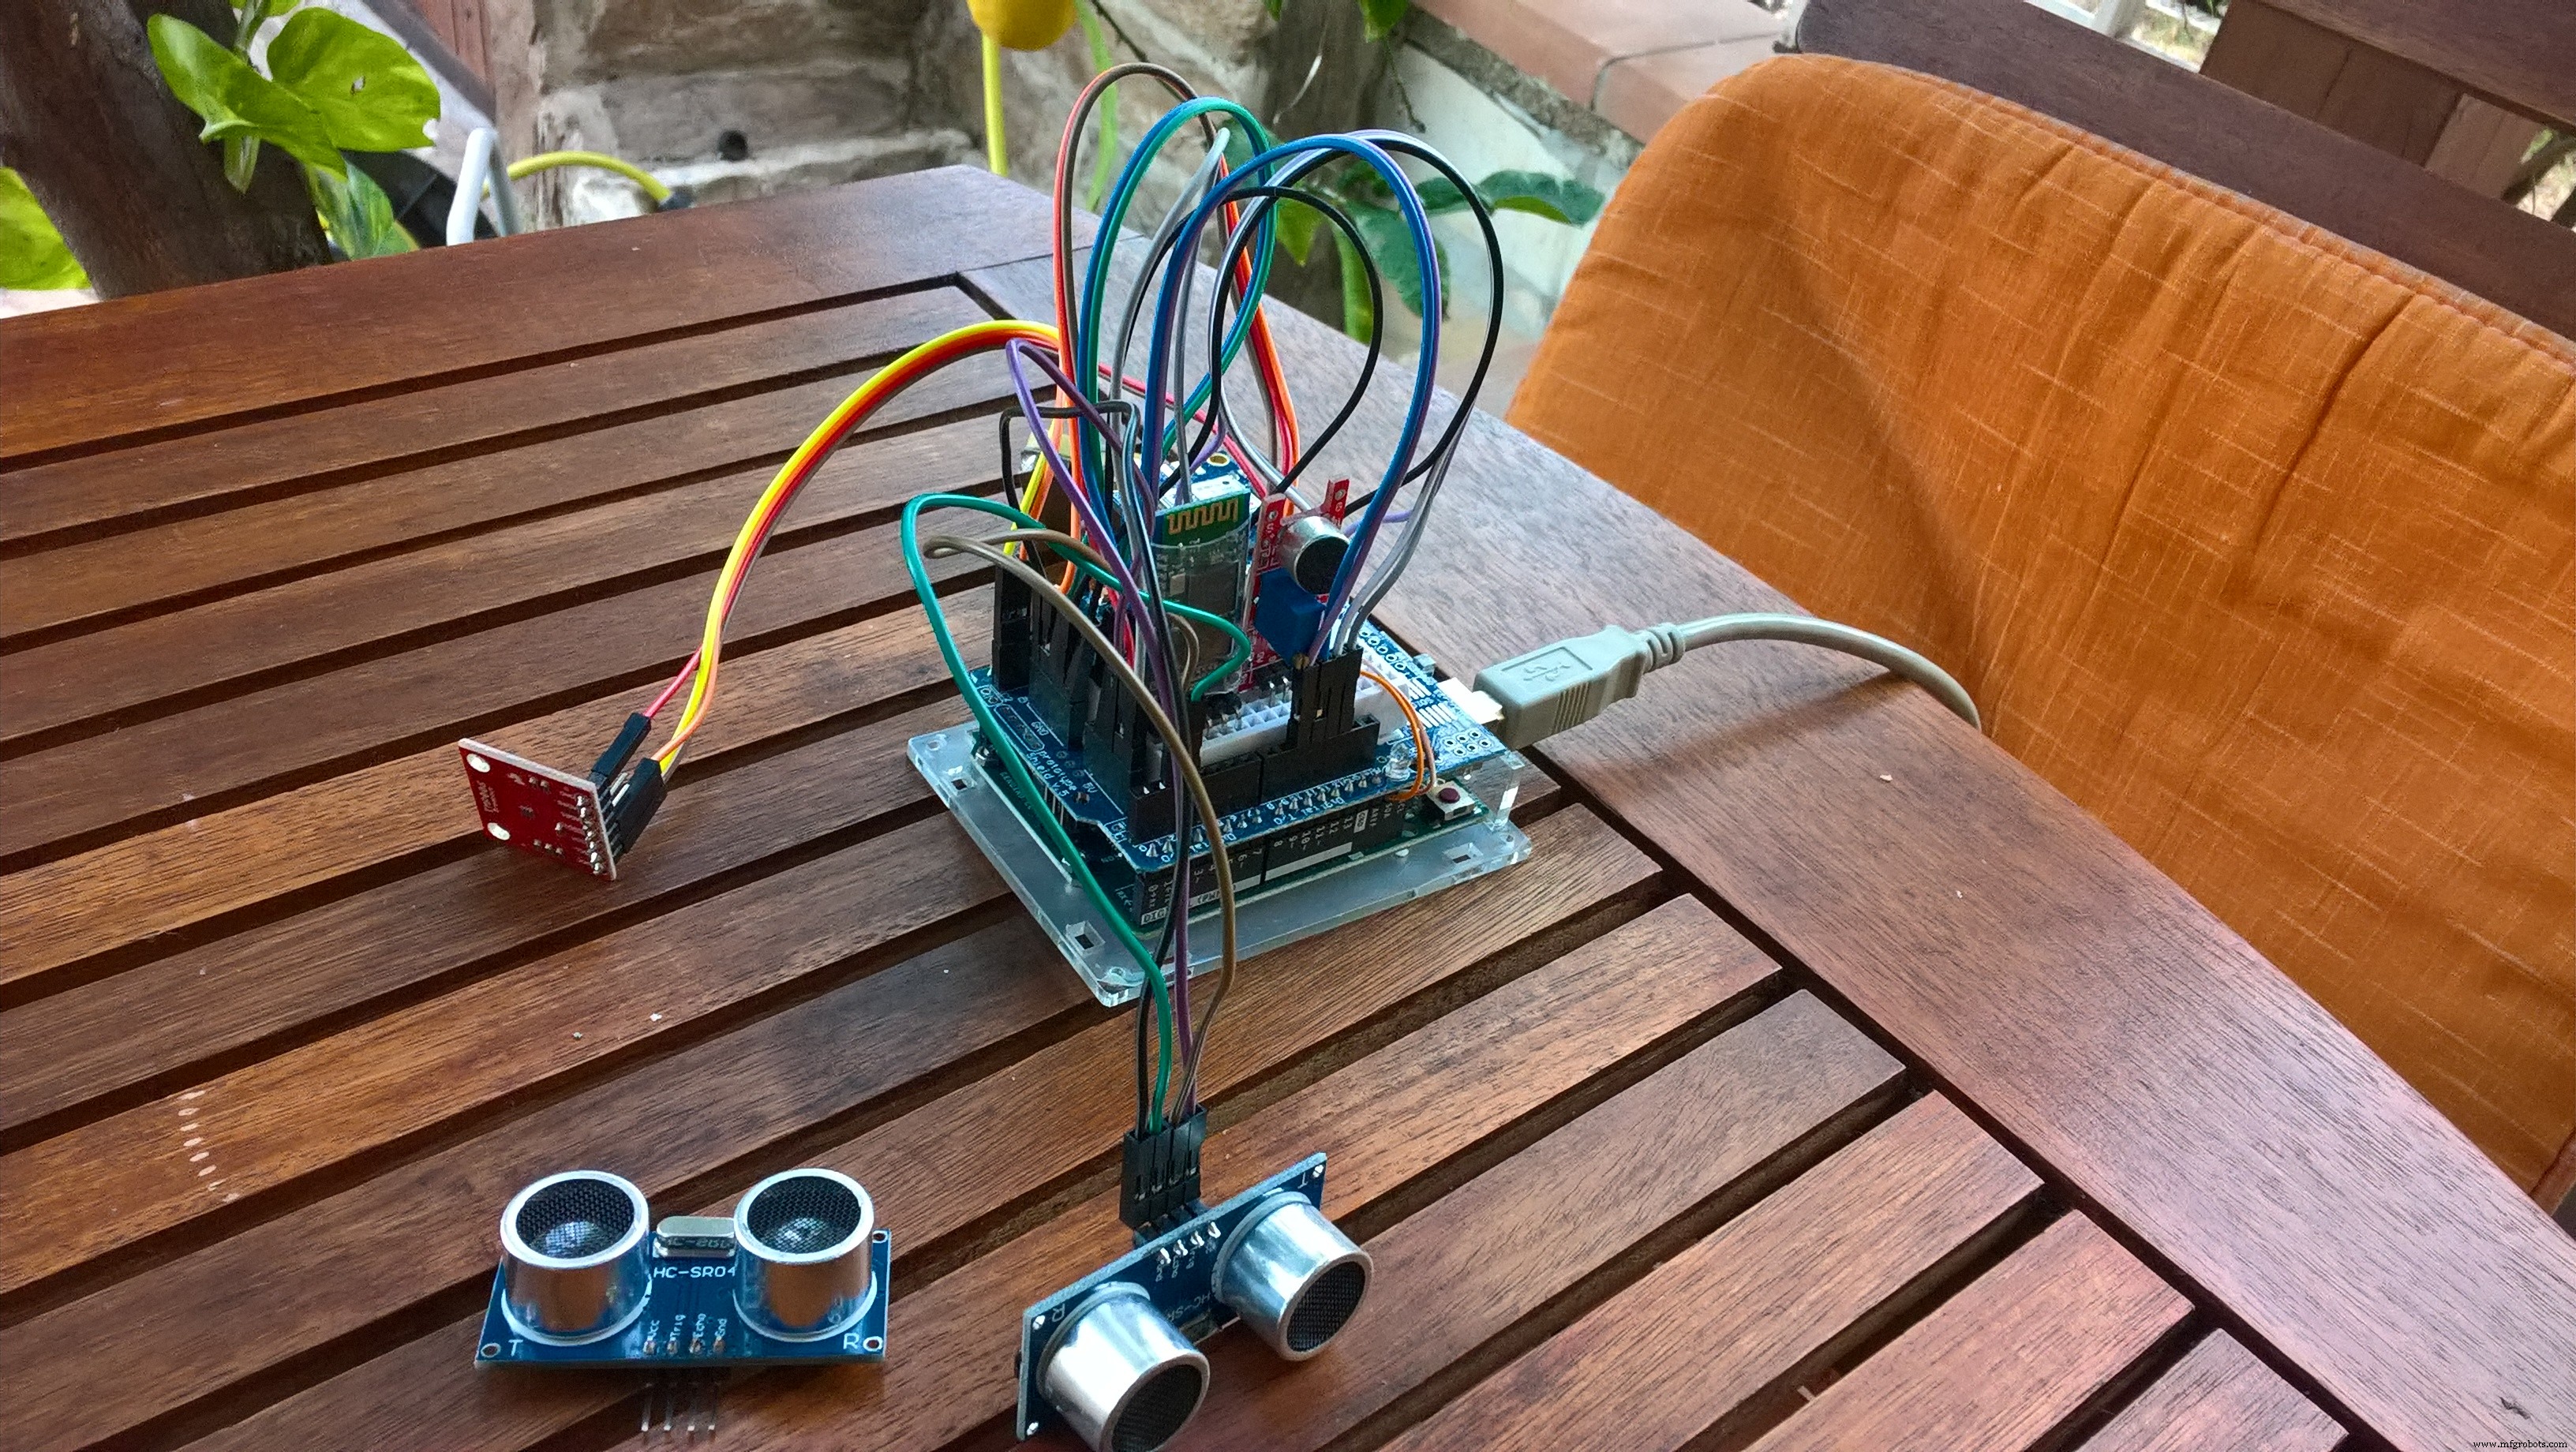
我的硬件配置如下所示。
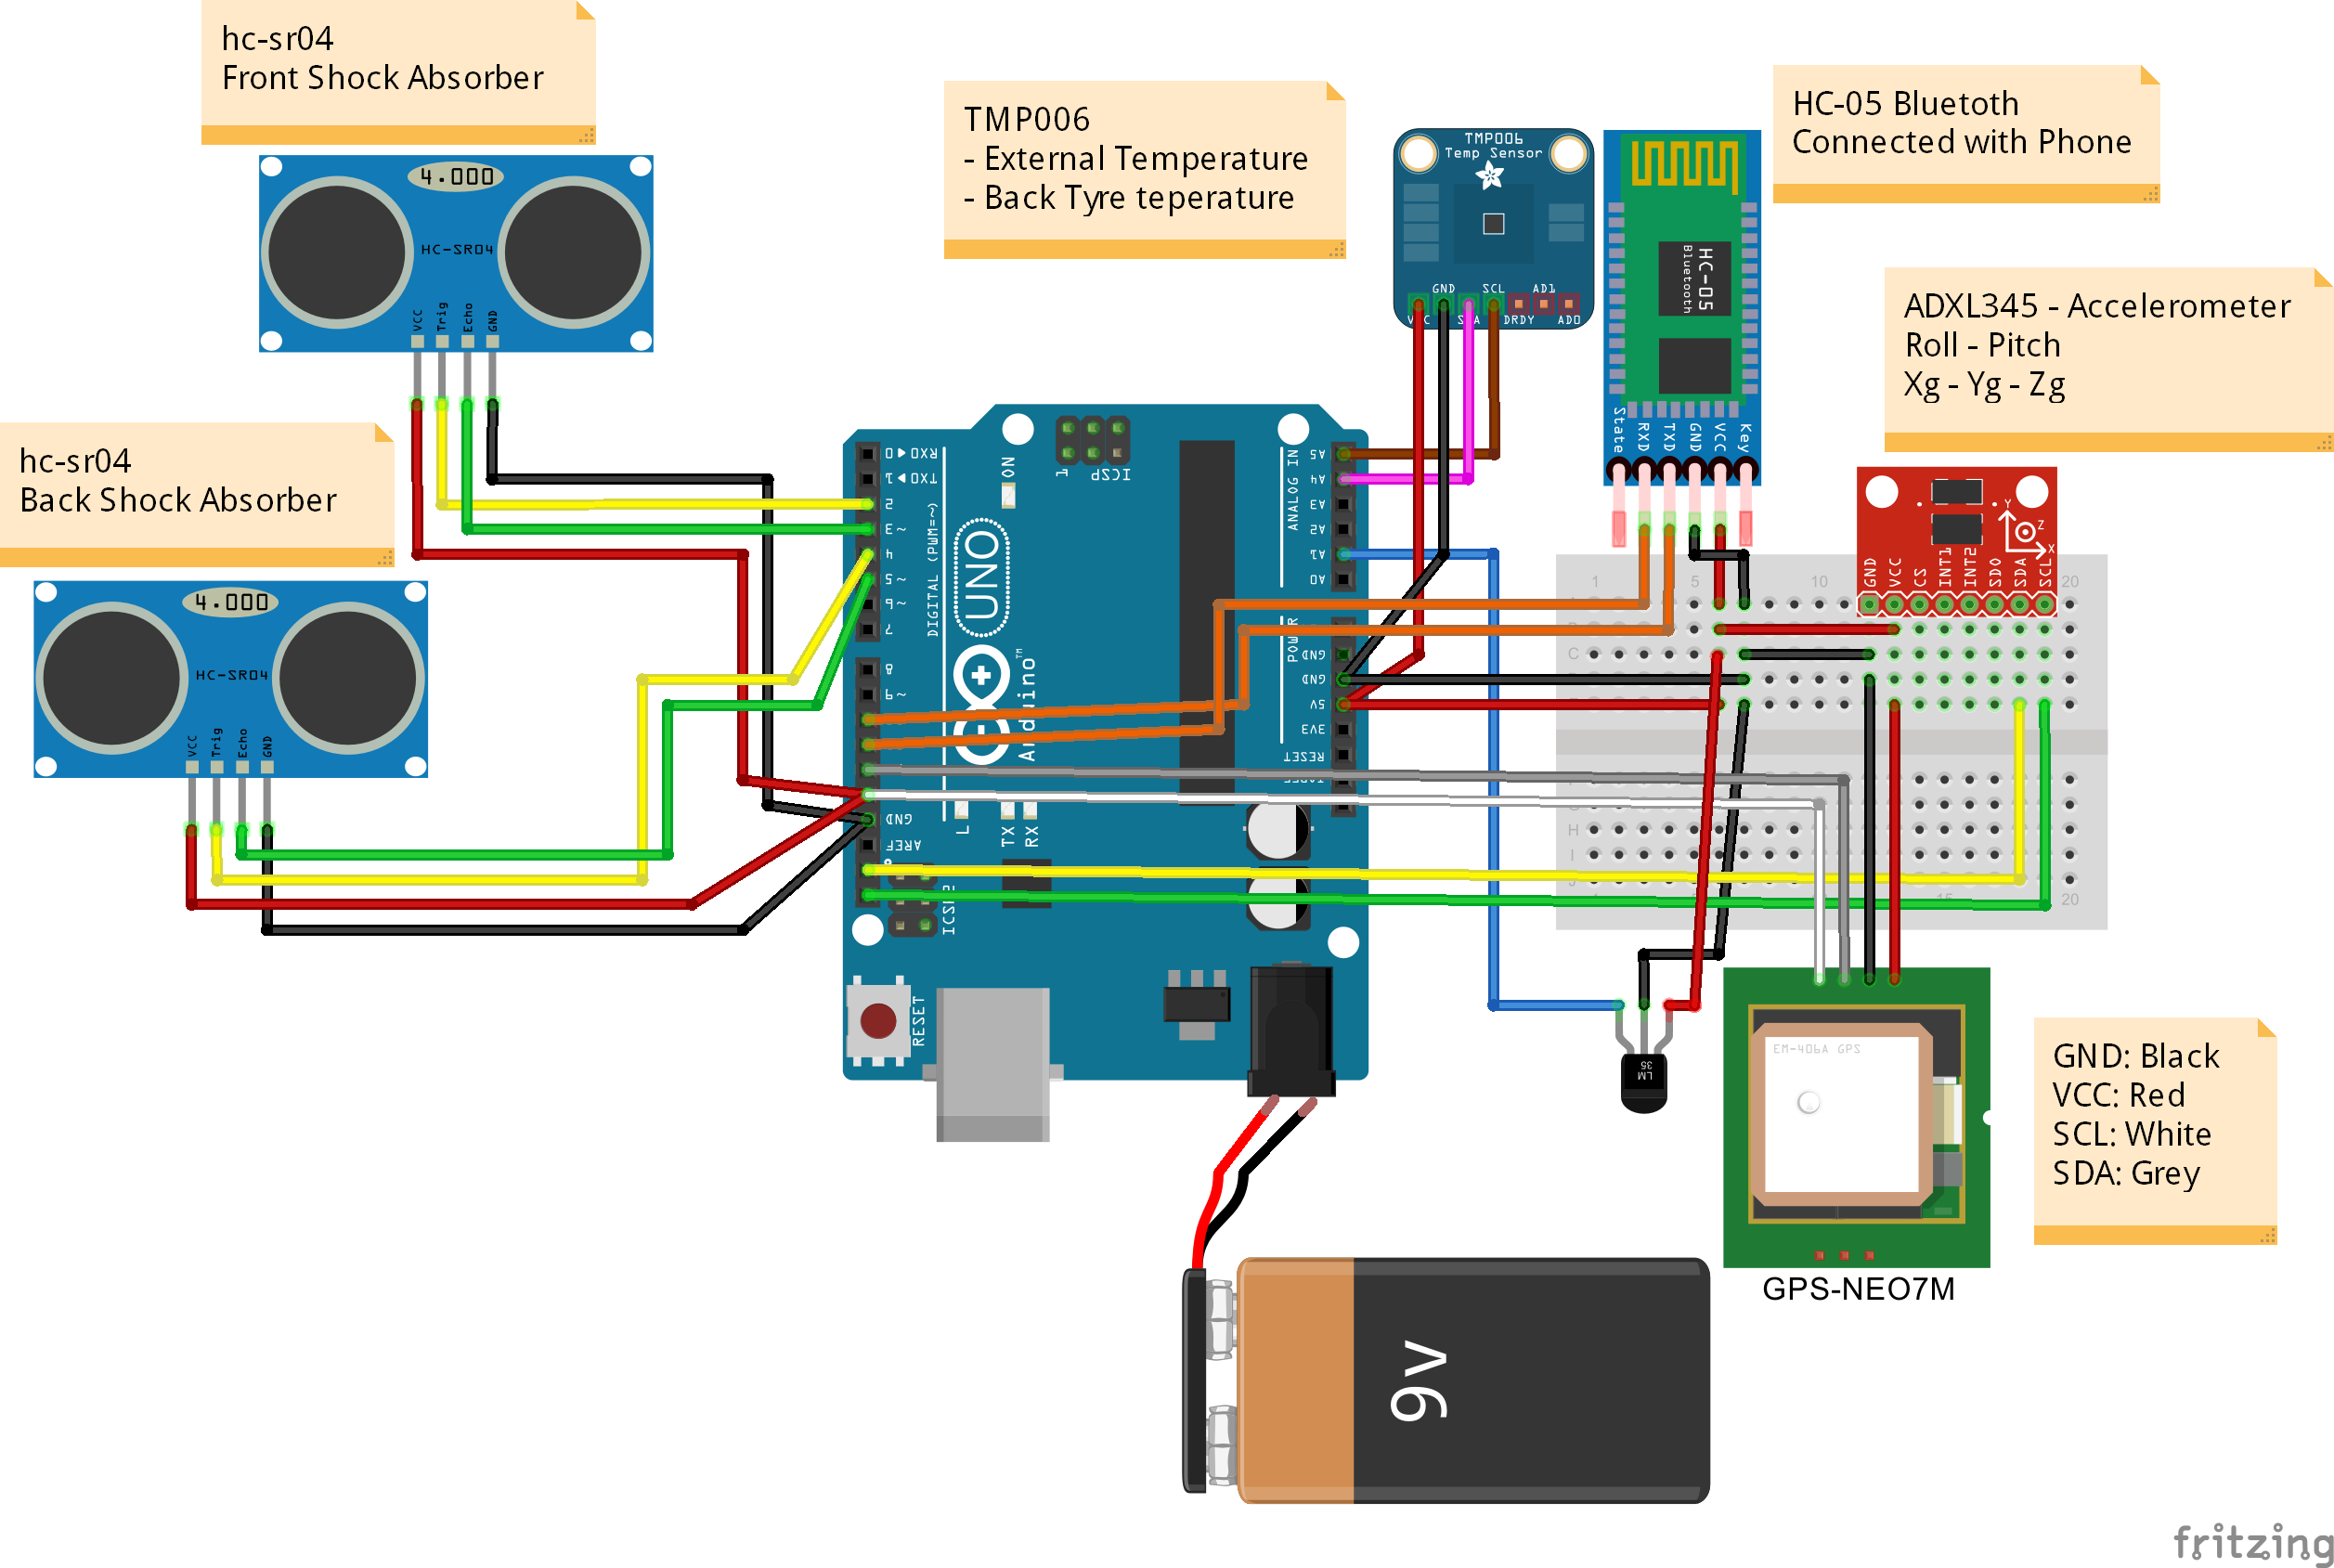
我的硬件设置包括:
- 1 x Arduino Uno R3
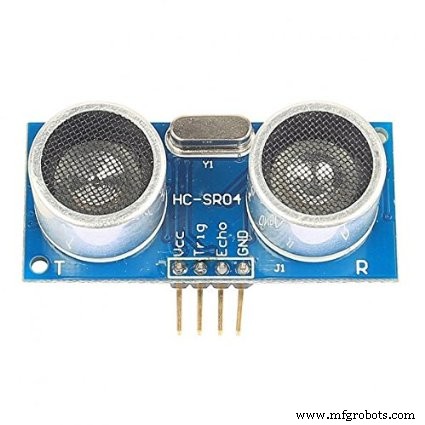
- 2 x 超声波测距模块 HC-SR04 , 用于确定减震器的延伸(前和后)
- 1 x 红外热电堆非接触式温度传感器 TMP006, 用于确定轮胎温度(也可以测量外部温度 - 可选)
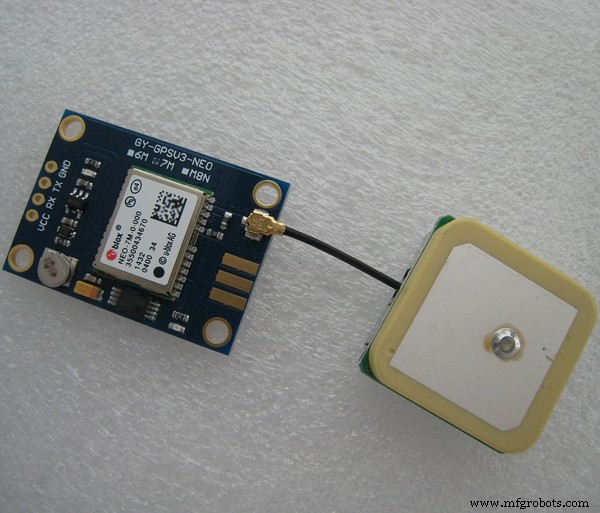
- 1 x GPS-NEO7M , 用于确定 GPS 位置、速度、高度
- 1 x ADXL345 , 用于评估 3 轴的 G 加速度并计算倾斜角和前轮角
- 1 x LM35DT 为了确定外部温度
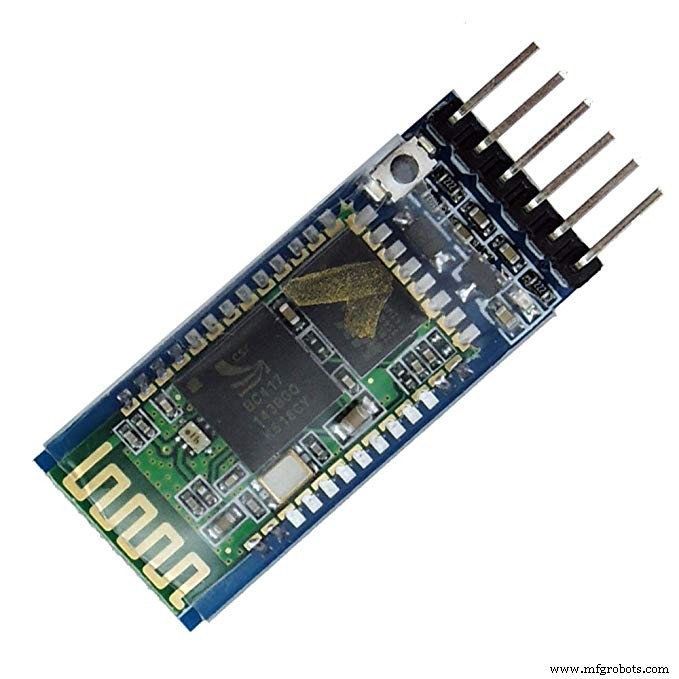
- 1 x HC-05 , 蓝牙模块,用于arduino和windows phone之间的通信
- 1 x 电源 (通用电池或移动移动电源 )
第 1 步 - 蓝牙连接
我使用了 SofwareSerial 库将蓝牙模块与Arduino连接并启用与Windows Phone的无线通信。
HC-05 为该示波器选择了蓝牙模块,它是具有串行端口配置文件的 2 类蓝牙模块,可配置为主机或从机。
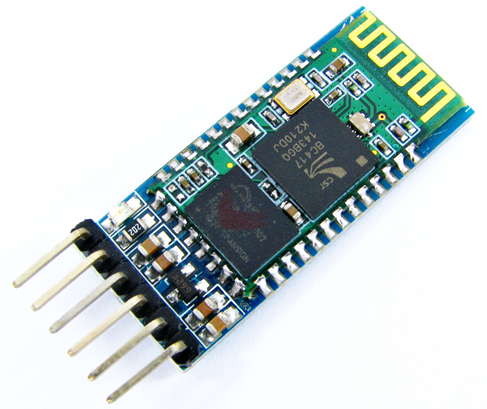
下一步是更改我的蓝牙设备的默认名称,默认名称是 HC-05 ...它不“有吸引力”
如何使用此设备:
在您的 Arduino 代码中:
- 包括SoftwareSerial 图书馆
- 定义 RX/TX 端口
- 初始化通信:
#include [...]SoftwareSerial BTSerial(10,11); // RX-TX[...]void setup(){BTSerial.begin(9600);[...]} 您现在可以使用以下命令行通过蓝牙发送您想要的每个字符串:
...BTSerial.print("Hello Hackster");...
Windows Phone 和 Arduino 之间的通信现已准备就绪,非常简单!
第 2 步 - GPS 通信
用于此范围的硬件是 GPS-NEO7M 模块,它是一个低功耗的 GPS 模块,具有 56 个通道,并以 10Hz 的频率输出精确的位置更新。
Arduino 和 GPS 模块之间的通信由 SoftwareSerial 完成 库并利用名为 TinyGPS++ 的非常有趣的库
如何与此传感器通信:
- 定义 RX/TX 端口
- 初始化 TinyGPS 对象
- 初始化通信
看下面的代码:
#include #include //定义与GPSSoftwareSerial ss(12,13)的串行连接; // RX-TX// 定义一个 TinyGPS 对象TinyGPSPlus gps;void setup(){// GPS Inizializess.begin(9600);[...]}void loop(){// 当 GPS 可用时读取信息同时(ss .available()>0){if(gps.encode(ss.read())){if(gps.location.isValid()){double lat=gps.location.lat();double lon=gps.location .lng(); }}}[...]} 第 3 步 - 加速度计
为了确定 3 个轴的加速度值并计算横滚角和俯仰角(倾斜角和前轮角),我使用了 ADXL345
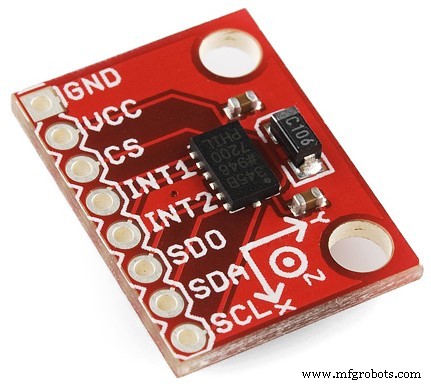
ADXL345 是一款小巧、纤薄、超低功耗、3 轴加速度计,具有高达 ±16 g 的高分辨率(13 位)测量。数字输出数据格式为 16 位二进制补码,可通过 SPI (3 线或 4 线)或 I2C 数字接口。
Arduino 和 ADXL345 传感器之间的通信使用 ADXL345.h 图书馆。
很重要的一点是,当您连接此传感器时,您将能够确定 3 轴上的重力加速度,但不会立即校准这些值。您需要创建用于设置 OFFSET 的代码。
我决定在第一个循环中确定“零点”。为此,第一个循环中的 G 加速度将成为您必须在后续测量中减去的参考值。
// 第一个循环到 if (i ==0) {refXg =Xg; refYg =Yg; refZg =Zg;i =1;}//减去零点Xg =Xg - refXg;Yg =Yg - refYg;Zg =Zg - refZg + 1; 然后您必须根据 g 加速度分量计算倾斜角和前轮角。
下面你可以看到 2 个简单的数学方程来做到这一点:
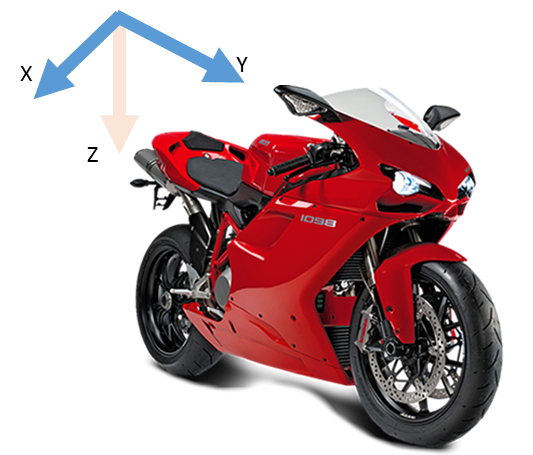
// 滚动和俯仰方程roll =-(atan2(-fYg, fZg) * 180.0) / M_PI;音高 =(atan2(fXg, sqrt(fYg * fYg + fZg * fZg)) * 180.0) / M_PI; 在这个项目中你必须考虑:
- Z 轴是自然重力轴
- Y 轴是运动的方向
- X 轴是横向运动
如何与此传感器通信:
- 初始化 ADXL345 对象
- 初始化通信
现在您已准备好读取加速信息,请参阅以下代码:
#include #include #include //定义与GPSSoftwareSerial ss(12,13)的串行连接; // RX-TX// 定义一个ADXL345 ObjectADXL345 acc;void setup(){// ADXL345 Inizializeacc.begin();[...]}void loop(){// 读取g加速分量double Xg,Yg,Zg; acc.read(&Xg,&Yg,&Zg);} 第 4 步 - 轮胎温度
为了确定轮胎温度,我需要一个传感器,由于显而易见的原因,它不会接触轮胎。独特的方法是使用红外温度传感器。为此,我决定使用 TMP006 传感器
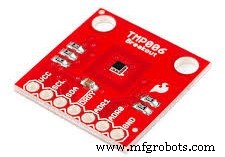
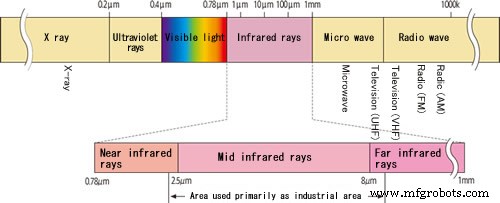
TMP006 是完全集成的 MEMS 热电堆传感器,无需直接接触即可测量物体的温度。热电堆从物体吸收波长在 4 um 之间的被动红外能量 到 16 um 在最终用户定义的视野内。
热电堆两端的相应电压变化被数字化并通过 I2C 由片上芯片热传感器测量报告
现在的问题是,我必须将传感器放在哪里?查看数据表,您可以找到有关传感器和物体之间推荐距离的重要信息。
必须遵守距离必须小于物体立体角半径的一半的规则。
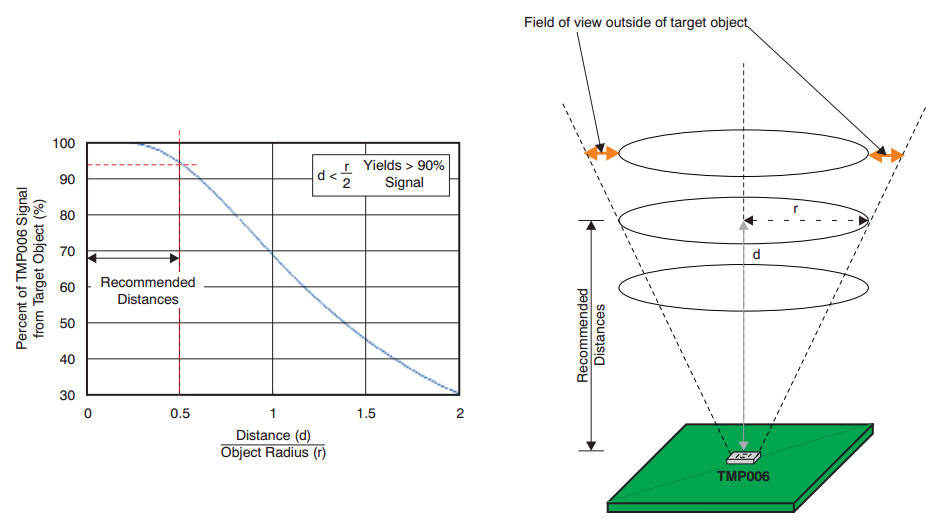
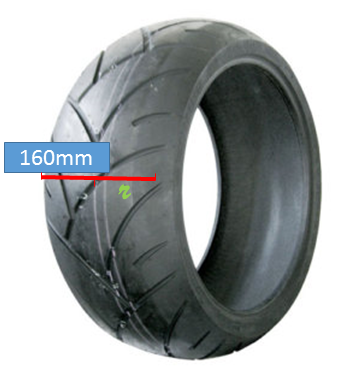
换句话说,我的轮胎宽度是 160mm ,半宽就是立体角的半径 (R),所以 R 的最终结果是 80mm。所以推荐距离为40mm (或更少),等于R/2
Arduino 与 TMP006 之间的通信 使用 SerialSoftware 制作 库和 Adafruit_TMP006.h 图书馆
#include #include "Adafruit_TMP006.h"/TMP006 函数的变量************************* **************/Adafruit_TMP006 tmp006;void setup(){}void loop(){// Read object IR temperature float objt =tmp006.readObjTempC();// 读取传感器温度(外部温度)浮动饮食 =tmp006.readDieTempC();} 第 5 步 - 外部温度
外部温度的值已使用 LM35 确定 传感器(DT封装)。
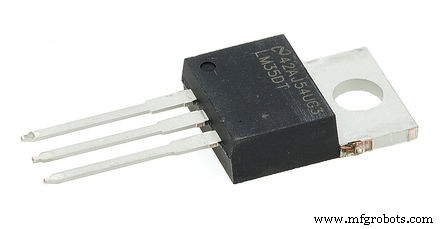
LM35系列是精密集成电路1温度器件,其输出电压与摄氏温度成线性比例。
每摄氏度产生 10 mV 的增减电压
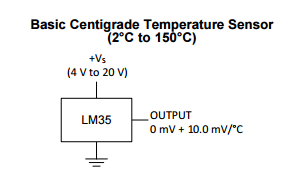
读取 Arduino 模拟输入 (AI) 已确定传感器值
int TempExtPin =A1; // 选择输入引脚 float celsius =0, farhenheit =0; // 温度变量浮动毫伏; int sensor;[...]sensor =analogRead(TempExtPin); //读取LM35值毫伏=(传感器/1023.0)*5000; //毫伏输出电压celsius =毫伏/ 10; 第 6 步 - 超声波定位
使用该传感器的目的是确定摩托车悬架的偏移。

HC-SR04 测量声波在遇到障碍物后折回所需的时间。声波发射光束为圆锥形,同样适用于障碍物的反射波。
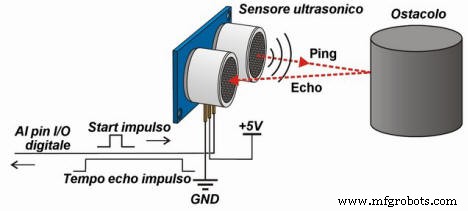
在 20°C 时,空气中的声波速度约为 343.4 m/s,在此示例中为简单起见,我们将考虑 340 m/s 的近似值 .
考虑运动学定律 S=V x t (其中 S:物体的空间或位移,V:速度,t:时间)我们可以宣布在我们的例子中距离是 S=0.034 x T .
我们必须将时间除以每 2 次,因为我们转换的时间是过去随波逐浪来回的时间,最终公式 t 是从传感器返回的时间,单位为 cm/microsecond 是:
S=0.034 x t/2
您可以在下面看到一个示例,您可以尝试使用该示例来确定对象的距离。
digitalWrite( triggerPort, LOW );// 发送 10 微秒脉冲到 triggerdigitalWrite( triggerPort, HIGH );delayMicroseconds(10);digitalWrite(triggerPort, LOW);long duration =pulseIn( echoPort, HIGH );long r =0.034 * 持续时间 / 2; 上面的代码很好地描述了传感器的工作原理,但您会发现此代码非常慢且性能不佳 .
对于这个项目,我决定尝试名为 NewPing.h 的新库 欲了解更多详情,请访问此链接并查看项目的完整 Arduino 代码。
使用 NewPing.h 图书馆很容易。
- 包括图书馆
- 定义HC-SR04的触发和回声端口
- 初始化对象
- 调用 ReadPositionPing 函数。
#include /**************************************** *******定义 HC RS04 函数的变量**************************************** ******/// HC-RS04 端口int triggerPort =2;int echoPort =3;// 引脚的NewPing 设置和最大距离NewPing sonar(triggerPort, echoPort, 200);void setup(){}void loop() {/***读取位置***/int Pos=ReadPositionPing();}int ReadPositionPing(){unsigned int uS =sonar.ping();return sonar.convert_cm(uS);}
UWP 软件
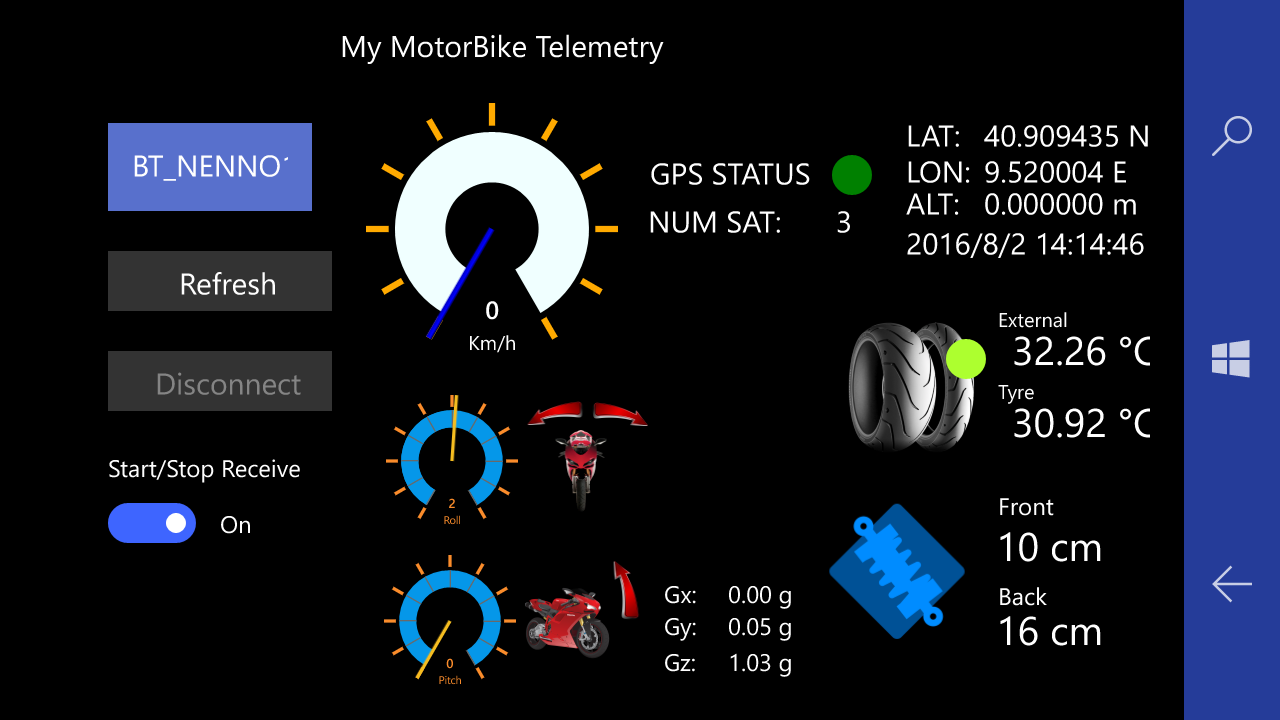
该软件包括一个通过蓝牙连接到控制单元的用户界面。 UI 显示从 Arduino 发送并发送到 IoTHub 的所有数据 传感器值。
通过读取输入字符串来解释 Arduino 和 UWP 之间的串行通信。
每个字符串 通过检查包含 START 的内容来验证收到的 和结束 标记。如果输入的字符串格式正确,应用程序将吐出信息并将其显示在应用程序用户界面上。
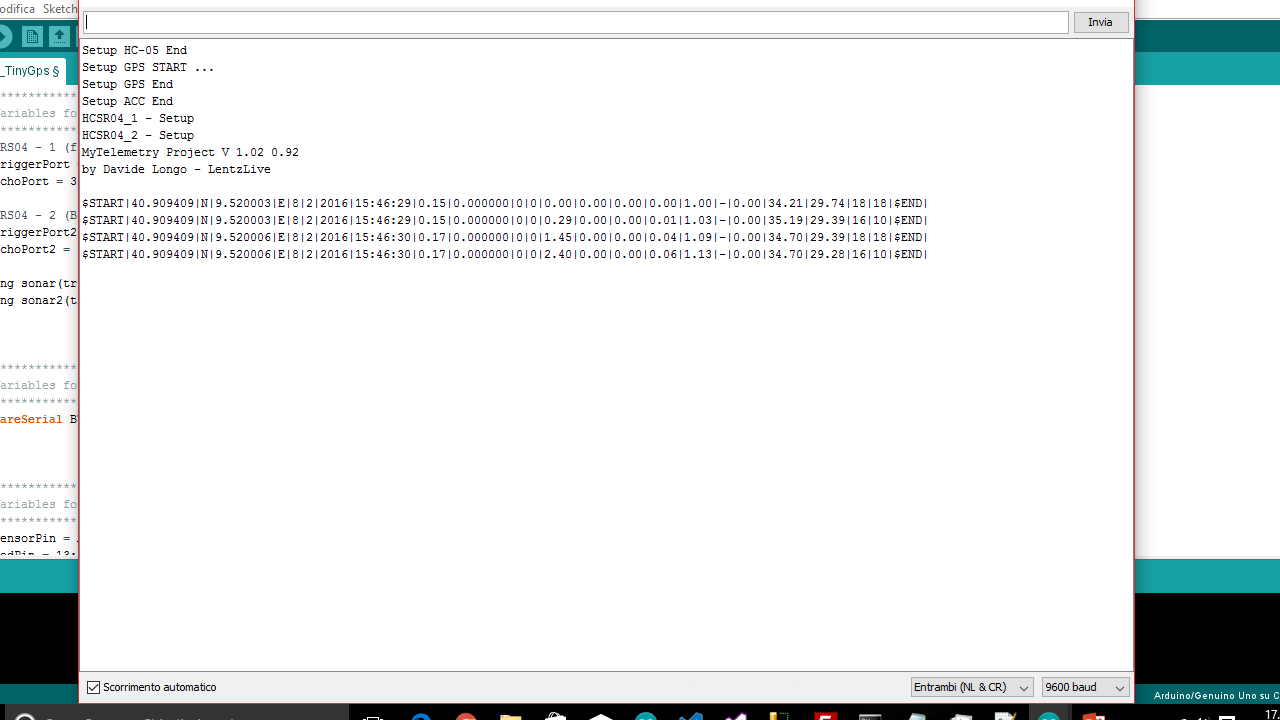
下面你可以看到一个从 Arduino 发送的包含 START/END 标记的字符串的例子,这个字符串将被“管道”字符分割,以确定每个传感器的值:
$START|40.909409|N|9.520008|E|8|2|2016|15:46:42|0.09|0.000000|0|0|-0.21|0.00|0.00|-0.02|0.90|-|0.09 35.19|29.58|16|10|$END|
发送的字符串拆分后的Array定义如下:
- 位置 0 - 开始标记
- 位置 1 - 纬度
- 位置 2 - N(北)
- 位置 3 - 经度
- 位置 4 - E(东)
- 位置 5 - 月
- 位置 6 - 天
- 位置 7 - 年
- 位置 8 - hh:MM.ss
- 位置 9 - 速度(公里/小时)
- 位置 10 - 海拔(米)
- 位置 11 - 卫星(卫星数量)
- 位置 12 - hdop(使用的卫星数量)
- 位置 13 - 滚
- 位置 14 - 音高
- 位置 15 - Xg
- 位置 16 - Yg
- 位置 17 - Zg
- 位置 18 - 音频(可选-当前禁用 )
- 位置 19 - 距离(米)
- 位置 20 - 温度(LM35 的外部温度)
- 位置 21 - 温度轮胎(来自 TMP006 的轮胎温度)
- 位置 22 - 前减震器 (cm)
- 位置 23 - 后减震器 (cm)
- 位置 24 - 结束标记
通过 Arduino IDE 的“串行监视器”,您可以看到 Arduino 代码是如何工作的:
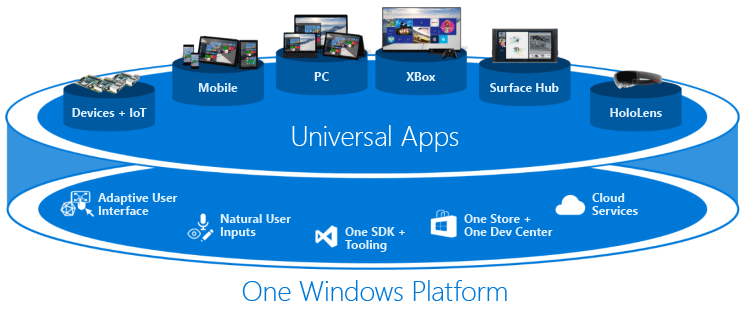
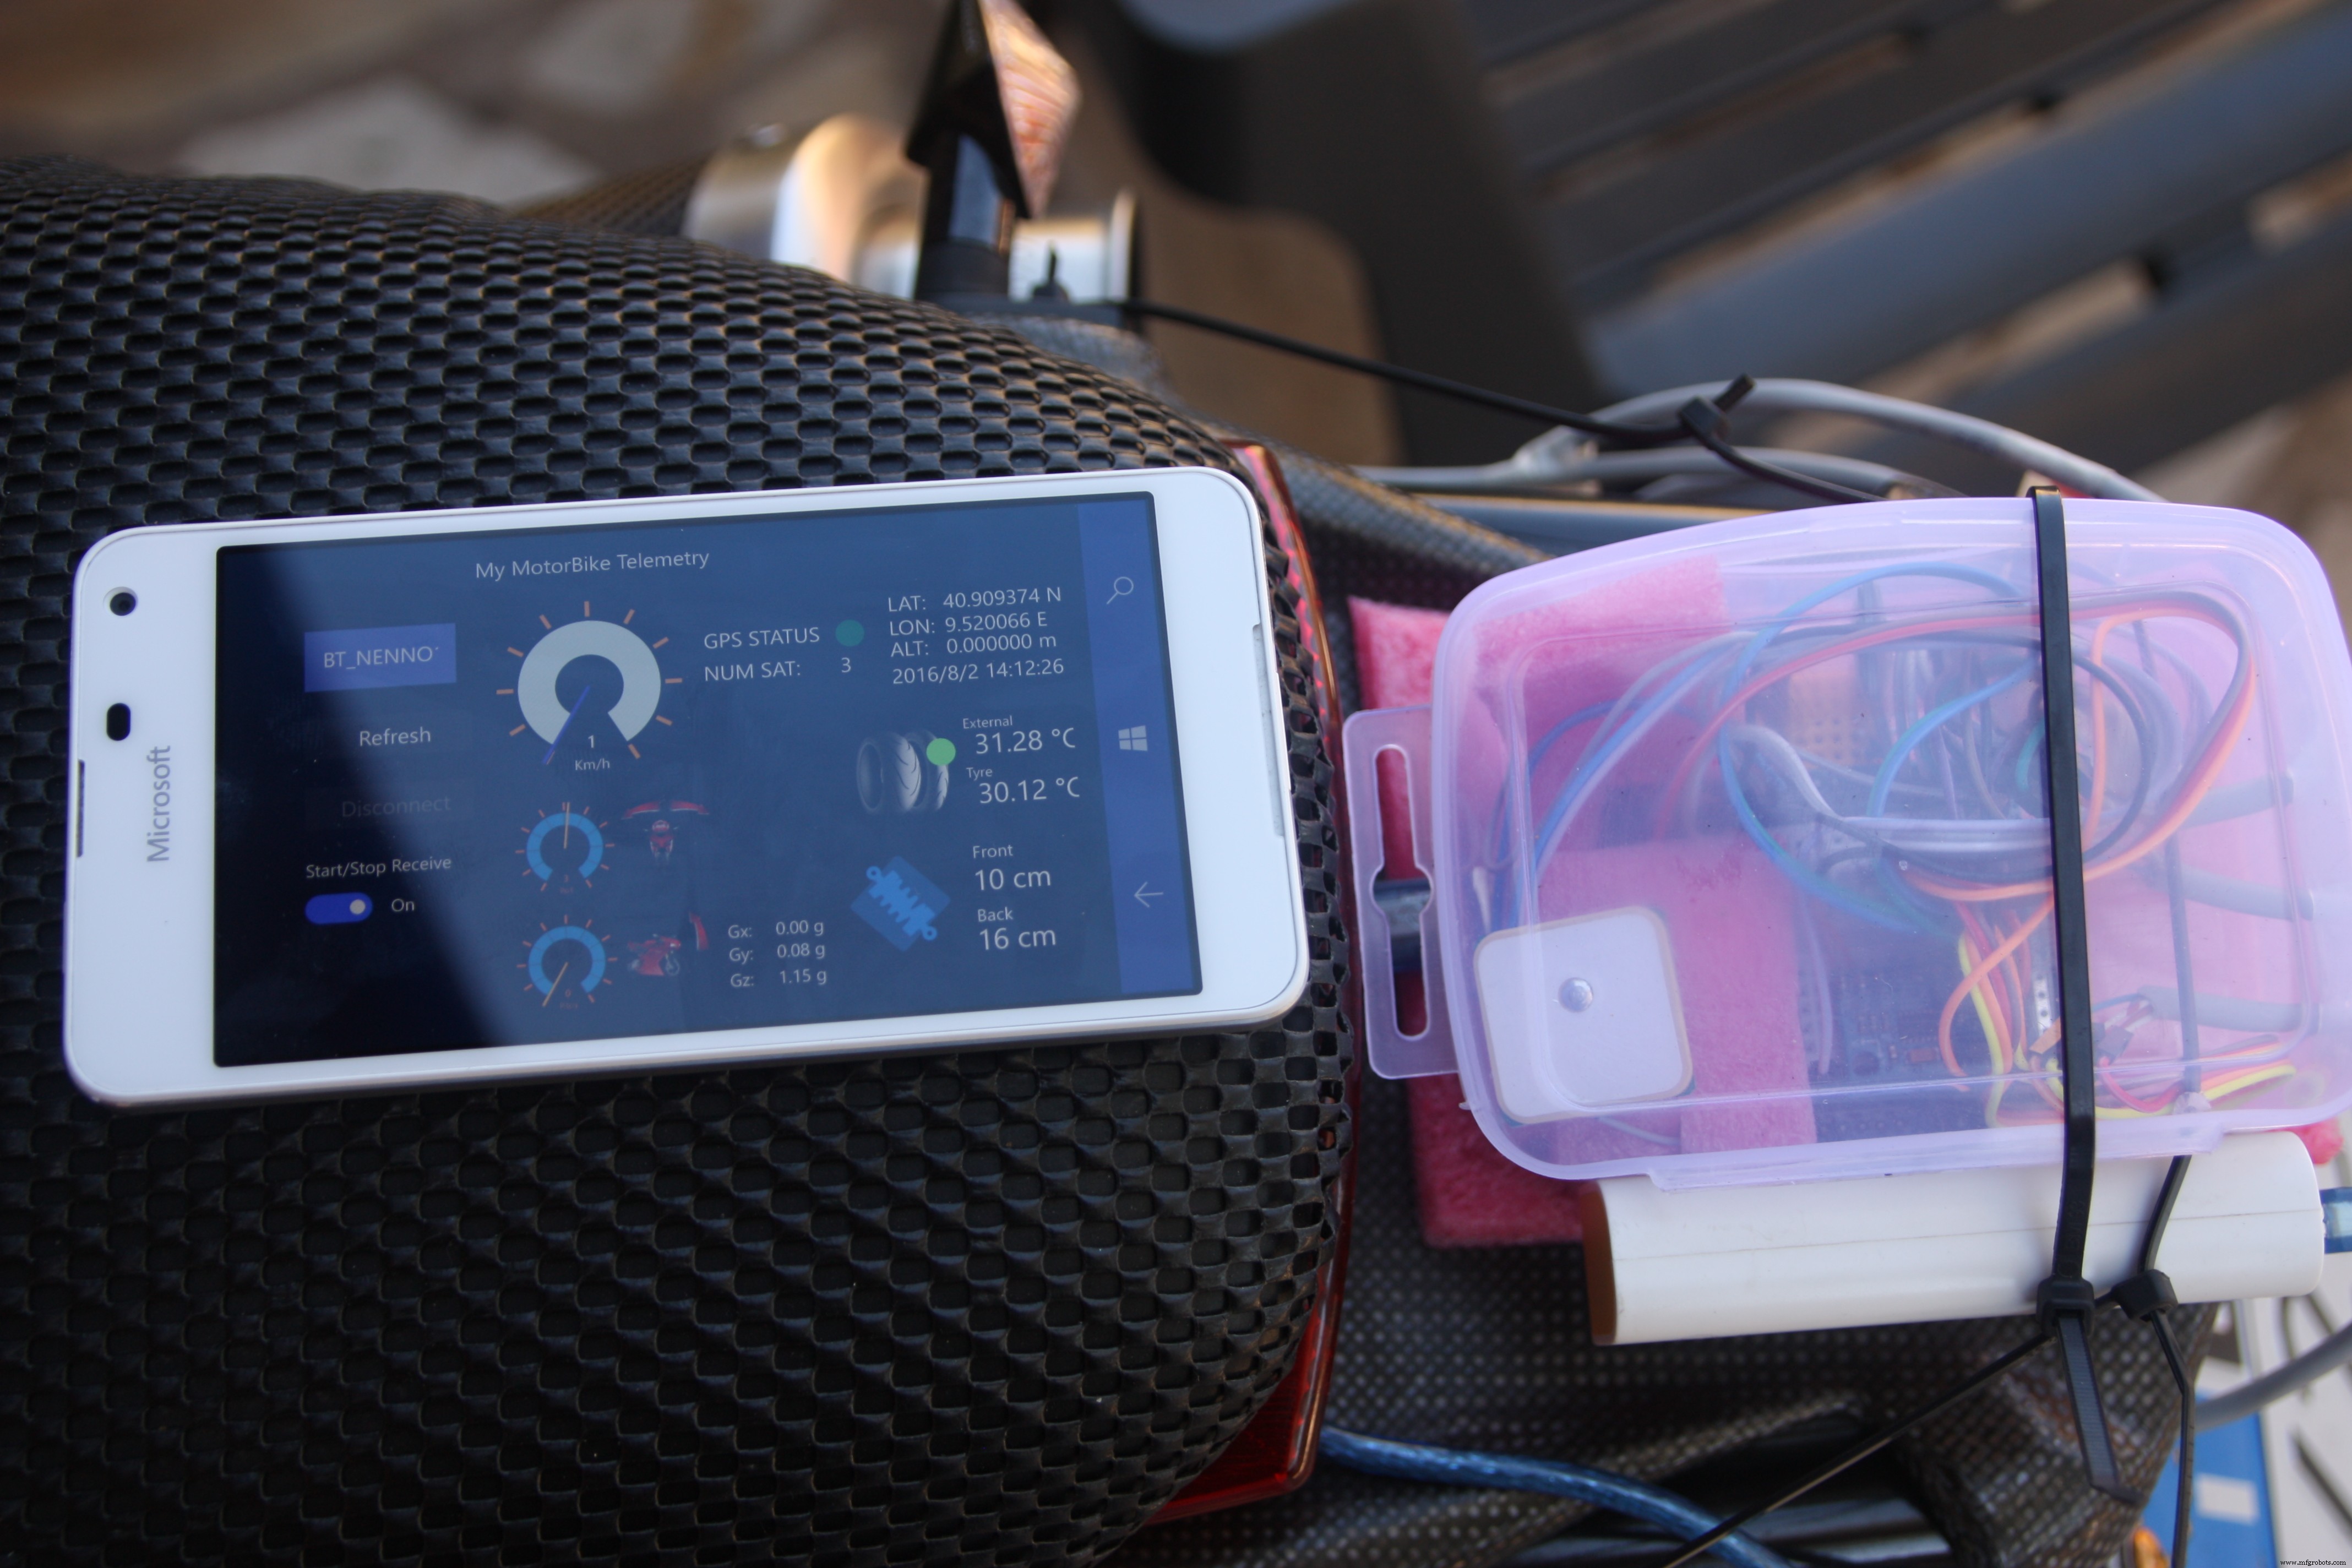
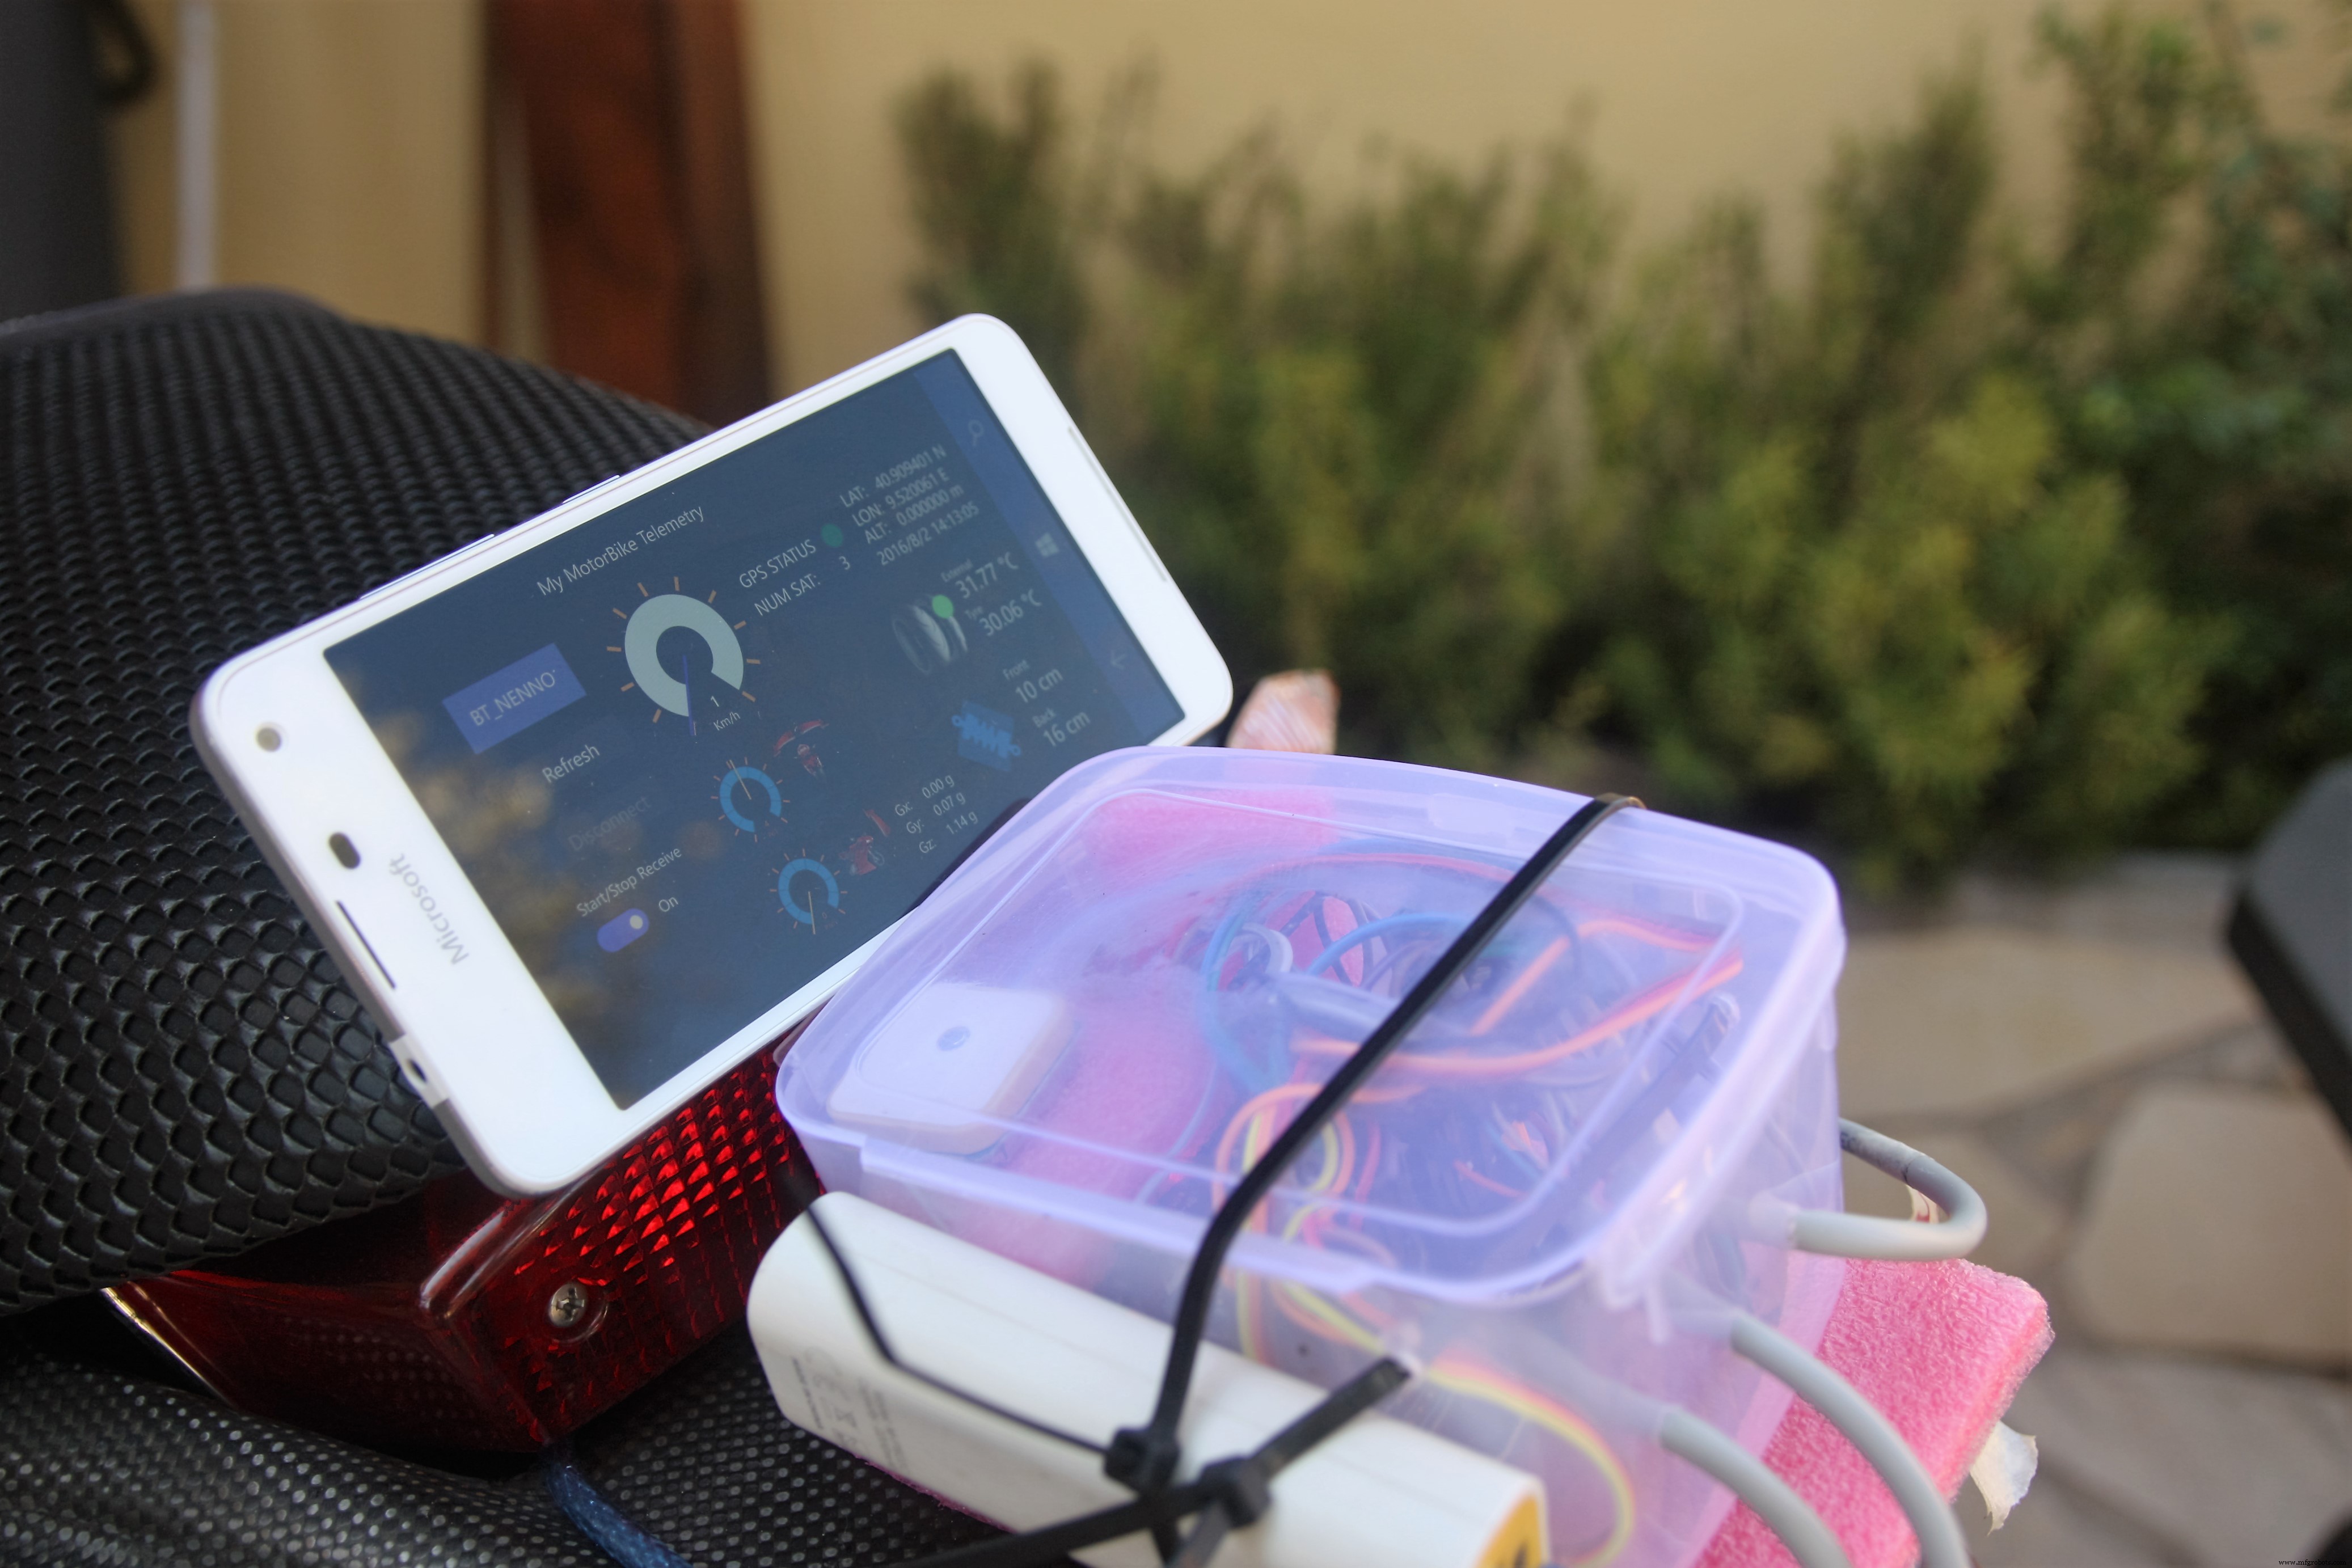
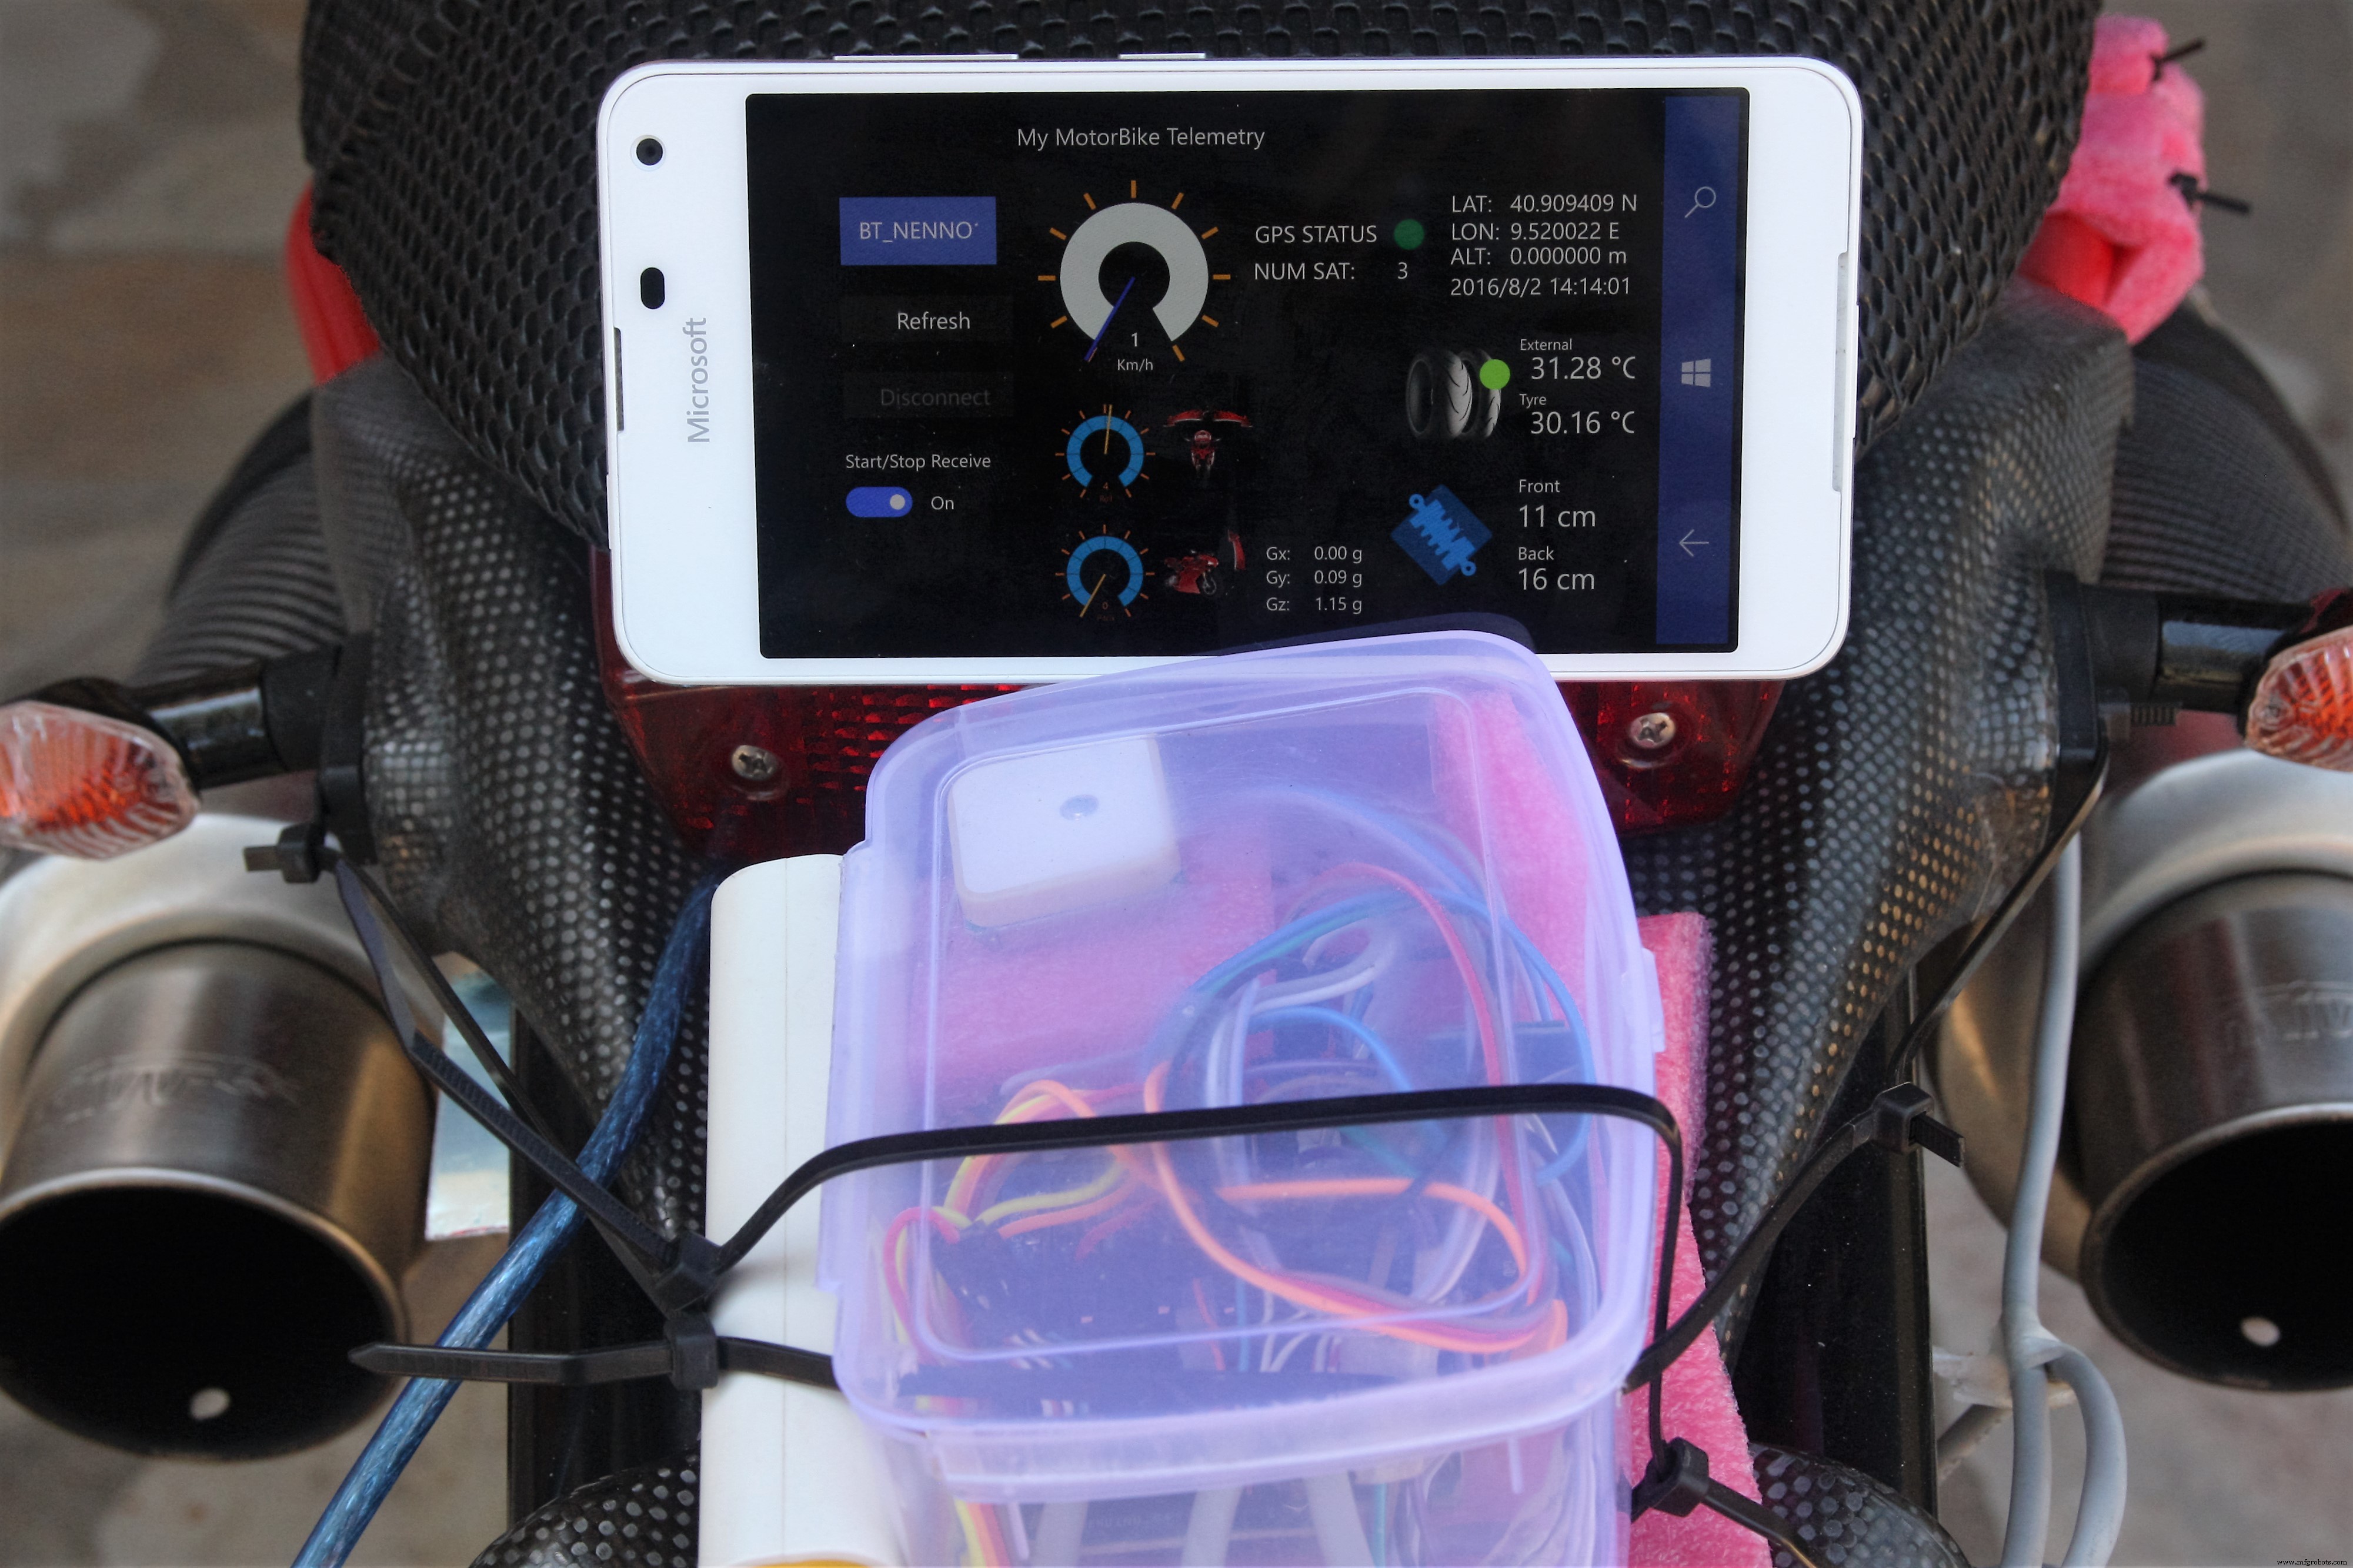
为了管理通过蓝牙从中央单元发送的所有数据,我开发了一个通用 Windows 应用程序,它是 UWP 功能的一个很好的例子。如您所知,UWP 是一个平台,允许您在搭载 Windows 10 的所有设备系列中运行应用程序。
用户界面非常简单直观,左侧可以看到蓝牙连接功能,中间3个仪表用于显示速度、倾斜角度和前轮角度。显示了所有 G 分量,右侧显示了有关 GPS 位置、温度和减震器偏移的信息。
如何将应用部署到 Windows 10 移动版?
在 Windows 10 SDK Preview Build 10166 中,微软引入了 Windows 10 应用程序部署 (WinAppDeployCmd.exe) 工具。
Windows 10 应用程序部署 (WinAppDeployCmd) 是一个命令行实用程序,可用于将通用 Windows 应用程序从 Windows 10 PC 部署到任何 Windows 10 移动设备。它允许用户将 .AppX 文件部署到通过 USB 连接的设备或在同一子网上可用的设备,而无需访问完整的 Visual Studio 解决方案。
第 1 步:
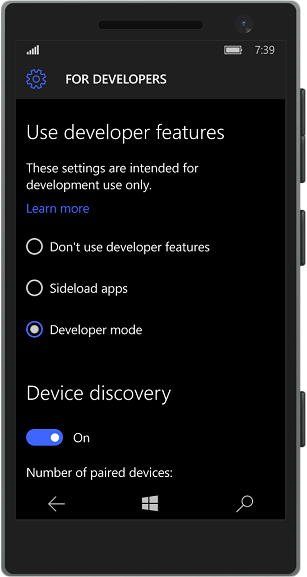
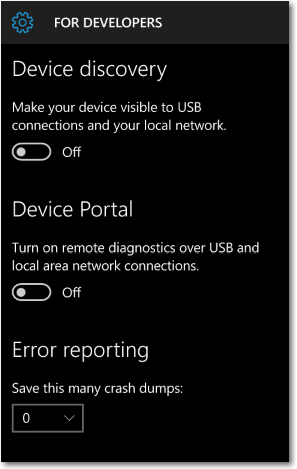
首先将您的移动设备移动到“开发者模式”(转到更新和安全 => 对于开发者 ).
之后,通过USB连接您的设备并使其可见USB连接(将返回PIN码)
第 2 步:
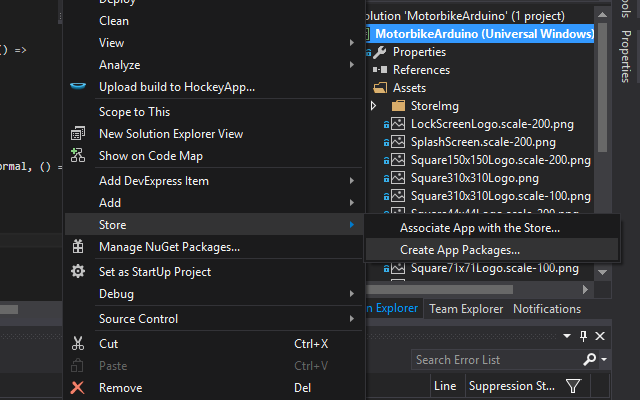
右键单击您的项目 =>商店 =>创建应用程序包
第 3 步:
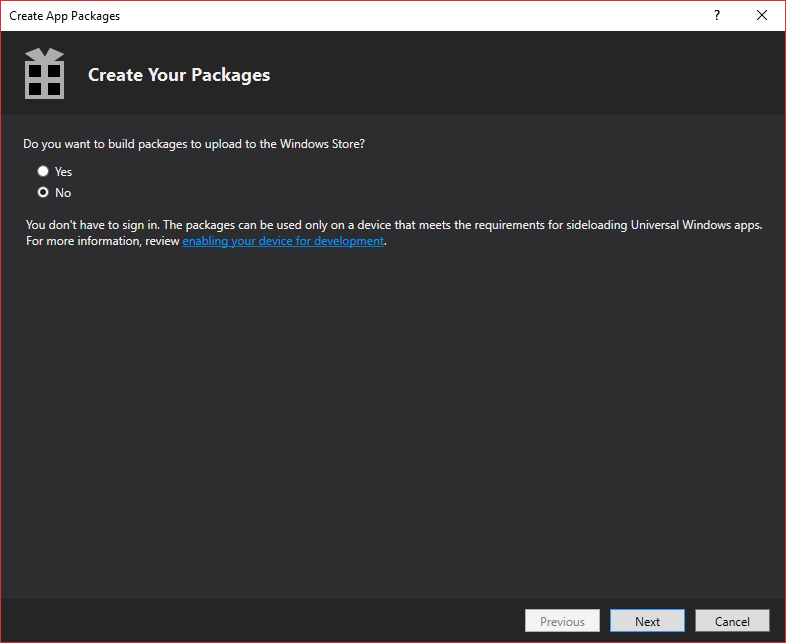
在“创建应用程序包”向导中,选择 NO 如果要创建本地包并单击NEXT .之后选择要定位的处理器平台。为了我们的目的,选择 ARM 平台并点击 CREATE .
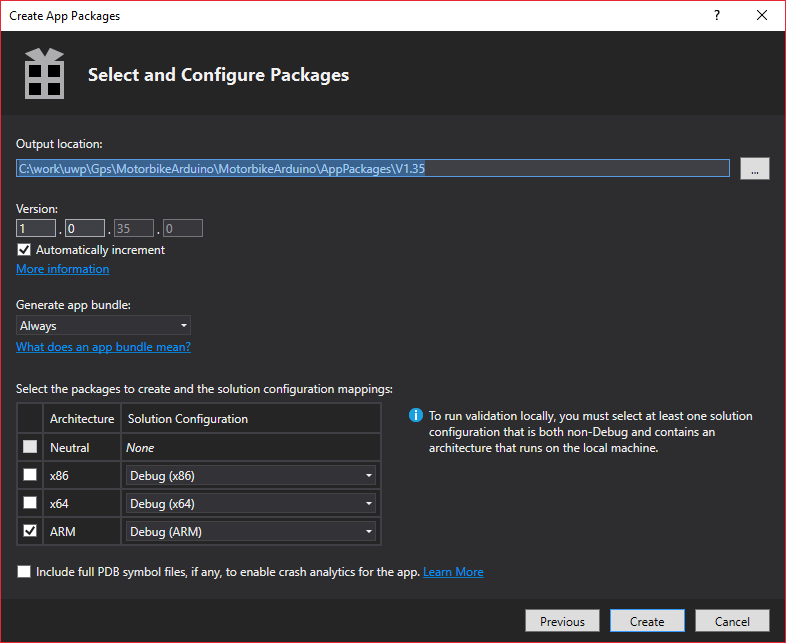
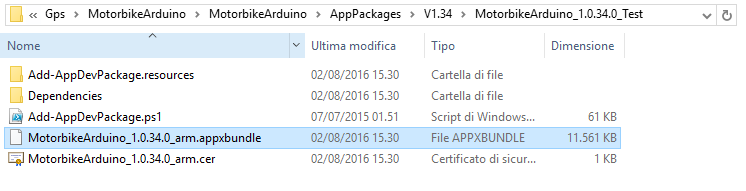
在创建过程结束时,向导会为我们提供创建包的本地 URL。
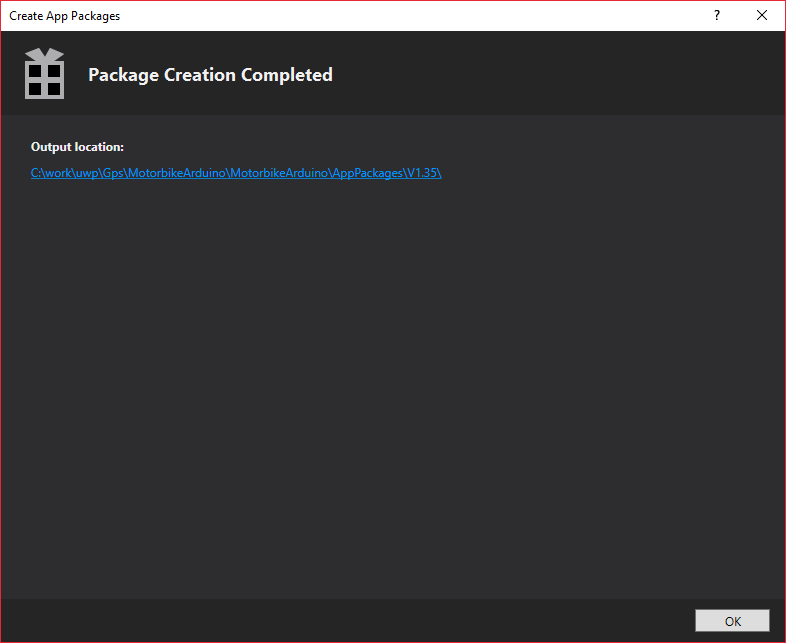
打开 url,您将找到可在设备上部署的 Appx 文件。
第 4 步:
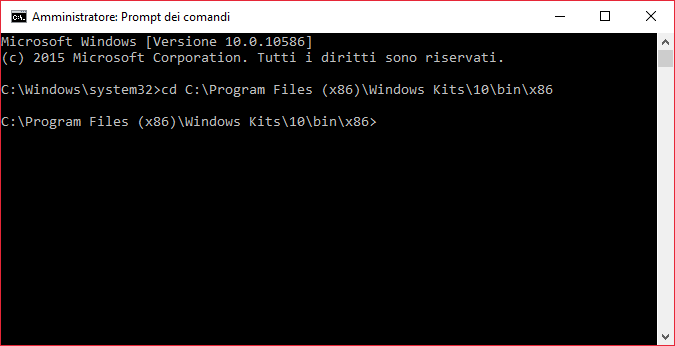
打开命令提示符并将焦点移至 C:\Program Files (x86)\Windows Kits\10\bin\x86\
并输入以下命令行
WinAppDeployCmd install -file "C:\work\uwp\Gps\MotorbikeArduino\MotorbikeArduino\AppPackages\V1.35\MotorbikeArduino_1.0.35.0_Debug_Test\MotorbikeArduino_1.0.35.0_arm_Debug.appxbundle" -ip 127.代码> AAA123
(其中 AAA123 是你的手机在关联模式下连接到USB时返回的PIN码)
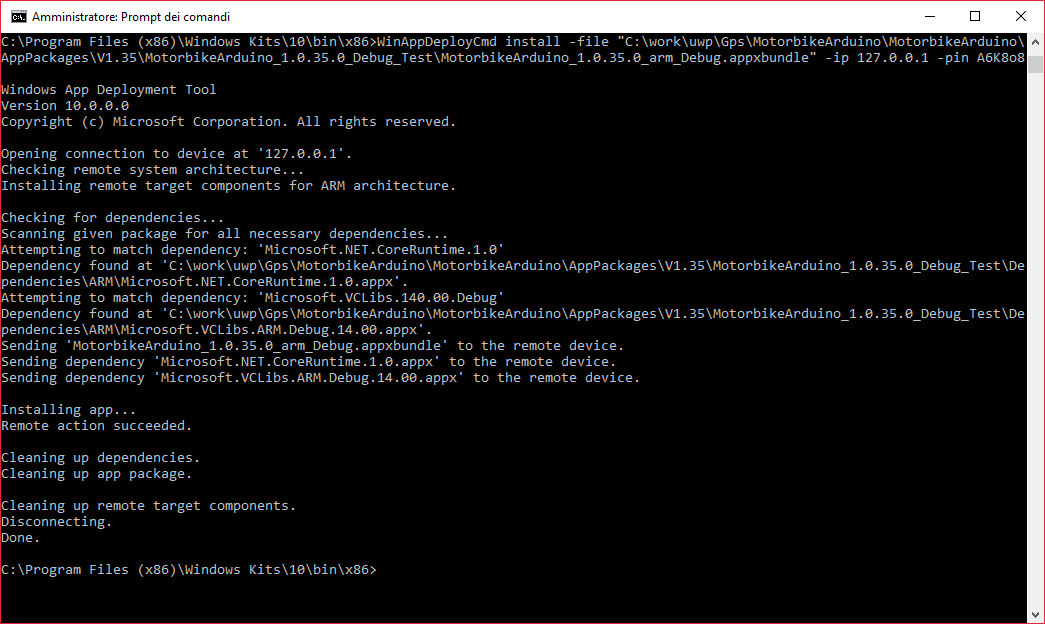
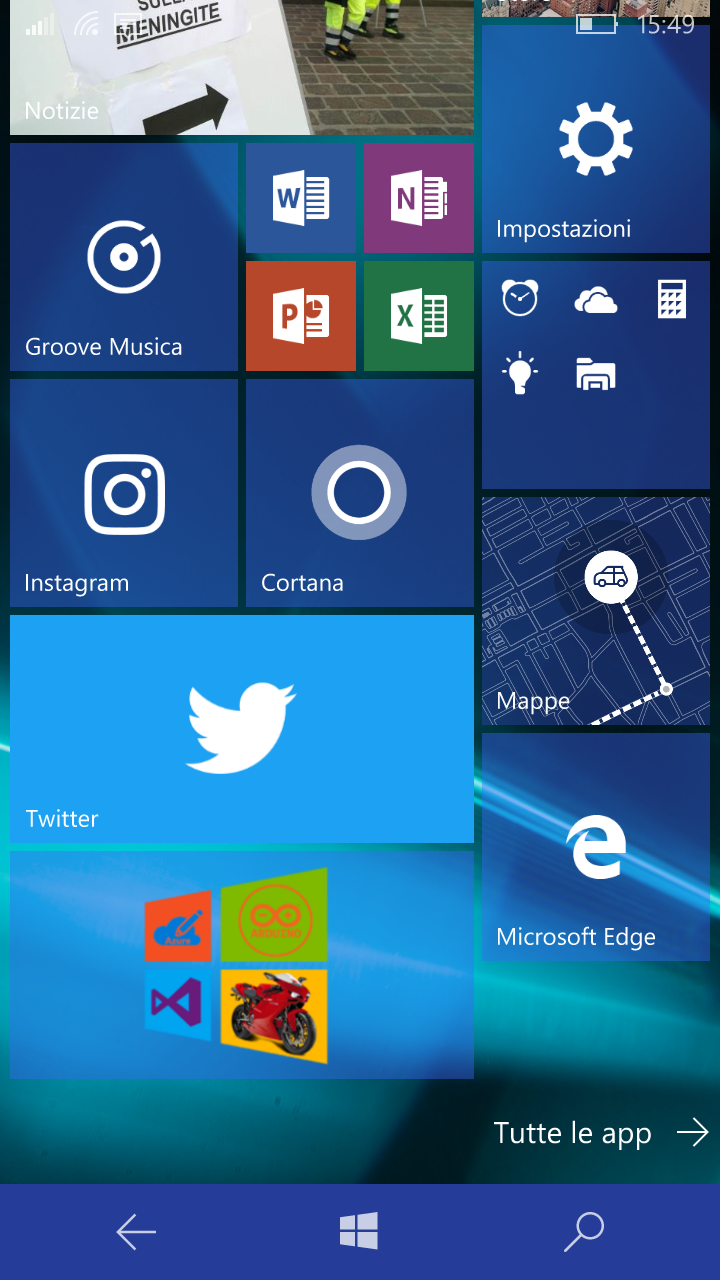
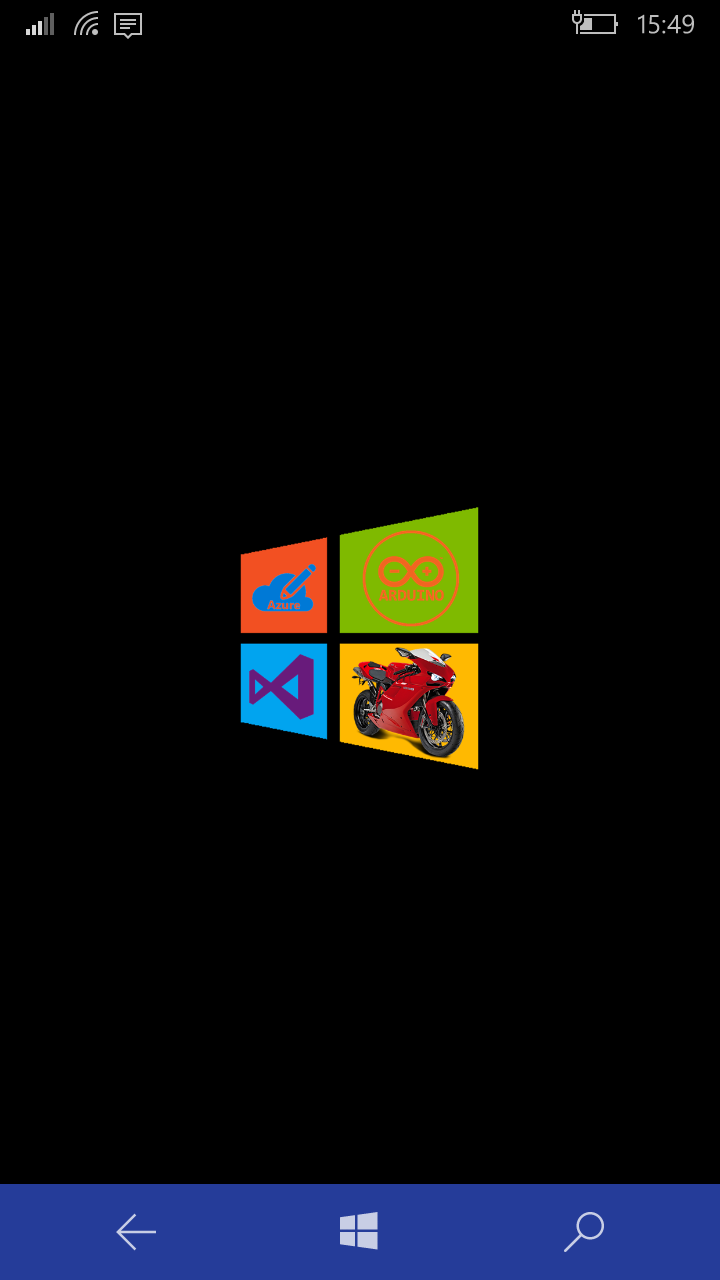
在该过程结束时,应用程序将安装在您的设备中,您将能够“固定启动”:

蔚蓝
现在我们准备描述如何配置 Azure 服务。对于这个项目将需要创建:
- WebApp + SQL Azure
- IoTHUB
- 流分析工作
- 将用于向 IoTHUB 发送数据的 DeviceId .
好,出发! 您有 AZURE 帐户吗?
- 如果否,请访问 https://azure.microsoft.com/ 并创建一个。
- 如果是……很好!转到 https://portal.azure.com
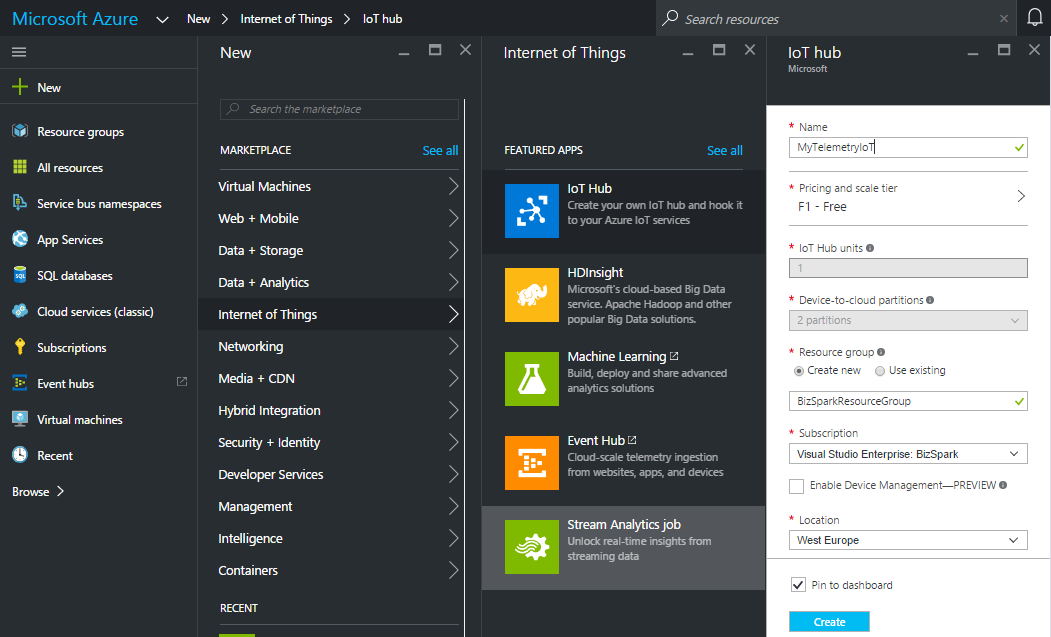
第 1 步 - 创建和配置 IoT 中心:
IoTHUB 是遥测值到云端的接入点。
创建您的 IoTHub,点击 New => 互联网思维 => 物联网中心 并编译 Hub 字段,然后单击 Create
随后,在 Azure 仪表板中,您可能会看到 IoT HUB 部署,几秒钟后您的 IoT HUB 将准备就绪。
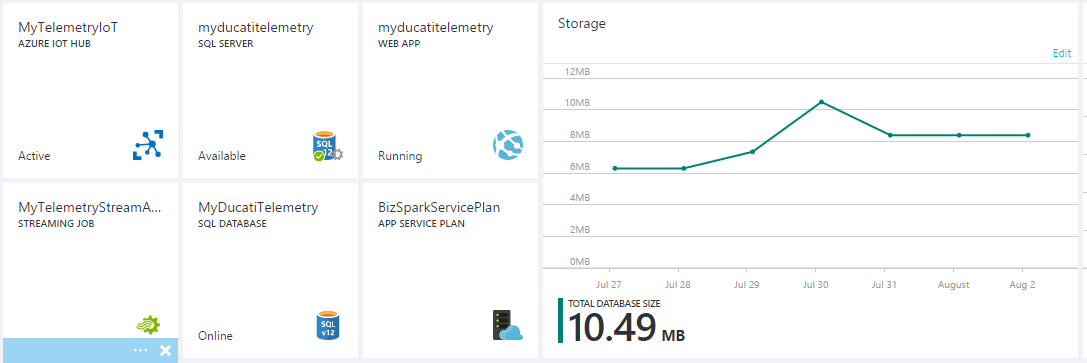
单击仪表板中的新磁贴,然后转到所有 设置 刀片。
查看您的 IoTHub 主机名 并记下:
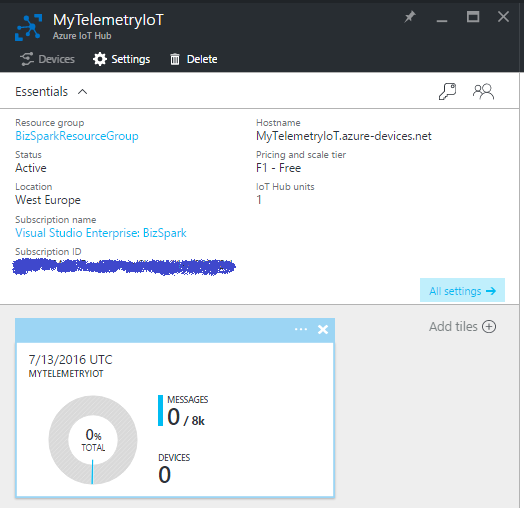
在共享访问政策 刀片,单击 iothubowner 策略,然后复制并记下 iothubowner 中的连接字符串 刀片
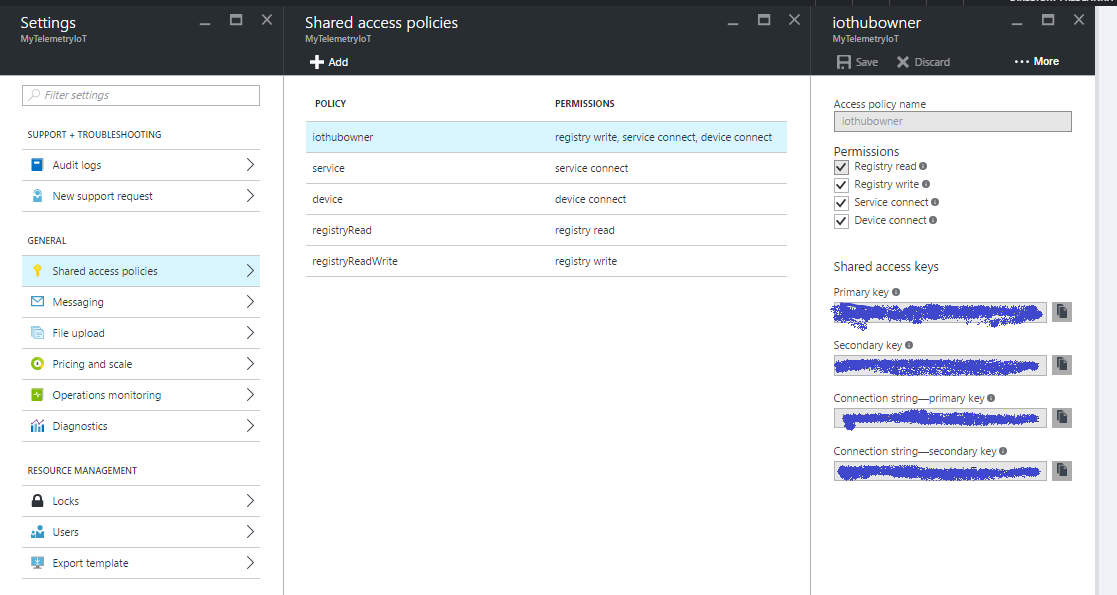
好的...您的物联网中心已成功创建,您几乎可以使用它了!
第 2 步 - 创建和配置流分析
流分析的目的是读取和写入发送到 IoTHUB 的所有数据并将它们保存到数据库表中。
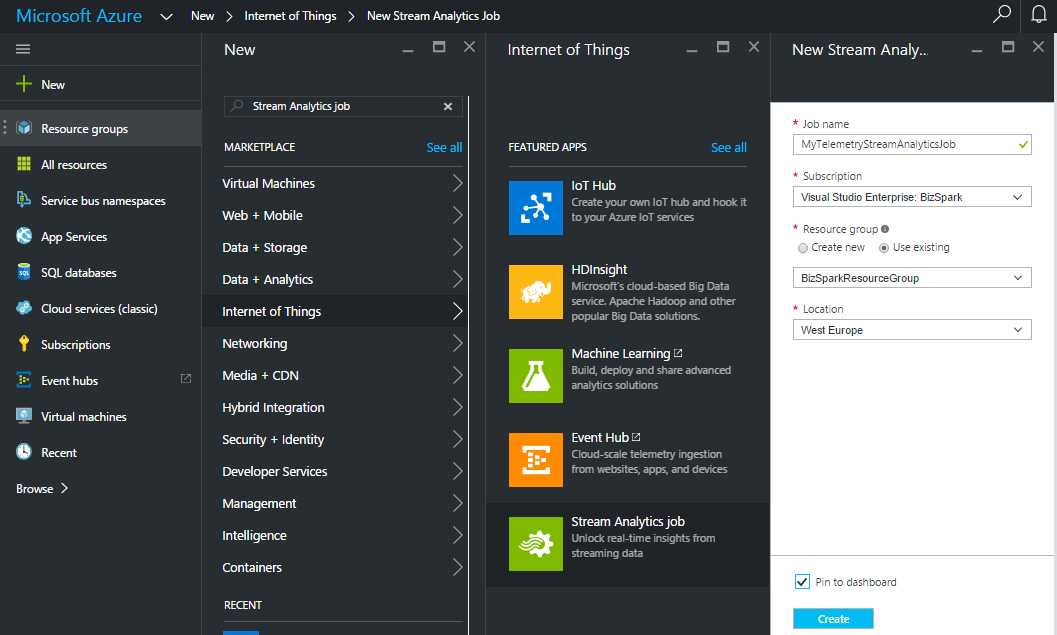
创建新的流分析作业:
点击新建 => 互联网思维 => 流分析工作
编译所有字段并单击“创建”按钮。
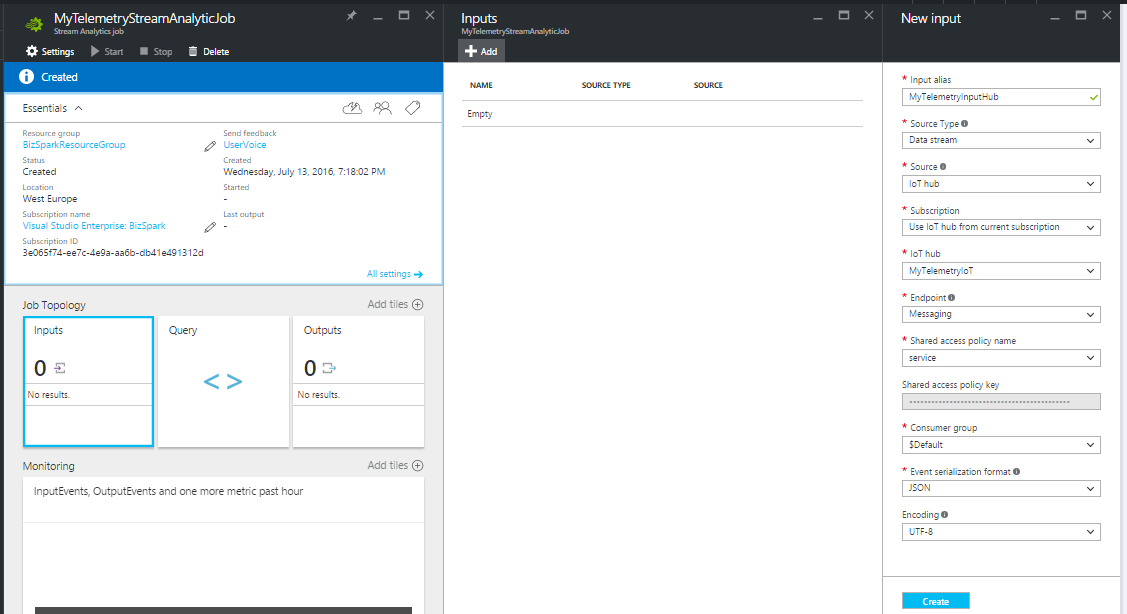
现在我们准备好配置输入/输出和streamAnalityncs JOB的查询。
设置输入 - 选择源 .在我们的例子中,源将是 IoTHub
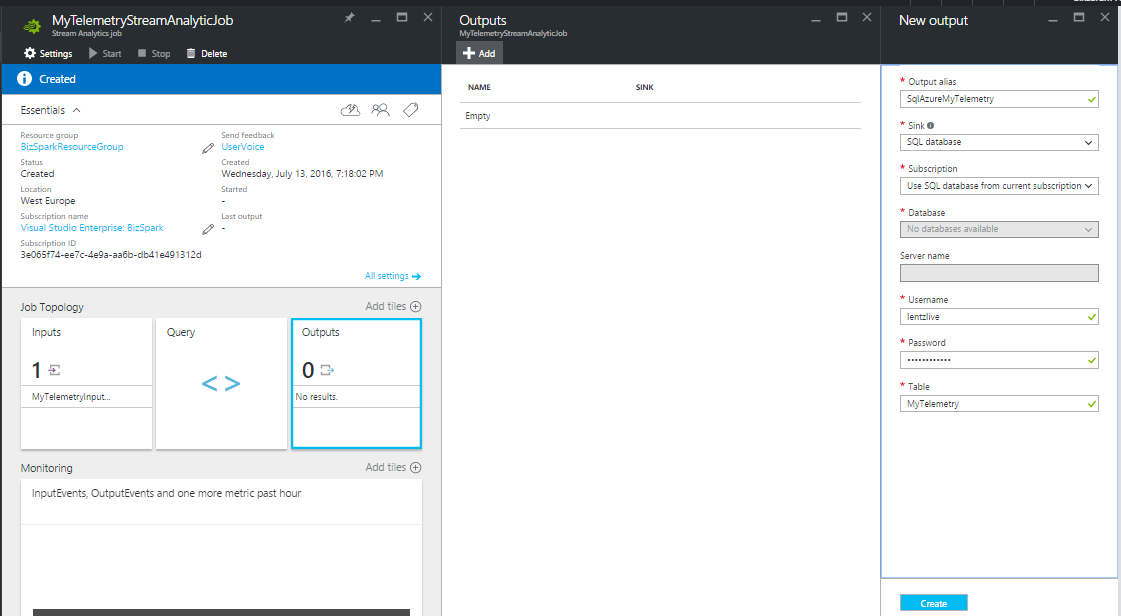
设置输出 - 选择目的地。在我们的示例中,输出将是 SQL Azure 数据库的表(我将在下一步中向您展示如何创建 sql db)
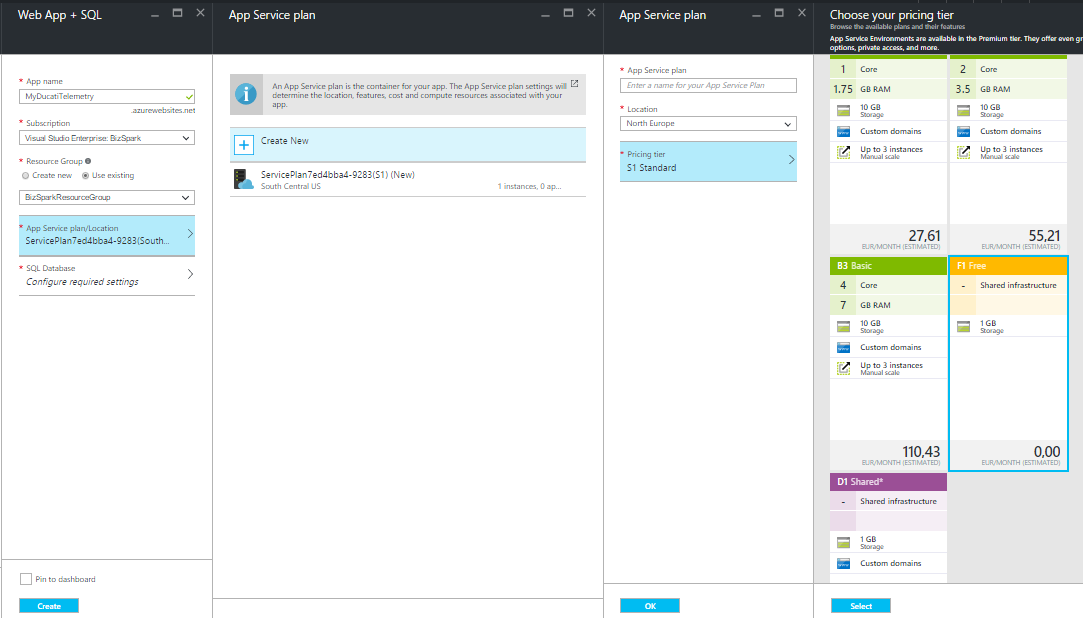
第 3 步 - 创建 WebApp + SQL Azure
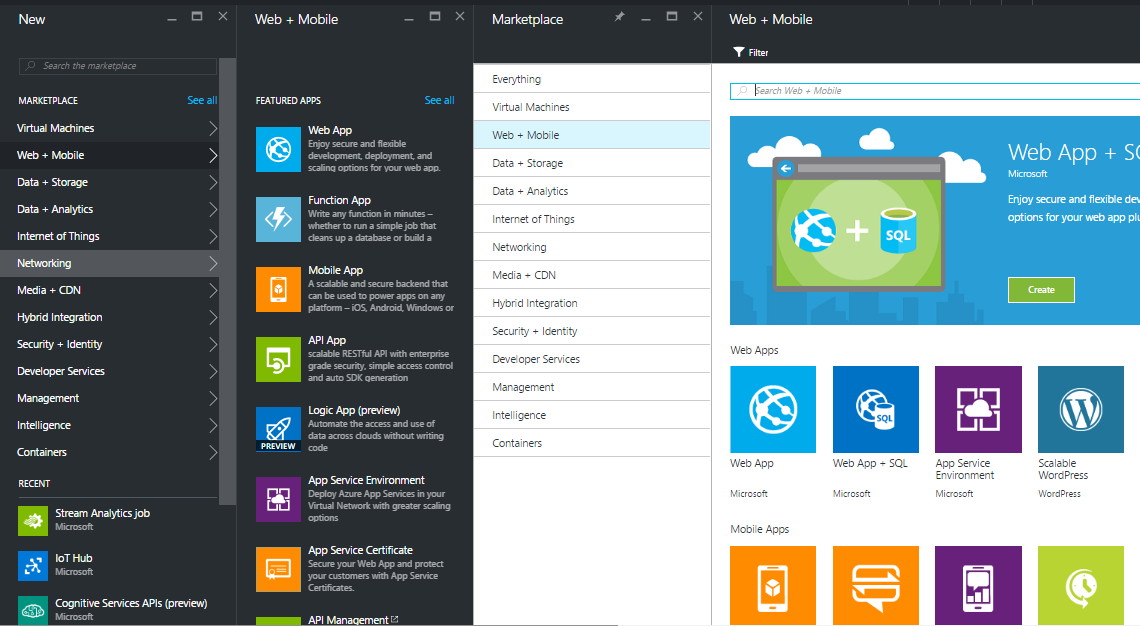
转到仪表板并选择 WebApp+SQL(新建 => 网络 => 网络 + 移动 => Web 应用程序 + Sql )
现在配置你的 webapp 编译以下字段:
- 应用名称
- 选择订阅
- 选择一个资源组(如果您没有创建第一个资源组)
- 选择应用服务计划和定价层(在此示例中,您可以考虑选择 F1 免费计划)
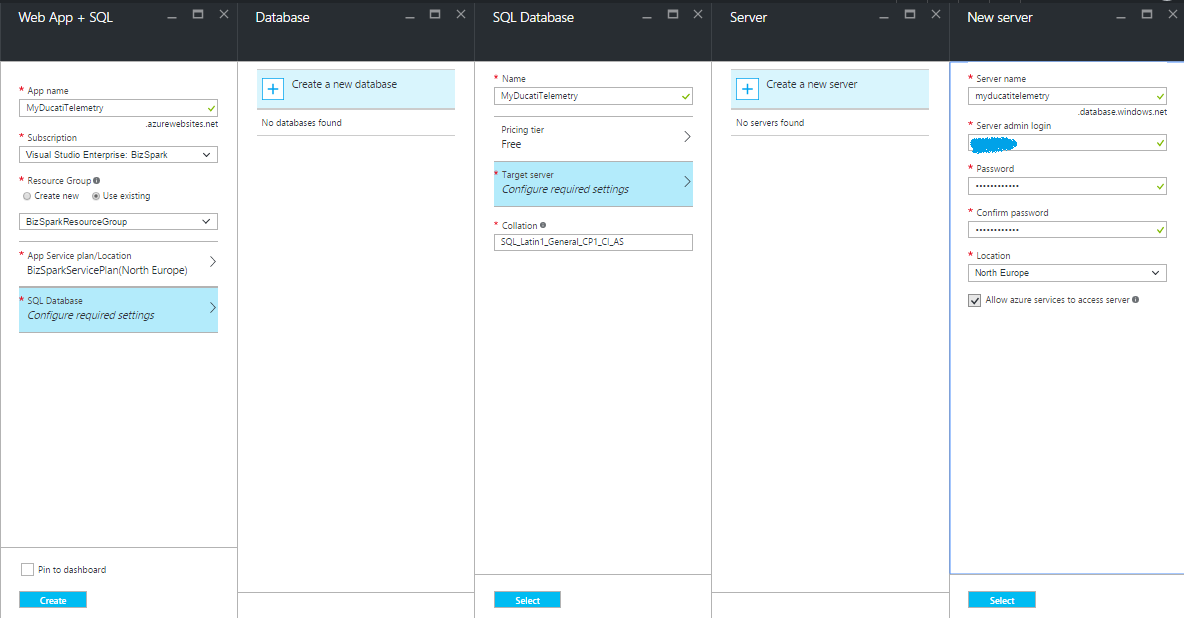
配置您的 SQL,创建一个新 SQL 并选择 名称 , 定价层 , 服务器名称 并添加管理员登录凭据 :
现在回到步骤 2 ,我们现在已准备好创建 StreamAnalitycs 查询。单击 StreamAnalyticJob 磁贴并选择“查询”。在右侧面板中插入您的查询。
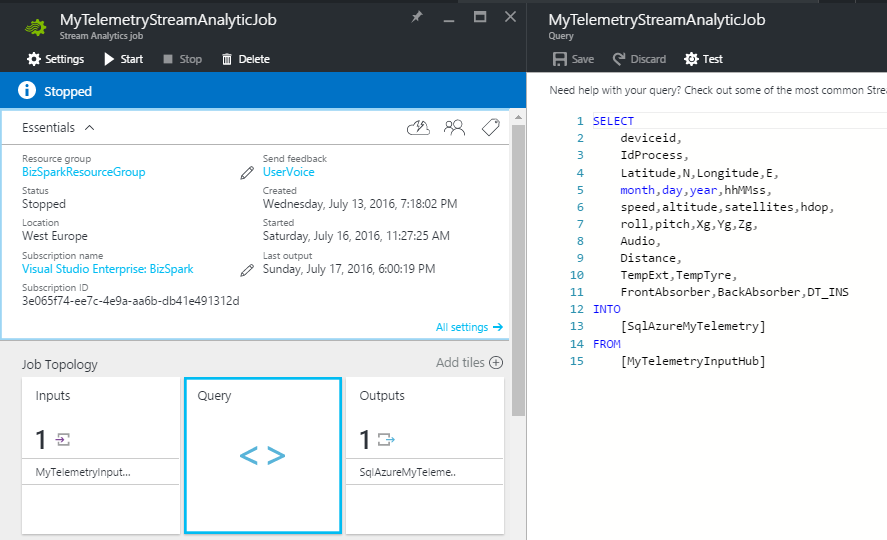
如您所见,查询描述了流程工作流。从“MyTelemetryInputHub”中获取数据并将它们保存到“SqlAzureMyTelemetry”中……简单而精彩!!
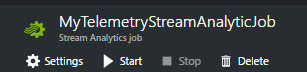
最后,我们只需要启动 JOB 点击开始 按钮。
为 HUB 创建 DeviceId
为了在我的设备和 IoTHUB 之间创建连接,必须执行此步骤。我们需要创建一个新的设备身份并添加到 IoT HUB 的 ID 注册表中。
更多信息请访问以下 <代码>链接
生成一个新的deviceId, 您必须在 Visual Studio 中创建一个控制台应用程序。
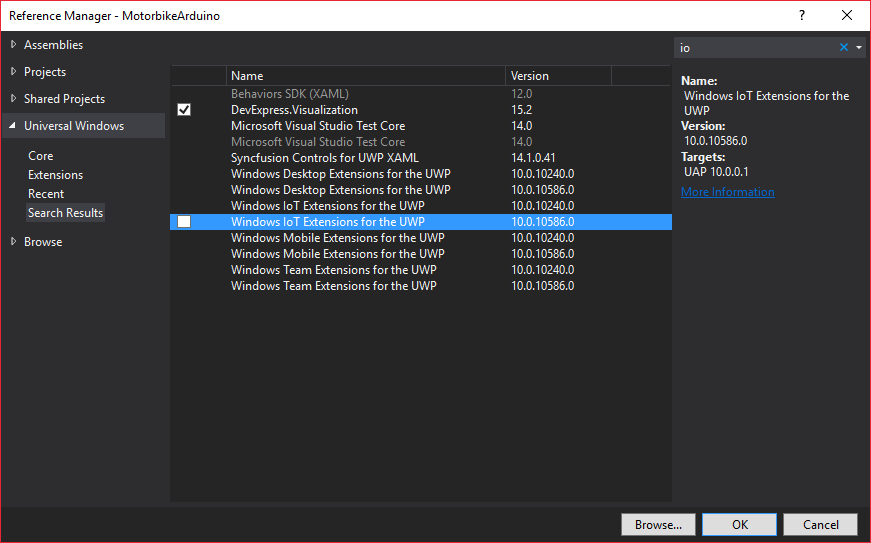
在 NuGet 包管理器中 窗口,搜索并安装 Microsoft.Azure.Devices 包。
添加以下代码在您的控制台应用程序中,替换您的 IoTHub Connection String and chose a deviceId alias (in my case the deviced is MyDucatiMonsterDevice )。
class Program{//Install-Package Microsoft.Azure.Devicesstatic RegistryManager registryManager;// Connection String HUBstatic string connectionString ="xxxxxxxxxxxxxx";static void Main(string[] args){registryManager =RegistryManager.CreateFromConnectionString(connectionString);AddDeviceAsync().Wait();Console.ReadLine();}// creates a new device identity with ID myFirstDeviceprivate async static Task AddDeviceAsync(){ string deviceId ="myDucatiMonsterDevice";Device device;try{device =await registryManager.AddDeviceAsync(new Device(deviceId));}catch (DeviceAlreadyExistsException){device =await registryManager.GetDeviceAsync(deviceId);}Console.WriteLine("Generated device key:{0}", device.Authentication.SymmetricKey.PrimaryKey);}} Run the console application (press F5) and generate your device key!
WEB application
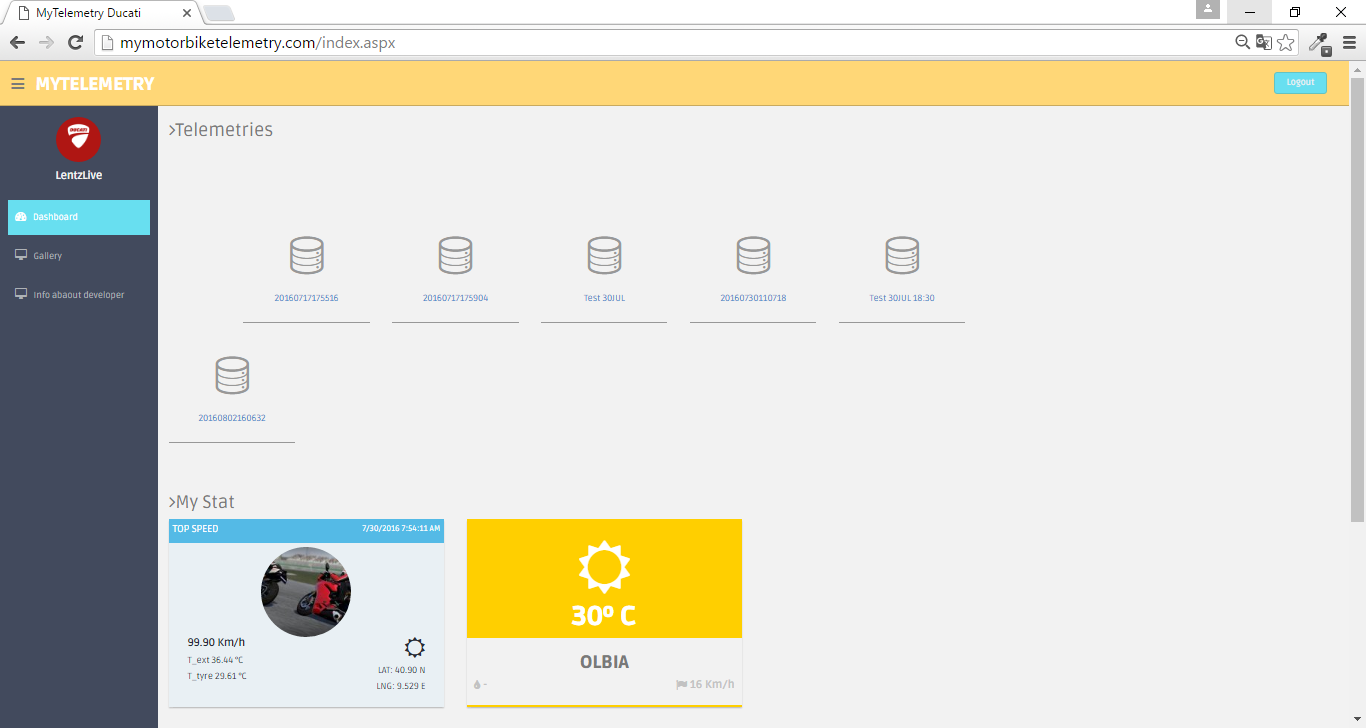
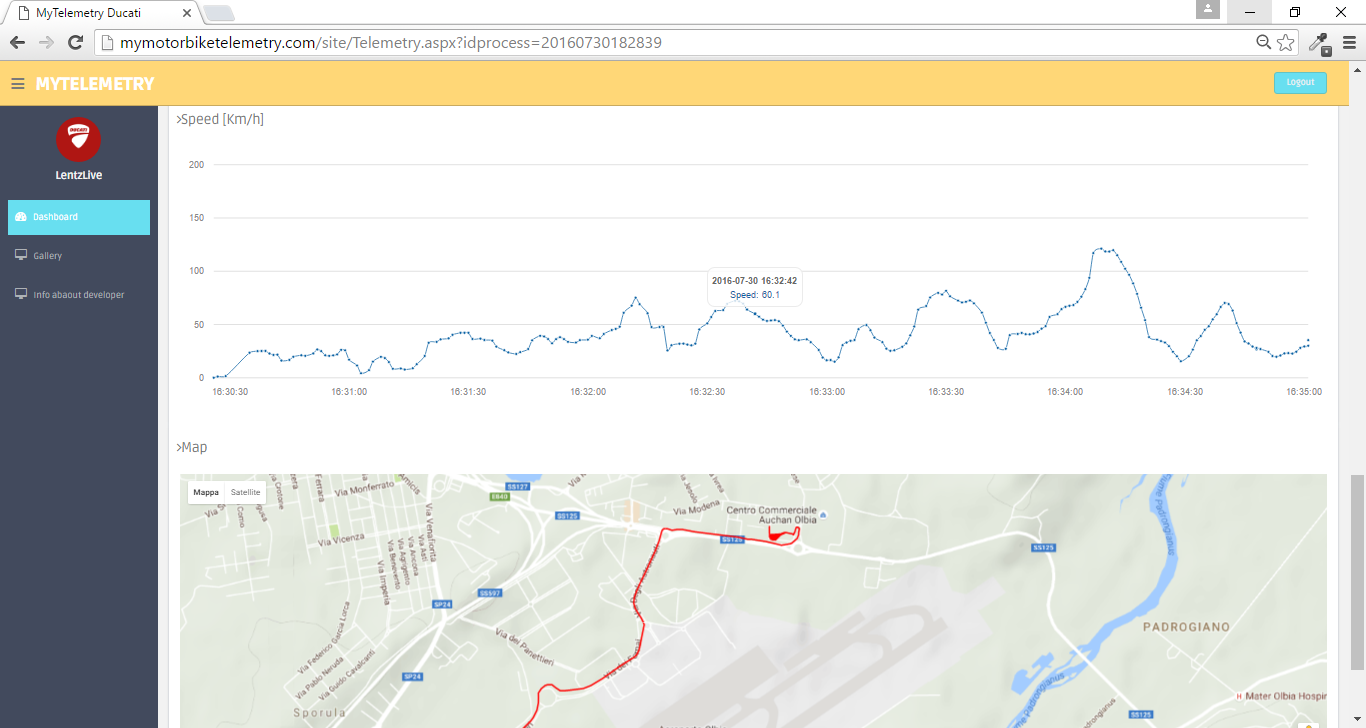
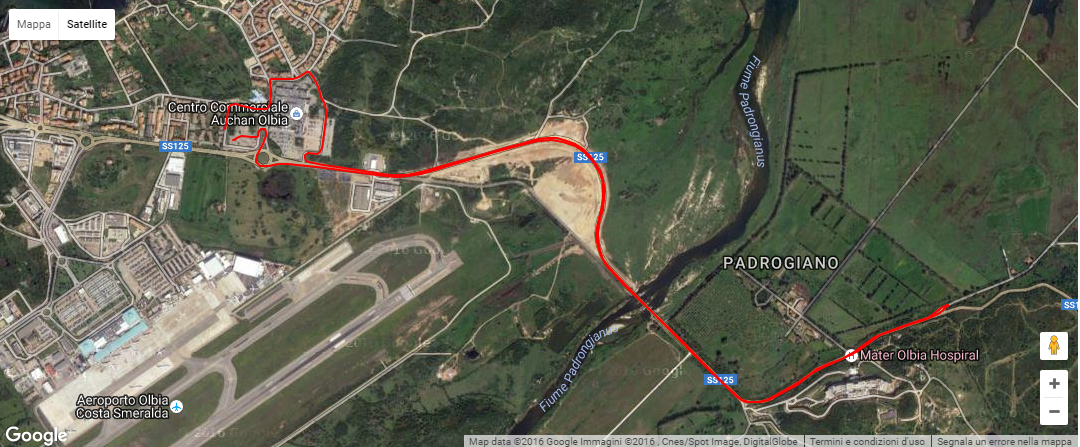
At this point of the project i thinked about how can i see my telemetry data and how can i show them to my friends and share the results on the social media. to do that I decided to create a responsive web site in ASP .NET
The website consist in a dashboard contains all my telemetries. The data has been read using the Entity framework from SQL Azure.
You can discover the web site by the following url:
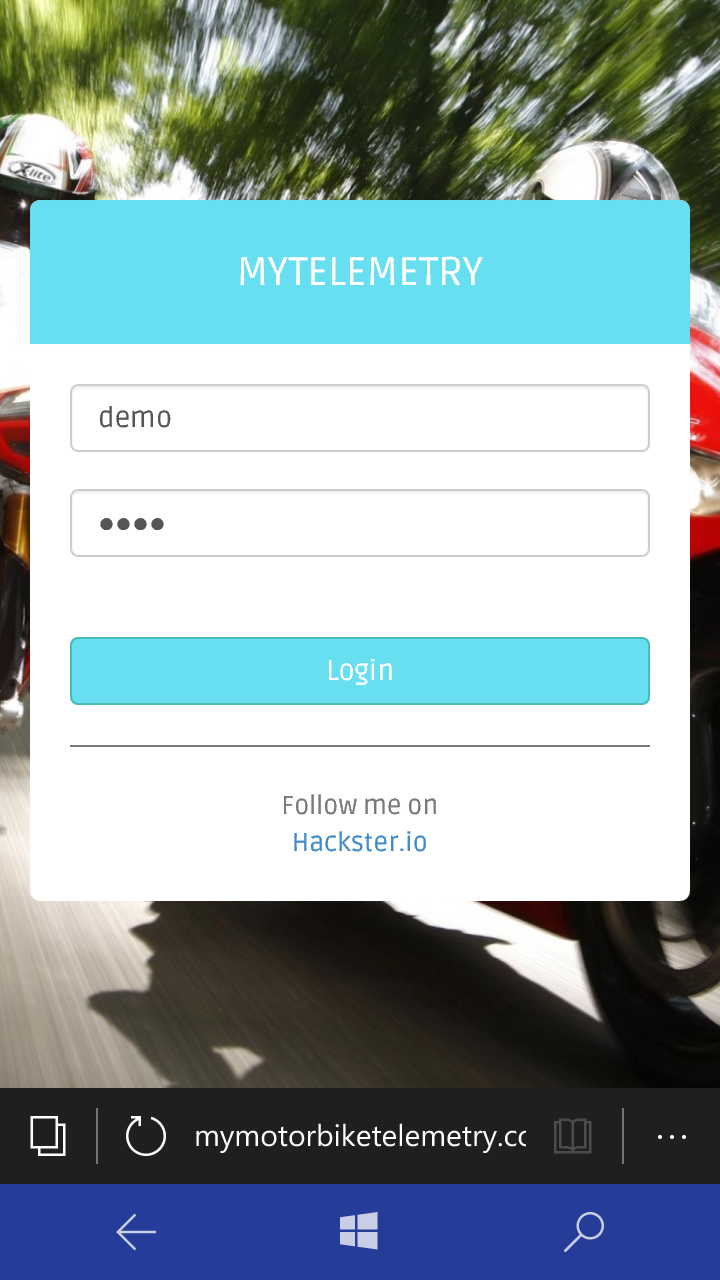
Has been created an account for all Hackster Users , SignIn using the following user/psw credentials:
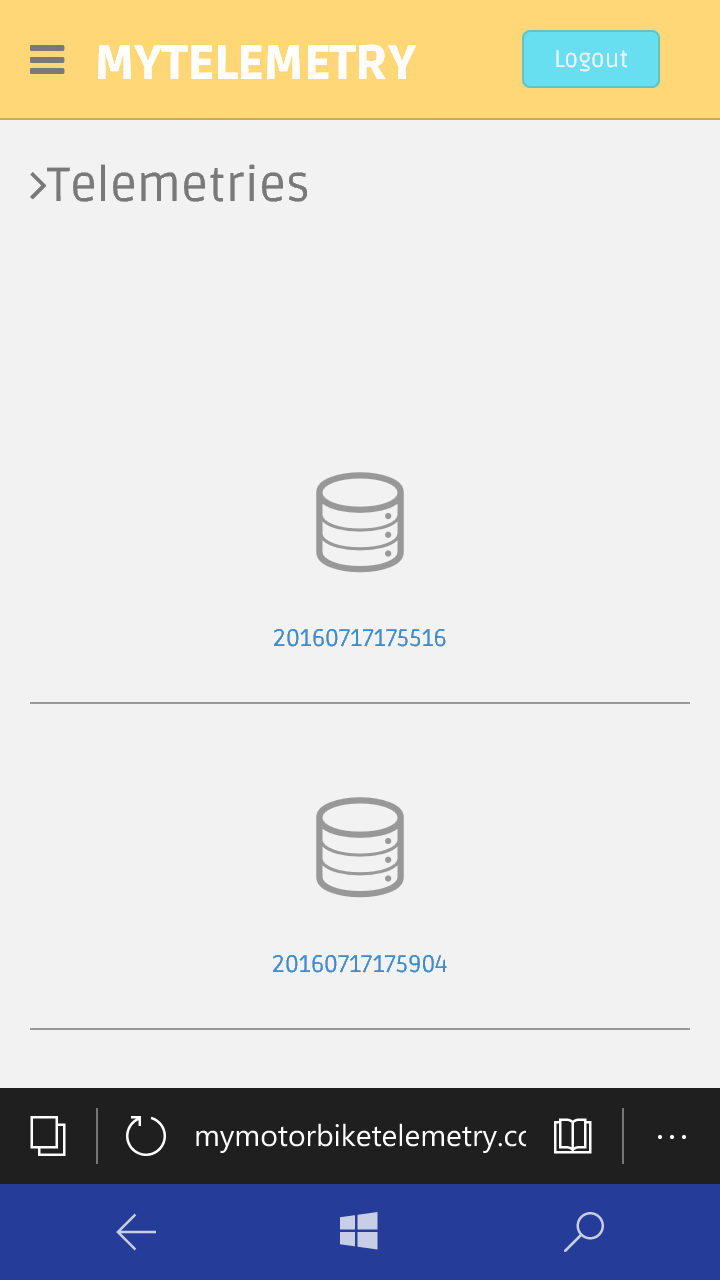
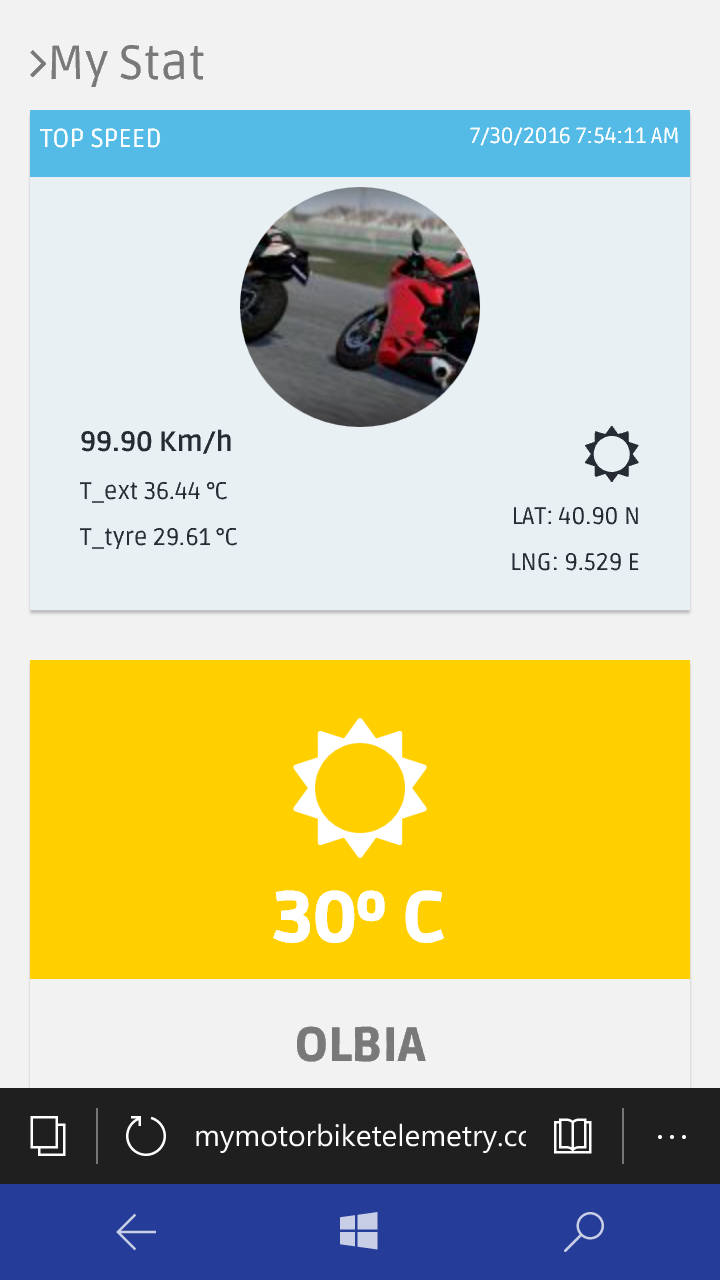
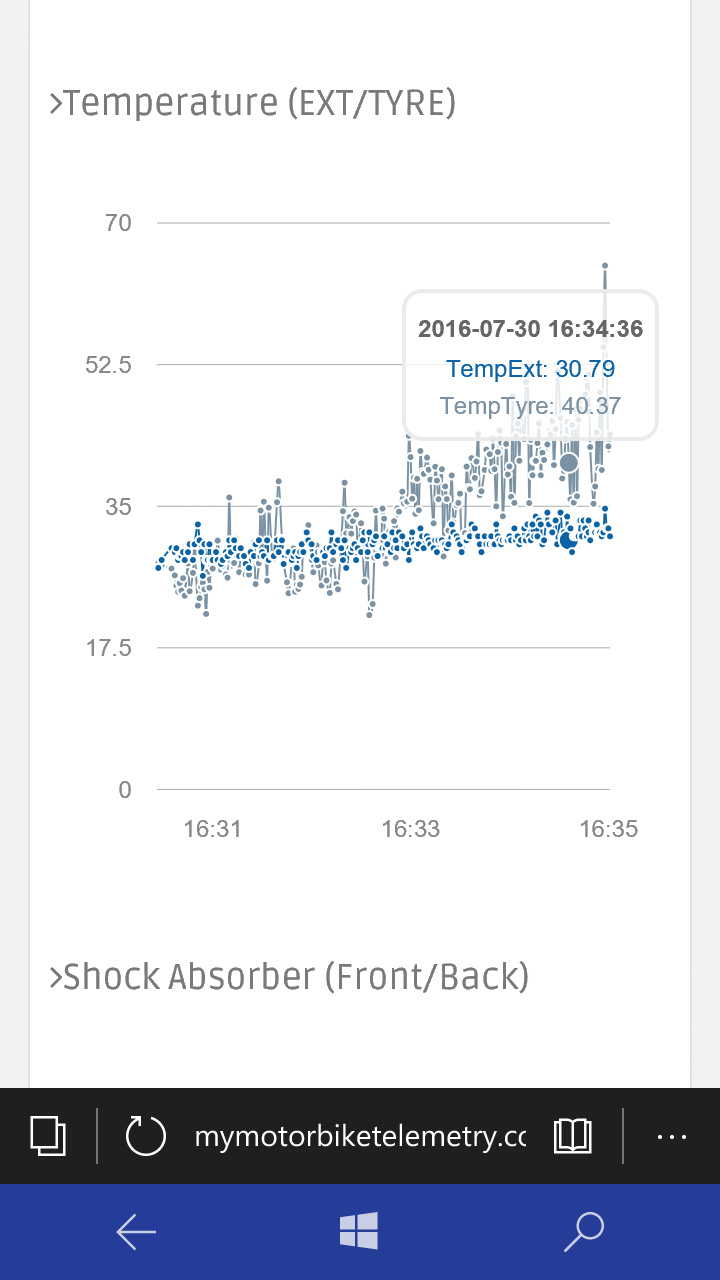
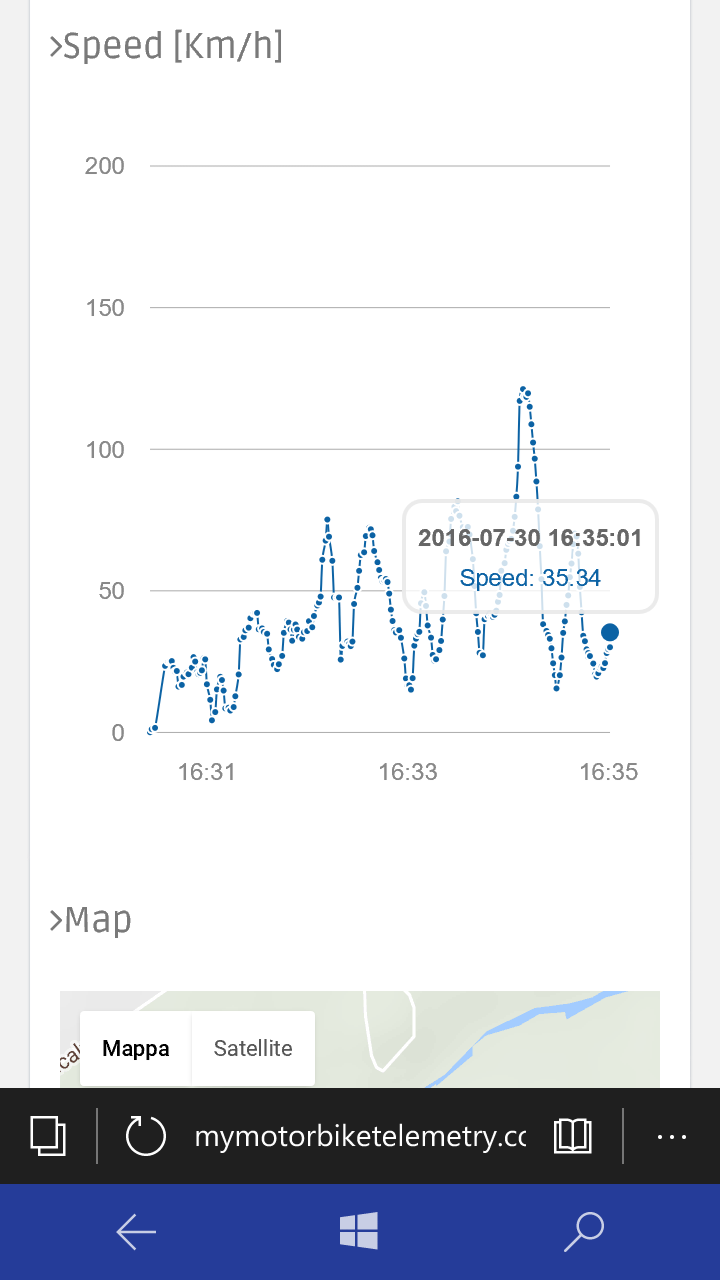
User ID:demoPassword:demo The web site is look like this:
And look like this in mobile version:

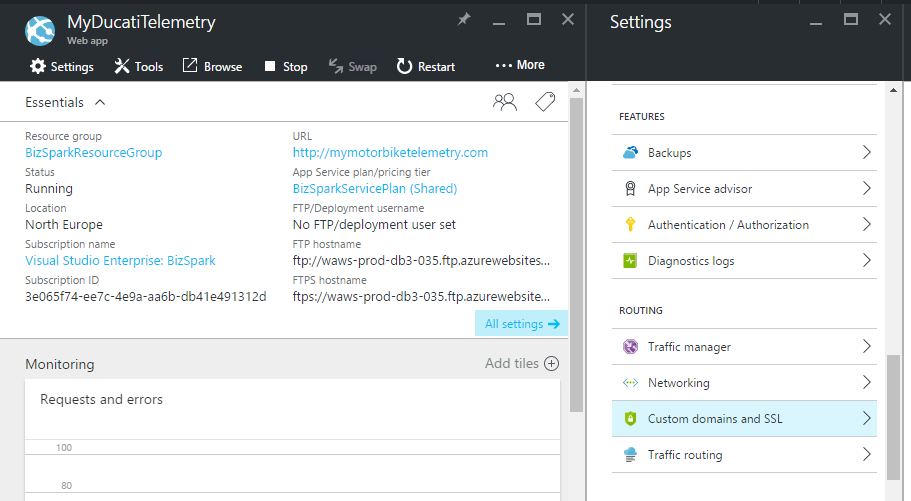
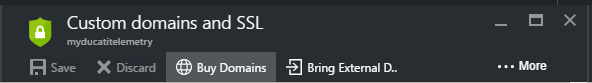
When you create a web app in azure using the Free tier, the domain name will be something like this:
To change the domain name you have to buy one and on azure this is very simple! Follow this steps:
- Go to your Azure dashboard and click on you web app Tile.
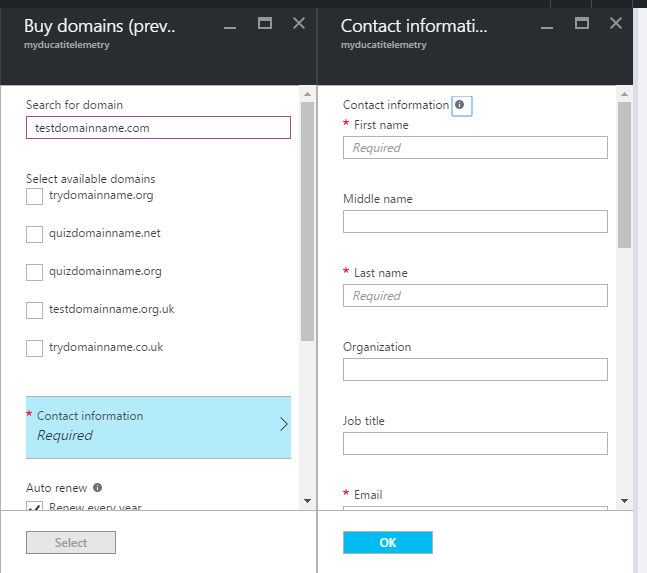
- Select "Custom domains and SSL " and click on "Buy domains ".
- Fill all fields (about your domain name and your contact informations)
Ducati Monster Wiring
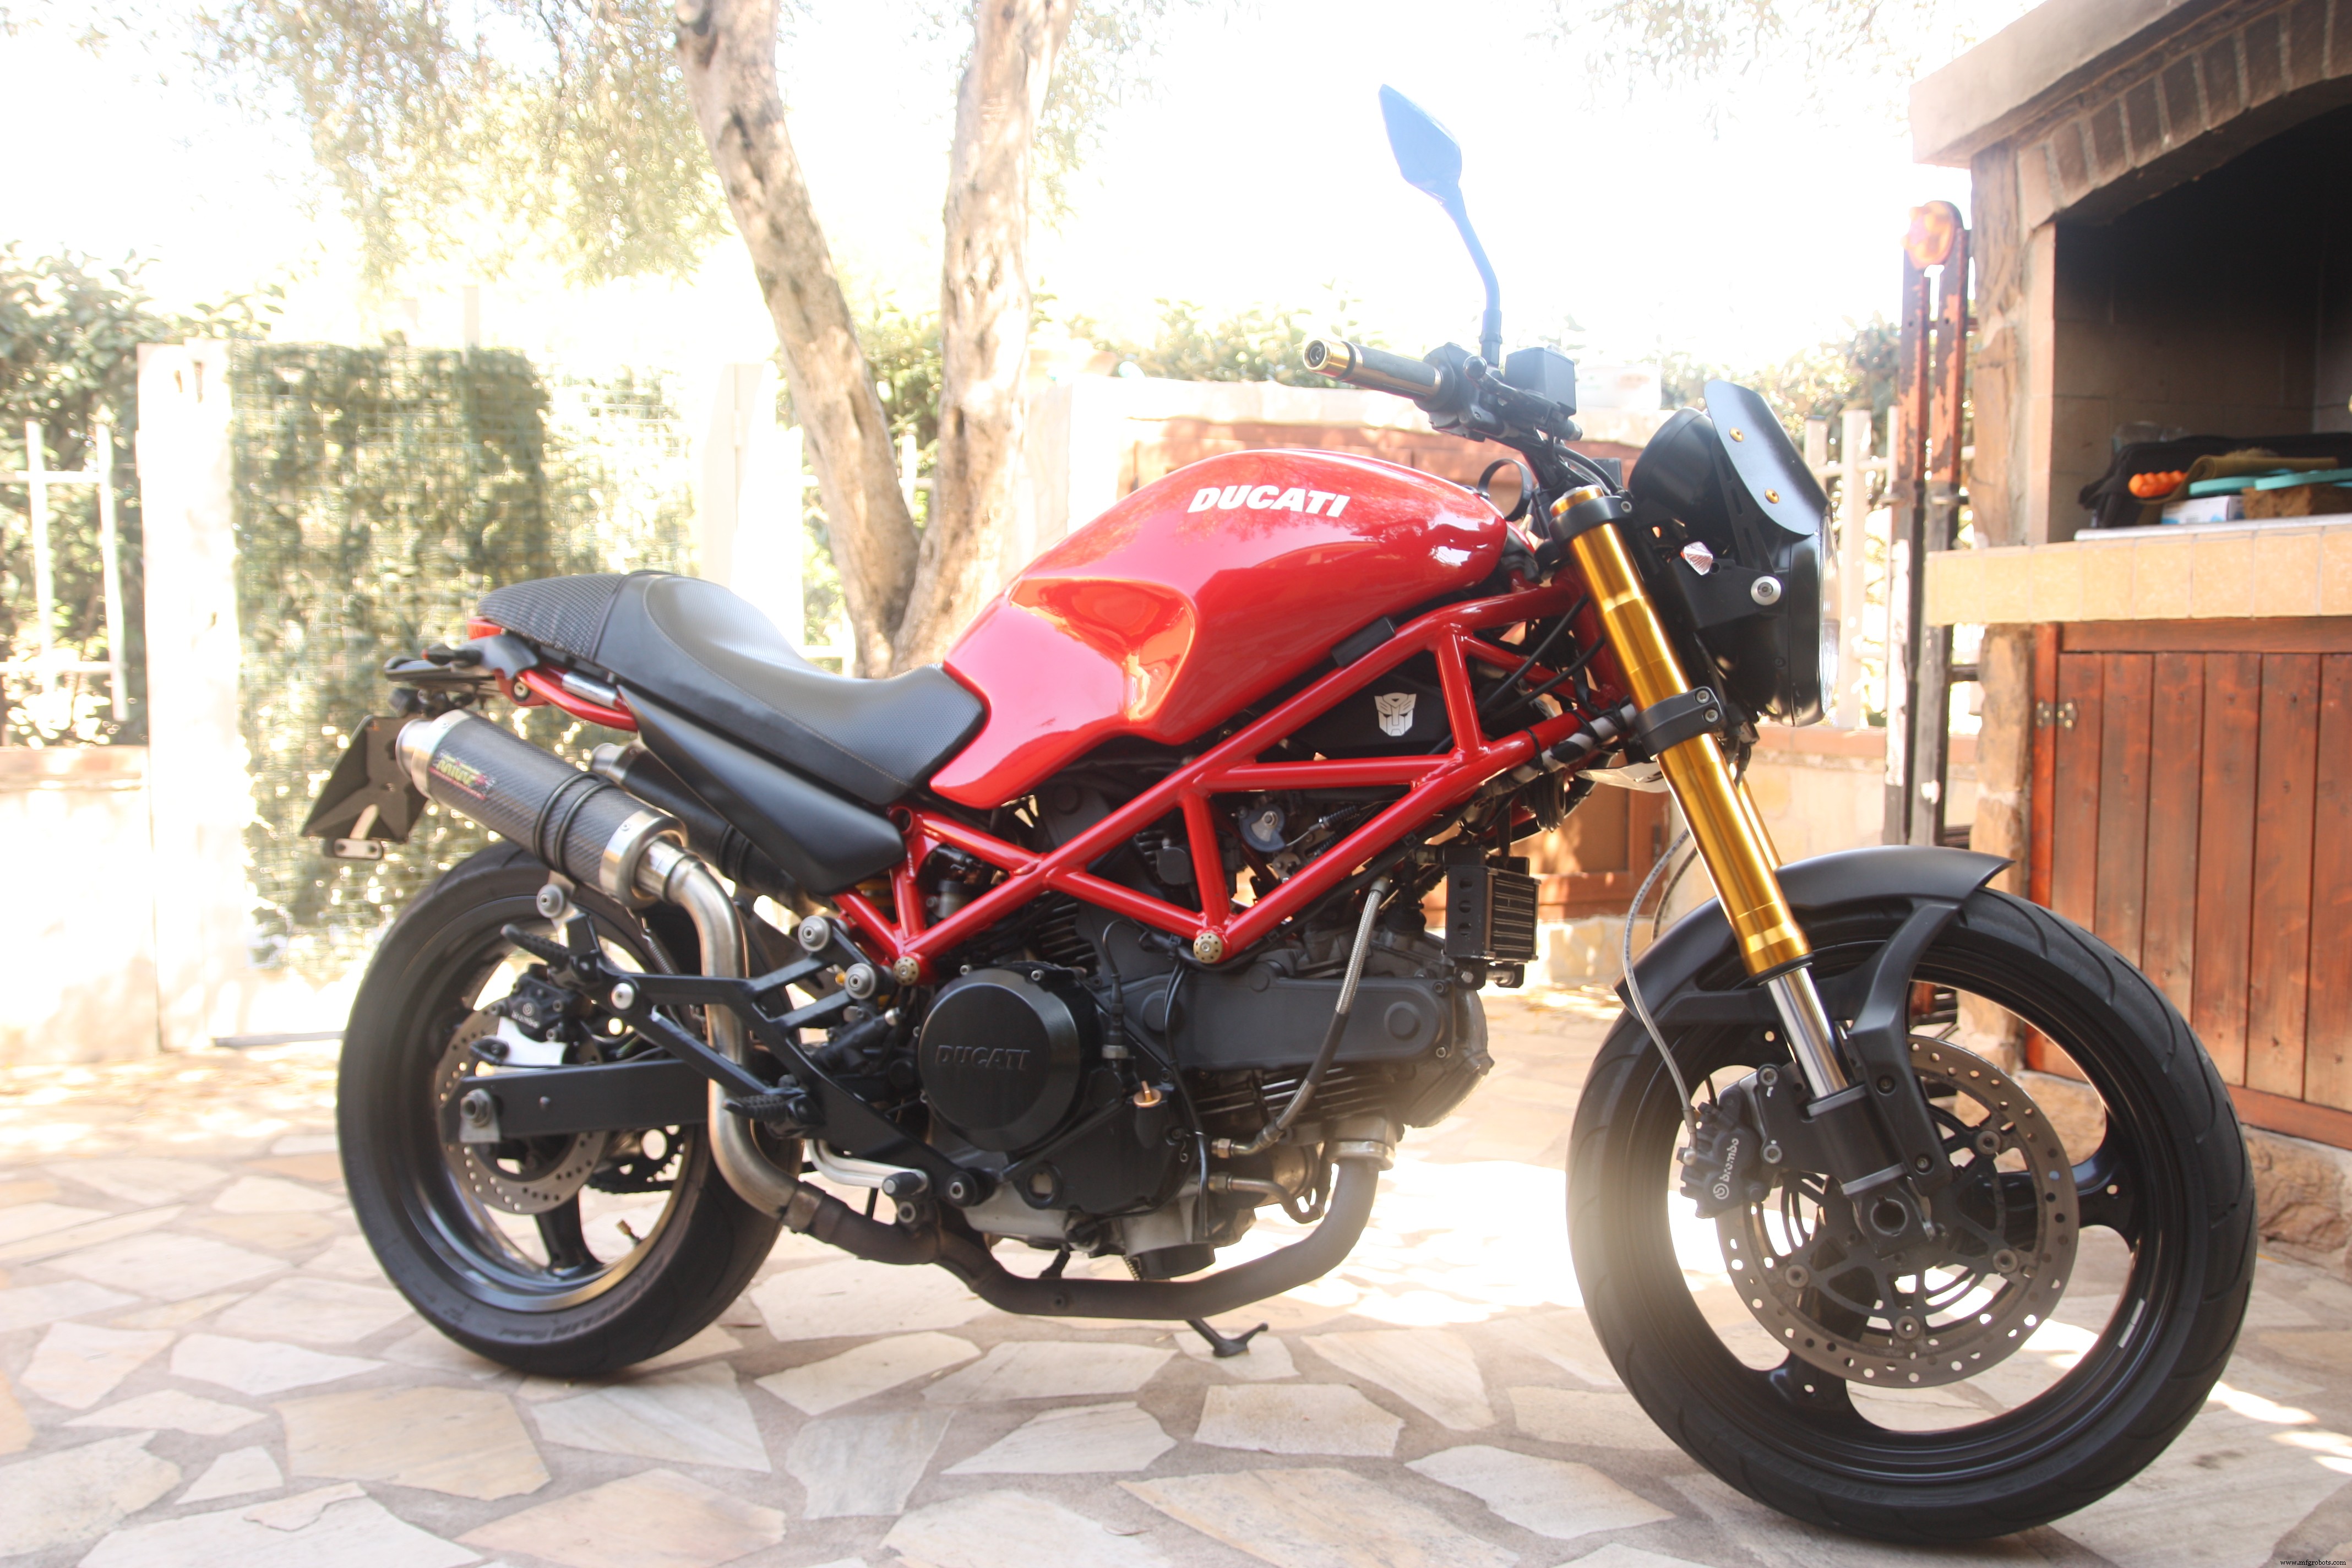
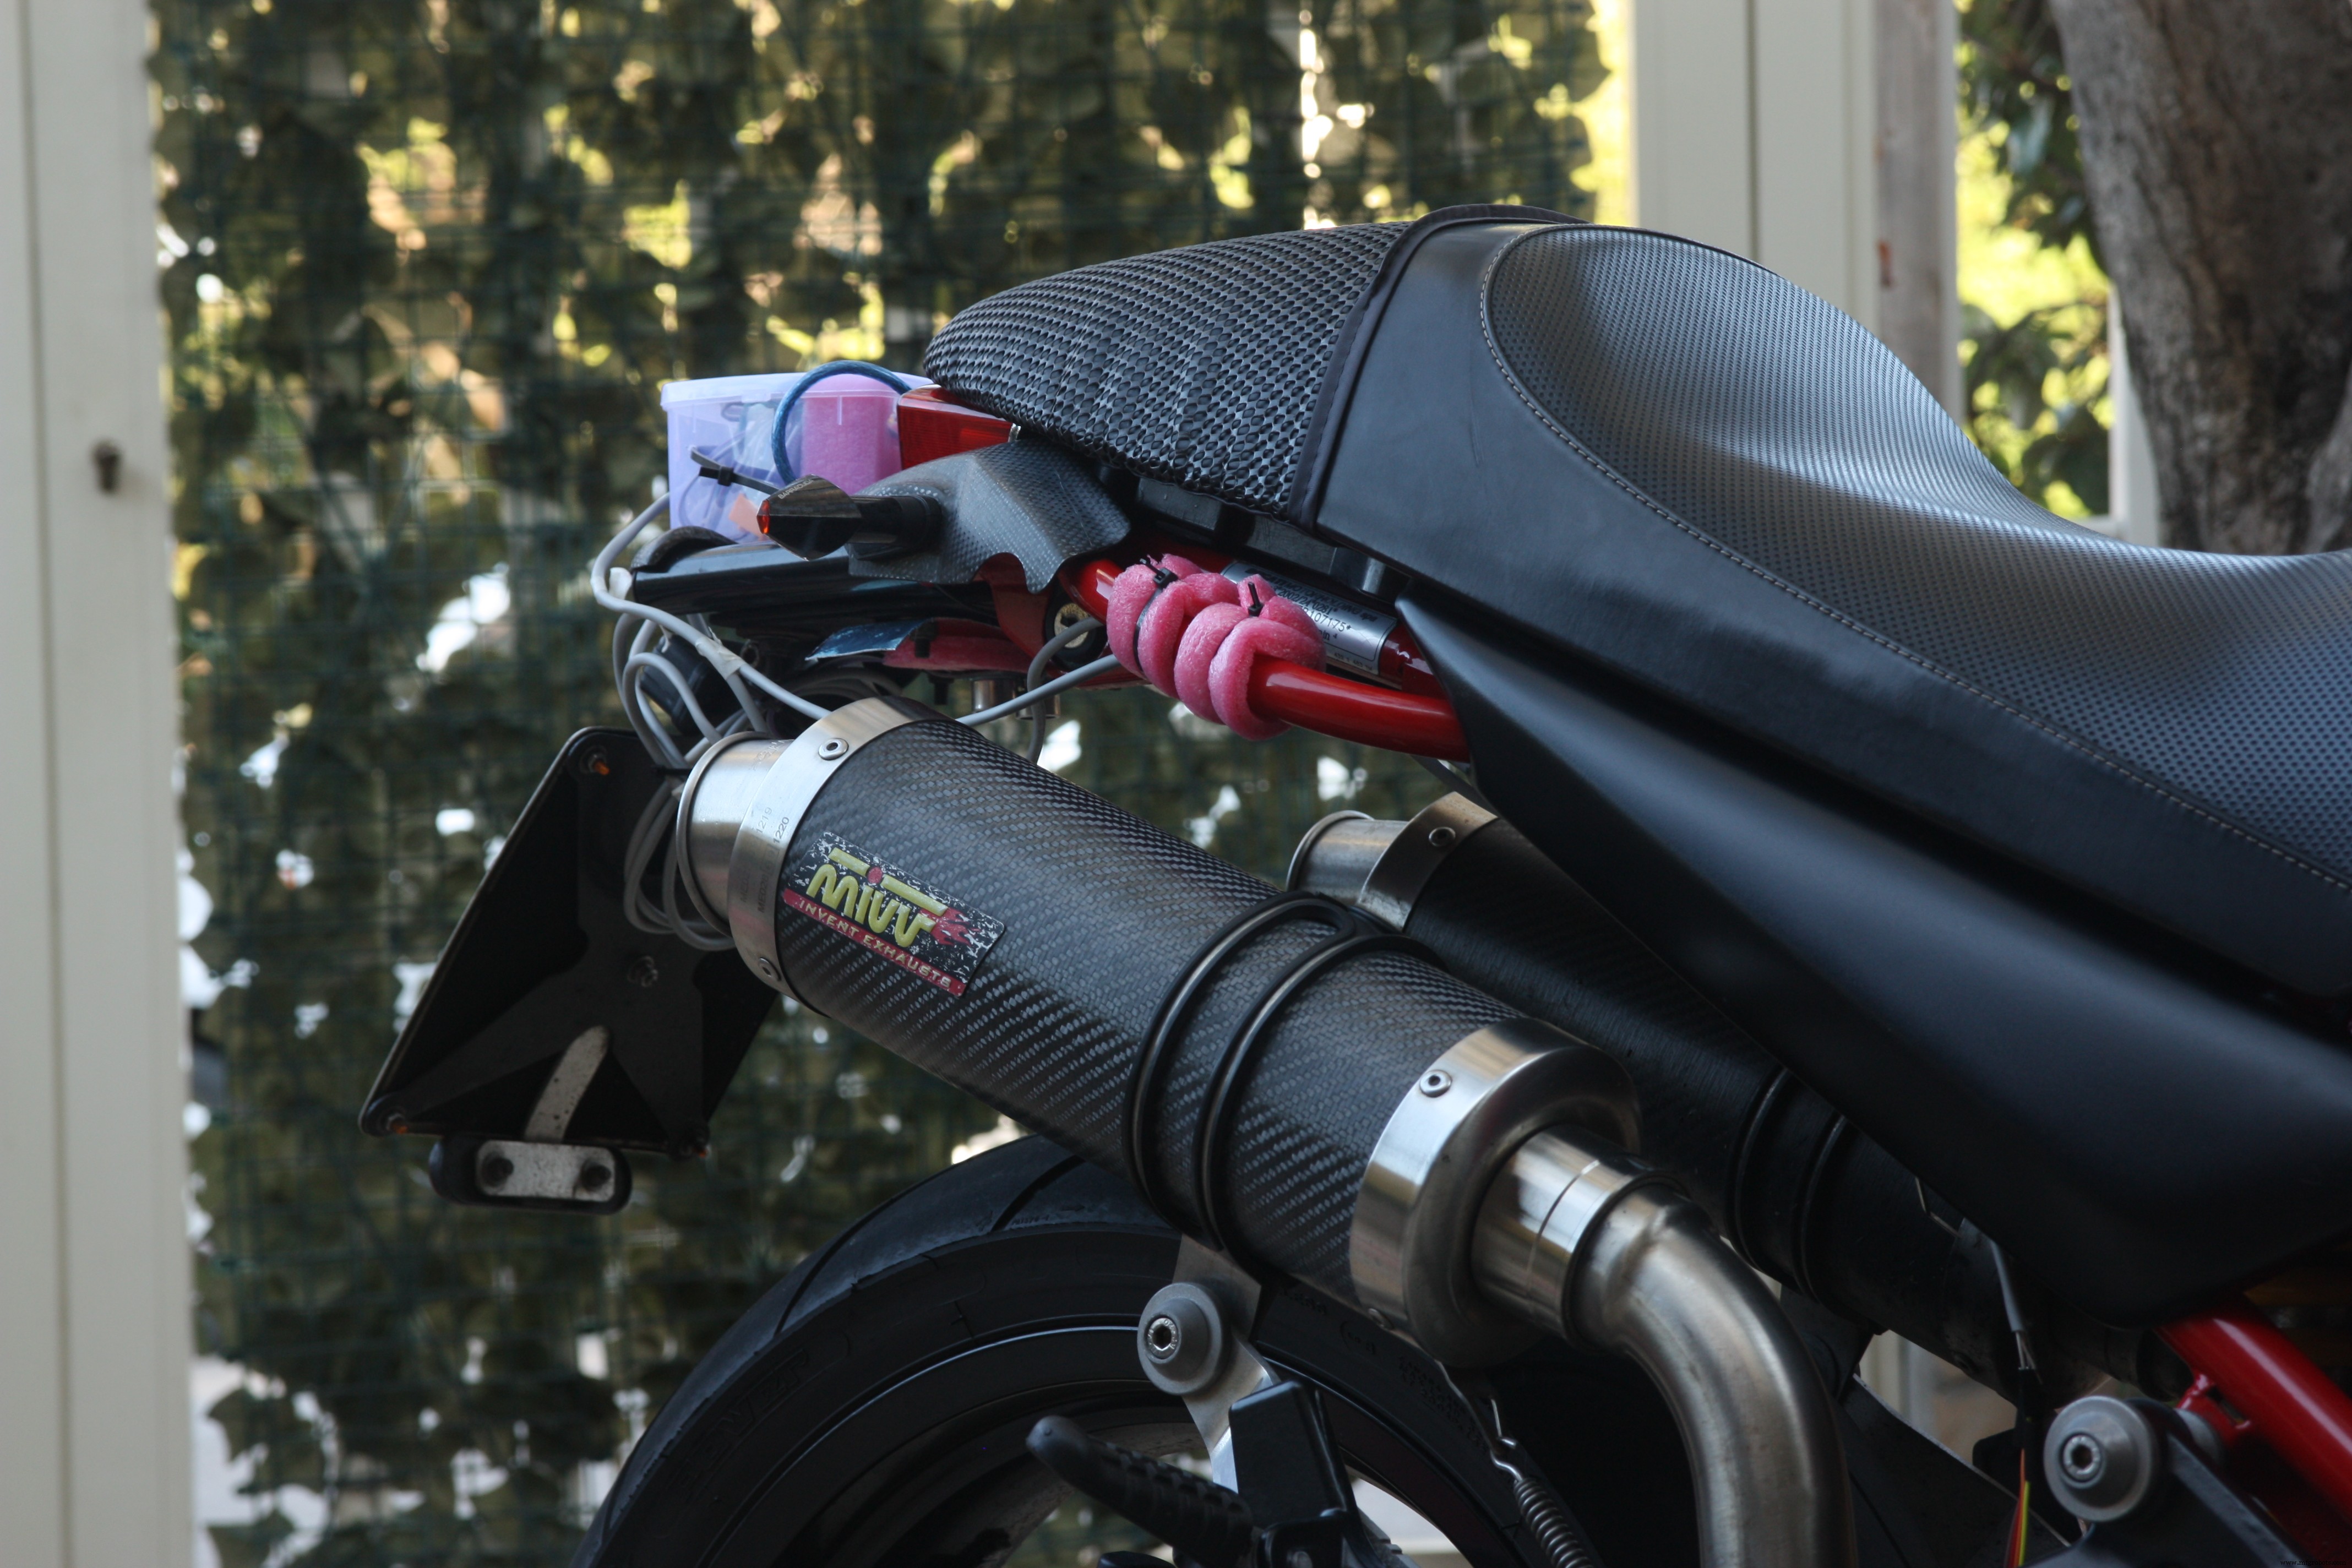
Now is time to Introduce my motorbike, this is my Ducati Monster 695 that for this project has been the cavy.
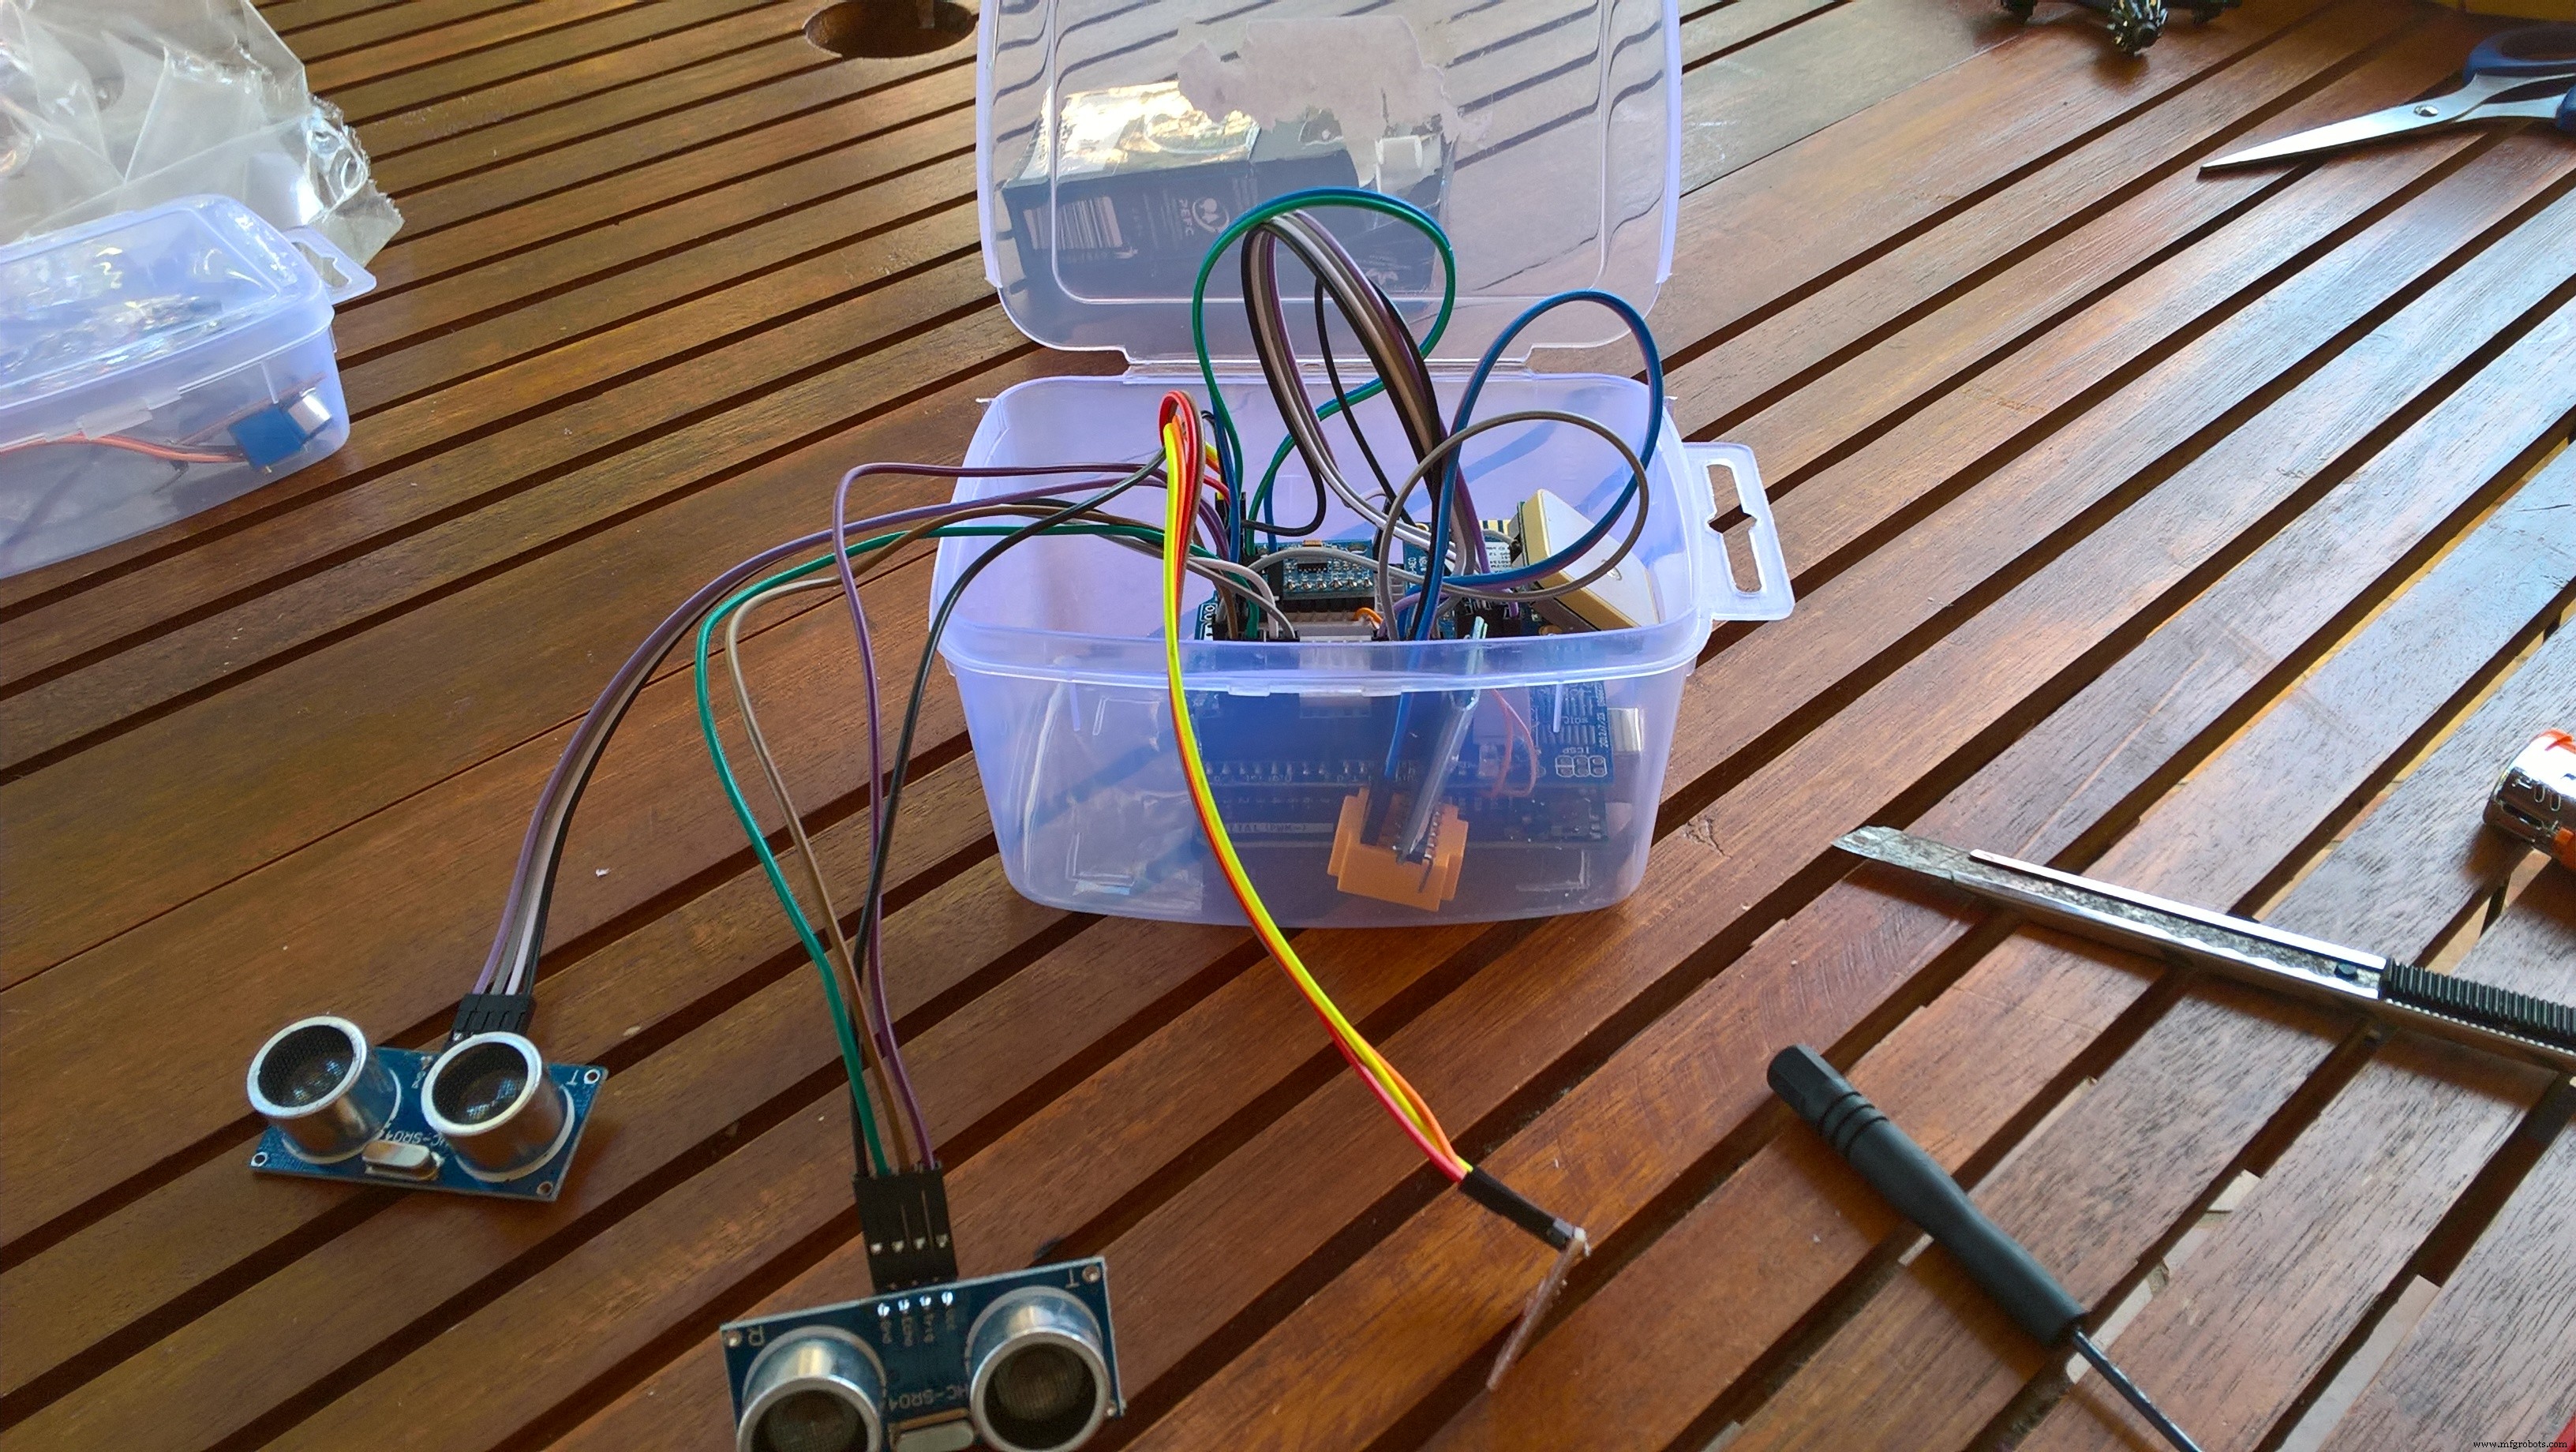
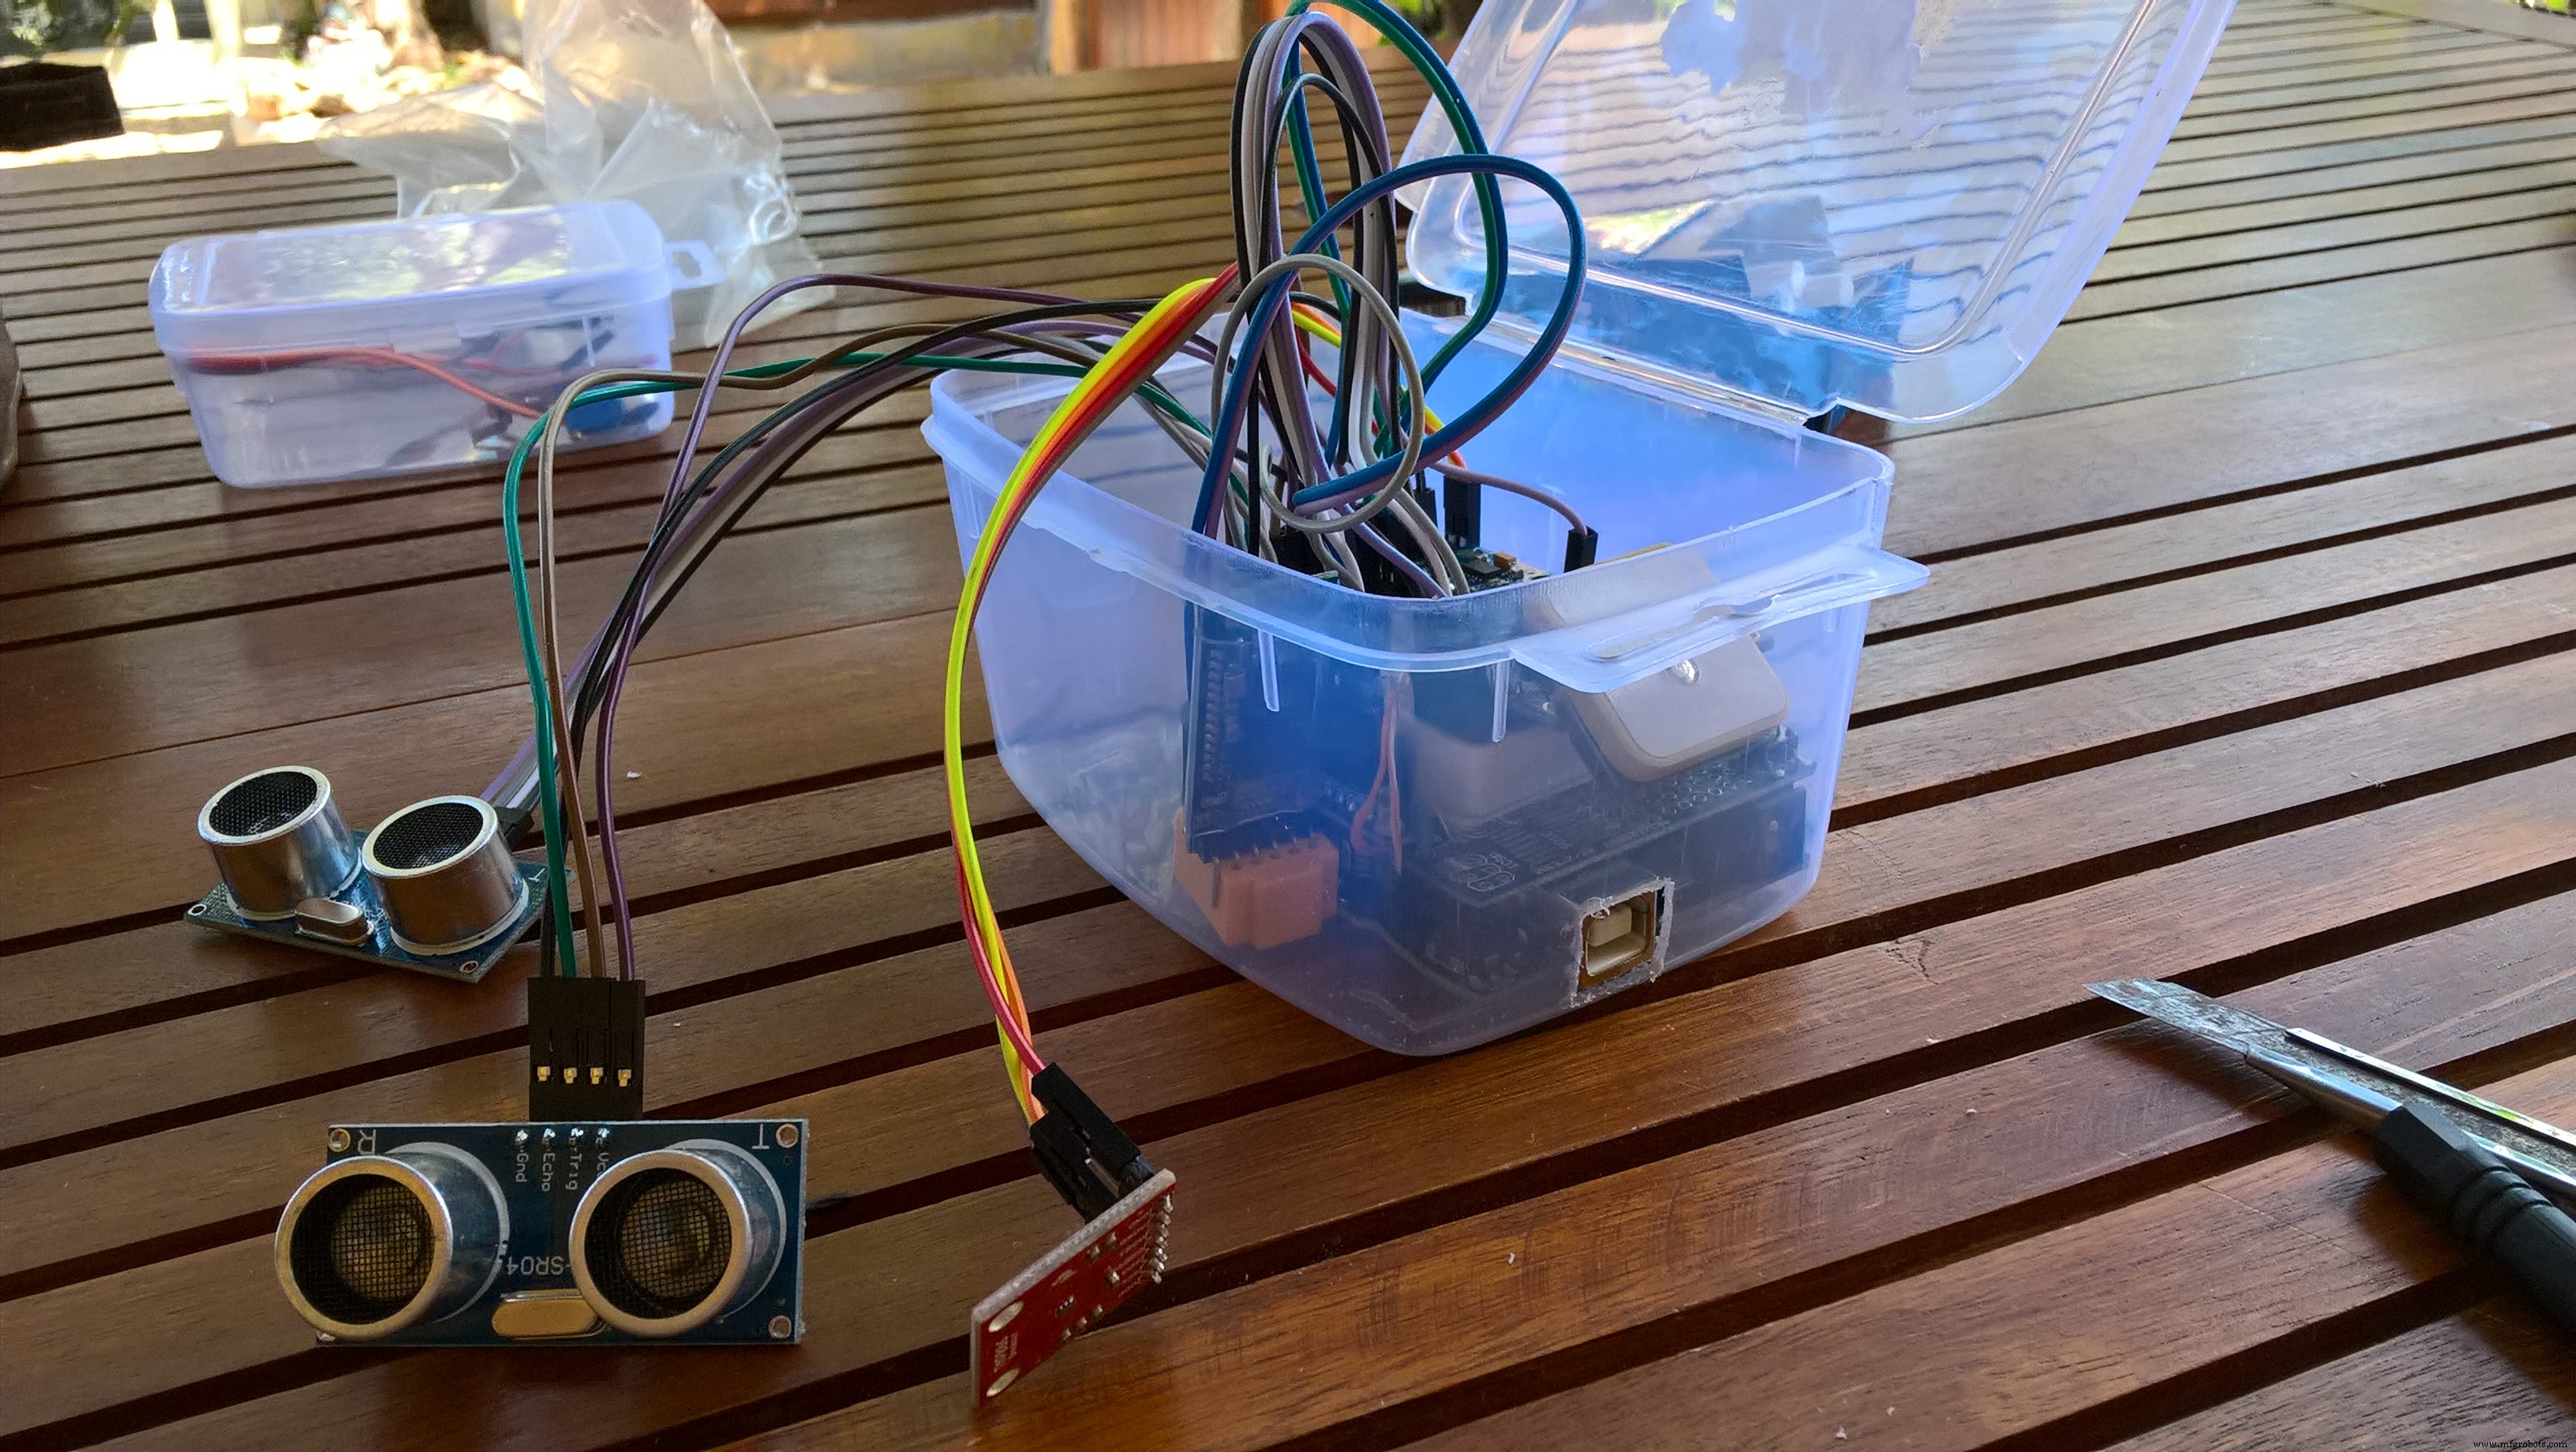
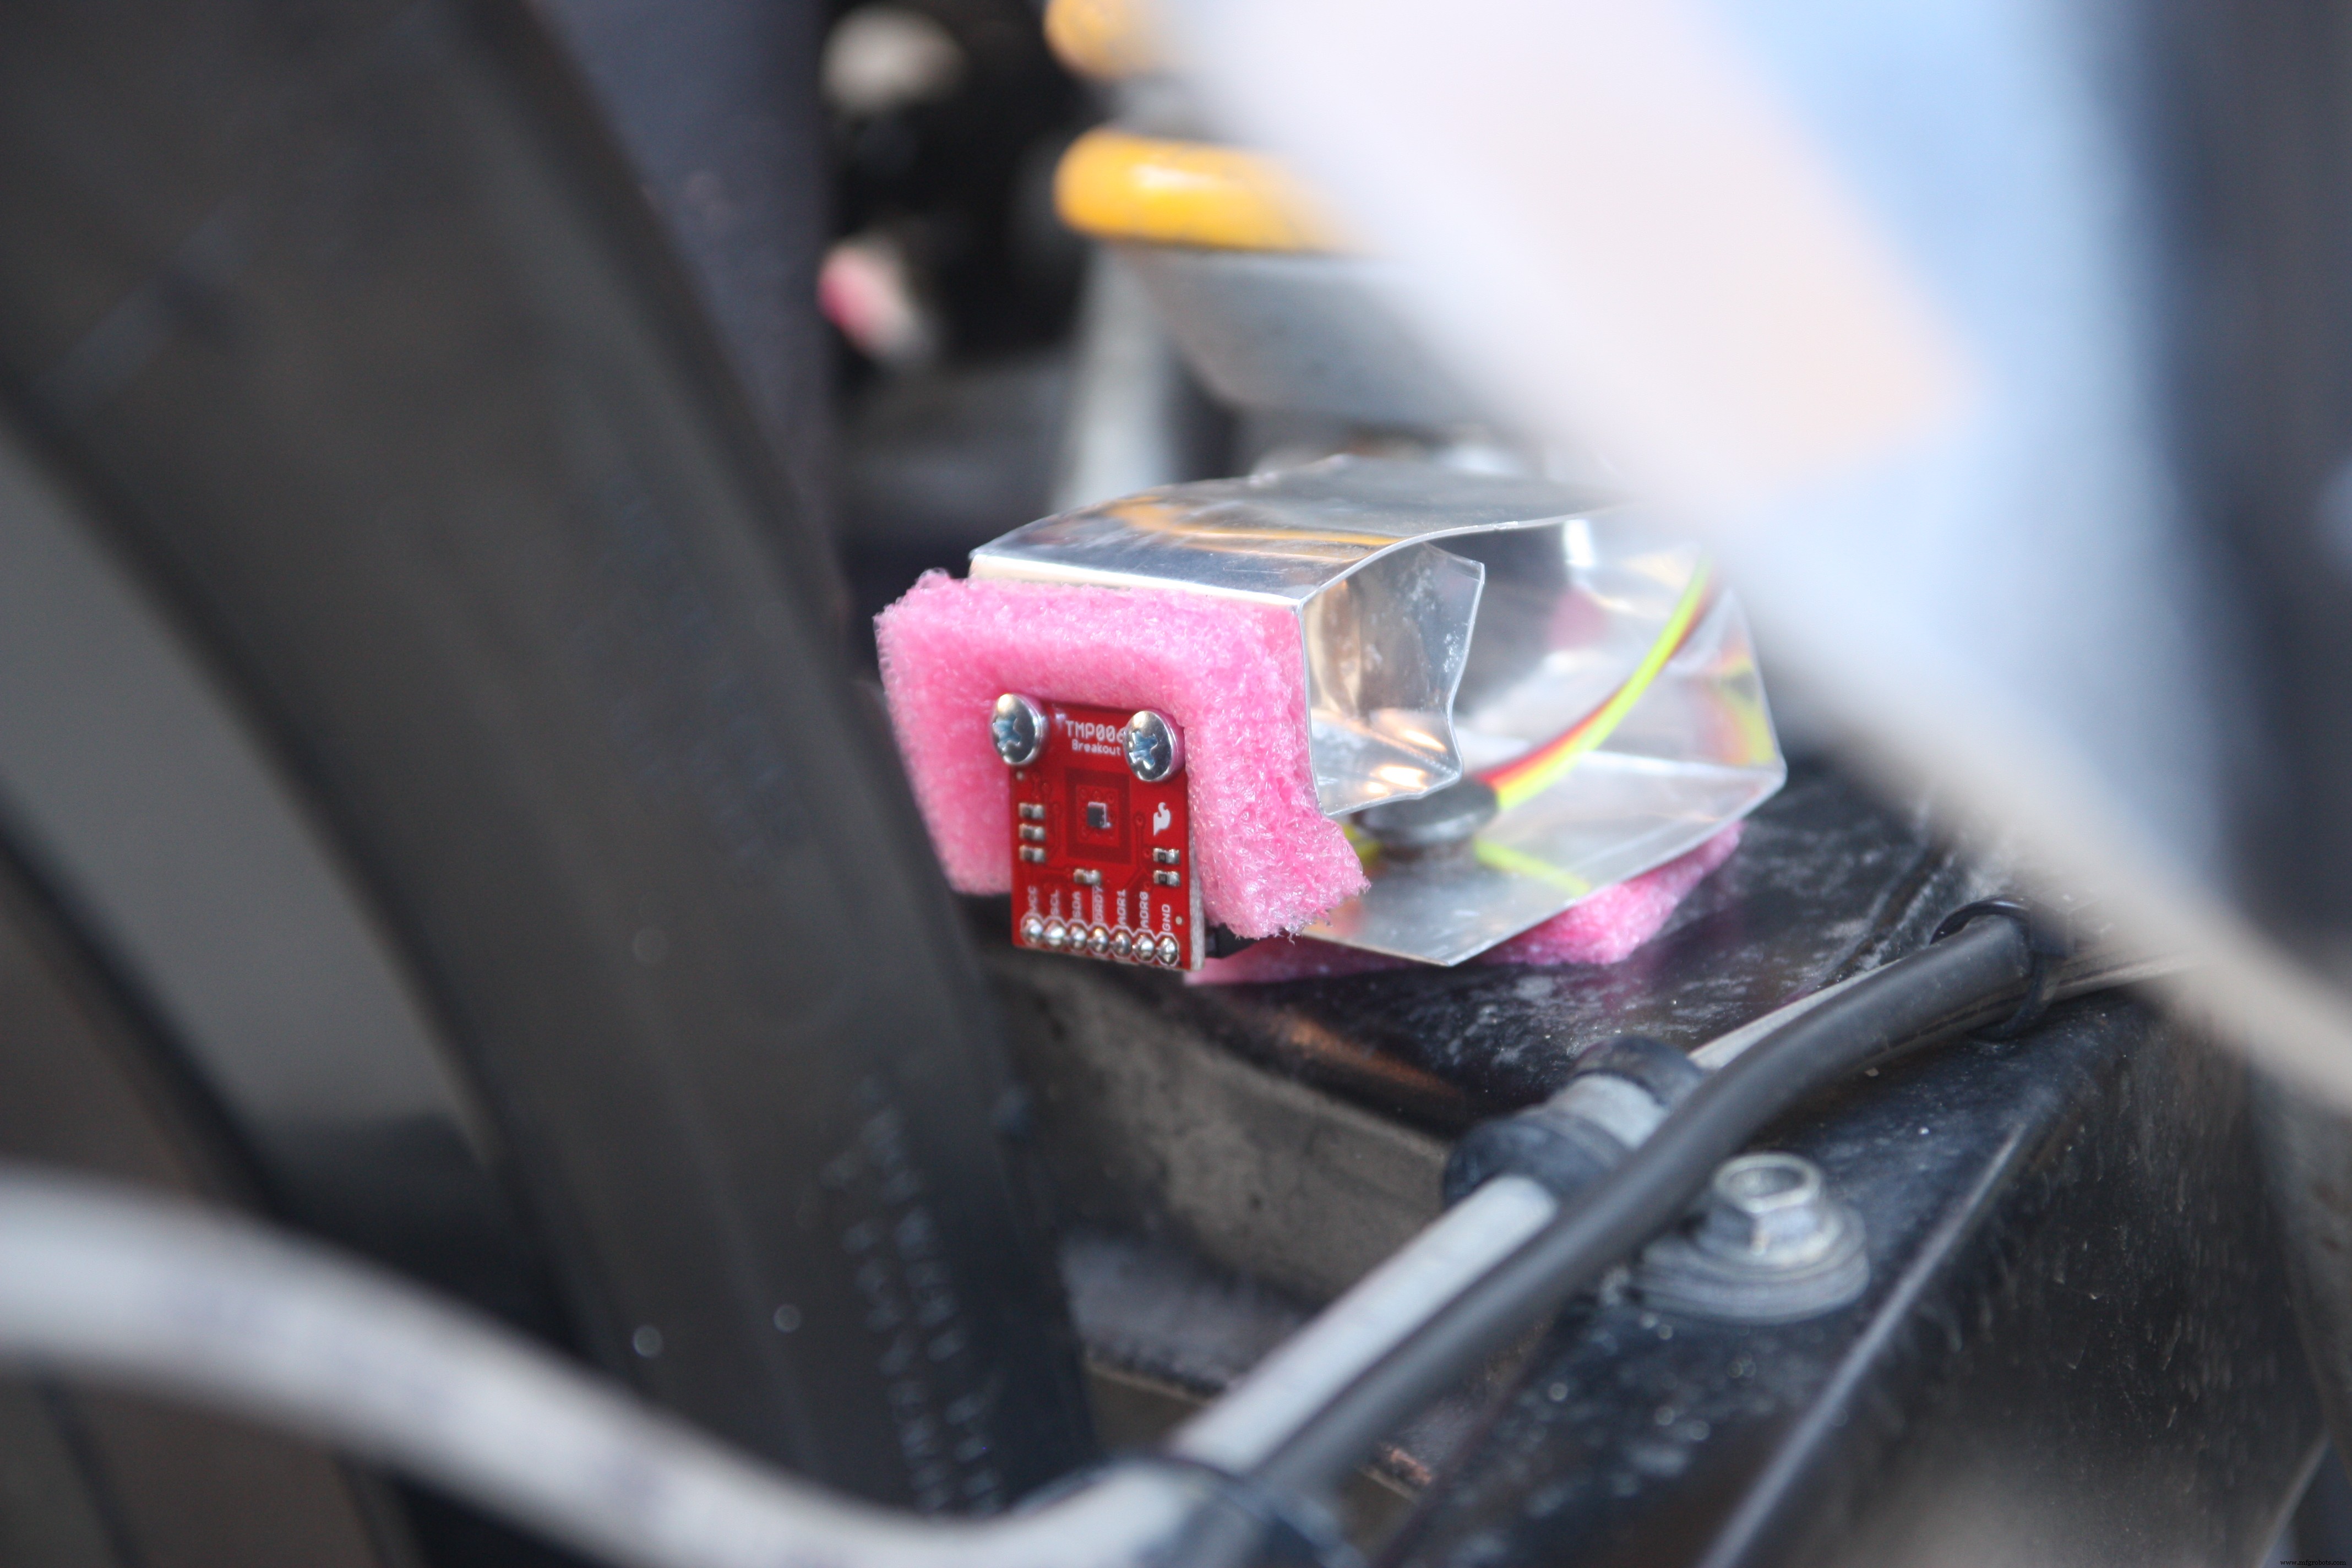
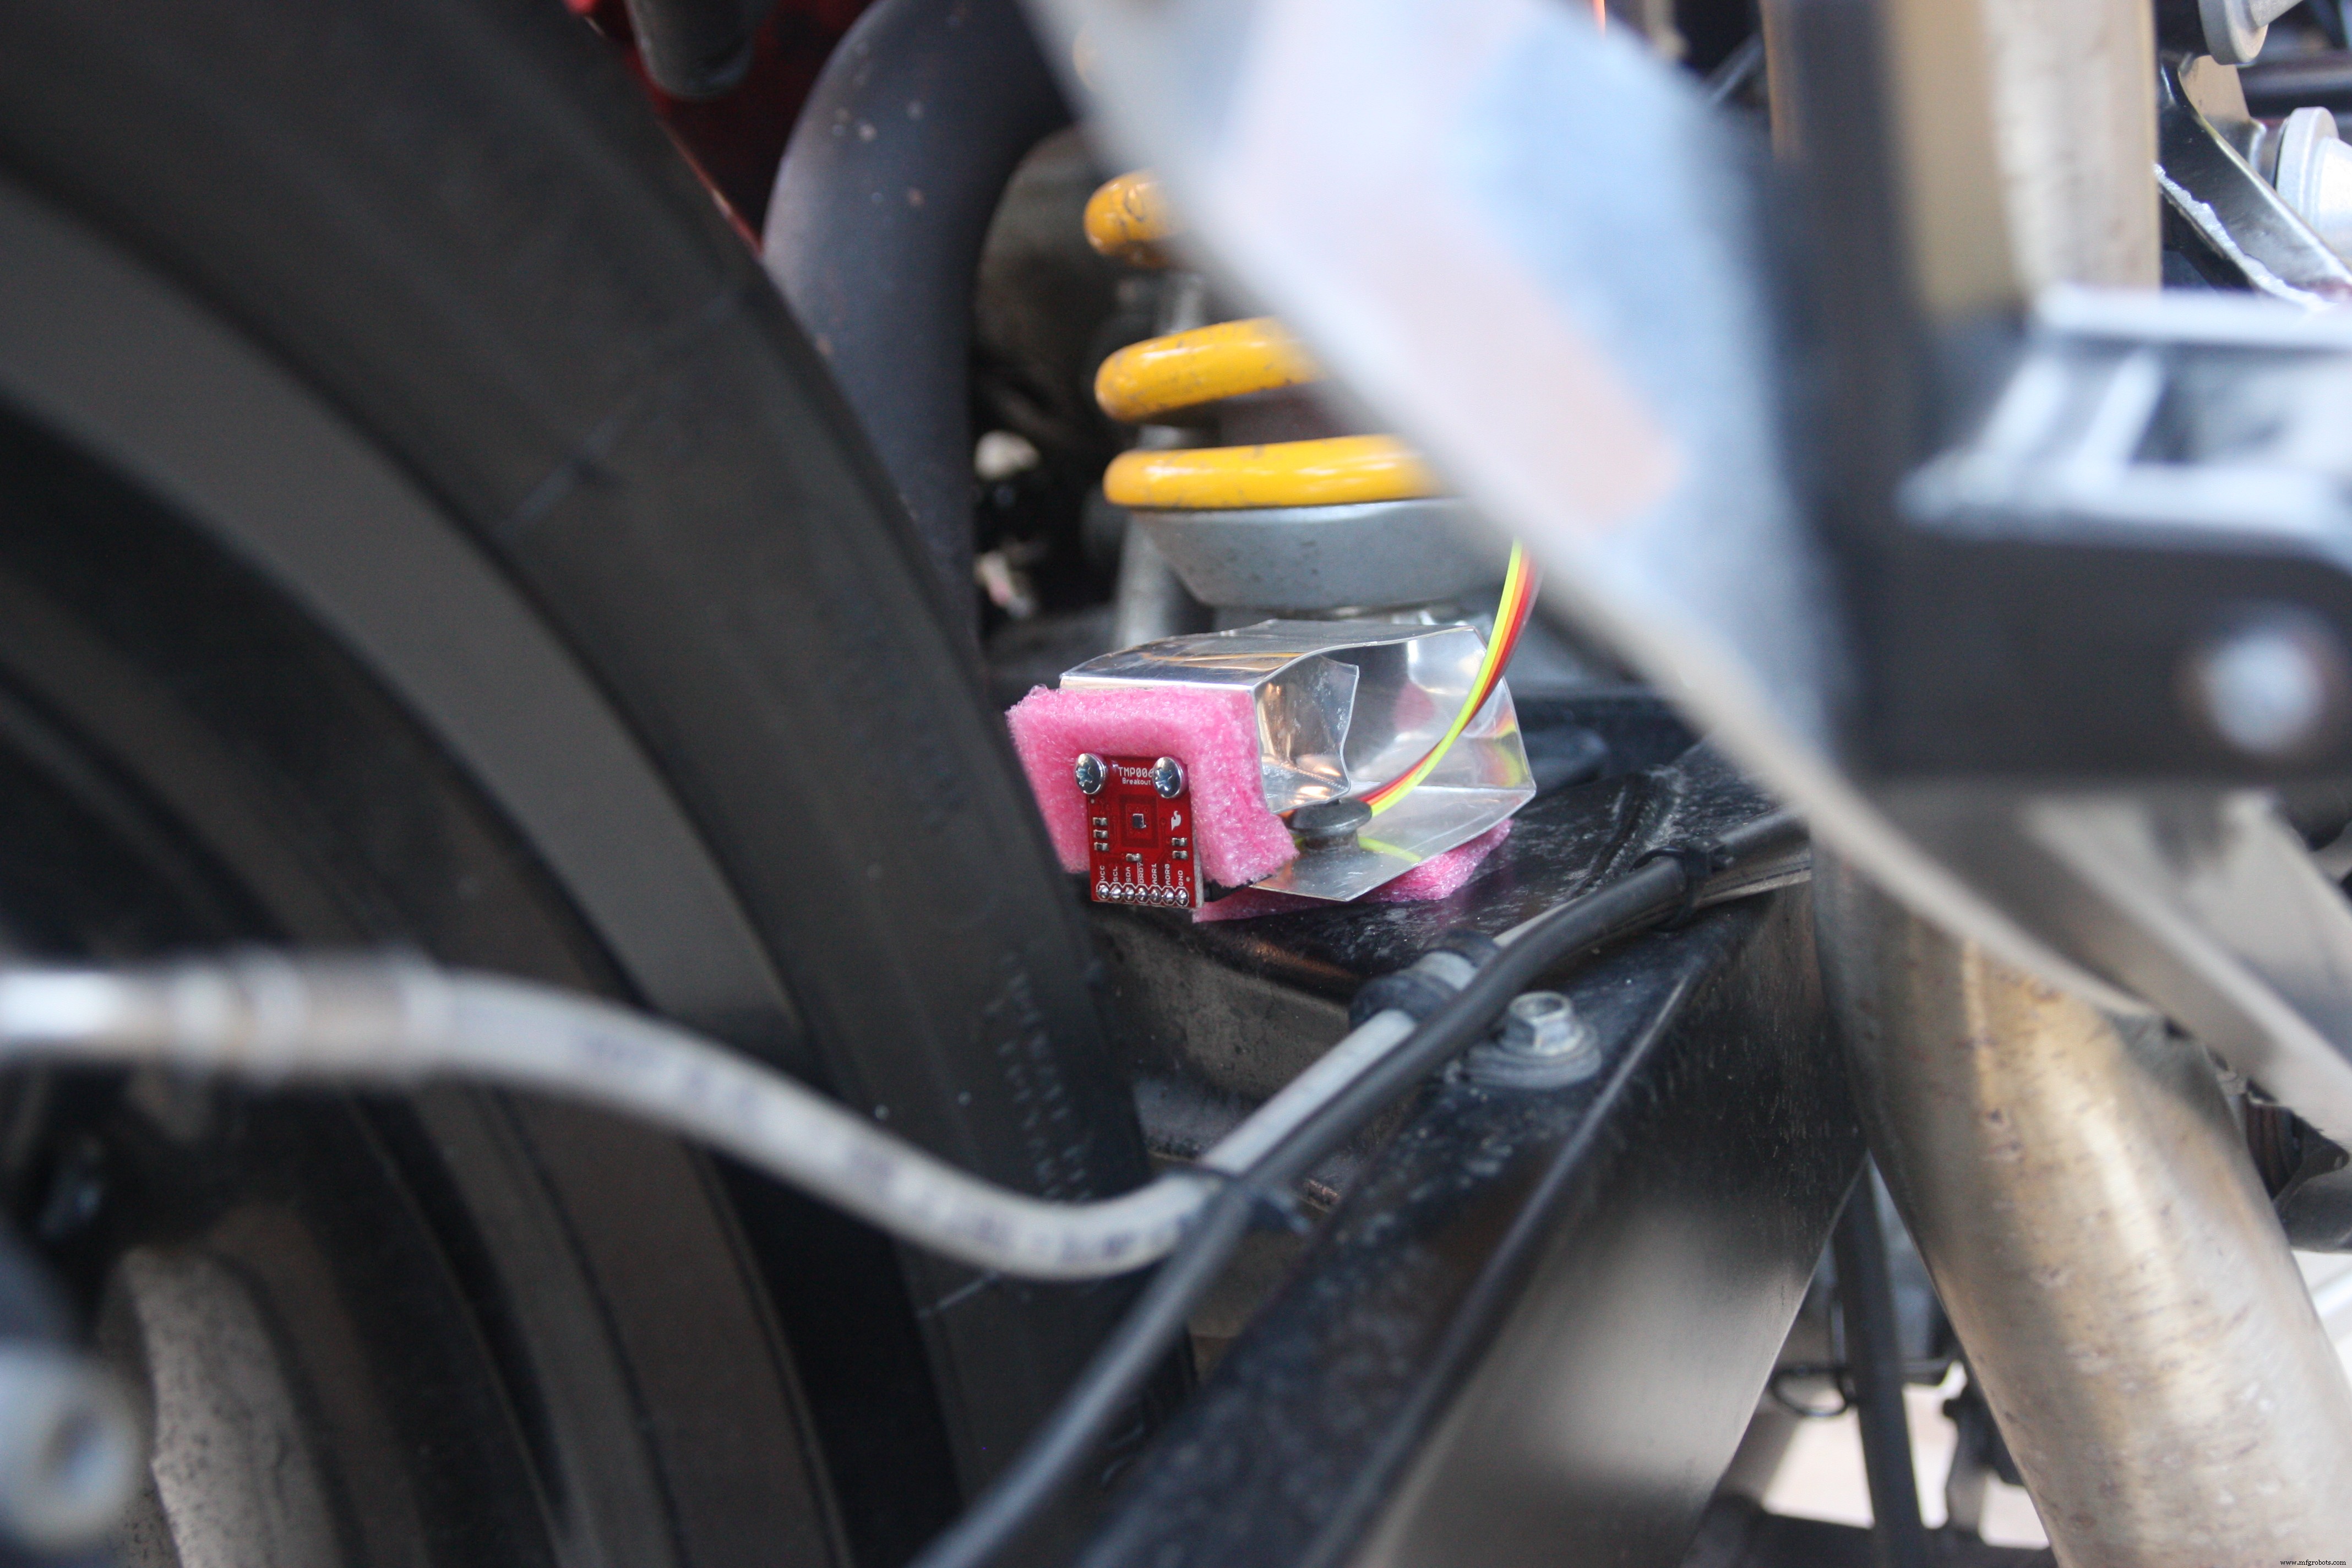
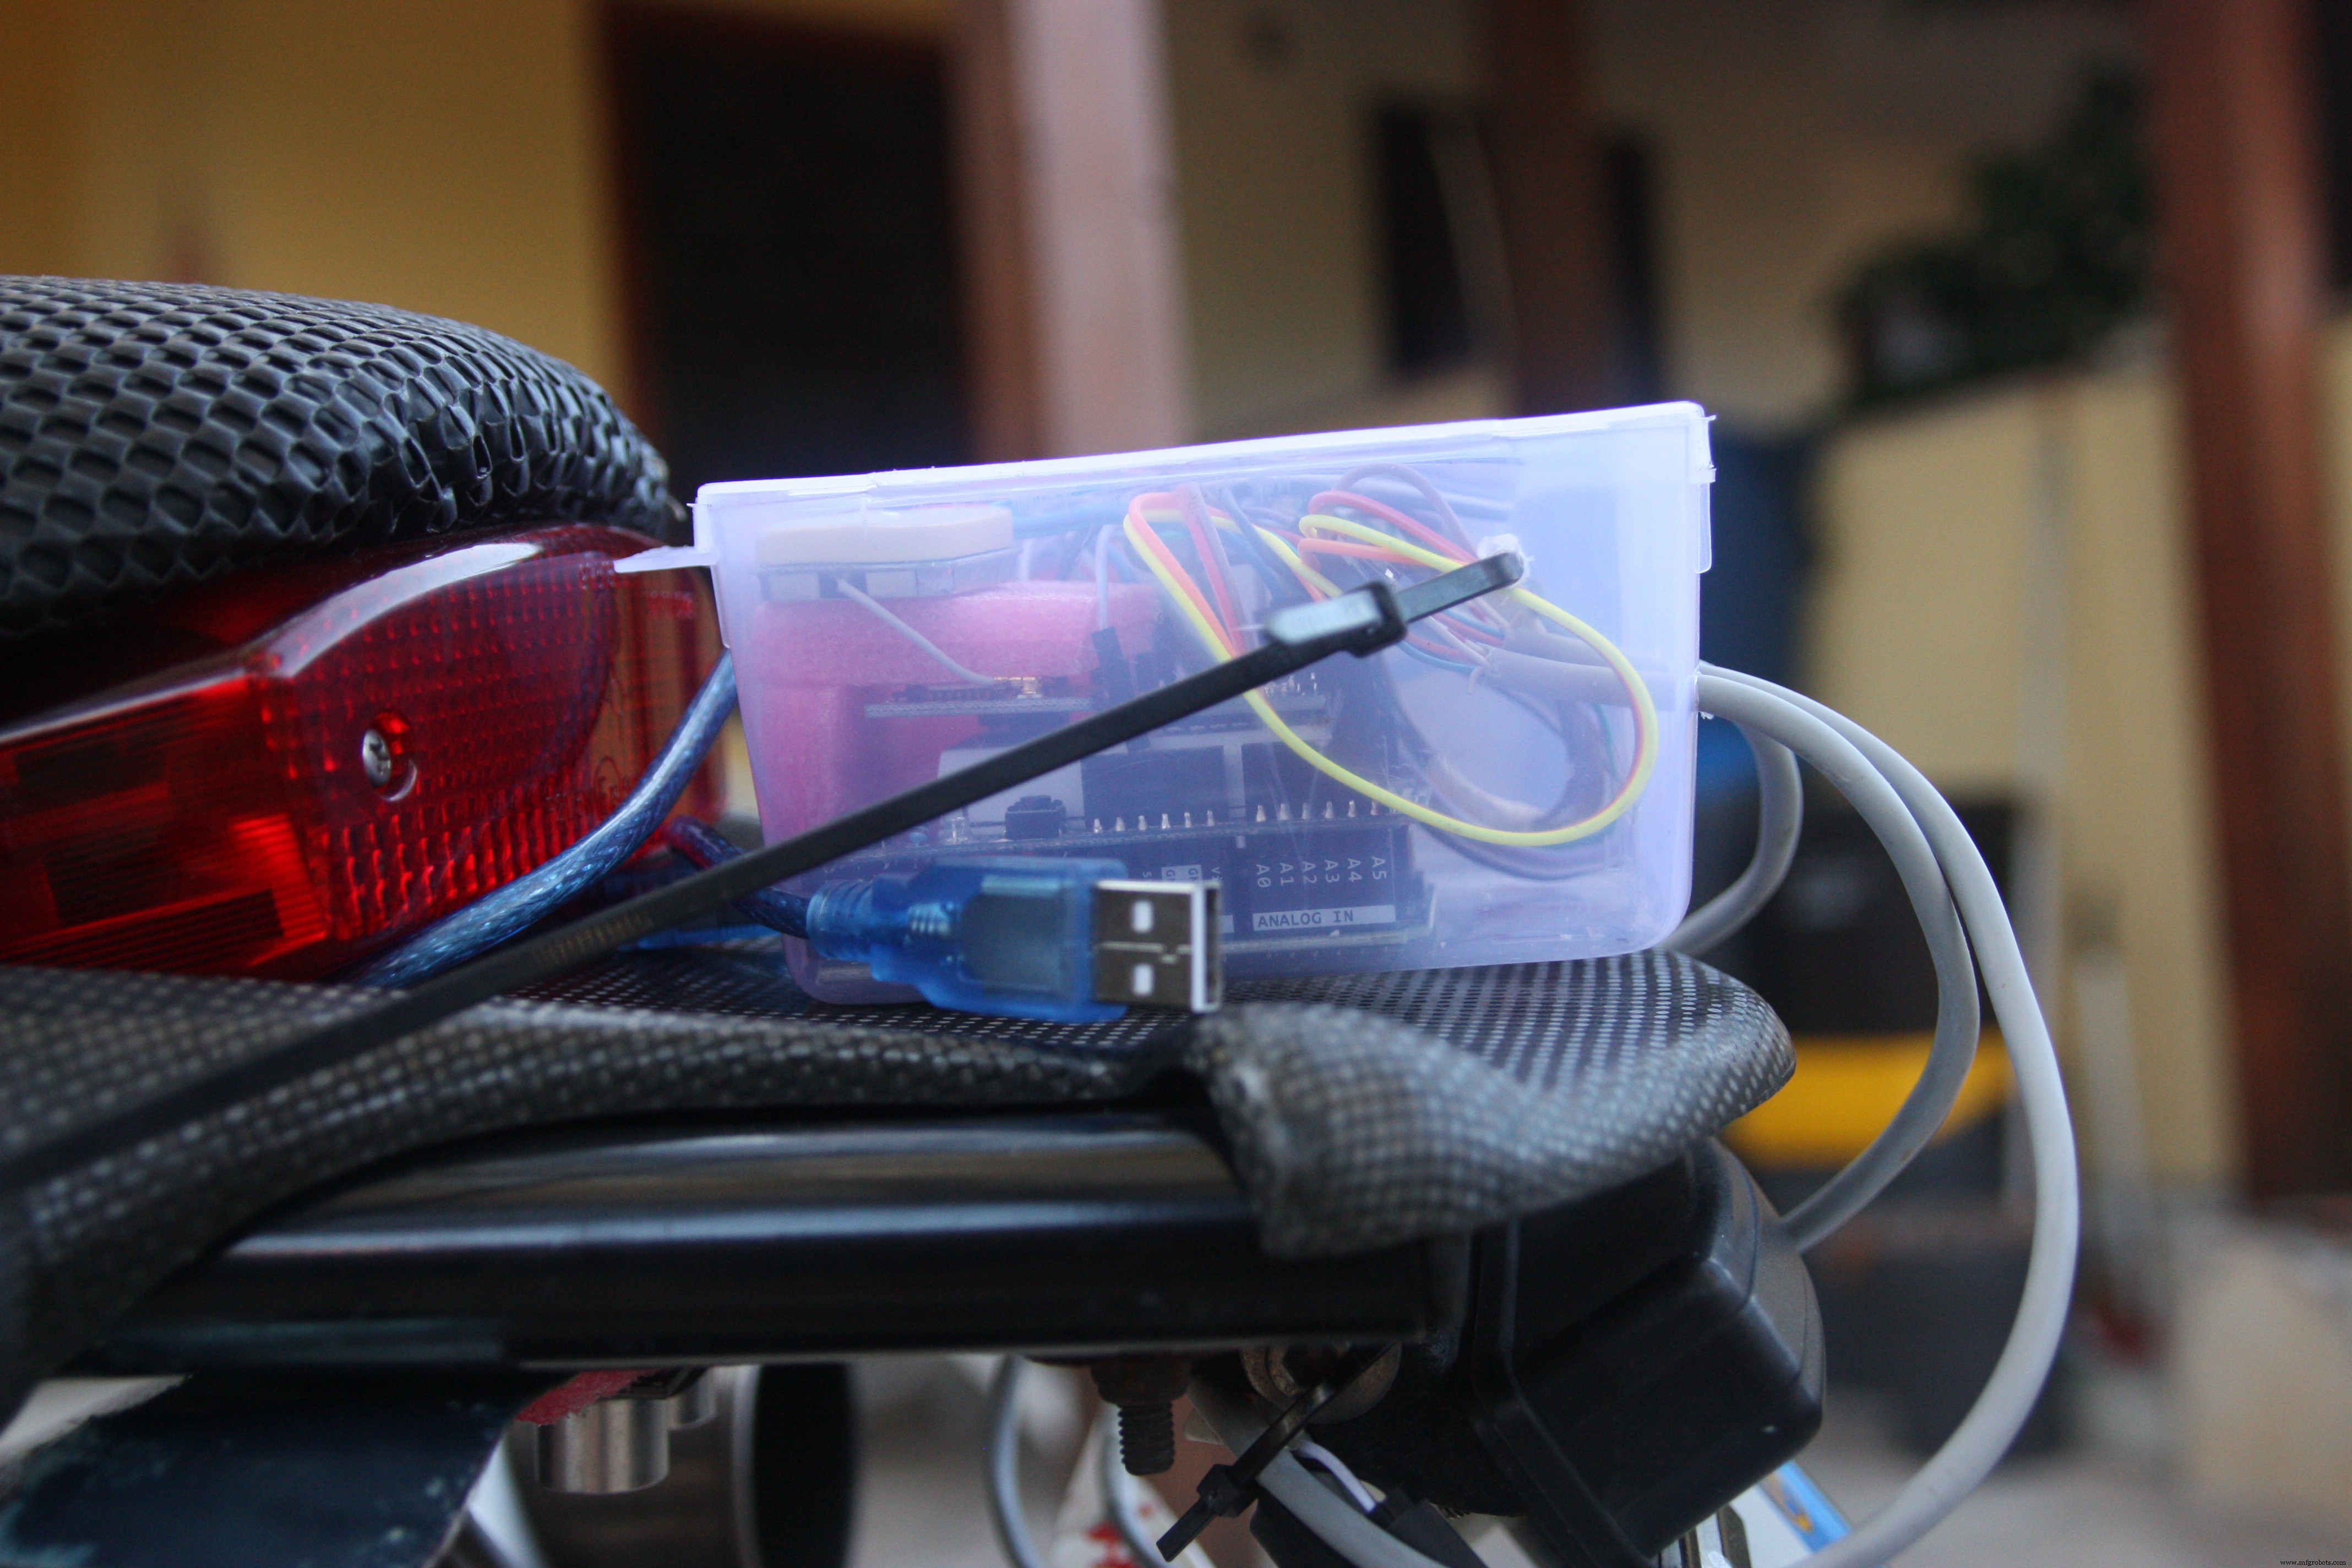
Below some pictures about my Hardware (control unit) mounted onboard.

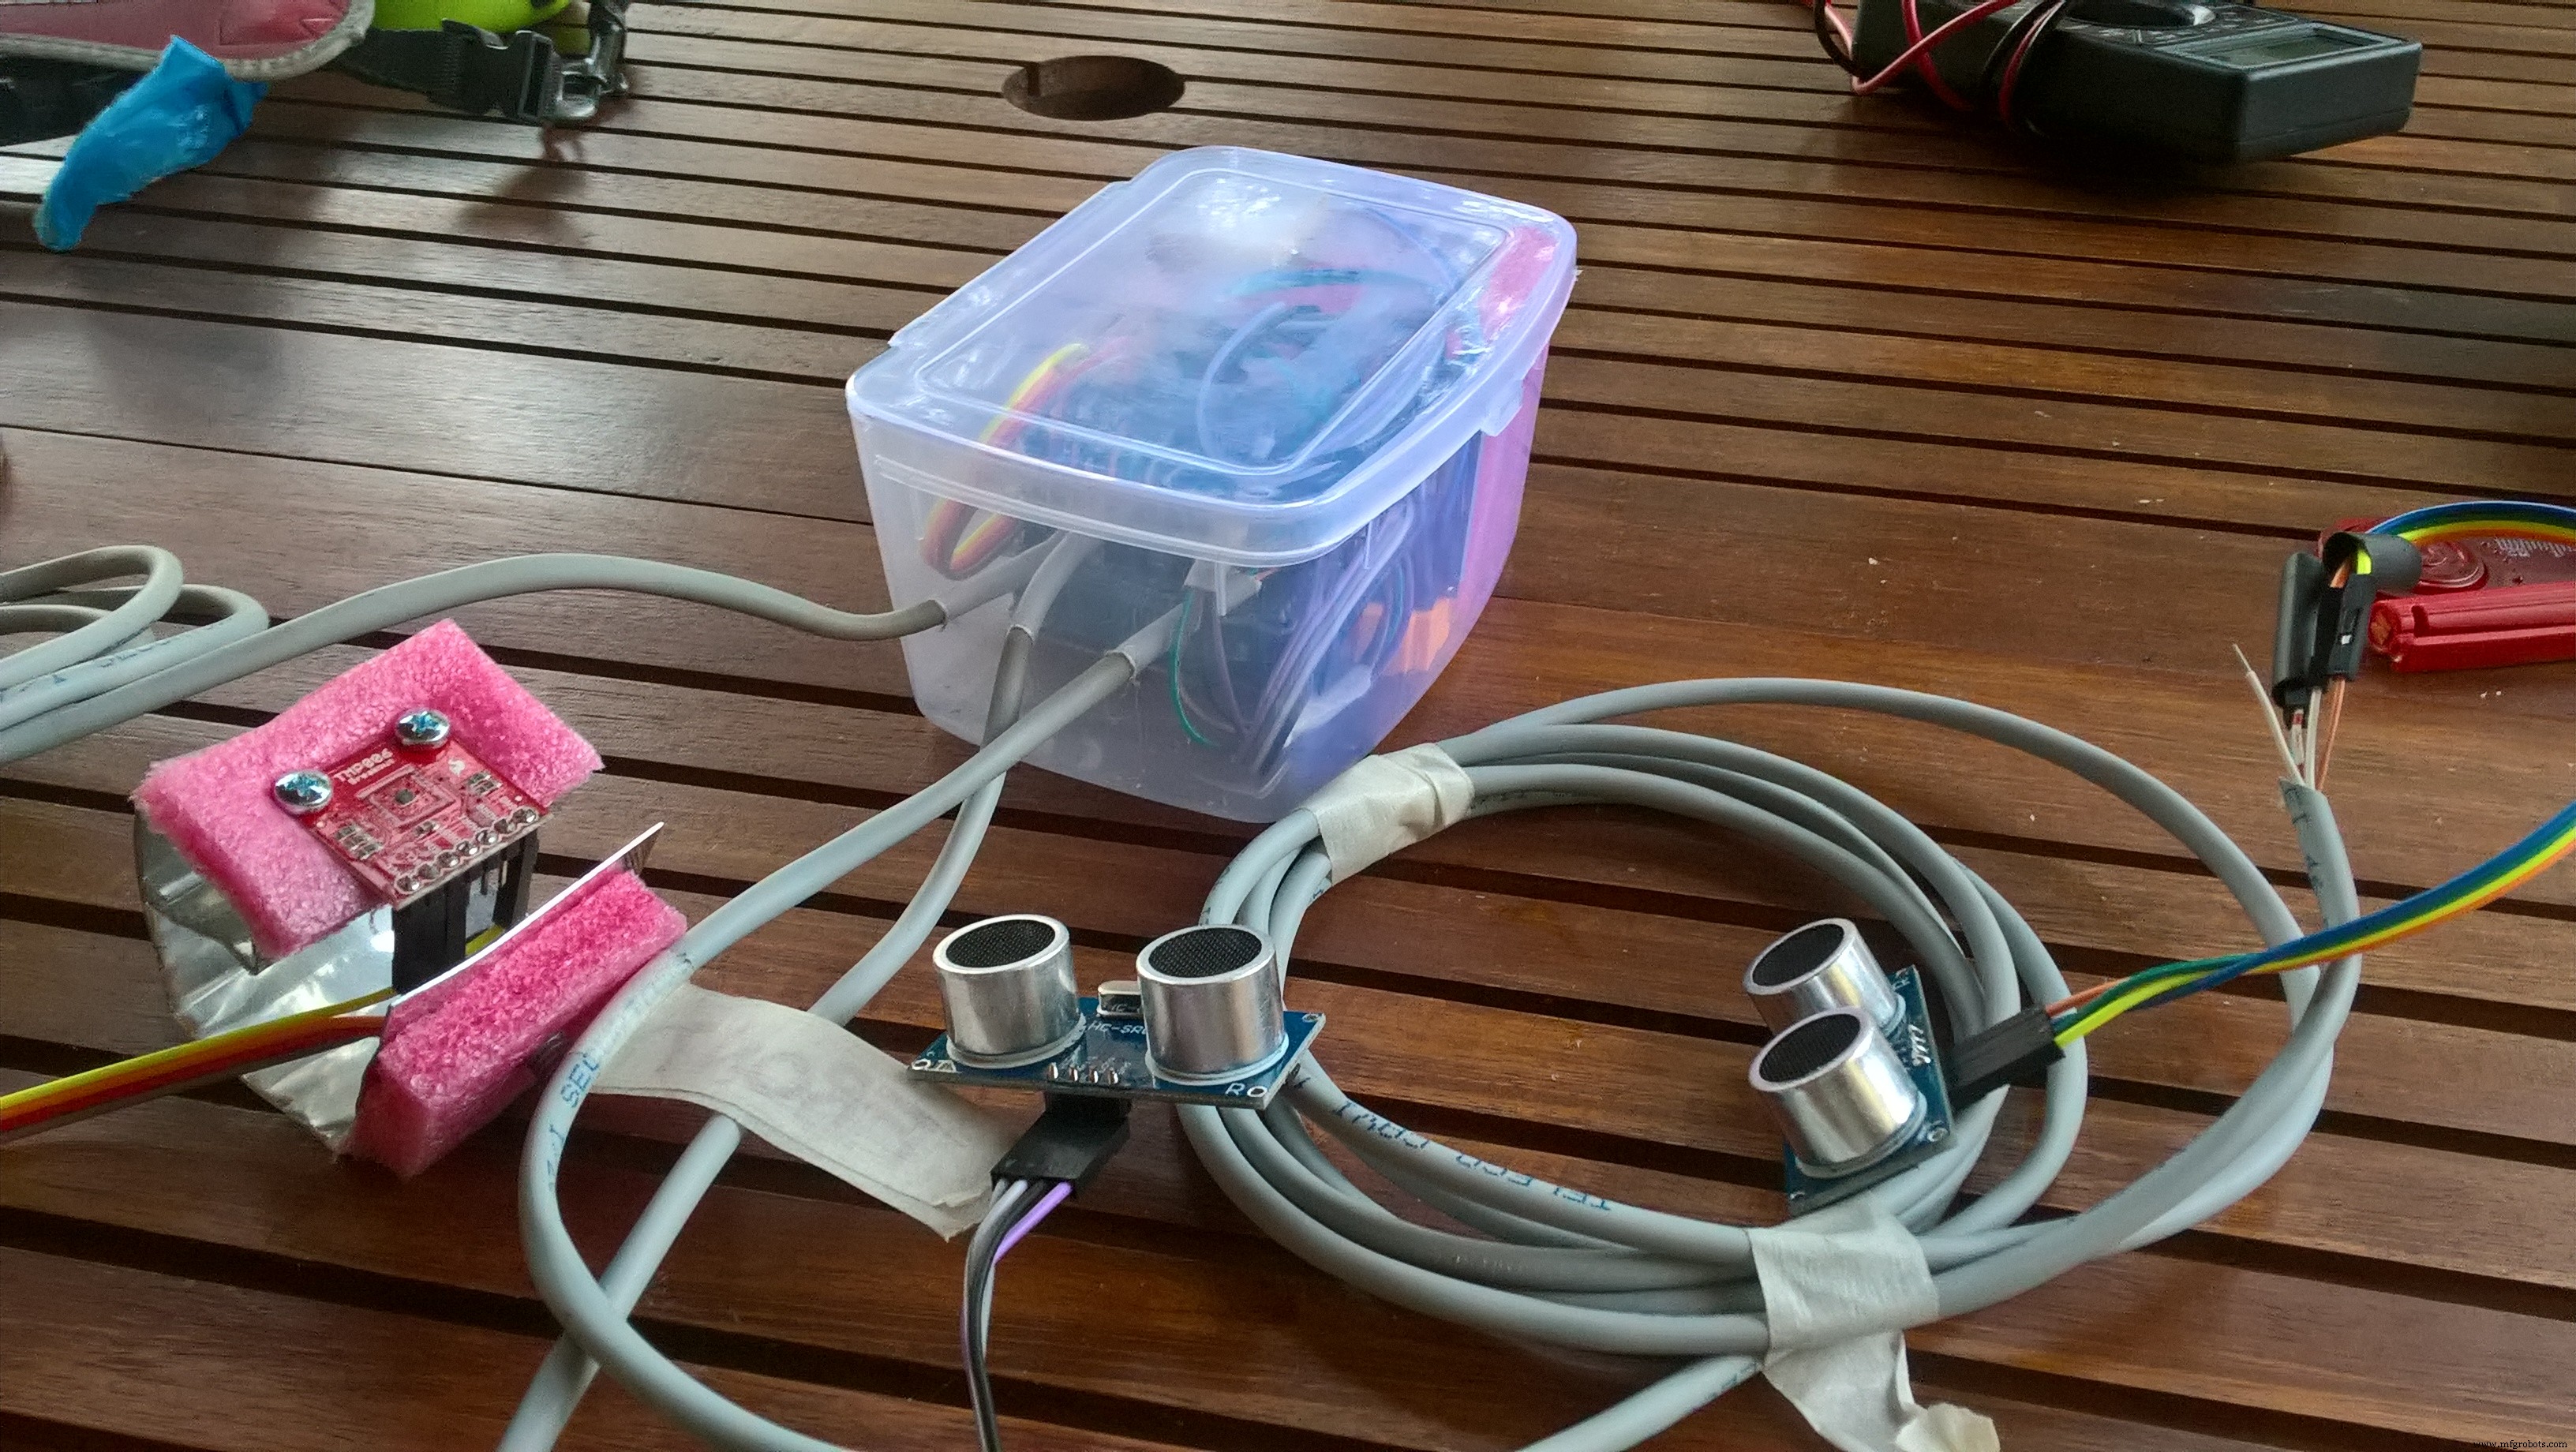
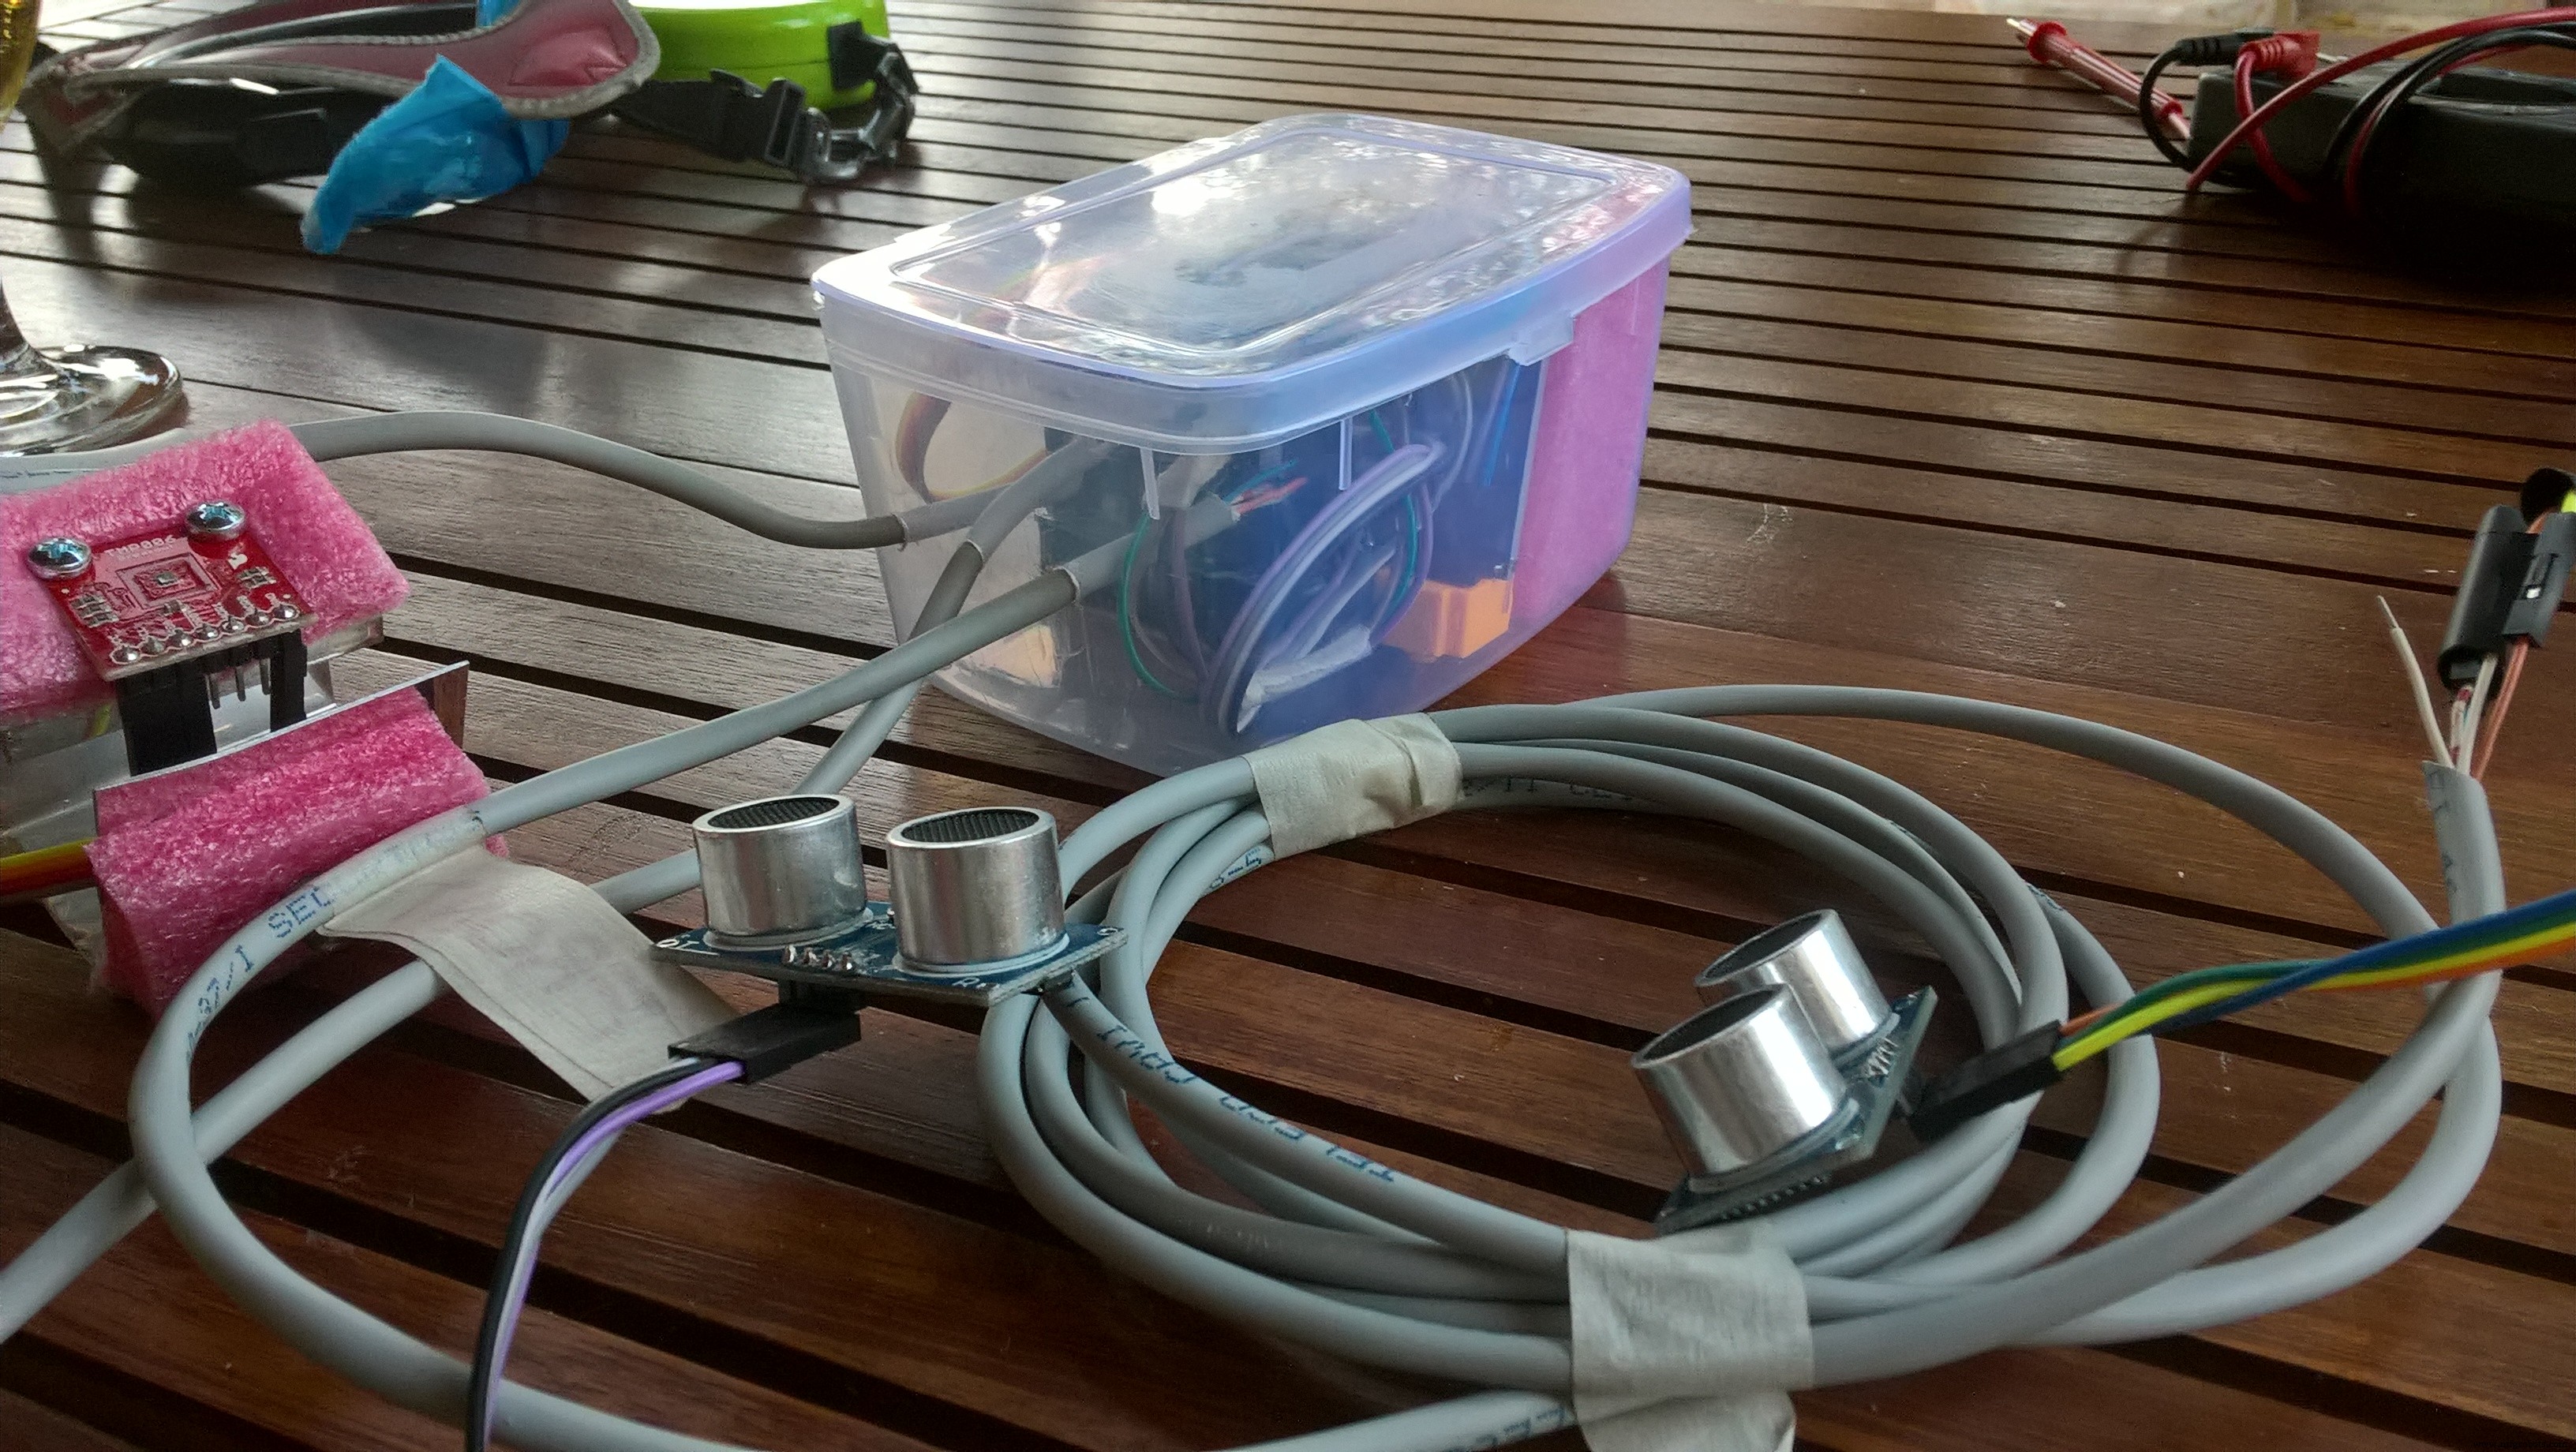
to measure the tyre temperature I created a bracket clamped behind the wheel.
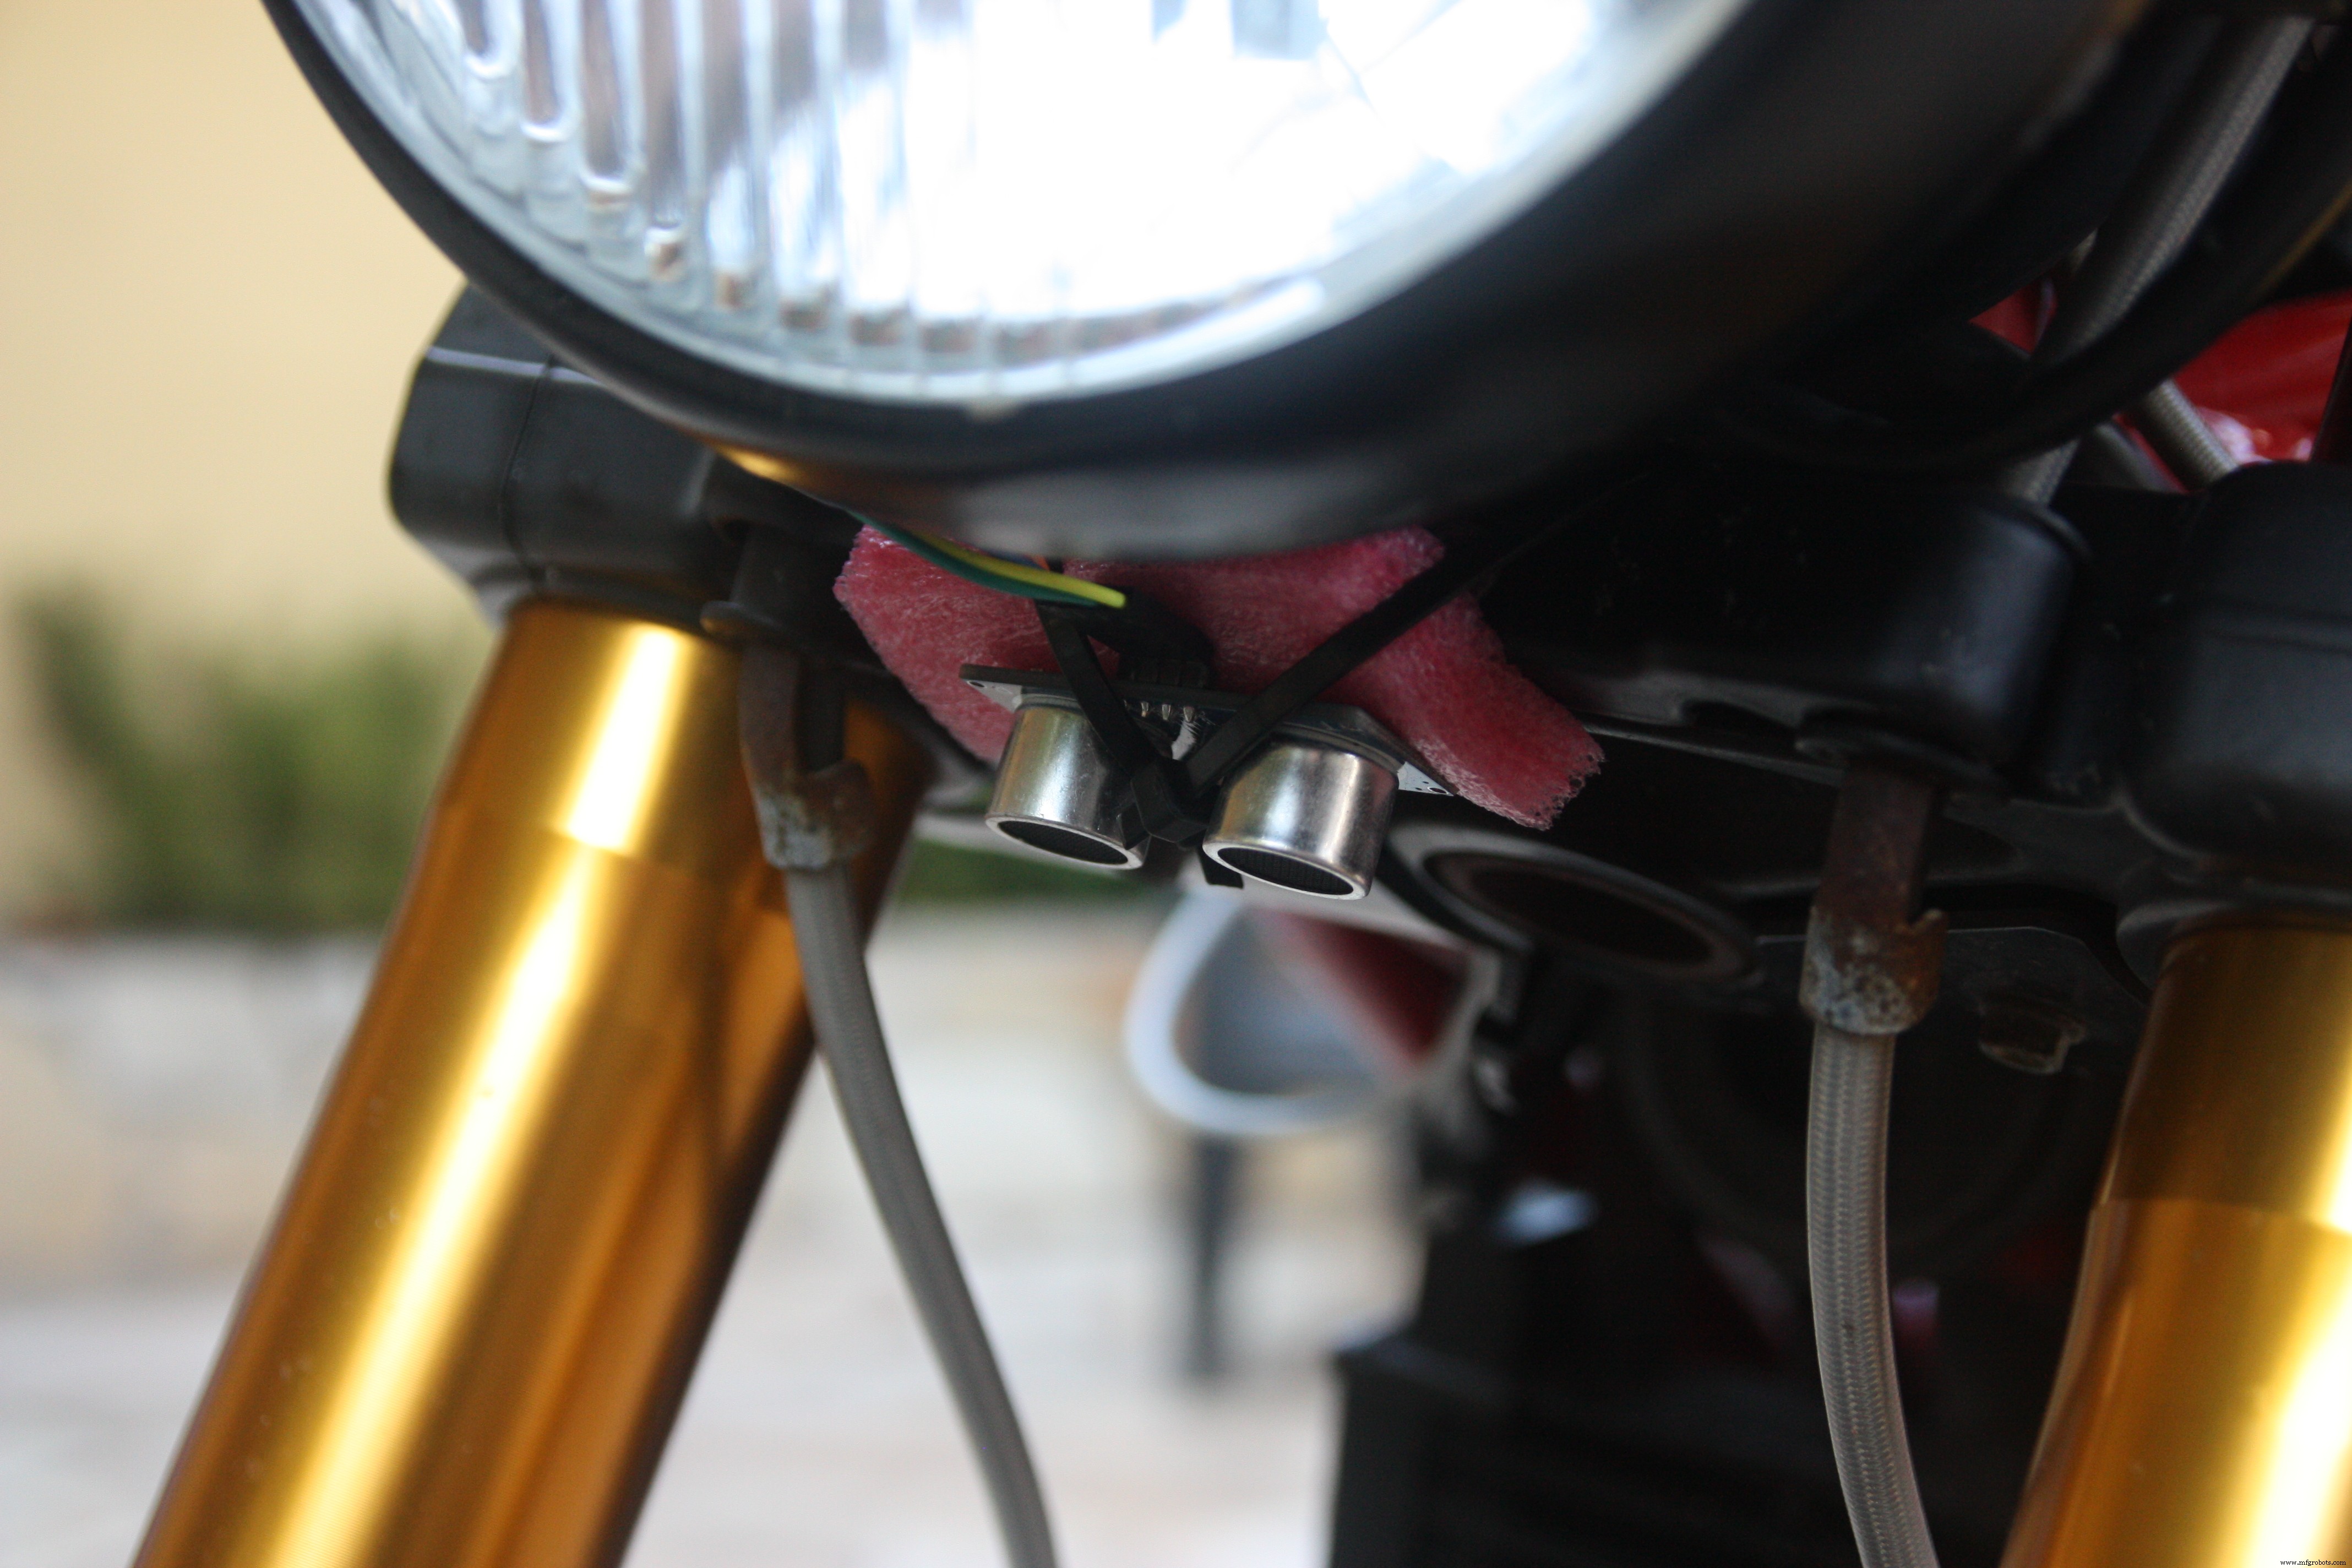
One Ultrasonic ranging module HC-SR04 has been fixed under the front headlight. It misures the distance between headlight and front mudguard.
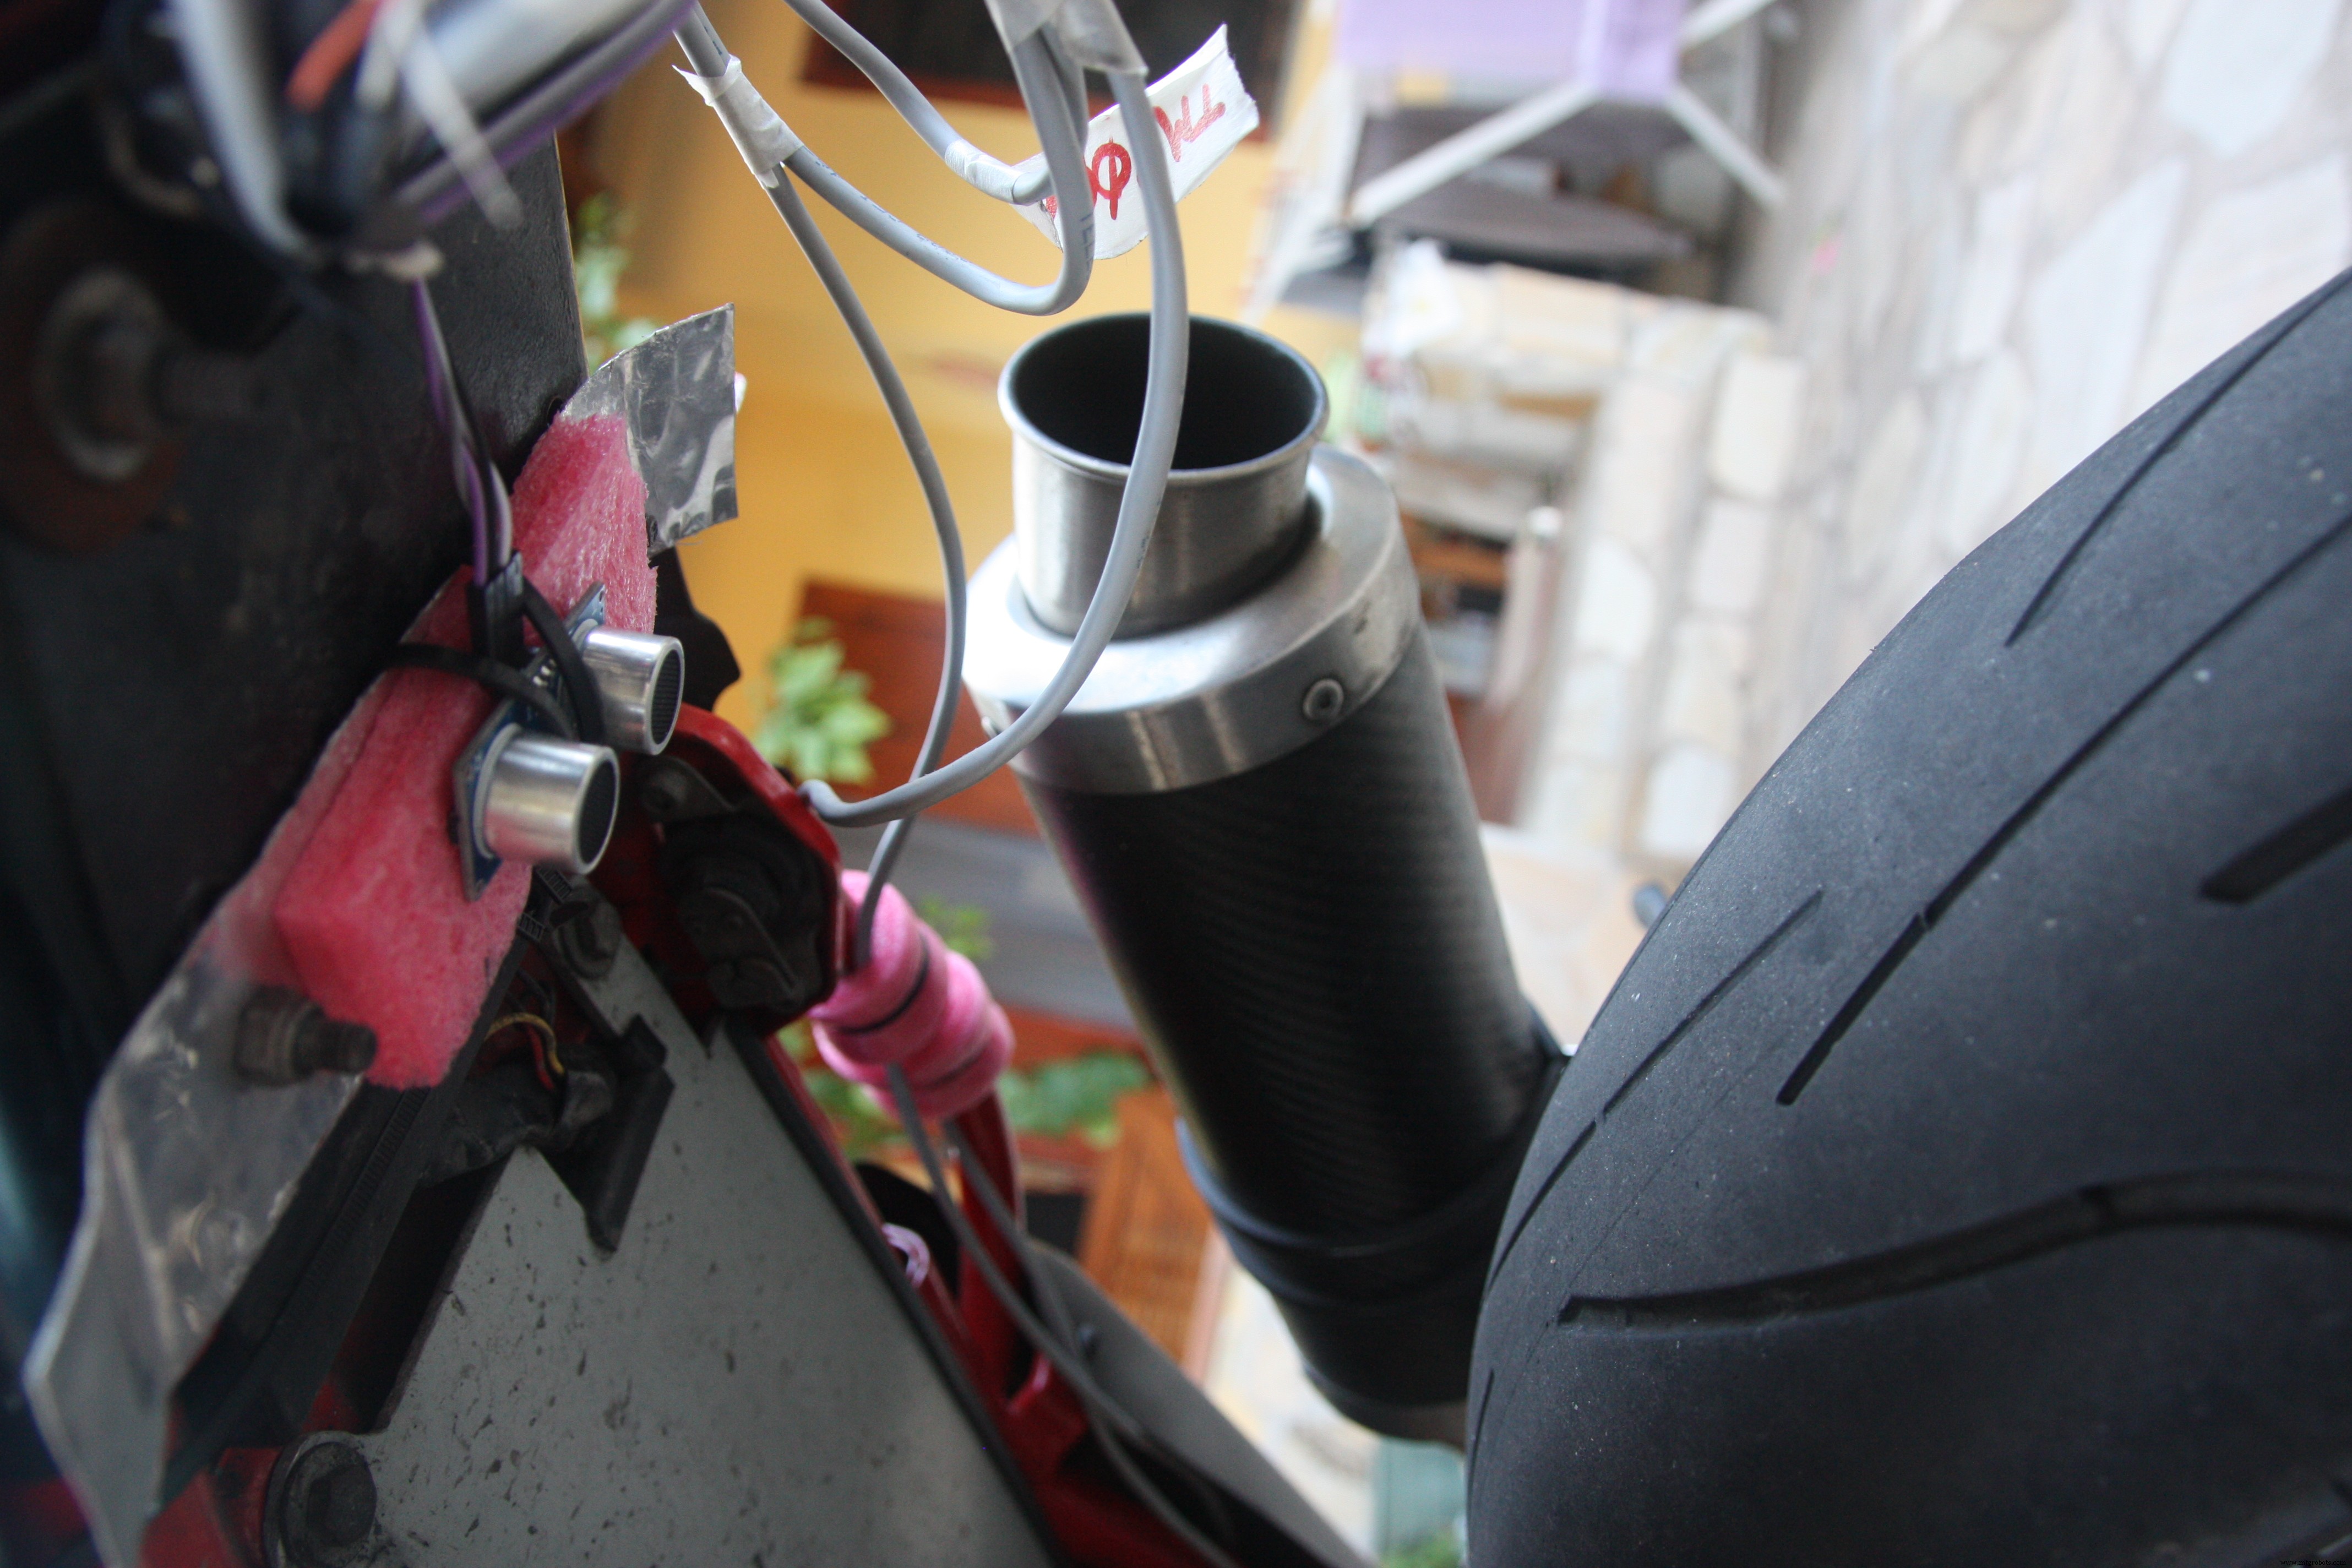
The other one Ultrasonic ranging module has been fixed under the bike seat in order to determined the back shock absorber measuring the distance between seat and rear tyre.
The central unit containing the Arduino, the GPS, the Accelerometer and the external temperature sensor has been fixed behind the seat.

And at the end, after the wiring, my motorbike is look like this

Machine Learning
The last idea of this project has been try to understand if exist a correlation between telemetries data in order to try to understand how to improve my driving style.
My data samples are not relatable because I make different routes every time and the traffic conditions are never the same. I think that a good condition should be use the system in a speedway. I Imagine that in a real race could be usefull to understand by telemetry if you can increase the speed or if you have to decrease the speed according to the output values.
The Machine Learning (ML) embodies the magic of software insights about the data, solves problems by giving information that represents a certain evolution. The ML understands how a given phenomenon will evolve according to the data in its knowledge.
The first approach using the ML is to do Experiments . Using the data, you can play and be able to do the analysis with the aim of investigating the phenomenon that interests us.
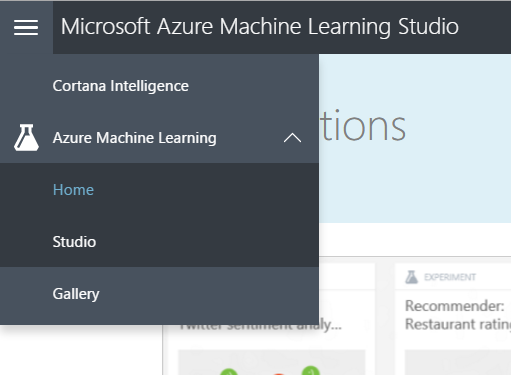
Ok let's go to discover the Azure Machine Learning
Go to https://studio.azureml.net and sign in using your Azure account.
On the left of the page click on "Studio"
You will be redirect to your personal Dashboard and now you will be ready to create experiments
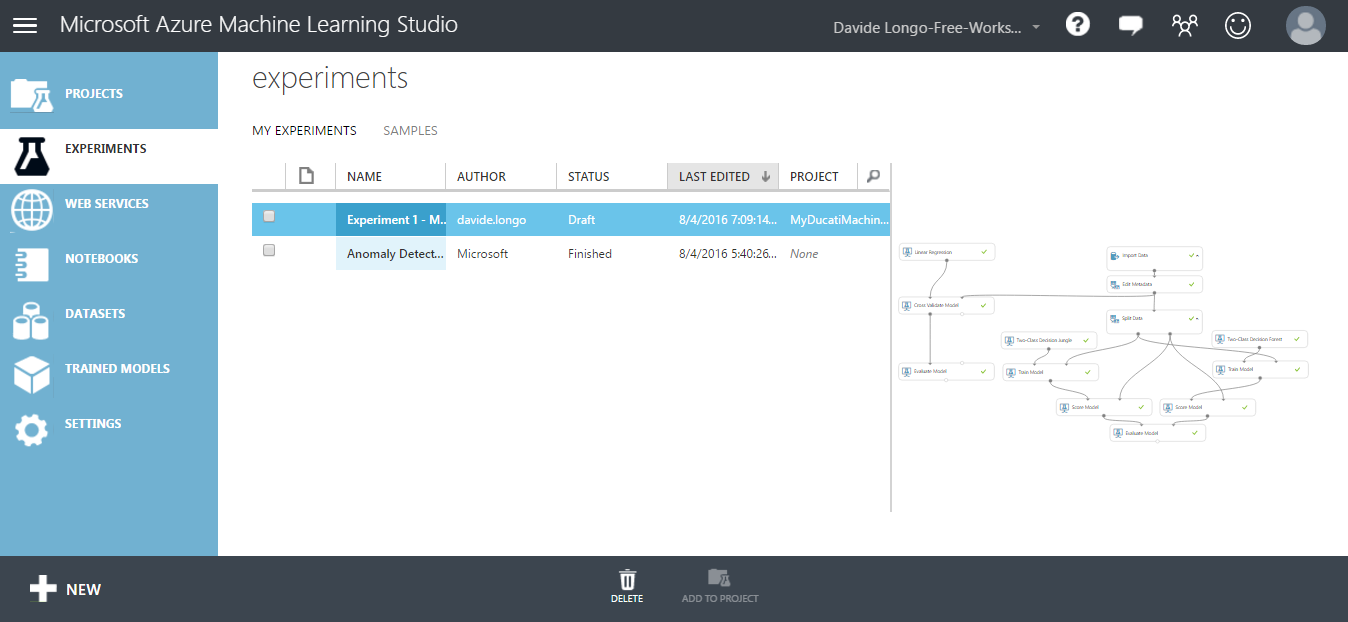
- In the experiments blade, Click NEW (on the left button of the page) .
- The first step is to Import data that you would like to use in your ML. In my case I imported the data from SQL Azure.
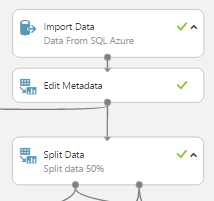
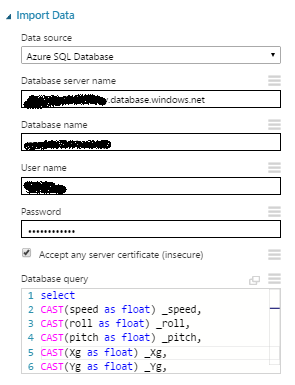
- Into my Table all data are varchar so i needed to convert it in float and excluding some bad data in order to have only best quality records. Below you can see the query used to import data
select CAST(speed as float) _speed, CAST(roll as float) _roll, CAST(pitch as float) _pitch, CAST(Xg as float) _Xg, CAST(Yg as float) _Yg, CAST(Zg as float) _Zg, CAST(TempExt as float) _TempExt, CAST(TempTyre as float) _TempTyre, CAST(FrontAbsorber as float) _FrontAbsorber, CAST(BackAbsorber as float) _BackAbsorberfrom mytelemetrywhere CAST(speed as float)>3 and CAST(FrontAbsorber as float)>0 and CAST(BackAbsorber as float)>0 and CAST(roll as float)<60 and CAST(roll as float)>-60 - Then add a SPLIT DATA element in order to use some data to Train your ML and decide the data percentage to use for the configuration.
- A data portion will be used to configure the template and the other portion to see if your model works fine. This will allow me to assess the goodness.
- Add a Train Model and decide what is the field that would you like the model guess and decide which algorithm use for your train.

- Now we verify how he behaved the algorithm giving us a feeling of goodness, to do that we need to use "Score Model ". the SM accept in input 2 sources, the first one is from Train Model and the second one from the SPLIT DATA .
- At the end we ready to estimate the model according to the test data, comparing them with those that have not yet used (Evaluate Model ).
Official Documentation about " Evaluate Model" can be found here
Below there is a sample experiment useful for comparing 2 algorithms using the Evaluation Model , the 2 algorithms are Two-class decision jungle and Two-class decision forest .
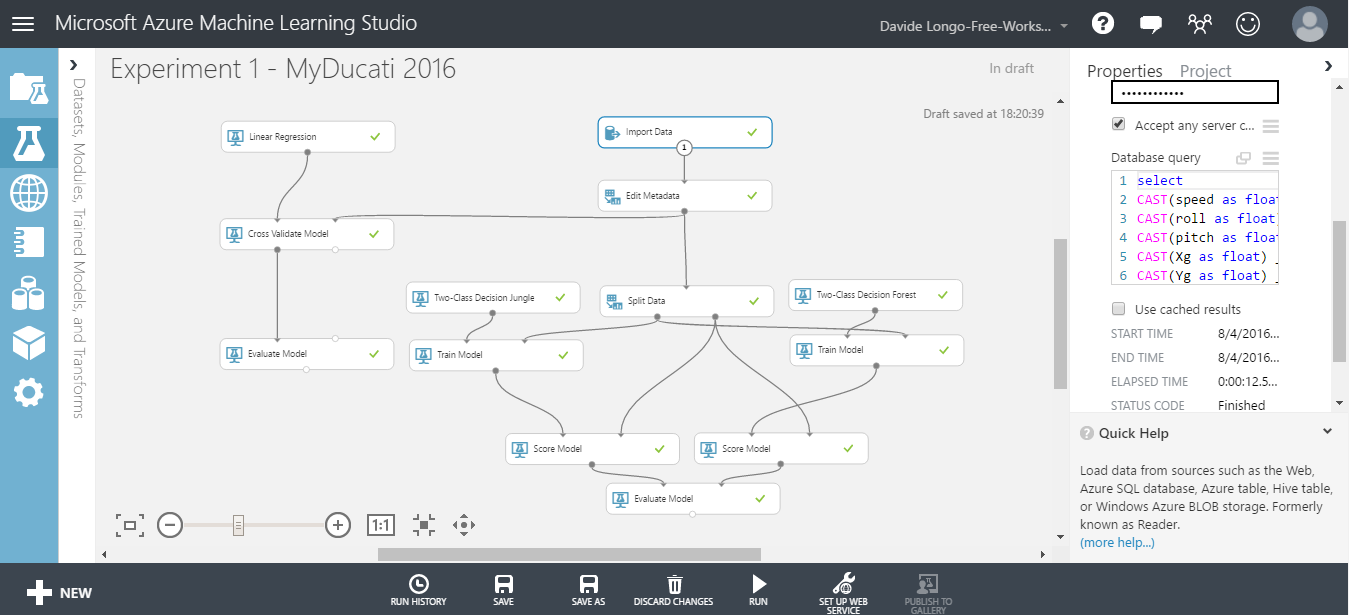
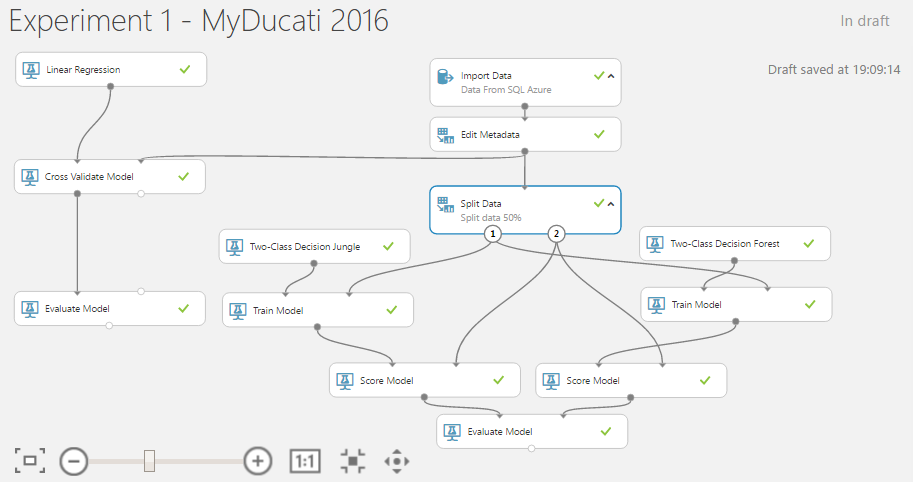
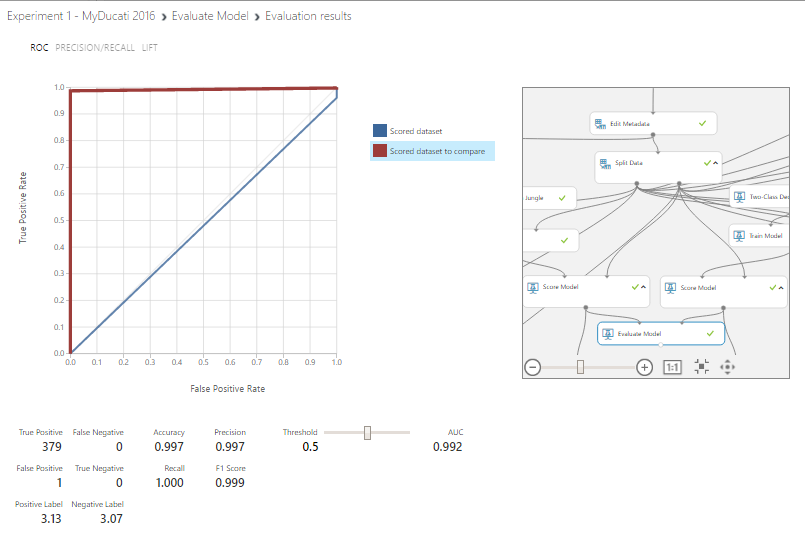
When you pass on a scored model for a "two classes" classification algorithm, the evaluation model generates metrics shown below:
Classification Models
The above metrics are reported for evaluating classification models.
(All metrics are reported but the models are ranked by the metric you select for evaluation)
- Accuracy measures the goodness of a classification model as the proportion of true results to total cases. Accuracy =(TP + TN) / (TP + TN + FP + FN)
- Precision is the proportion of true results over all positive results. Precision =TP / (TP + FP)
- Recall is the fraction of all correct results returned by the model. Recall =TP / (TP + TN)
- F-score is computed as the weighted average of precision and recall between 0 and 1, where the ideal F-score value is 1. F1 =2TP / (2TP + FP + FN)
- AUC measures the area under the curve plotted with true positives on the y axis and false positives on the x axis. This metric is useful because it provides a single number that lets you compare models of different types.
As you can see, the Two-class decision forest Algorithm have an Accuracy , Precision ,Recall and F1 Score near the value equal to 1, so i suppose that my model is good described, GREAT !!!
For more details about Evaluate Model please visit the following LINK
Predictive Experiment:
It's time to move our attention on the predictive functionality of the machine learning.
The Training experiment will be convert to a predictive experiment, this feature allows to integrate in others applications the opportunity to use your model and based on your model have a Prediction.
For do that, has been created a new one Experiment, the data source has been the SQL Azure but this time the table used has been a new one. I tried to classify data based on telemetry values.
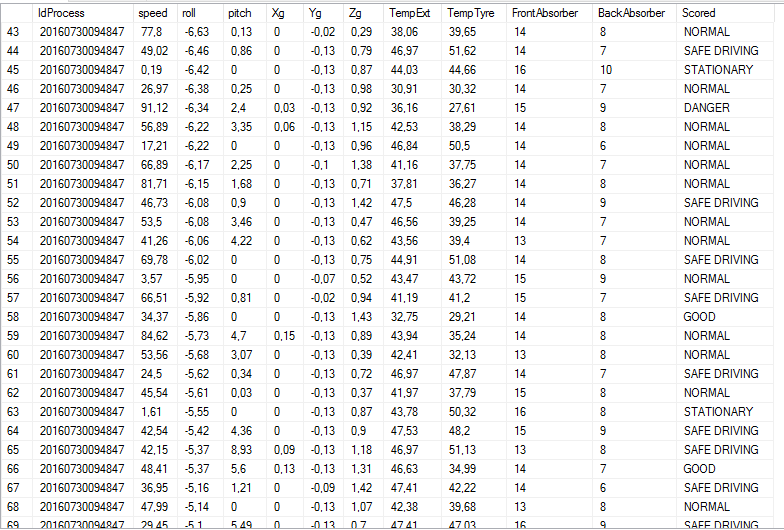
Now my data look like this and as you can see there is a new column named Scored that represents my classification:
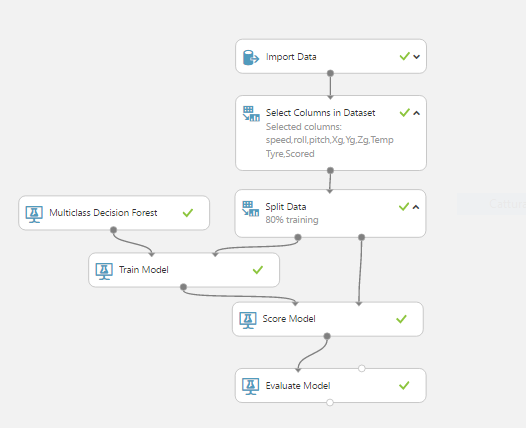
Create the experiment like below, select the Train Model and add a Multiclass algorithm:
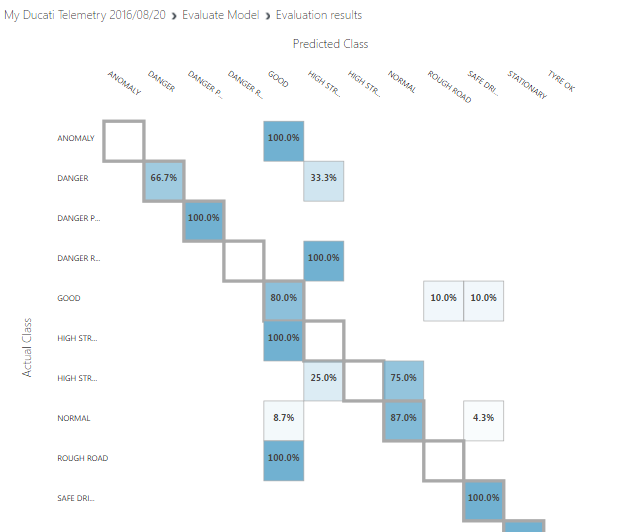
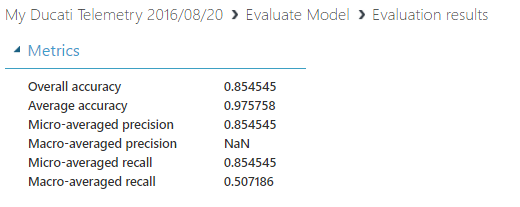
- RUN the experiment and see the results:
- Select the Train Model and click on SET UP WEB SERVICE => Predictive Web Service
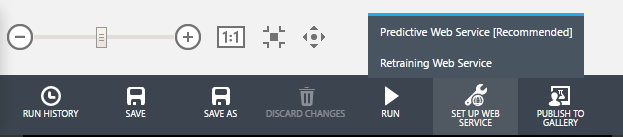
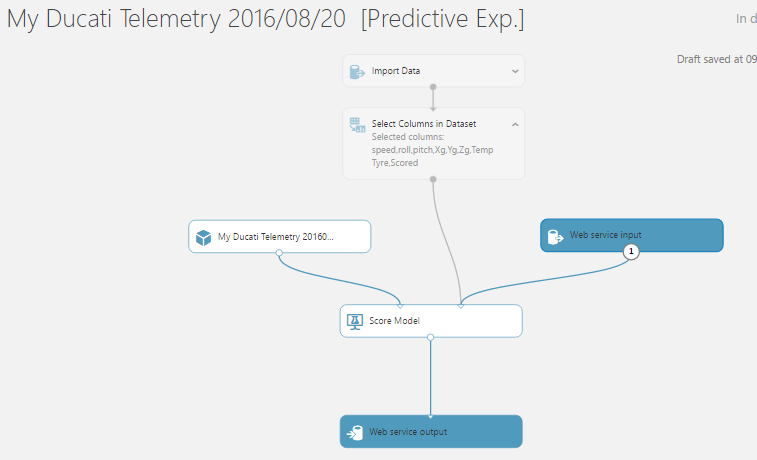
- Wait some seconds and your predictive service will be ready. Below you can see my Predictive Experiment layout:
- Run this model and then deploy the web service by clicking on the DEPLOY WEB SERVICE 按钮

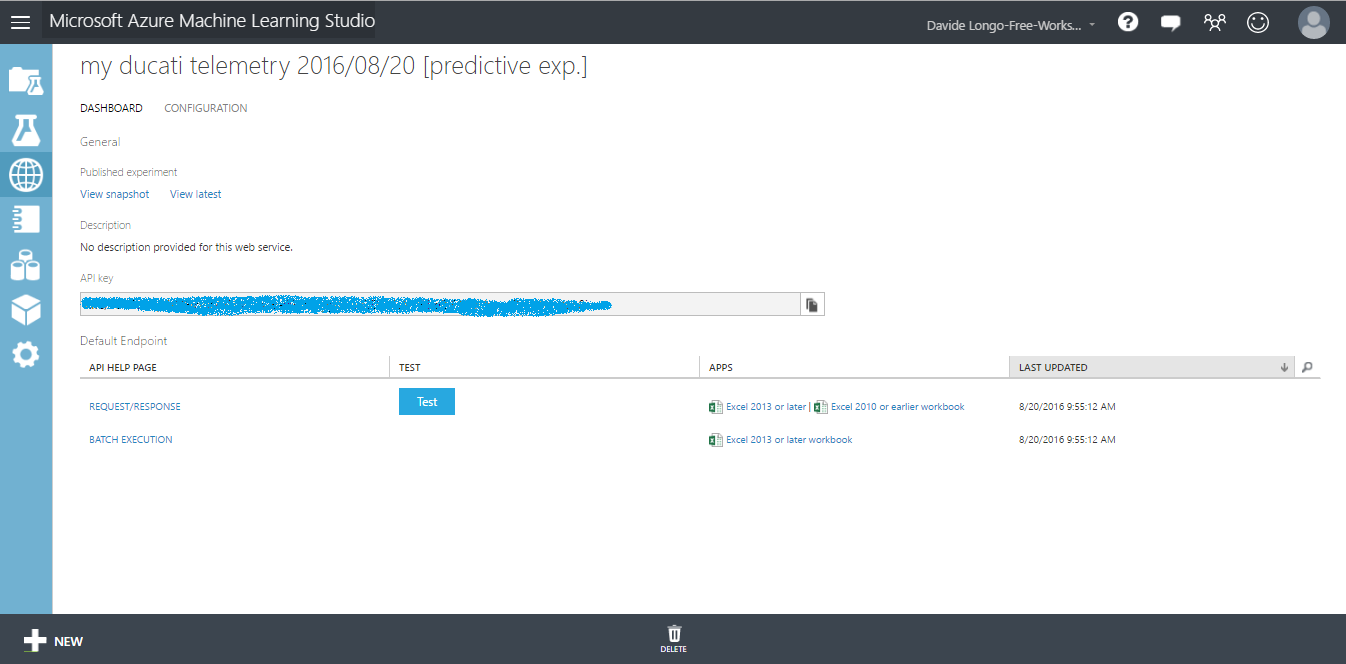
- Your service will be immediately ready to be used and a dashboard will appear, contain a "TEST" button where you can manually enter data and test your service
- Click TEST button and compile all fields, use some fake values and see the Predictive result:
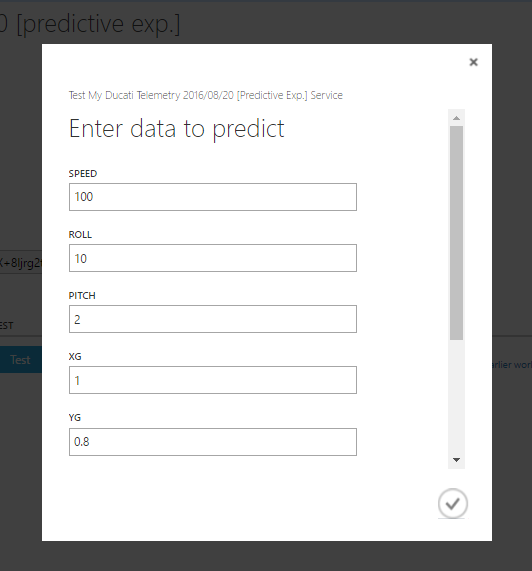

As you can see the result is equal to "SAFE DRIVING ", this mean that my Predictive service has predicted that my driving style is Safe and no action is needed.
If the Result has been for example "HIGH STRESS HIGH SPEED " that means that I have to reduce speed!
Conclusions about ML:
in this section we understand some things.
- How configure an experiment in ML azure environment
- we found that Two-class decision forest Algorithm well describe my motor bike telemetry and we train the ML for the predictive experiment using the Multiclass decision forest Algorithm
- How to convert our Model in a Web Service creating a predictive experiment
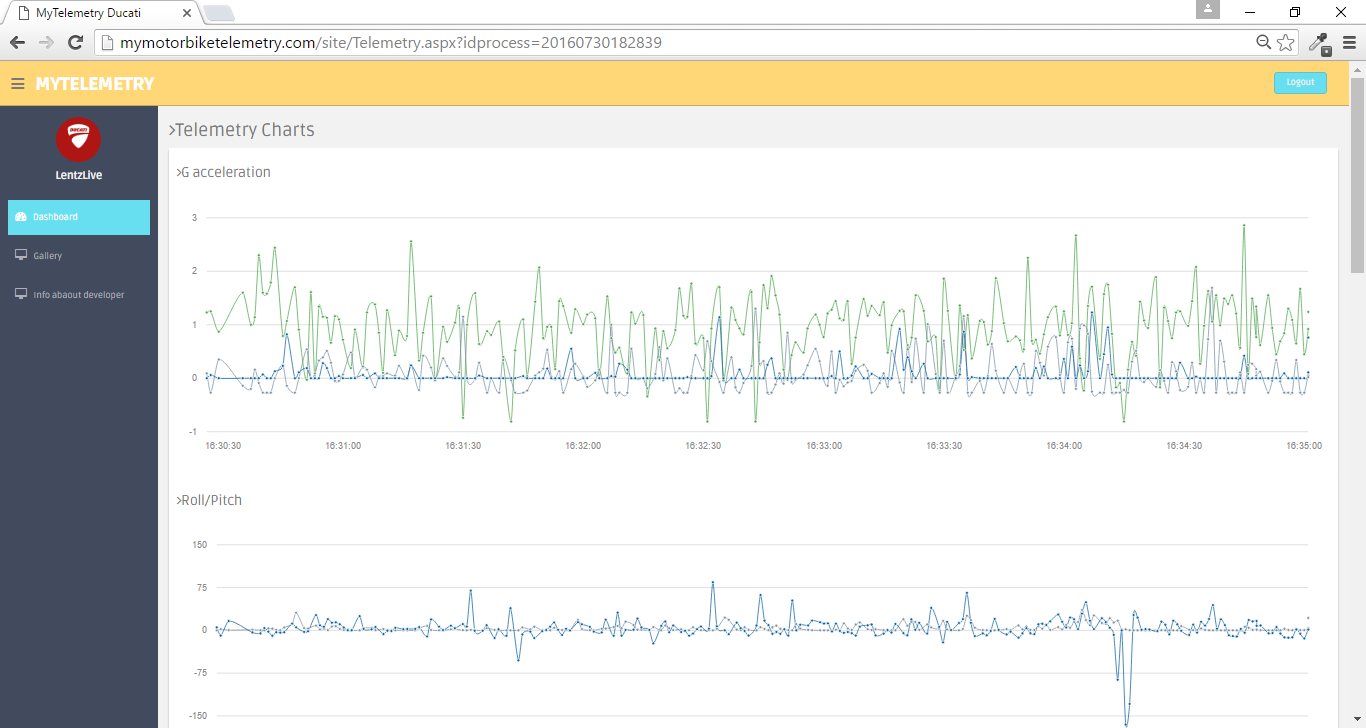
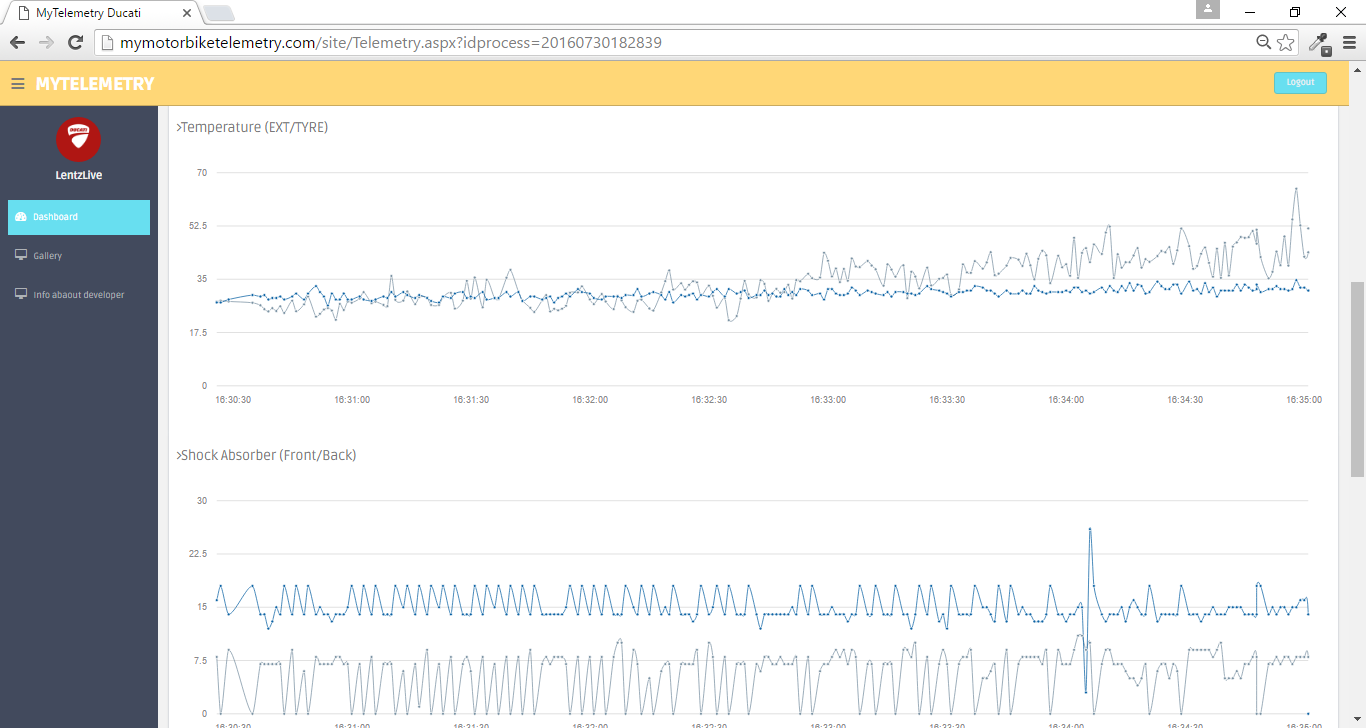
- we found some usefull information about my style of guide. Infact as you can see from the below graphs:
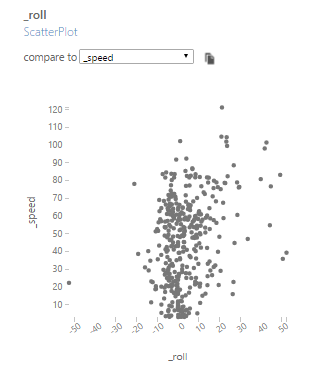
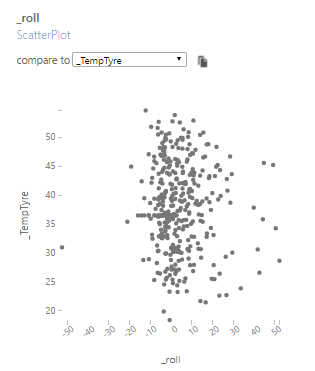
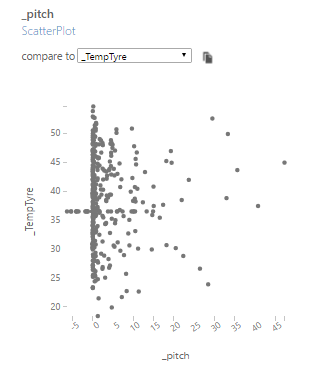
I prefer lean on the right and my lean angle doesn't depend for tyre temperature and from the speed. That mean that my tyres are high quality and in add I undestood that my motorbike prefers Wheelie when the tyre temperature is more than 35°C
Final Conclusions
In this project we covered many technological areas.
We discovered How is possible to create a funny Hardware using an Arduino and some sensor spending less then 60$ and using many services provided by microsoft.
We learned how is easy use Azure and how is interesting use Machine Learning Studio suite.
Has been realized a prototype that certainly needs improvements but i think is a good starting point for future developments from each people enthusiast about C#, Azure, Arduino and MotorBike.
Possible future Developments
To Improve this prototype i think will be usefull implements some things:
- About the mobile app (UWP), in case that no 3G/4G network is available, the data are lost because i'm not able to send the data to azure. Would be usefull develop a buffering logic that in case of "no networking" available, stored the data and send them at a later time.
- Create an APP for mobile platform using Xamarin, would be cool have an app who can run in Android OS and iOS also.
- Use more precise sensors and increase performance/accuracy.
- Make the central unit smaller, maybe using an Arduino MKR1000 .
- Create a social media Webapp to share your motorbike travel and telemetries in order to suggest to biker users what is the dangerous curves and increase the safety.
- Modify the source of the Machine Learning using the Steam Analytics. In my case i prefered use a sql AZURE datasource because it was not possible ride the bike and develop the ML in the same time :)
New branch work flow:
- The new branch consists to sending back to device, through IoTHub , the information about the ML predictive service.
- When the speed value is greater than 100 km/h a new one stream analyticsJob will send the telemetry data to Event Hub.
- A cloud service reads this data from EventHub and send a request to the ML predictive service in order to have a score about the Driving Style .
- The Cloud Service will send back the score to IoTHub , and IoTHub will send it to the device back (Windows Phone in this case)
... and now ENJOY !! :-) feel free to contact me for any questions and tips.
代码
UWP App C# Code
https://github.com/lentzlive/MotorbikeArduinoARDUINO CODE - Bike Telemetry
https://github.com/lentzlive/BikeTelemetryArduino示意图
circuit diagrams of the Telemetry system. On board scheda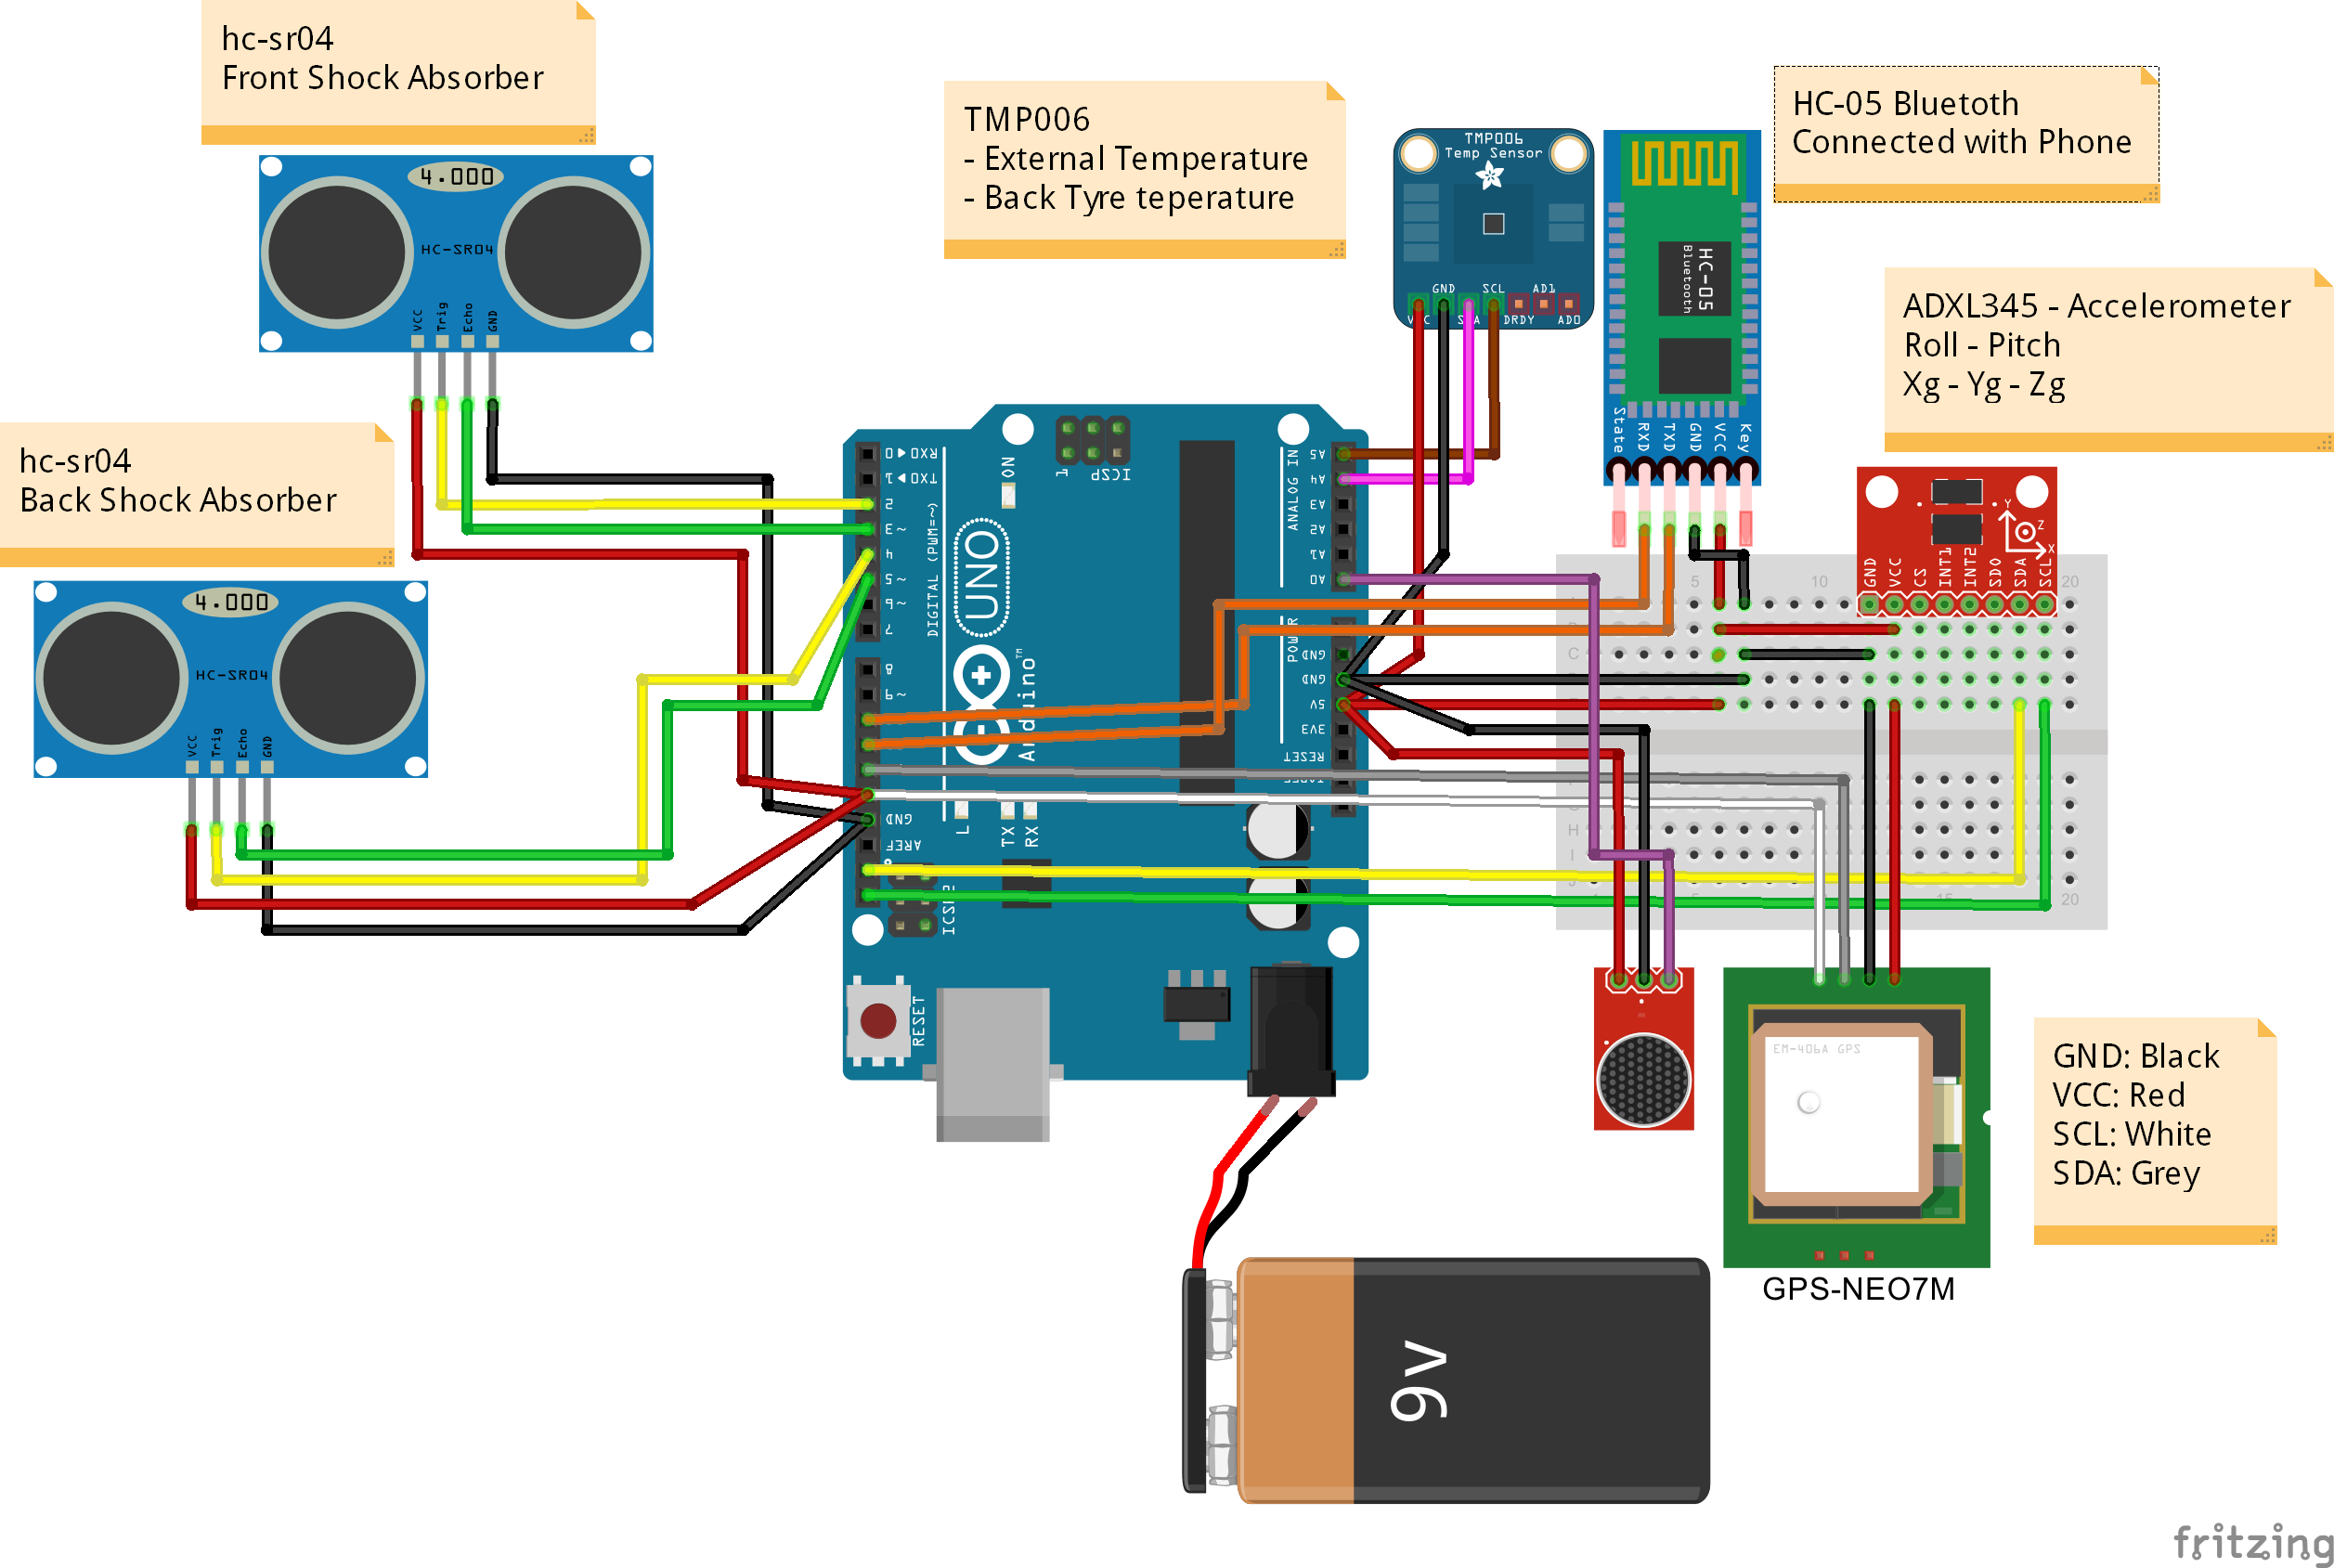 MotorbikeProject.fzz
制造工艺