

聚苯乙烯与掺杂十二烷基硫酸的聚苯胺的新型纳米复合材料
摘要
这项工作的重点是合成和研究聚苯乙烯 (PS) 与掺杂聚苯胺 (PANI) 的新型核壳纳米复合材料。通过苯乙烯在水介质中的微乳液聚合制备含有尺寸为 15-30 nm 的 PS 纳米粒子的胶乳。 PS/PANI 纳米复合材料是通过苯胺在 PS 胶乳介质中在十二烷基硫酸 (LSA) 存在下进行化学氧化聚合合成的,月桂基硫酸 (LSA) 作为掺杂剂和增塑剂。合成的纳米复合材料中PANI的真实含量通过UV-Vis光谱法测定。通过FTIR光谱表征纳米复合材料的组成和掺杂聚苯胺的氧化态。通过透射和扫描电子显微镜证实了纳米复合纳米粒子的核壳形貌。发现这些纳米复合材料在空气中的电导率和热行为不仅非线性地取决于掺杂的聚苯胺含量,而且还受到酸掺杂剂的增塑性能和聚苯胺壳的存在的强烈影响。已经证明了这些纳米复合材料作为传感器材料的应用可能性。
背景
众所周知,聚苯胺(PANI)具有一套独特的理化性质、稳定性高、价格低廉等特点,使其在微电子、光电子、传感器和电致变色器件等不同高科技领域具有多功能应用、电池和超级电容器等 [1, 2]。如果将 PANI 用于具有可溶或可熔普通聚合物的复合材料或纳米复合材料,可以很容易地制成各种制品 [3]。在制备此类材料的各种方法中,苯胺在含有纳米粒子或其他聚合物(用不同表面活性剂或非离子聚合物稳定)的(亚)微米级粒子的水基酸化胶乳或分散体中的氧化聚合被认为是一种最有效的方法 [3]。这种方法可以获得核壳型的多功能复合材料或纳米复合材料,其中核是聚合物(纳米)颗粒,壳由 PANI 形成 [3,4,5,6,7,8,9,10]。为了促进核壳形态的形成,苯胺以其盐的形式聚合,由于苯胺与添加的酸掺杂剂(通常为 HCl(例如,[8, 10]))相互作用,或作为商业苯胺盐酸盐(例如,[4, 7])。在许多情况下,非离子或离子稳定添加剂(更常见的是十二烷基硫酸钠/十二烷基硫酸钠 (SDS/SLS) [3,4,5,6,7,8,9, 10])。然而,已经开发出一种替代方法来制备此类材料。该方法使用表面活性酸(例如,十二烷基苯磺酸--DBSA)统一了表面活性剂、增塑剂和酸掺杂剂的特性,因此可以避免使用上述额外的 HCl 或其他酸掺杂剂 [11, 12]。
在不同的有机或无机宏观(玻璃或石英、聚合物薄膜、纤维等)和微观(聚苯乙烯乳胶、二氧化硅或二氧化钛、或聚合物颗粒等)基材的表面上形成 PANI 层或壳的机制方面(模板)已在许多出版物中讨论,主要是在表面带正电荷的苯胺阳离子的原位吸附聚合,通常带有预吸附/接枝阴离子/官能团的负电荷 [13,14,15,16,17] .人们普遍认为吸附的苯胺阳离子在加入氧化剂引发剂后立即聚合。自然地,未吸附的苯胺阳离子也参与聚合过程,形成带正电荷的低聚和聚合分子,在同一表面沉淀/吸附,从而导致聚苯胺壳厚度增加。
在另一种方法中,首先将苯胺单体添加到聚苯乙烯 (PS) 胶乳中,并以中性形式被 PS 核心颗粒吸收 3 天 [9]。添加氧化剂引发剂(过硫酸铵,APS)后,导电聚苯胺膜在颗粒界面形成并分离两种试剂。电子通过聚苯胺膜从苯胺分子转移到氧化剂分子,因此,聚苯胺逐渐渗透到 PS 乳胶颗粒内部,这与上述用聚苯胺涂覆乳胶颗粒时获得的核壳形态形成对比 [9]。在该方法的另一个变体中,在用中性苯胺单体溶胀 PS 颗粒 12 小时后,将 APS 和盐酸加入反应介质 [18]。添加 HCl 导致从颗粒释放的苯胺分子转化为苯胺阳离子,而苯胺阳离子又通过 APS 的化学氧化聚合。在这种情况下,所形成的 PS/PANI 复合材料具有清晰的核壳结构 [18]。
PS由于其良好的热稳定性和化学稳定性、机械特性、生物相容性等,经常用作核心聚合物组分[19],而且可能是因为它便于合成形状良好的纳米/亚微米/微米-尺寸的颗粒非常适合具有特定应用的(纳米)复合材料。例如,在静电加速器中使用了涂有掺杂 PANI 的微米/亚微米尺寸的 PS 粒子,这允许将带电粒子加速到超高速 [20] 或电流变流体 [21] 等。 类似于其他核壳(纳米)复合材料 [22] PS/PANI 显然具有传感应用的潜力。然而,据我们所知,缺乏使用 PS/PANI 核壳(纳米)复合材料作为传感材料的信息。然而,最近表明,将溶解在甲苯中的 PS 与掺杂有樟脑磺酸的 PANI 颗粒混合会产生分散体,适用于形成对氨敏感的复合膜 [23]。有趣的是,虽然这些混合物对气态氨表现出相当高的响应,即 (ΔR /R 0)×在20ppm的100〜73%,其以较高浓度的氨的反应并不十分不同并且是仅达〜90%在100ppm(图11 [23])。这种弱响应浓度行为表明,由于这些混合物的溶液制备,只有一部分敏感的 PANI 簇很容易被分析物分子接触,而其他部分则被 PS 基质屏蔽,这对传感材料造成了一些扩散限制。因此,可以推断出,与溶液制备的共混材料相比,具有未屏蔽PANI表面的PS/PANI核壳复合材料具有更好的传感性能[23]。
基于上述讨论,我们的工作主要集中在合成带有聚十二烷基硫酸 (LSA) 的聚苯胺 (PSA) 纳米粒子的新型核壳纳米复合材料,并研究它们的实际重要性质(形态、化学结构、导电性、热稳定性) .还估计了它们作为传感材料的潜在适用性。 LSA 的选择是纳米复合材料的重要特征,主要基于三个先决条件:(1) 在核心 PS 纳米颗粒合成阶段使用的表面活性剂 SLS 和酸掺杂剂中具有相同的月桂基硫酸盐表面活性阴离子LSA 在 PANI 壳合成阶段使用,(2) 它可以作为表面活性官能化质子酸掺杂剂,酸化反应介质 [24, 25],和 (3) 它形成苯胺盐(即表面活性反应单体或冲浪者)促进纳米级 PANI 壳和结构的形成 [25, 26]。
方法
材料
苯胺(默克)和苯乙烯(试剂级,乌克兰)在真空下蒸馏,并在 3-5°C 的氩气下储存。氧化剂过硫酸钾 (KPS)(乌克兰)、阴离子表面活性剂十二烷基硫酸钠(SLS,同义词十二烷基硫酸钠--SDS,Aldrich)均为试剂级,无需进一步纯化即可使用。由SLS与KU-2-8树脂(乌克兰)通过离子交换反应制备月桂基硫酸(LSA)。
PS乳胶的制备
PS纳米颗粒胶乳是根据别处描述的方法通过苯乙烯自由基聚合制备的[27]。简而言之,苯乙烯在具有氧化剂引发剂 KPS 的 SLS 胶束水溶液中聚合如下:在 1.5 小时内将 2 克苯乙烯缓慢加入到剧烈搅拌的 0.01 克 NaH2PO4、0.2 克 SLS 和 0.01 g KPS 在 70°C 的 10 毫升水中,在氩气气氛中。将混合物在 70°C 下再搅拌 3 小时,然后在 90°C 下再搅拌 1 小时。将最终聚合混合物冷却至室温,并通过纤维素膜透析纯化,MWCO 3500 Da 对蒸馏水 48 小时。
PS/PANI-LSA 纳米粒子的制备
PS胶乳中的苯胺聚合类似于在别处[28, 29]中描述的方法在反应混合物组分的下一个比率下进行:苯胺/LSA =1/1.5 (mol/mol)和苯胺/氧化剂 =1/1.25 (mol/mol) 在 10°С。聚合混合物中苯胺与 PS 纳米颗粒的初始重量比由最终纳米复合材料中去掺杂聚苯胺的预期理论量预先确定,范围为 1-10 重量%。简而言之,在制备聚合混合物的第一阶段,将计算量的酸加入目标 PS 胶乳部分并在室温下搅拌 30 分钟。在第二阶段,将计算量的苯胺加入到这种酸化的 PS 胶乳中,然后搅拌 1 小时,使苯胺盐在室温下完全形成,然后将制备的混合物冷却至 10°C,保持 30 分钟。在第三阶段,将计算量的预冷至 10°C 的 KPS 在蒸馏水中的溶液逐滴加入反应混合物中,然后在 10°C 下搅拌 24 小时。苯胺聚合完成后,通过玻璃纸膜对蒸馏水透析 3 天来纯化获得的 PS/PANI-LSA 胶乳。将纯化的纳米复合材料在环境条件下干燥至目视干燥粉末状态,然后在 60°C 下真空干燥直至达到恒重。参考纯PANI-LSA样品在相同条件下在不含PS纳米颗粒的水溶液中合成。
特征化
合成的纳米复合材料中的实际 PANI 含量与 [29] 类似,在分光光度计 Cary 50 (Varian) 的帮助下,通过紫外-可见光谱分析它们在 N-甲基-2-吡咯烷酮 (NMP) 中的溶液。简而言之,在第一阶段,干燥的纳米复合材料通常在 0.3 wt% 的氨水溶液中脱掺杂 24 小时,然后用蒸馏水洗涤,然后在 60°C 下真空干燥,直到达到恒重。在第二阶段,将去掺杂的粉末纳米复合材料的固定部分溶解在 NMP 中,并与 NMP 中的抗坏血酸溶液混合以获得白绿宝石碱(LB,完全还原形式的 PANI)。在第三阶段,使用先前准备的校准曲线,根据该溶液在 1 毫米石英比色皿中在 343 纳米的紫外吸收来计算 LB 浓度。在第四阶段,然后针对纳米复合材料中实际去掺杂的 PANI 含量重新计算该 LB 浓度。然后使用后者的含量来估计该 PS/PANI-LSA 纳米复合材料中掺杂的 PANI-LSA 含量。最终的重新计算基于 PANI 中 LSA 和亚胺氮的理论化学计量比,即 PANI:LSA =1:0.5,类似于 [28, 29]。与 [28] 一致,为了重新计算的简单性和清晰性,我们假设仅使用 LSA 进行完整的 PANI 掺杂。合成的纳米复合材料的组成及其符号见表1。
以 1 cm -1 的分辨率记录 PS/PANI-LSA 纳米复合材料和纯 PANI-LSA 样品在 KBr 颗粒中的傅里叶变换红外 (FTIR) 光谱 使用布鲁克 Vertex 70 光谱仪。
透射和扫描电子显微镜(TEM 和 SEM)图像分别使用 JEOL JEM-1400 和 Hitachi S4800 显微镜获得。用于 TEM 测量的样品的制备方法是将 2 μL 样品水分散体置于碳或 Formvar 涂层的 200 目铜网格上 15 分钟,然后用滤纸小心去除分散体。用于 SEM 测量的样品是通过将 5 μl 的纯 PS 或纳米复合材料的透析水分散体滴到玻璃板上来制备的。干燥的样品溅射涂有薄(~ 7 nm)金层。
当使用 MOM Q-1500 D (Paulik-Paulik-Erdey) Derivatograph 系统以 10 °C/min 的加热速率对空气中的样品进行热重分析 (TGA) 来研究合成材料的热稳定性。
为了表征合成纳米复合材料的导电性能,将它们的粉末通过压缩成型技术在 240°C 和 5 MPa(使用 SPECAC 压机)下加工成薄膜 2 分钟,然后将其 3% 的分散体在玻璃板上浇铸超声波处理。
为了评估合成的 PS/PANI-LSA 纳米复合材料作为对有害气体敏感的材料的适用性,我们使用了导电性最强的纳米复合材料 NC15,并将其性能与在相同条件下合成的纯 PANI-LSA 进行了比较。氨浓度在 19-152 ppm 范围内的氨-空气混合物用作分析物。如下制备敏感元件。 1 μL 体积的超声处理的纳米复合材料在溶剂中的分散体 (2% w /v ) 滴铸在玻璃陶瓷基板上形成的金叉指电极的微型系统上。形成的传感元件在 60°C 下干燥 30 分钟,然后安装到别处 [30] 所述的密闭测试室中。制备好的氨-空气混合物通过注射器注入该室。这些元件的传感器响应 (SR) 在环境温度和 50% 左右的相对湿度下记录,并确定为电阻 R 的相对变化 根据方程 SR =[(R -R 0)/R 0] × 100%,其中 R 是样品电阻,R 0为初始电阻值。
结果与讨论
合成的 PS/PANI-LSA 纳米复合材料的形貌
从 TEM 图像(图 1a)可以看出,所使用的合成方法允许合成 15-30 nm 范围内非常小的球形 PS 纳米粒子。据我们所知,这些 PS 纳米粒子属于最低的 PS 纳米粒子。
<图片>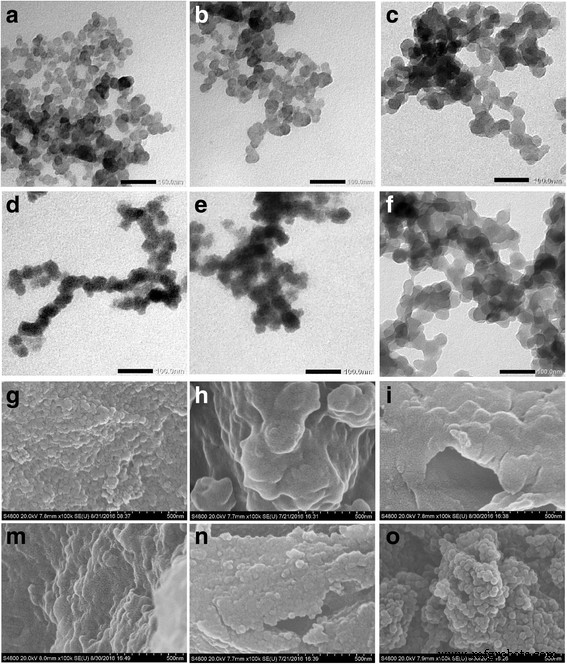
透射电镜 (a –f ) 和 SEM (g –o ) 纯 PS 和 PS/PANI-LSA 纳米复合材料的图像:a , g - 纯PS; b , h - NC2; c , i - NC3; d , 米 - NC6; e , n - NC11 和 f , o - NC15
聚合后分离的 PS/PANI-LSA 纳米粒子的 TEM 图像显示它们的尺寸随着 PANI-LSA 含量而增加(图 1b-f)。这种效应表明这些纳米粒子的核壳形态具有 PS 纳米粒子的核和 PANI-LSA 的壳。然而,尽管尺寸增加,但在纳米复合材料(NC2、NC3、NC6)中 PANI-LSA 含量低的情况下,很难在视觉上区分薄的 PANI-LSA 壳(图 1b-d)。这个问题可能可以用两种组件的聚合物性质和这些壳的松散结构来解释。反过来,后者可能是由于掺杂阴离子的大尺寸阻碍了紧凑的 PANI-LSA 壳的形成。然而,在NC11中,尤其是NC15中PANI-LSA含量较高时,可以区分出不规则的壳(图1e,f)。
尽管纳米复合颗粒的尺寸分布相当宽(图 1b-f),但我们可以粗略估计它们的壳厚度。特别是,虽然具有最低 PANI-LSA 含量的 NC2(表 1)包含大小约为 15 nm 的纳米粒子,类似于母体 PS 的纳米粒子,但可以在 TEM 图像(图 1b)中找到大小高达 40 nm 的纳米粒子这可能表明其表面存在厚度高达 10 纳米的 PANI-LSA 壳。
在 NC3 的情况下,未观察到 15 nm 纳米粒子,但壳厚度高达 10 nm 的 30-40 nm 纳米粒子的数量显着增加(图 1c)。这种趋势在 NC6 纳米颗粒中得到增强(图 1d)。 NC11 的 TEM 图像,尤其是 NC15 的 TEM 图像显示纳米粒子的尺寸增加,范围在 25-50 nm 左右(图 1e、f)。一些不规则形状的斑点的存在表明由于 PANI-LSA 的含量较高,因此在这些纳米复合材料中出现了单独的 PANI-LSA 相。此外,NC15 图像可以清楚地区分厚度为 10-20 nm 的不规则 PANI 壳。
在清洁和制备用于 SEM 成像的母体 PS 胶乳(参见“表征”部分)后,PS 纳米粒子形成尺寸在 30-150 nm 或更大范围内的团聚体,其中可能包含 2-5 个或更多个初始纳米粒子(图 1)。 1 克)。在存在表面活性 LSA 的情况下,胶乳介质中的苯胺聚合改变了情况(图 1 h-o)。因此,在最低的 PANI-LSA 含量(1.84 重量%)下,人们可以在 NC2 图像中看到大小约为 400-500 纳米的大型不规则实体,它们具有非常光滑的表面(图 1h)。在 NC3 的 PANI-LSA 含量增加 (3.01 wt%) 的情况下,实体倾向于减小约 100-300 nm 范围内的尺寸。在 NC6 中 PANI-LSA 含量较高(5.85 重量%)时,这种趋势得到强烈增强。特别是,它的 SEM 图像不仅显示了少数尺寸高达 150 nm 的实体,而且还显示了尺寸在 40-100 nm 范围内的不规则团聚体(图 1m)。 NC11 和 NC15 的 SEM 图像(图 1n,o)证明了样品形态的进一步发展,即由于最高 PANI-LSA 含量分别为 11.27 和 14.82 wt%,这些纳米复合材料的定性和定量变化。具体来说,可以在平坦的 NC11 样品表面上看到非常密集的团块,其尺寸主要在约 25-50 nm 范围内,而在 NC15 样品的情况下,可以很好地区分 25-50 nm 团块排列在“葡萄串”中观察形态(图1n,o)。这种形貌表明NC15比其他纳米复合材料具有更高的比表面积。
一般而言,TEM 和 SEM 测量表明,尽管清洁后的纯 PS 纳米粒子倾向于团聚,但纳米复合材料 NC2 和 NC3 中低含量的 PANI-LSA 抑制了这种团聚。这种效应可以归因于电荷补偿大 LS¯ 阴离子的表面活性,这些阴离子位于 PS 核上带正电的 PANI 壳周围,因此分离纳米颗粒。然而,在中等(NC6),尤其是在高(NC11 和 NC15)PANI-LSA 含量时,情况相反,这显然有助于在 PS 核周围形成相当厚的 PANI-LSA 壳。结果,电荷补偿数 LS ¯ 与 NC2 和 NC3 情况相比,带正电的 PANI 壳周围和内部的阴离子变得更高。不可避免地,这些具有长十二烷基尾巴的两亲阴离子可以增强系统中存在的分子间相互作用。这些相互作用可能比NC2和NC3中的上述趋势更强,进而导致观察到的NC6、NC11和NC15纳米颗粒的团聚。
FTIR 测量
合成聚合物的结构通过其 FTIR 光谱表征。特别是,如图 2 所示,PS 的 FTIR 光谱包含五个芳香族 C-H 伸缩振动的特征峰,最大峰位于 3025 cm -1 [31]。亚甲基的 C-H 伸缩振动峰出现在 2920 和 2850 cm -1 .在 1601、1583、1492 和 1452 cm -1 处观察到四个芳香族 C=C 伸缩振动带 . 756 和 697 cm −1 处的强波段 可以分别分配给 CH 平面外振动和环平面外变形,[31]。这些谱带证实了单取代的芳族基团的存在。
<图片>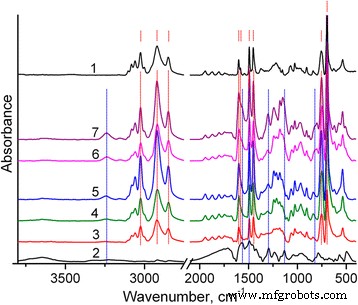
PS (1)、PANI (2) 和 PS/PANI-LSA 复合材料的 FTIR 光谱:NC3 (3)、NC3 (4)、NC3.5 (5)、NC11 (6)、NC15 (7)。 PS和PANI-LSA的主要特征峰用红色虚线标记 和蓝线 , 分别。所有标记对应于文中讨论的频率
反过来,PANI-LSA 的 FTIR 光谱与公布的数据非常吻合 [32,33,34]。它包含 1565、1492、1294、1133 和 818 cm −1 的典型波段 分配给醌环的伸缩振动,苯环,仲芳胺中的C-N伸缩,B-NH + 的振动模式 =问 结构,分别为 1.4 环的 C-H 面外弯曲。一些特征,例如在 3l00–3500 cm −1 区域内非常弱的 NH 伸缩振动 , 表明 PANI 处于掺杂状态。然而,B–NH + =问 1133 cm −1 处的波段强度 很弱,表明该 PANI-LSA [34] 的掺杂水平很低。
大约 1180 cm −1 处的明显带 (图 2 和 3b,曲线 1)源自 S=O 伸缩振动 [31] 表明合成的 PS 纳米粒子含有月桂基硫酸根阴离子,这显然是由于 PS 纳米粒子的合成条件而存在的(参见方法部分)。此外,在最终的 PS/PANI-LSA 复合材料中明显观察到过量的这些阴离子。因此,从图 3a(曲线 2)可以看出,PANI-LSA 的芳环和亚甲基的 C-H 伸缩振动非常弱。因此,由于从 NC15 中减去 PS 光谱(在 3025 cm -1 )(图 3a,曲线 4),显然可以归为单独的 SLS 相。
<图片>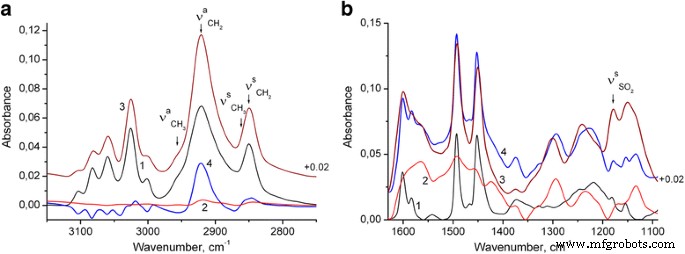
PS 纳米粒子 (1)、PANI-LSA (2) 和 NC15 (3) 的 FTIR 光谱:a 光谱 4 是从 NC15 中减去归一化 PS 光谱的结果,b 光谱 4 是 PS 光谱的总和(归一化为 3025 cm −1 处 NC15 的带高 ),以及 PANI-LSA 光谱(归一化为 1560 cm −1 处 NC15 的带高) )
为了评估纳米复合材料中 PANI 的状态,我们将 NC15 的光谱与模型光谱进行了比较(图 3b,相应的曲线 3 和 4)。最后是 PS 和 PANI-LSA 频谱贡献的总和。特别地,PS 贡献是归一化到 3025 cm −1 NC15 带高的 PS 光谱 (其中 PANI-LSA 吸收非常弱),PANI 贡献是归一化到 1560 cm -1 NC15 带高的 PANI 光谱 (其中不存在 PS 吸收)。已知掺杂的 PANI 带在大约 1580 和 1490 cm -1 分别来自醌型和苯型环的主要贡献,[32,33,34]。这些波段的强度比对 PANI 的化学结构敏感,因此,与模型光谱相比,NC15 光谱中醌型环在苯系单元上的优势证明了 PANI-LSA 相在纳米复合材料高于纯PANI。还可以看到芳香族 C=C 的 PS 谱带在 1601 和 1583 cm −1 在 NC15 光谱中变宽并略微移动到较低的波长。这种转变可能表明 PANI 和 PS 之间存在 π-π 相互作用。 1133 cm −1 处 NC15 波段的强度 明显高于模型光谱,表明与纯PANI相比,该纳米复合材料中PANI相的电导率更高。
热稳定性
最近,已经证明聚碳酸酯 (PC) 的微米级颗粒核壳聚合物-聚合物复合材料具有相当低的 PANI 含量(~ 2 wt% 的 PANI 碱或 3.5-5.0 wt% 如果掺杂不同的芳族磺酸-掺杂剂),掺杂剂的存在强烈影响它们的热稳定性 [35]。根据掺杂剂芳环中的烷基取代基,与纯 PC 相比,由于增塑大掺杂剂阴离子和/或具有 PC 链的热释放掺杂剂分子 [35]。但是在 500°C 以上的温度下,壳中的 PANI 通常处于去掺杂(基础)状态,复合材料的稳定性高于 PC。这种效应归因于作为核壳复合材料中核材料表面壳层的 PANI 的特定状态,以及 PC 核颗粒可能被 PANI 壳层稳定化 [35, 36]。基于这种可能性和纳米复合材料的形态,我们认为不同的聚合物-PANI 核-壳纳米复合材料也可以发生 PANI 壳稳定作用。该建议与图 4 所示合成的 PS 纳米粒子和纳米复合材料的热行为非常吻合。
<图片>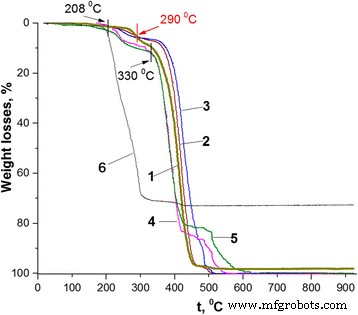
不同PANI-LSA含量(wt%)的PS/PANI-LSA纳米复合材料的热重曲线:1 附注,2 1.84 (NC2),3 3.01 (NC3),4 11.27 (NC11),5 14.82 (NC15),6 SLS
事实上,合成的 PS 纳米粒子表现出的热稳定性在某种程度上与本体 PS 的热稳定性不同(比较图 4 中的曲线 1 和 [37] 中的图 1)。特别是,虽然后者主要在 200 至 450°C 的单个步骤中降解 [37],但前者的热重 (TG) 曲线大致显示三个阶段:从开始到262°C,第二个在 262-330°C 的范围内,第三个在 330-505°C 的范围内。这种差异可能是由于 PS 纳米颗粒合成的特异性导致其组成中不可避免地存在 SLS 杂质,这反过来又改变了 PS 的热行为。该建议与 SLS 的最终降解温度非常接近 PS 纳米颗粒降解的第三(主要)阶段的开始(330°C)这一事实非常吻合(图 4,曲线 1 和 6)。
如图 4 所示,纳米复合材料的 TG 曲线与 PS 的形状相似,而且在高达 120°C 的温度下表现出类似的小质量损失,这通常可以归因于水蒸发 [35] .在较高的温度下,可以看到低和高负载 PANI-LSA 的样品的热稳定性存在显着差异,这通常提供有关已知核壳 PANI 复合材料的热行为特异性的补充信息。特别是,PANI-LSA 含量≤ 11.27 wt% 的三种纳米复合材料(NC2、NC3 和 NC11)在高达 208°C 时表现出类似于 PS 的高热稳定性(图 4,表 2)。然而,即使在 120°C(图 4,曲线 1 和 5;表 2),具有最高 PANI-LSA 含量 (14.82 wt%) 的 NC15 也比 PS 不稳定,这可能还归因于不仅水分蒸发但也可能与未结合的掺杂剂和/或未反应的单体/低聚物杂质有关 [38]。
在 208-262°C 的温度范围内,所有纳米复合材料都表现出重量损失,这高于 LSA 含量,但明显低于 PS 的重量损失(图 4,曲线 1、4 和 5,表 2)。然而,在 NC2 和 NC3 的情况下,这些损失甚至高于 PANI-LSA 的含量。基于 PANI 基 [39] 的高热稳定性和 PS 纳米粒子的热行为(图 4,曲线 1),我们可能将纳米复合材料的损失不仅归因于掺杂剂的蒸发和降解,而且归因于PS组件。此外,虽然 NC2 和 NC3 在 262°C 下的重量损失(表 2)超过了它们的 LSA 含量和 PS 损失的总和(分别为 3.02 和 3.7),但人们可以假设 PS 核心成分的热氧化降解有所增强。纳米复合材料可能是掺杂剂降解产物引起的。
尽管纳米复合材料的损耗通常在较高温度下会增加,但在 290°C 时,NC2 和 NC3 的 TG 曲线(与 NC11 和 NC15 的那些不同)与 PS 的 TG 曲线相交于 5.58 wt%(图 4,表 2) .通常,这种行为表明掺杂剂完全丧失 [35, 37, 38] 和去掺杂 PANI 中 PANI-LSA 成分的转变。 Above this, temperature NC2 and NC3 are more stable than PS up to the end of the heating process (Fig. 4, curves 1–3). As a consequence, the position of the TG trace of PS nanoparticles along the temperature axis in the range of 262–430 °C roughly separates positions of the nanocomposites with low and high contents of PANI-LSA (Fig. 4). This fact confirms a difference which is probably inherent to these two sets of nanocomposites.
Indeed, one can see strongly different course of the thermal degradation of these nanocomposites both in the range of 262–430 °C and above 430 °C. Whereas all these nanocomposites have the core-shell morphology, it is unlikely that only this morphological factor can explain their specific thermal behavior. However, if to take into account the presence in their composition of the LSA dopant, which contains the long dodecyl tail with plasticizing ability [3], we can at least partially understand such difference as a result of intermolecular interactions (causing a plasticizing effect [40]) of the dopant anion with the polymer components of the nanocomposites. Naturally, in the case of low or high contents of the PANI-LSA component, its influence on thermal behavior of the nanocomposites will be less (NC2, NC3) or more (NC11, NC15) significant. In the latter case, the plasticization effect is so strong that the thermogramms of NC11 and NC15 (Fig. 4, TG curves 4 and 5) take positions below the PS one up to 430 °C even after a complete removal of the dopant (above ~ 290 °C) because of weakened interactions between PS macromolecules. Slowing down the degradation rate of the nanocomposites with high content of PANI base at temperatures above 430 °C can be probably explained by cross-linking of its chains [39] and possible enhancement of the stabilizing role of the PANI shell.
In the case of NC2 and NC3, the situation is obviously opposite to NC11 and NC15. In particular, contents of PANI-LSA are quite small, and therefore, quantities of the plasticizing dopant LSA are not enough to significantly weaken interactions between PS macromolecules. As a consequence, once the dopant is eliminated completely, the nanocomposites display thermostability which is higher than that of PS nanoparticles (Fig. 4, curves 2 and 3, intersection point at 290 °C). In spite of the low content of PANI-LSA and, therefore, of its thin shell, these NC2 and NC3 behaviors match well with the suggestion about stabilizing effect of the PANI base shell.
Conductivity and sensing properties of the synthesized nanocomposites
One of most important features of polymer-polymer composites, in particular of PANI-containing composites, is probably their ability to withstand conditions of common treatments, which are typically applied to produce different articles. Therefore, a lot of studies have been performed to estimate changes in properties of these materials after treatments by melting or solution techniques [3, 38, 39]. Based on these studies and the thermally induced weight losses of the synthesized nanocomposites (Table 2, Fig. 4), one might expect that such important property of doped PANI as conductivity could be changed under these treatments. Indeed, as one can see from Fig. 5, the values of conductivity of the cast and compression molded PS/PANI-LSA films strongly differ. To quantify the difference, we treated these data (Fig. 5) by the scaling law based on the percolation theory [41] in accordance with the known methodology of processing the conductivity behavior of polyaniline networks in composites [42, 43]:
$$ \sigma ={\sigma}_{\mathrm{o}}{\left(f-{f}_c\right)}^t $$ (1)其中 σ o is the constant displaying conductivity of the PANI conducting phase, f is the volume fraction of PANI, f c is the percolation threshold, and t is the critical exponent. Volume fractions of PANI-LSA in the nanocomposites were calculated on the basis of densities of PS and PANI-LSA, i.e., 1.04 [44] and 1.18 g/cm 3 [45], respectively.

Dependencies of DC conductivity of the cast (1 ) and compression molded (2 ) PS/PANI-LSA nanocomposite films on the volume fraction of PANI-LSA
The power-law dependence was determined with various trial values of f c by applying a linear regression analysis to the plot of log σ versus log (f − f c )。 The solid lines represent best fits to the data with the correlation coefficients of 0.996 and 0.993 for the cast and compression molded nanocomposite films, respectively.
The observed nonlinear dependences (Fig. 5) are obviously the result of formation of the phase-separated conducting percolation network of PANI-LSA in the bulk of the nanocomposite films. It is interesting to note that the percolation thresholds are quite low (f c = 1.26%) and independent on the used processing techniques. This f c value is significantly lower than the theoretical model suggests for a random lattice of spheres (from 15 to 30% depending on the sphere diameter) [41]. However, the conductivity of the PANI conducting phase (σ o) in the cast nanocomposite films is more than two and a half times higher than that of the compression molded ones (2.3 × 10 −4 and 8.9 × 10 −5 S/cm, respectively). Obviously, the lower conductivity of the conducting phase in the compression molded film is caused by the partial thermal degradation of PANI-LSA under the melting treatment temperature (240 °C). The values of the critical exponent t for the cast and compression molded films are 1.14 and 2.62 accordingly. Such inequality in the critical exponent indicates a strong difference in the spatial structure of the percolation cluster, which results in the different slopes of the curves. As a consequence, the conductivities of the cast nanocomposite films are more than three orders of magnitude higher than those of the compression molded ones at low volume fractions (contents) of PANI-LSA (Fig. 5).
Nevertheless, despite the significant difference of the cast and compression molded films, one can deduce that the conductivity level is enough to apply the both materials for antistatic applications. On the other hand, the obtained conductivity values of the synthesized nanocomposites are significantly lower (by 2–3 orders of magnitude) than in the case of the similar core-shell submicron/micron-sized PS/PANI composites [4, 7, 9, 14]. To understand this difference and to improve the conductivity of these new PS/PANI-LSA nanocomposites, new studies are planned. However, one can suggest that non-optimal conditions of preparation of these new materials are at least partial explanation of this low conductivity level.
Based on better conductivity properties of the cast PS/PANI-LSA films and known high sensing ability of doped PANI [46], we estimated their potential as sensing materials to determine concentrations of ammonia in its gaseous mixtures with air. The measurements were performed on the example of the films of NC15 and pure PANI-LSA cast on electrodes of the transducer (see “Methods” chapter).
Both films demonstrate quite high sensitivity to ammonia in the range of 19–152 ppm (Fig. 6). However, while NC15 is more sensitive to ammonia than pure PANI-LSA in the concentration range of 19–114 ppm, at higher concentrations, the situation becomes opposite.

Sensor responses (calibration curves) of the cast pure PANI-LSA (1 ) and NC15 (2 ) films to different concentrations of ammonia in the mixtures with air
The better efficiency of NC15 in this narrowed ammonia concentration range can be probably assigned to core-shell morphology of the nanoparticles constituting the cast nanocomposite film. This morphology typically specifies higher surface of the film as compared with pure PANI-LSA and improves sensitivity of sensing materials [25, 28]. The enhancement of the sensing responses of pure PANI-LSA at ammonia concentrations above 114 ppm (Fig. 6, curve 2) can be probably assigned to additional involving in the sensing process of the PANI-LSA clusters located under the surface of the film. Naturally, the quantity of these clusters in the pure doped PANI film is much higher than in the case of the thin PANI-LSA shells on the core particles constituting the nanocomposite film. Therefore, their involvement in the sensing process inevitably increases sensor responses of the pure doped PANI film as compared with the NC15 one.
Conclusions
The new PS/PANI-LSA nanocomposites have been synthesized with the core-shell nanoparticle sizes ~ 25–50 nm, which to our knowledge are the lowest ones among the similar composites published elsewhere. The use of LSA as acidifying agent for the aniline containing PS latex medium and addition of the oxidant resulted in the precipitation of the thin PANI-LSA shell (~ 10–20 nm) on the surface of the PS nanoparticles (synthesized in the presence of SLS). As a consequence, both the shell and PS core contained the same lauryl sulfate surface active anion unlike the known core-shell PS/PANI composites synthesized with a PS latex surfactant-stabilizer and PANI dopant of different nature.
We have found that although the synthesized very small PS nanoparticles (15–30 nm) after cleaning tend to agglomerate in the dry state, the low contents of PANI-LSA in the nanocomposites suppress this agglomeration probably due to the surface activity of charge compensating large LS¯ anions which localize around positively charged PANI shells on PS cores and separate the nanoparticles. However, the situation becomes opposite at the moderate and especially at the high PANI-LSA contents, which apparently facilitate formation of quite thick PANI-LSA shells around PS cores. In this case, a number of charge compensating LS ¯ anions both around and inside of the positively charged PANI shells is higher as compared with the low contents of PANI-LSA in the nanocomposites. As a consequence, these amphiphylic anions with long dodecyl tails can enhance intermolecular interactions in the system and lead to the agglomeration of the nanoparticles with high contents of PANI-LSA.
A possibility of such agglomeration effects should be taken into account when using similar nanocomposites in applications which need charged nanoparticles [7, 20, 25]. We believe that applied in this work method of determination of the real PANI content in the PS/PANI nanocomposites can allow better control of their properties.
Based on FTIR and conductivity studies of the synthesized nanocomposites, we proved that oxidation state and conductivity of the PANI phase are appreciably higher than those of pure PANI-LSA. Moreover, we demonstrate here that thermal behavior of these nanocomposites in air is strongly different for low and high PANI-LSA loadings that probably stems both from the plasticizing ability of the LSA dopant and stabilizing effect of the PANI shell. This fact, in general, gives the complementary information about the thermal behavior specificity of the known PANI containing core-shell composites.
At the same time, based on thermal stability, conductivity and sensor studies, we conclude that properties of the synthesized PS/PANI-LSA nanocomposites testify to their potential applicability as materials for antistatic and sensing applications.
纳米材料