

SmartWristband
组件和用品
 |
| × | 1 | |||
 |
| × | 1 | |||
 |
| × | 1 | |||
| × | 1 | ||||
| × | 1 | ||||
| × | 1 |
必要的工具和机器
 |
|
应用和在线服务
 |
| |||
 |
| |||
 |
| |||
| ||||
 |
|
关于这个项目
项目概况
过去我发现自己通读了这个话题,最后我花了几个小时思考在这个脆弱的时刻可以帮助世界的解决方案,可以做出改变并帮助我们在脚下变化的世界中茁壮成长的解决方案.
我着眼于照顾弱型病毒的人 .经常被忽视的一类人。这些人不幸感染了病毒,但幸运的是只有轻微症状 .但这些患者的健康状况极不稳定 并且可能在几个小时内变得更糟 .必须详细监测他们的健康状况。
事实证明,各国有不同的方法来照顾这些患者:有些会住院 (拥挤的医院 可以在校外监测的患者),其他人将他们送到家中自我隔离 .但第二种选择存在一个问题——这些患者的健康状况可能迅速恶化 因此必须受到监控。
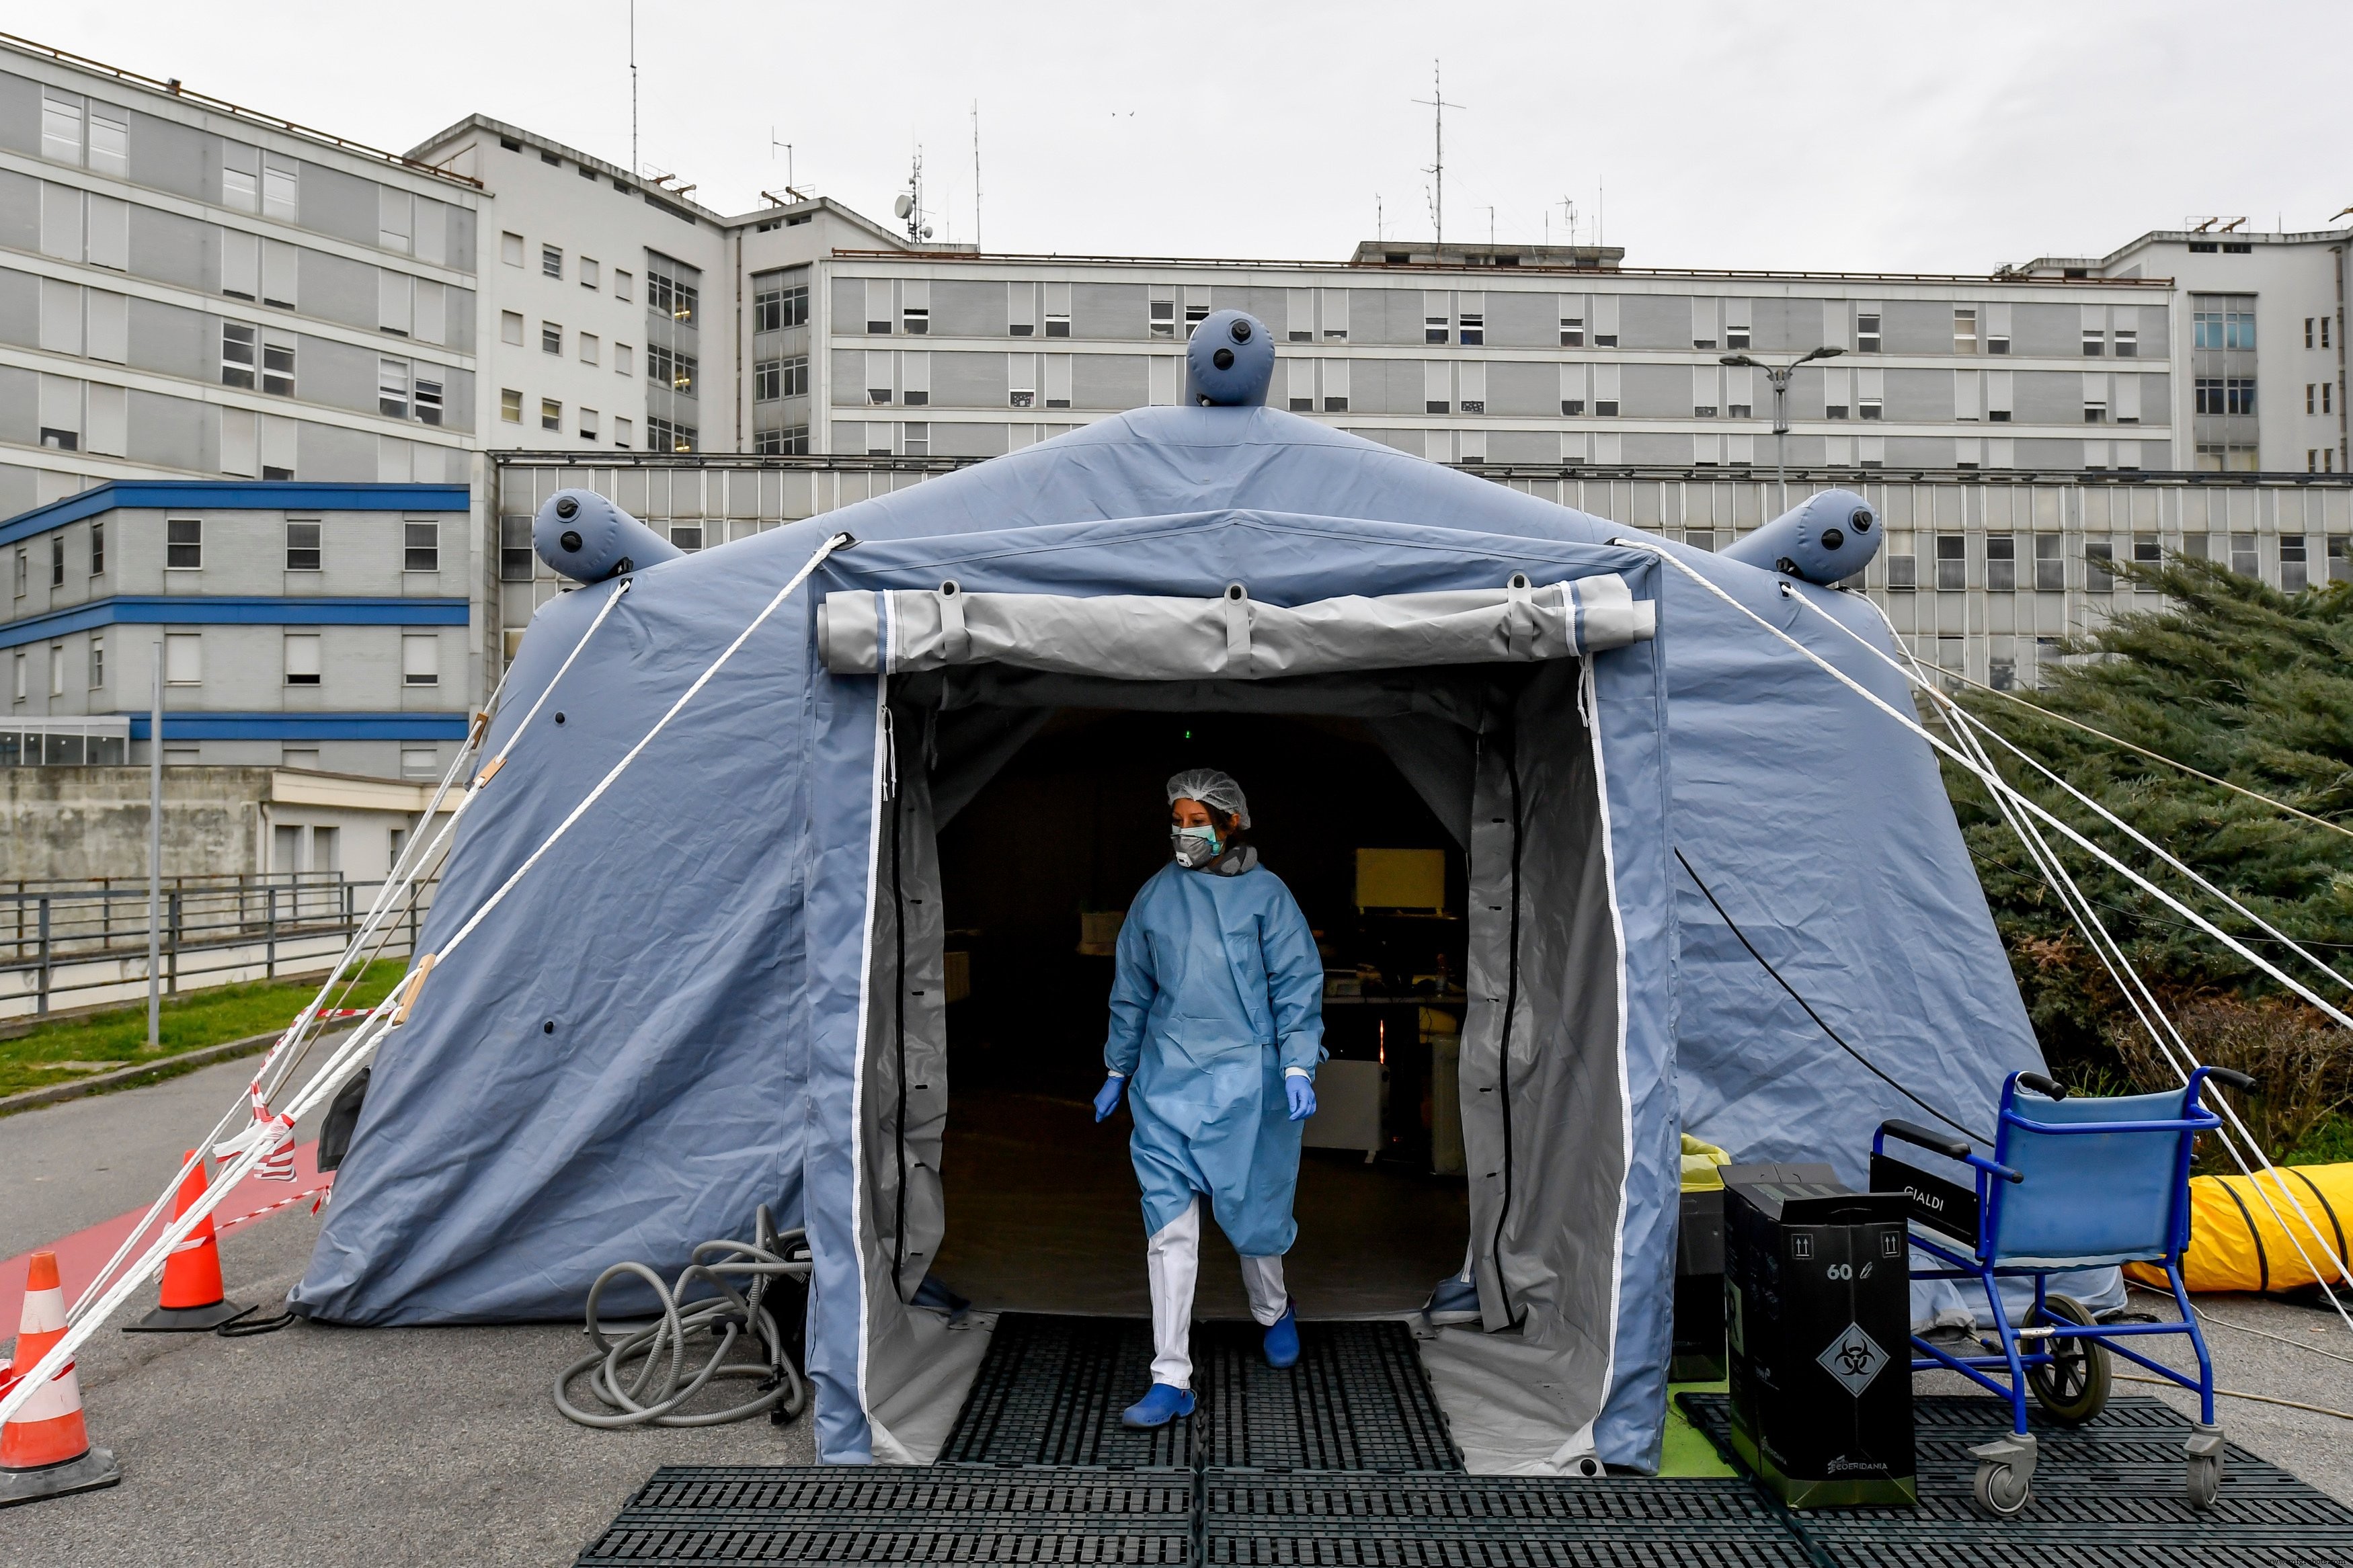
确实有重型、笨重的设备可以做到这一点。但问题是显而易见的;由于大多数患病人群将施加弱形式的病毒,这些昂贵、不舒服的设备没有能力扩展并部署到整个 人口(因为价格和体积)。毋庸置疑,一些患者试图“逃离”自己的家,并不真正关心病毒,这些人对社会和自己都是危险的,应该受到监控,以确保他们不会离开家。
SmartWristband 是一种腕带手持设备 监测患者的生命体征和地理位置 在他们在家中与病毒作斗争的同时照顾他们的安全。该设备由 Arduino MKR GSM 1400 供电 并配备红外温度和心率传感器 收集有关患者健康的重要信息。体温升高和心率不齐是病毒进展的迹象。患者不会立即注意到这些变化,SmartWristband 旨在做到这一点并实时安全地传输数据 到医院监测病人。
该设备还将跟踪用户的位置 确保他们一直在家 .所有这些数据集中在一个可扩展的数据库中 允许在国际范围内部署数千台此类设备。
医院将可以访问仪表板 他们将能够看到所有被监测患者的健康状况 一瞥以及详细报告每个患者的详细状态。
机器学习算法 在应用程序中也实现了预测患者的体温和心率 在不久的将来,以便医院知道会发生什么以及何时让患者住院。
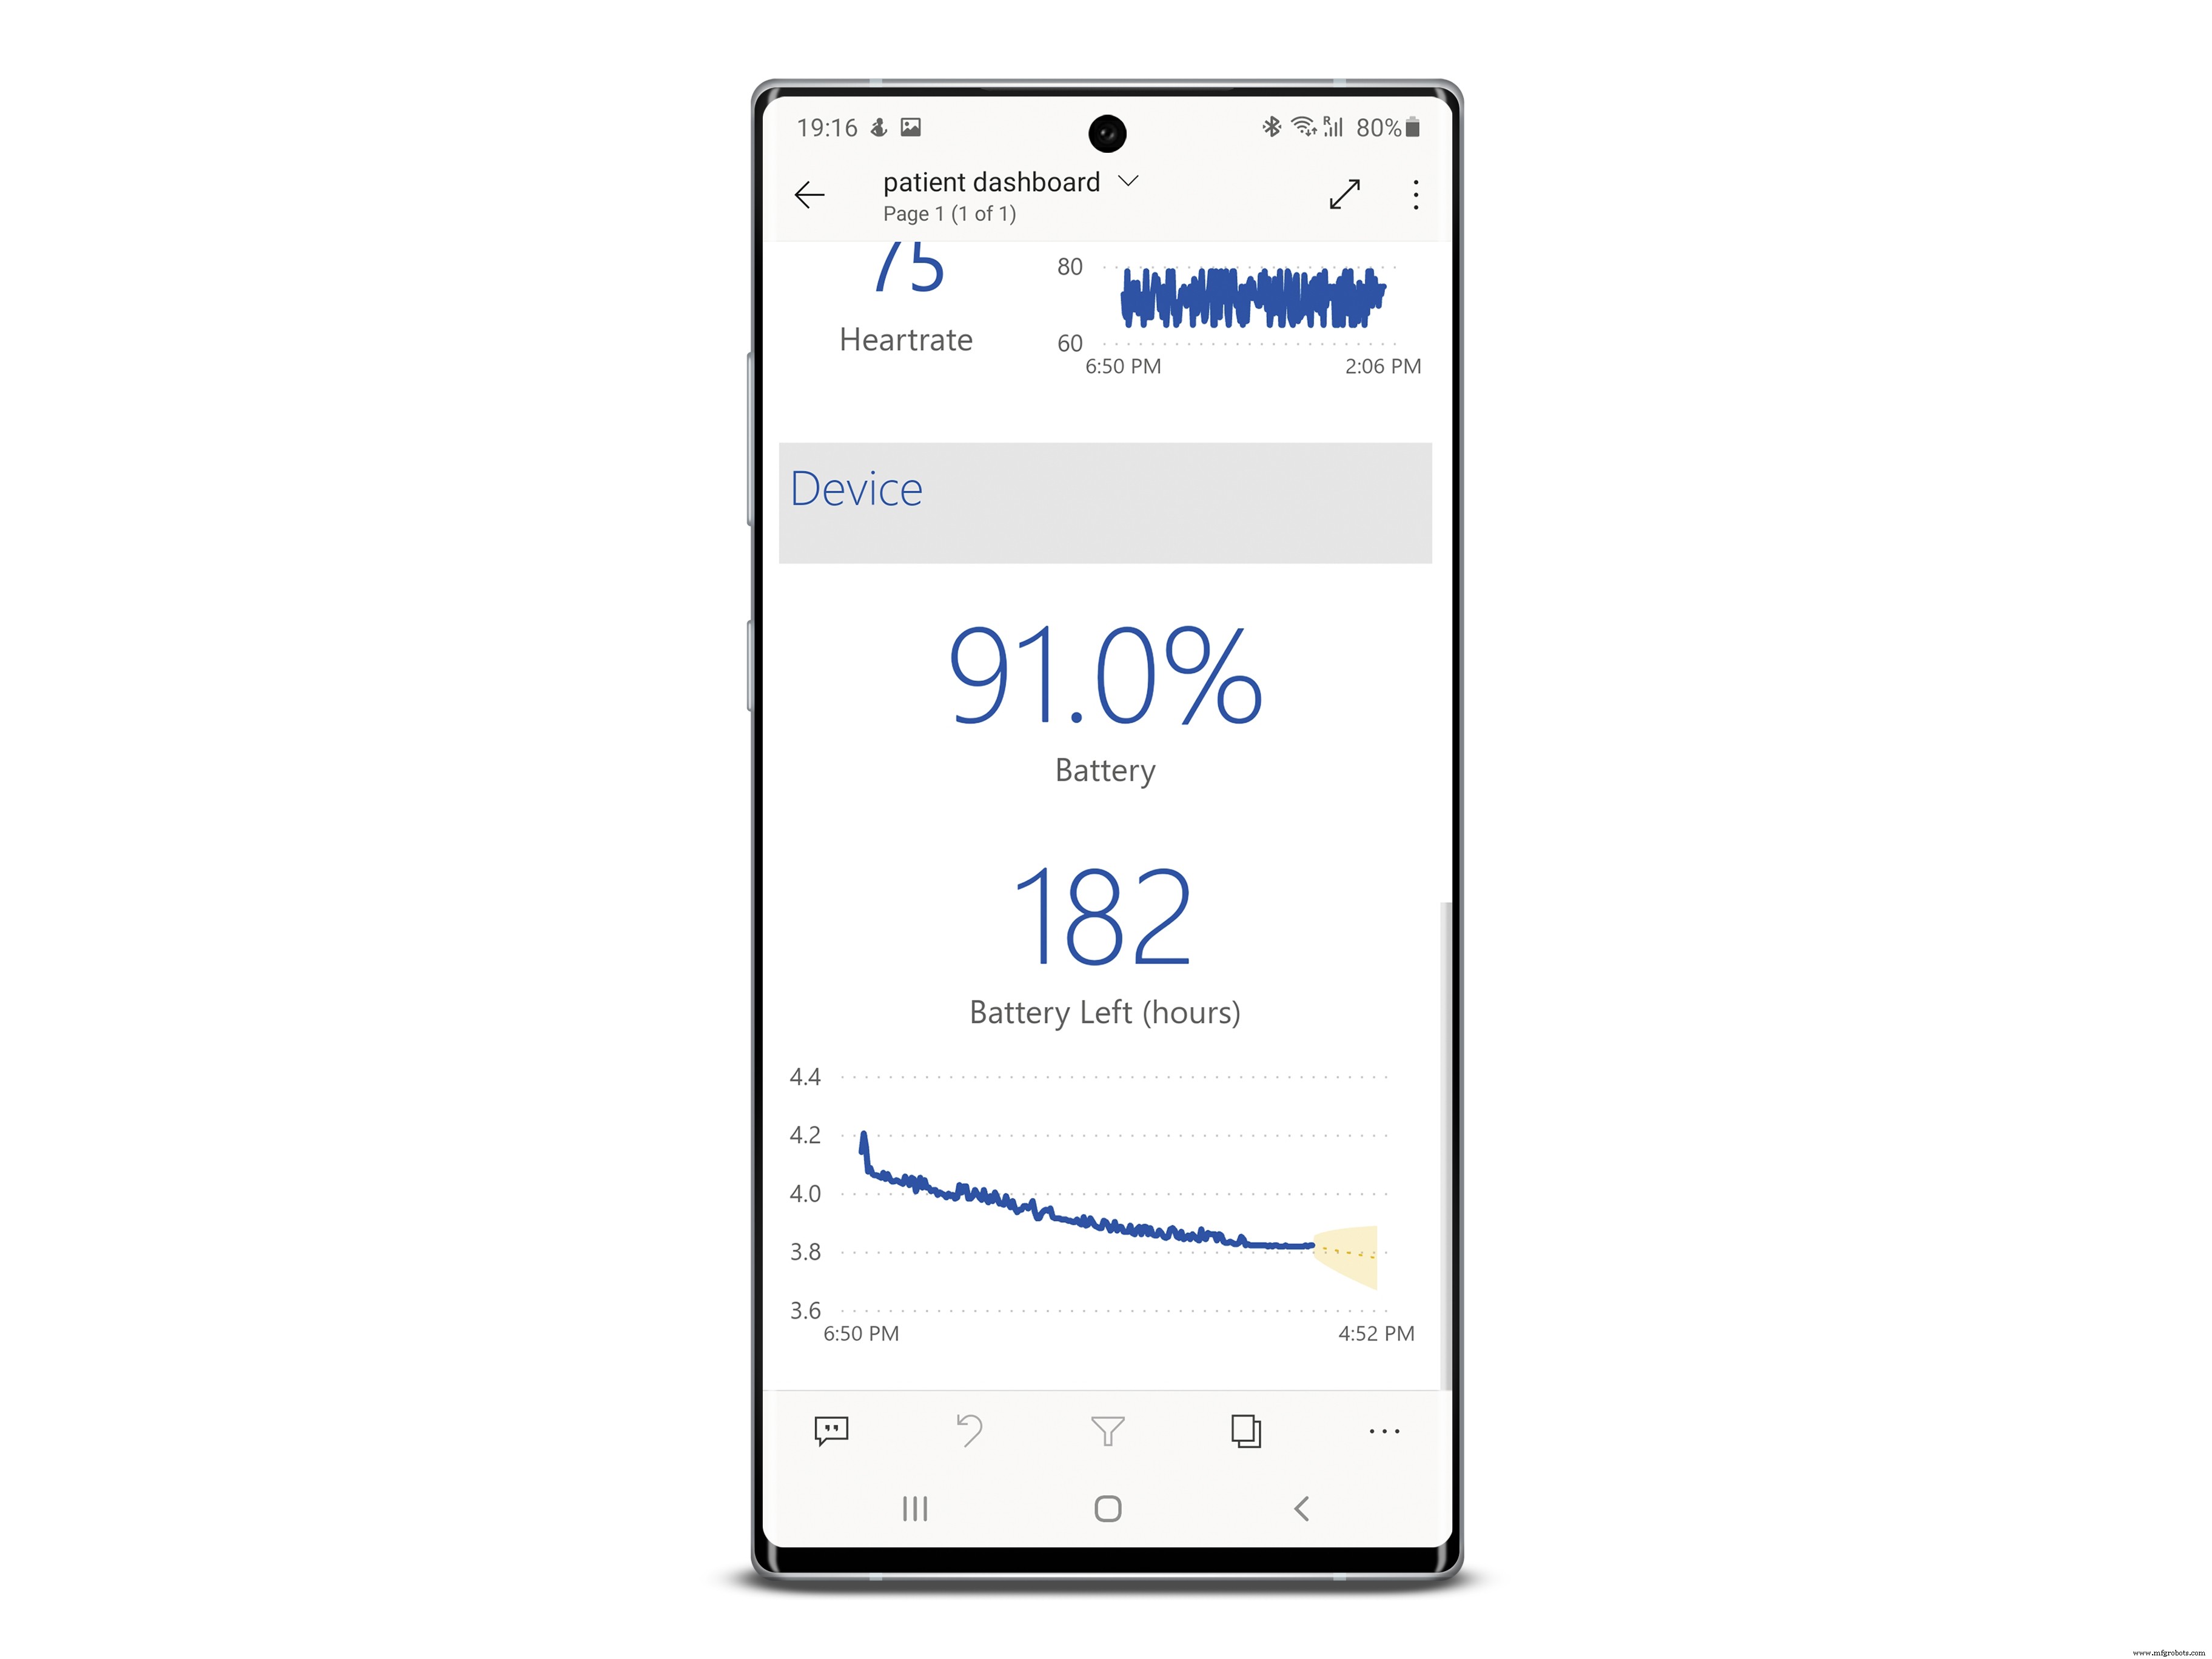
患者还可以访问移动仪表板 向他们展示他们的心率和体温,以及他们何时需要为腕带充电。
该设备足够舒适,让患者日夜佩戴 没有注意到它。 SmartWristband 也会通知用户是否取下设备 ,在这种情况下提醒医院。
SmartWristband 是一种低成本、可扩展的开源解决方案 用于照顾因病毒监测而被送往自我隔离的患者 病情发展 和提醒 医务人员通过机器学习和简单易用的仪表板体验 如果患者需要关注。
项目总结
本部分将着眼于应用程序的功能,并对其功能进行高级别的理解。
收集的数据
设备每隔 5 分钟收集一次数据。这样做是为了在使用尽可能低的电池消耗的同时提供患者状况的相对实时视图。该设备收集两种类型的数据:重要数据和位置数据。
重要数据是指心率和体温 患者的位置数据是指患者的地理位置 .设备不在本地处理此数据 但只需将其转发到 Azure 进行处理即可。
为什么要收集这些数据?
温度和心率数据可以通过分析其趋势来指示患者当前状态是否正在退化。研究表明,不规则的心率和高温是病毒存在的标志。如果这些生命体征随着时间的推移而退化(即温度逐渐升高),则表明患者的病情可能正在恶化。患者可能要到稍后才会意识到这一点,但设备会在这些迹象出现时识别它们。
地理定位数据也由设备收集,这样做是为了确保患者待在家里 在隔离中,并遵守隔离规则。 Azure 检查用户是否在家,并将在医生仪表板上报告。
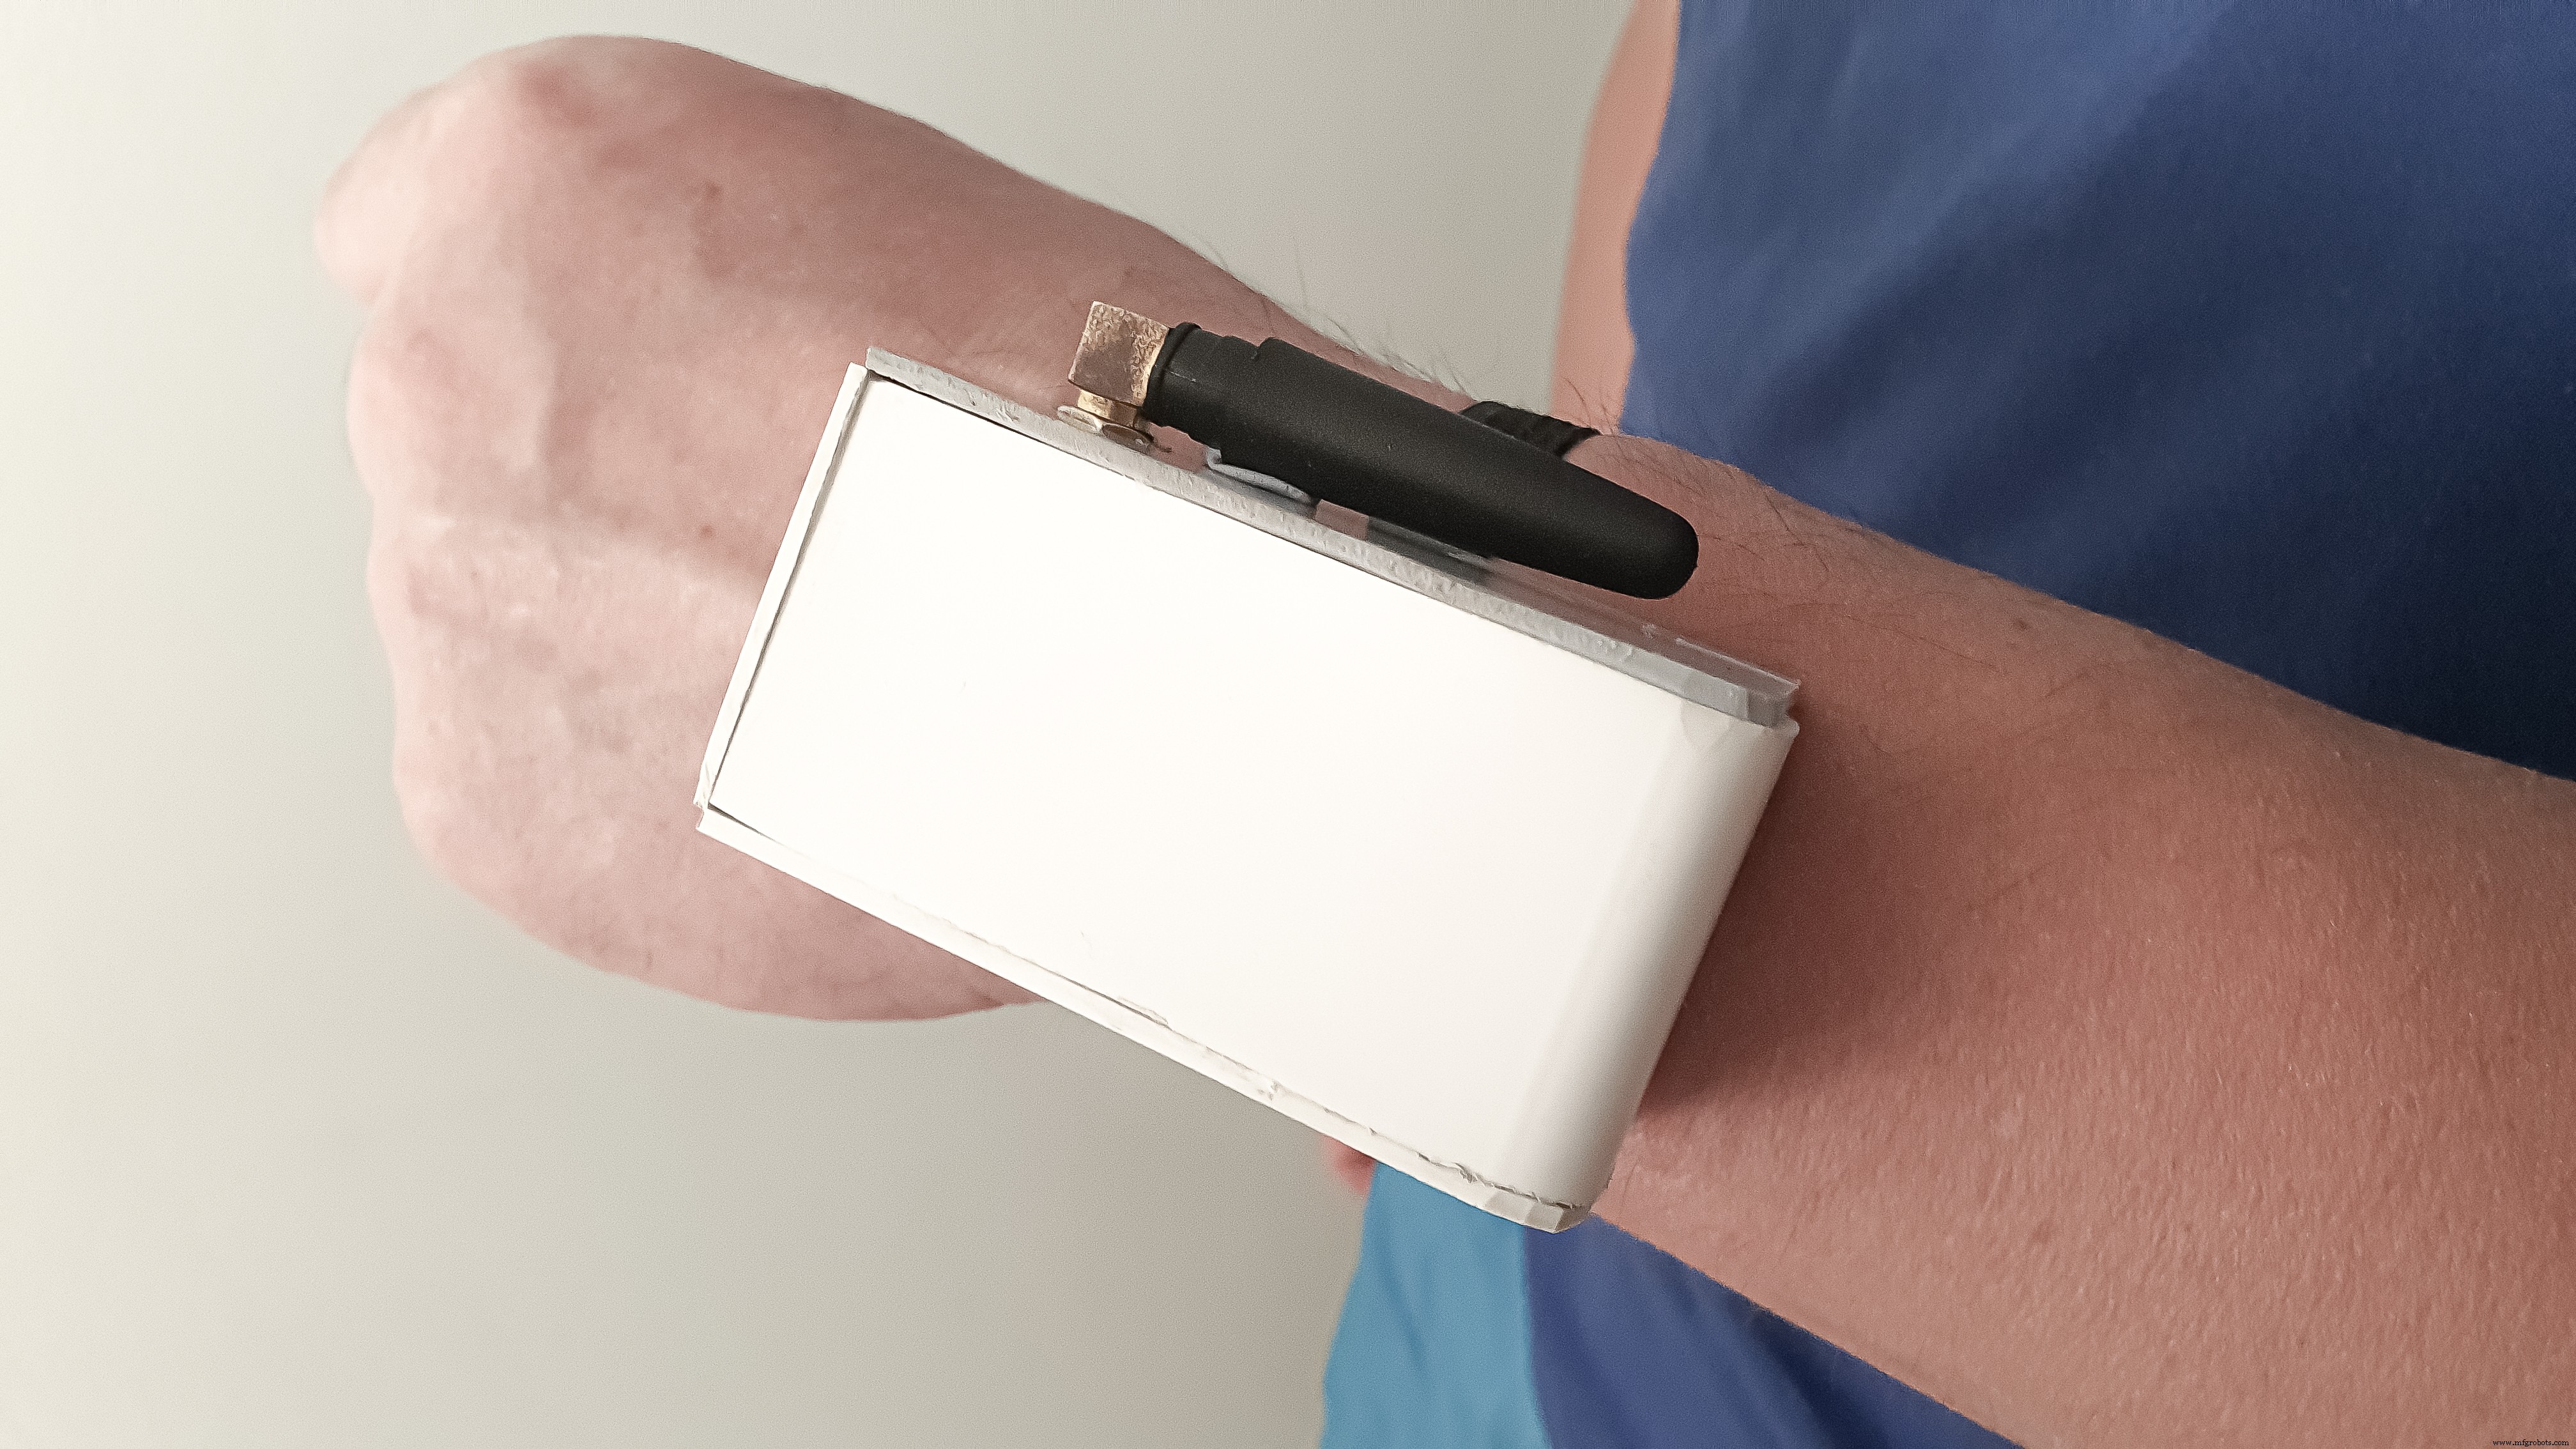
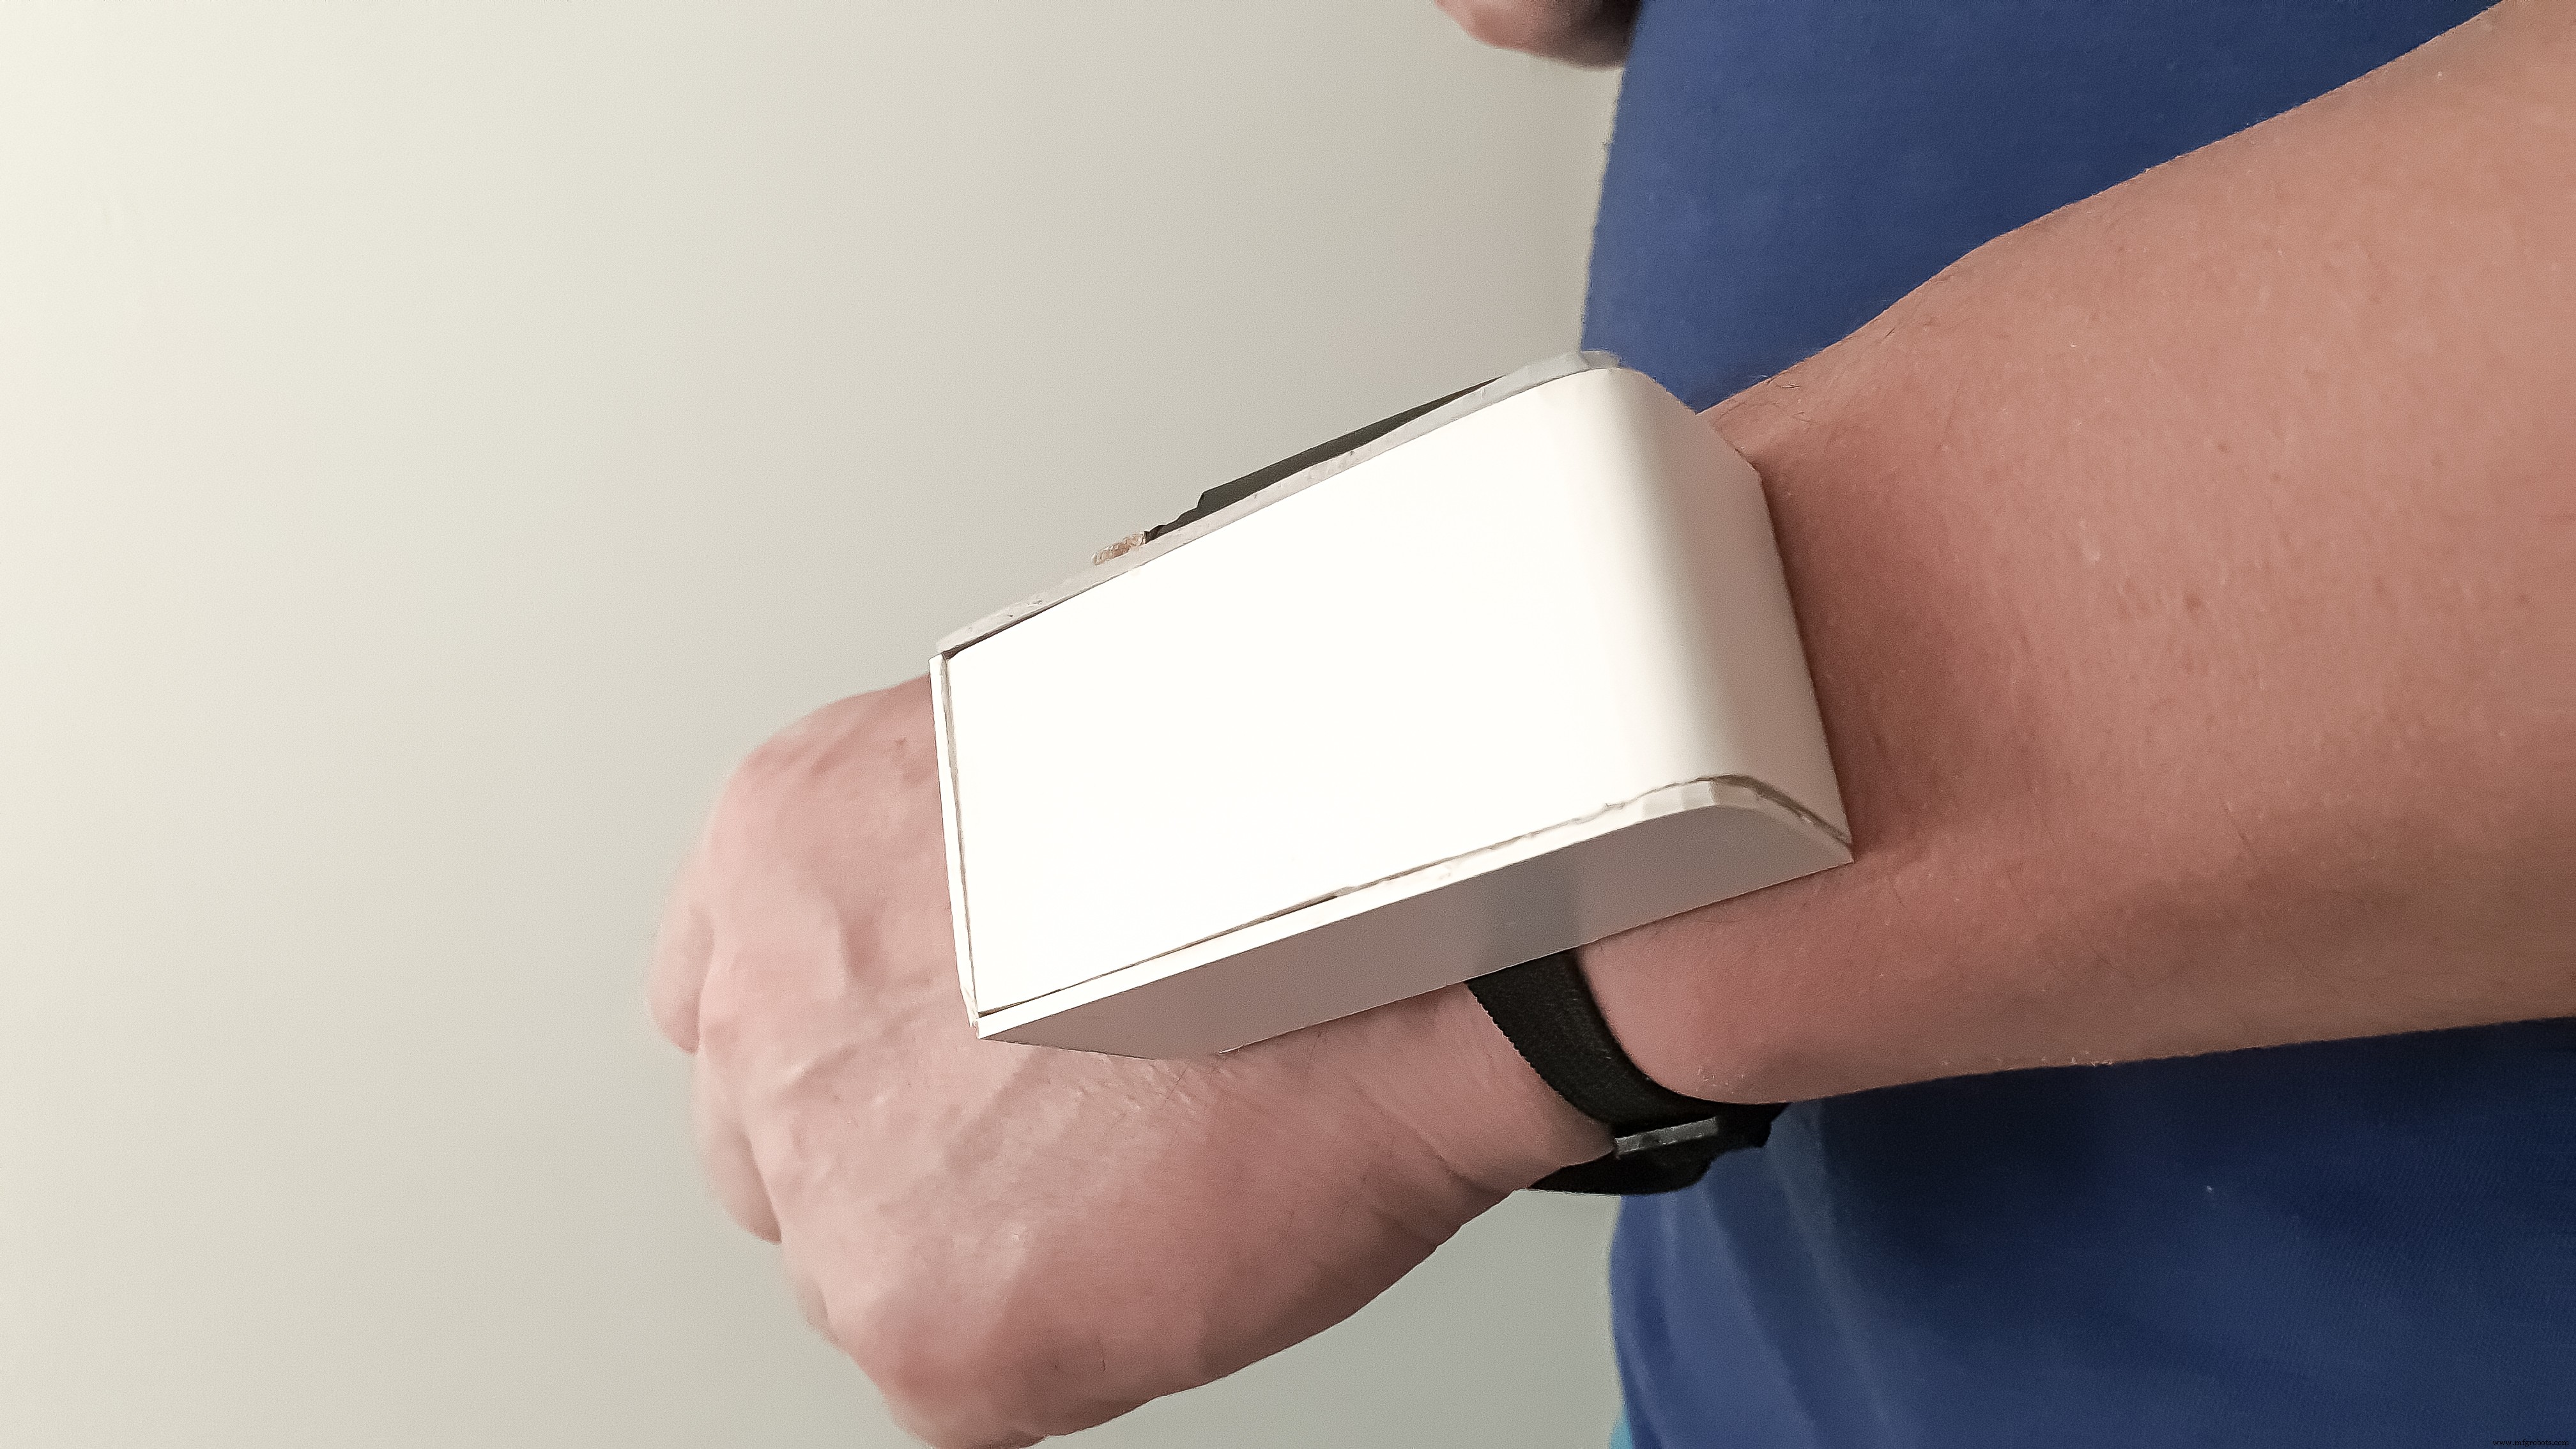
查看设备
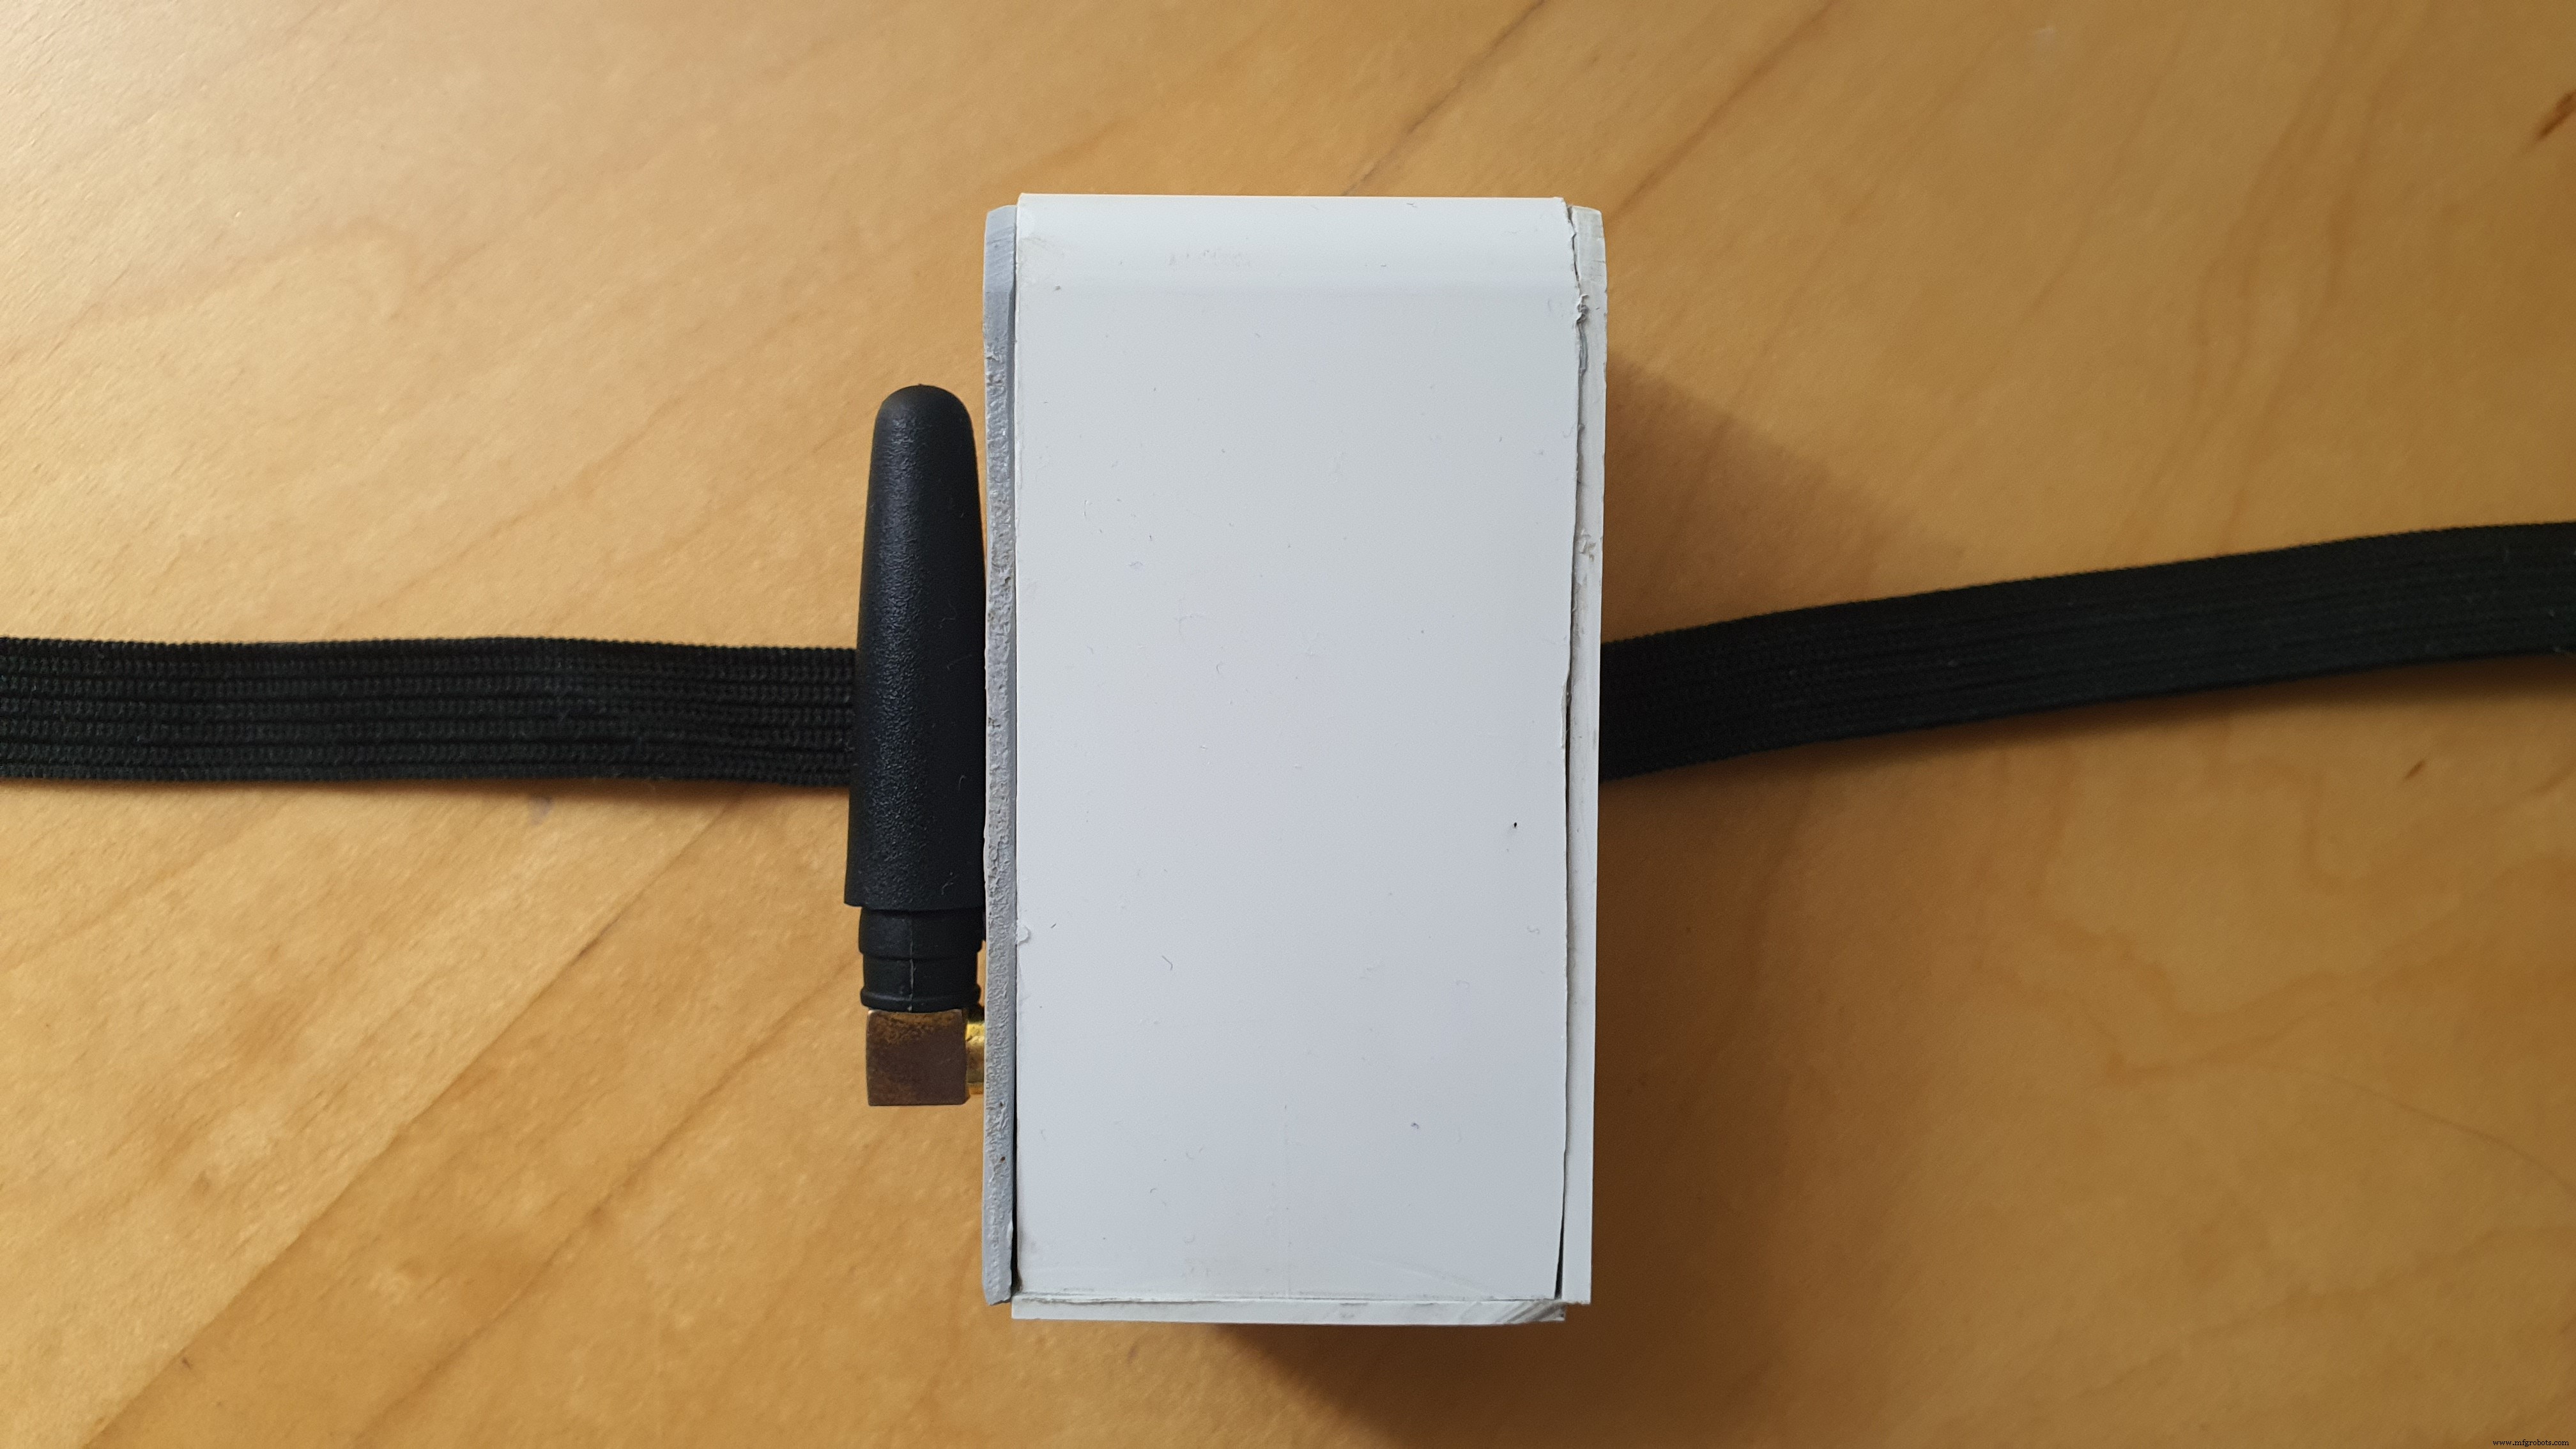
我在创建原型时考虑到了舒适度。该设备很容易放在患者的手腕上,无论是在左手还是右手上。它配备了心率传感器和红外温度传感器,它们突出在设备底部以接触患者的皮肤。
这些传感器提供精确的测量,而不会引起不适。请注意,为了进一步提高温度精度,应将传感器放置在垫子中的手臂下方等位置。
该设备将使用心率传感器输出的原始数据来检查患者是否正在佩戴该设备。当传感器与皮肤接触时,它会输出非常具体的数据模式,因此没有这种模式代表设备没有被佩戴。
电池寿命
进行了严格的测试以精确测量设备的电池寿命。一次充电,该设备的总电池寿命为 8 天。这意味着如果要对患者进行两周的检查,则电池必须充电一次。可在佩戴设备时为电池充电。
或者,可以每隔 10 分钟收集一次数据 ,基本上使设备的电池寿命加倍 因为它会在读取之间休眠,消耗很少的电池。剩余电池寿命以及剩余电池寿命小时数显示在患者和医生仪表板上。
开发成本
就项目而言,开发成本包括一次性成本和经常性成本。包括外壳在内,一台设备的开发成本为 70 欧元。经常性成本发生在后端。我使用 Hologram 作为我的服务提供商,每台设备需要花费 5 欧元才能发送 2 周的数据。包括数据流和数据库在内的后端成本为 30 欧元,为期 2 周。
100 台设备的总成本约为 7, 035 欧元。请注意,这些设备是可重复使用的。
请注意,后端成本是可扩展的,无论部署的设备数量如何,都是相同的。批量购买组件和使用定制电路可以显着降低成本。
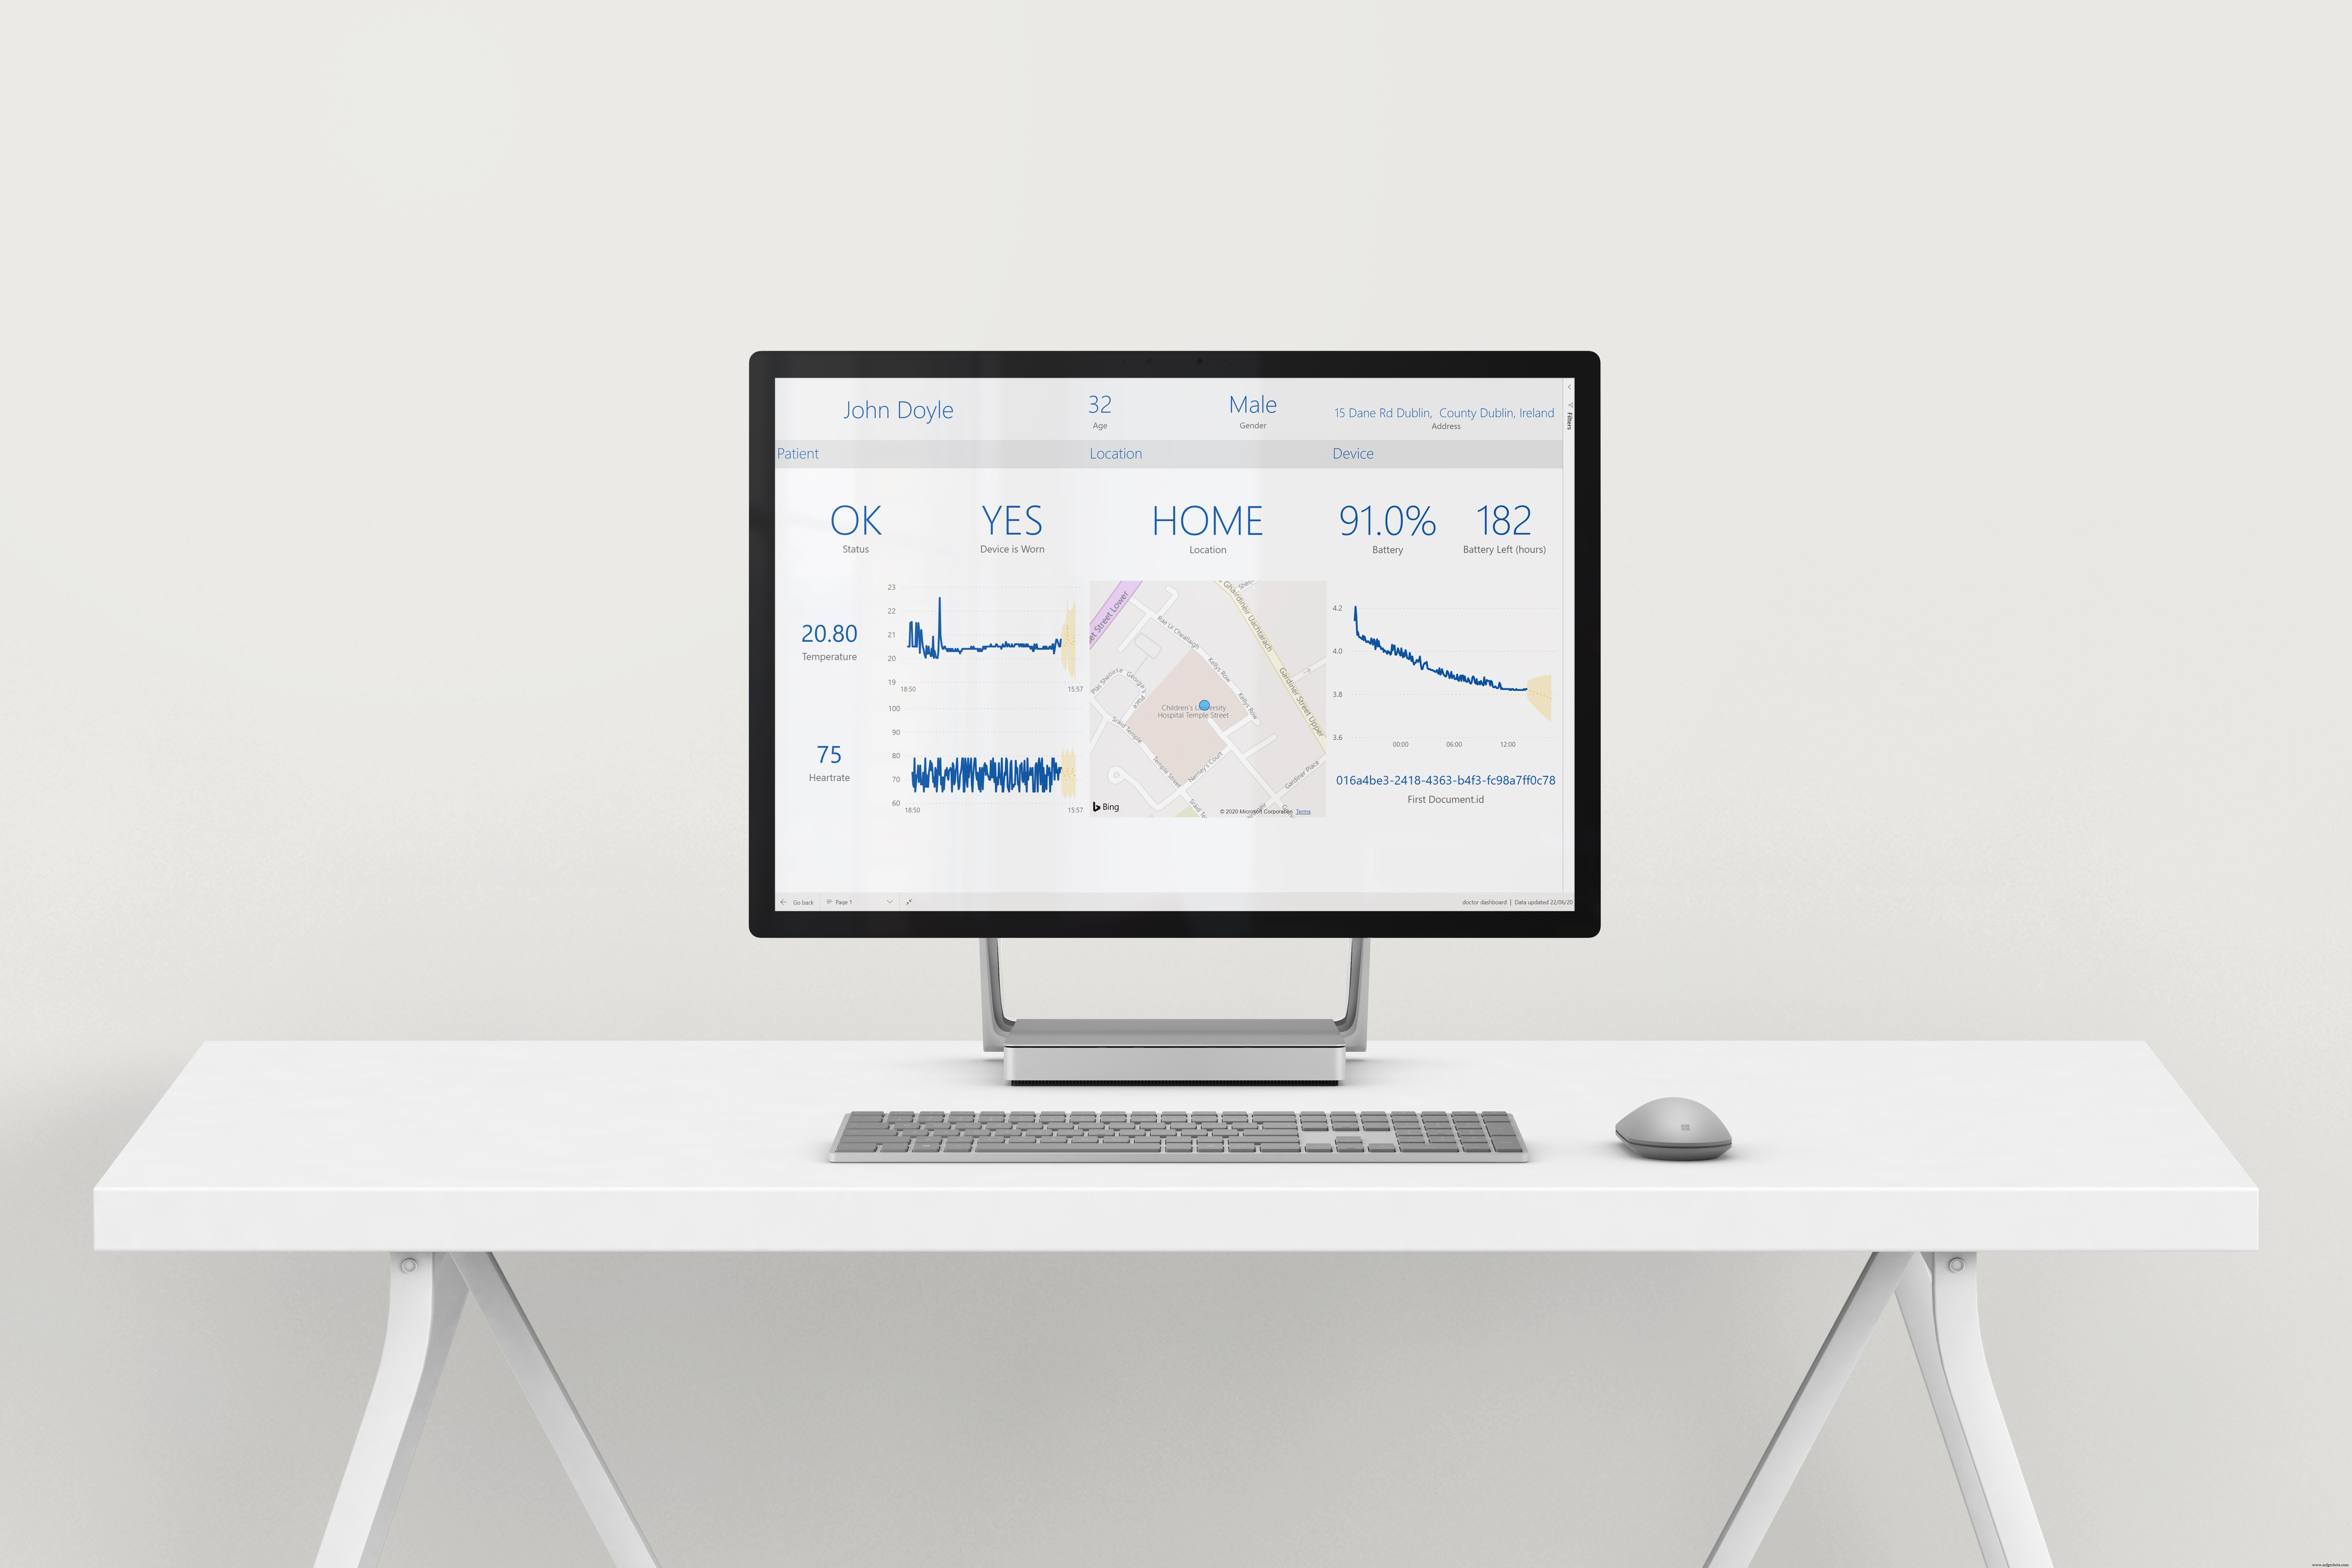
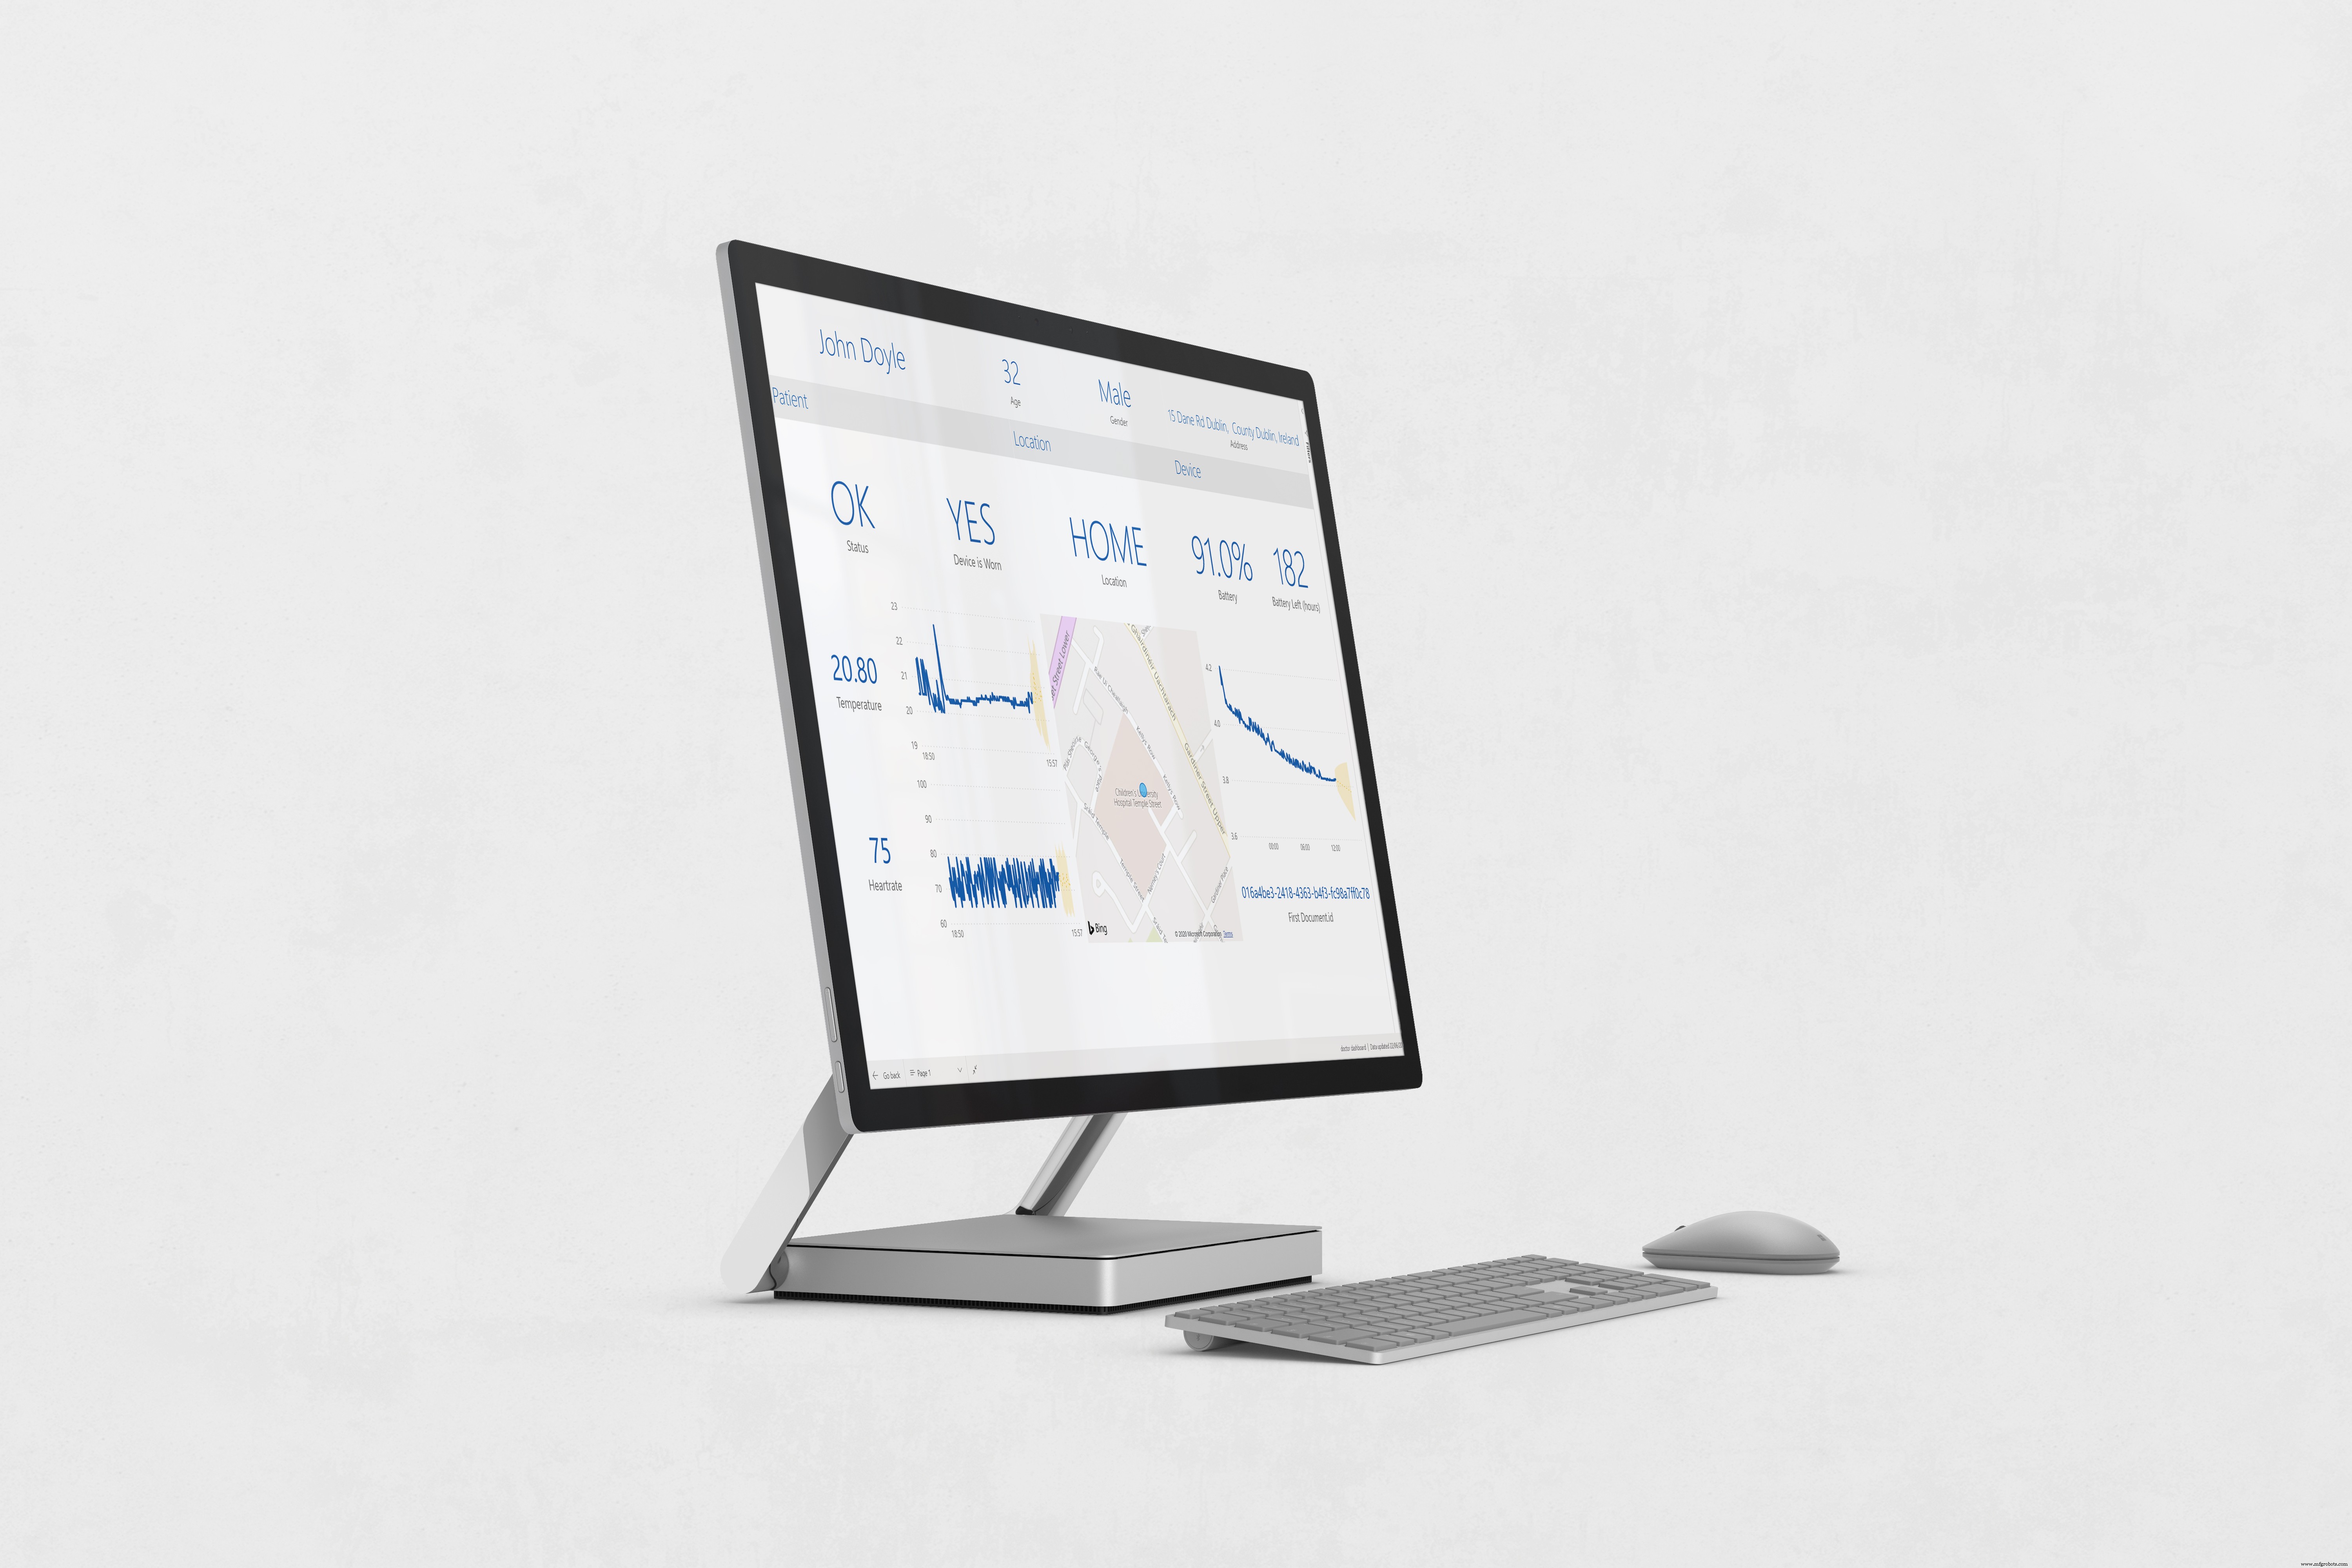
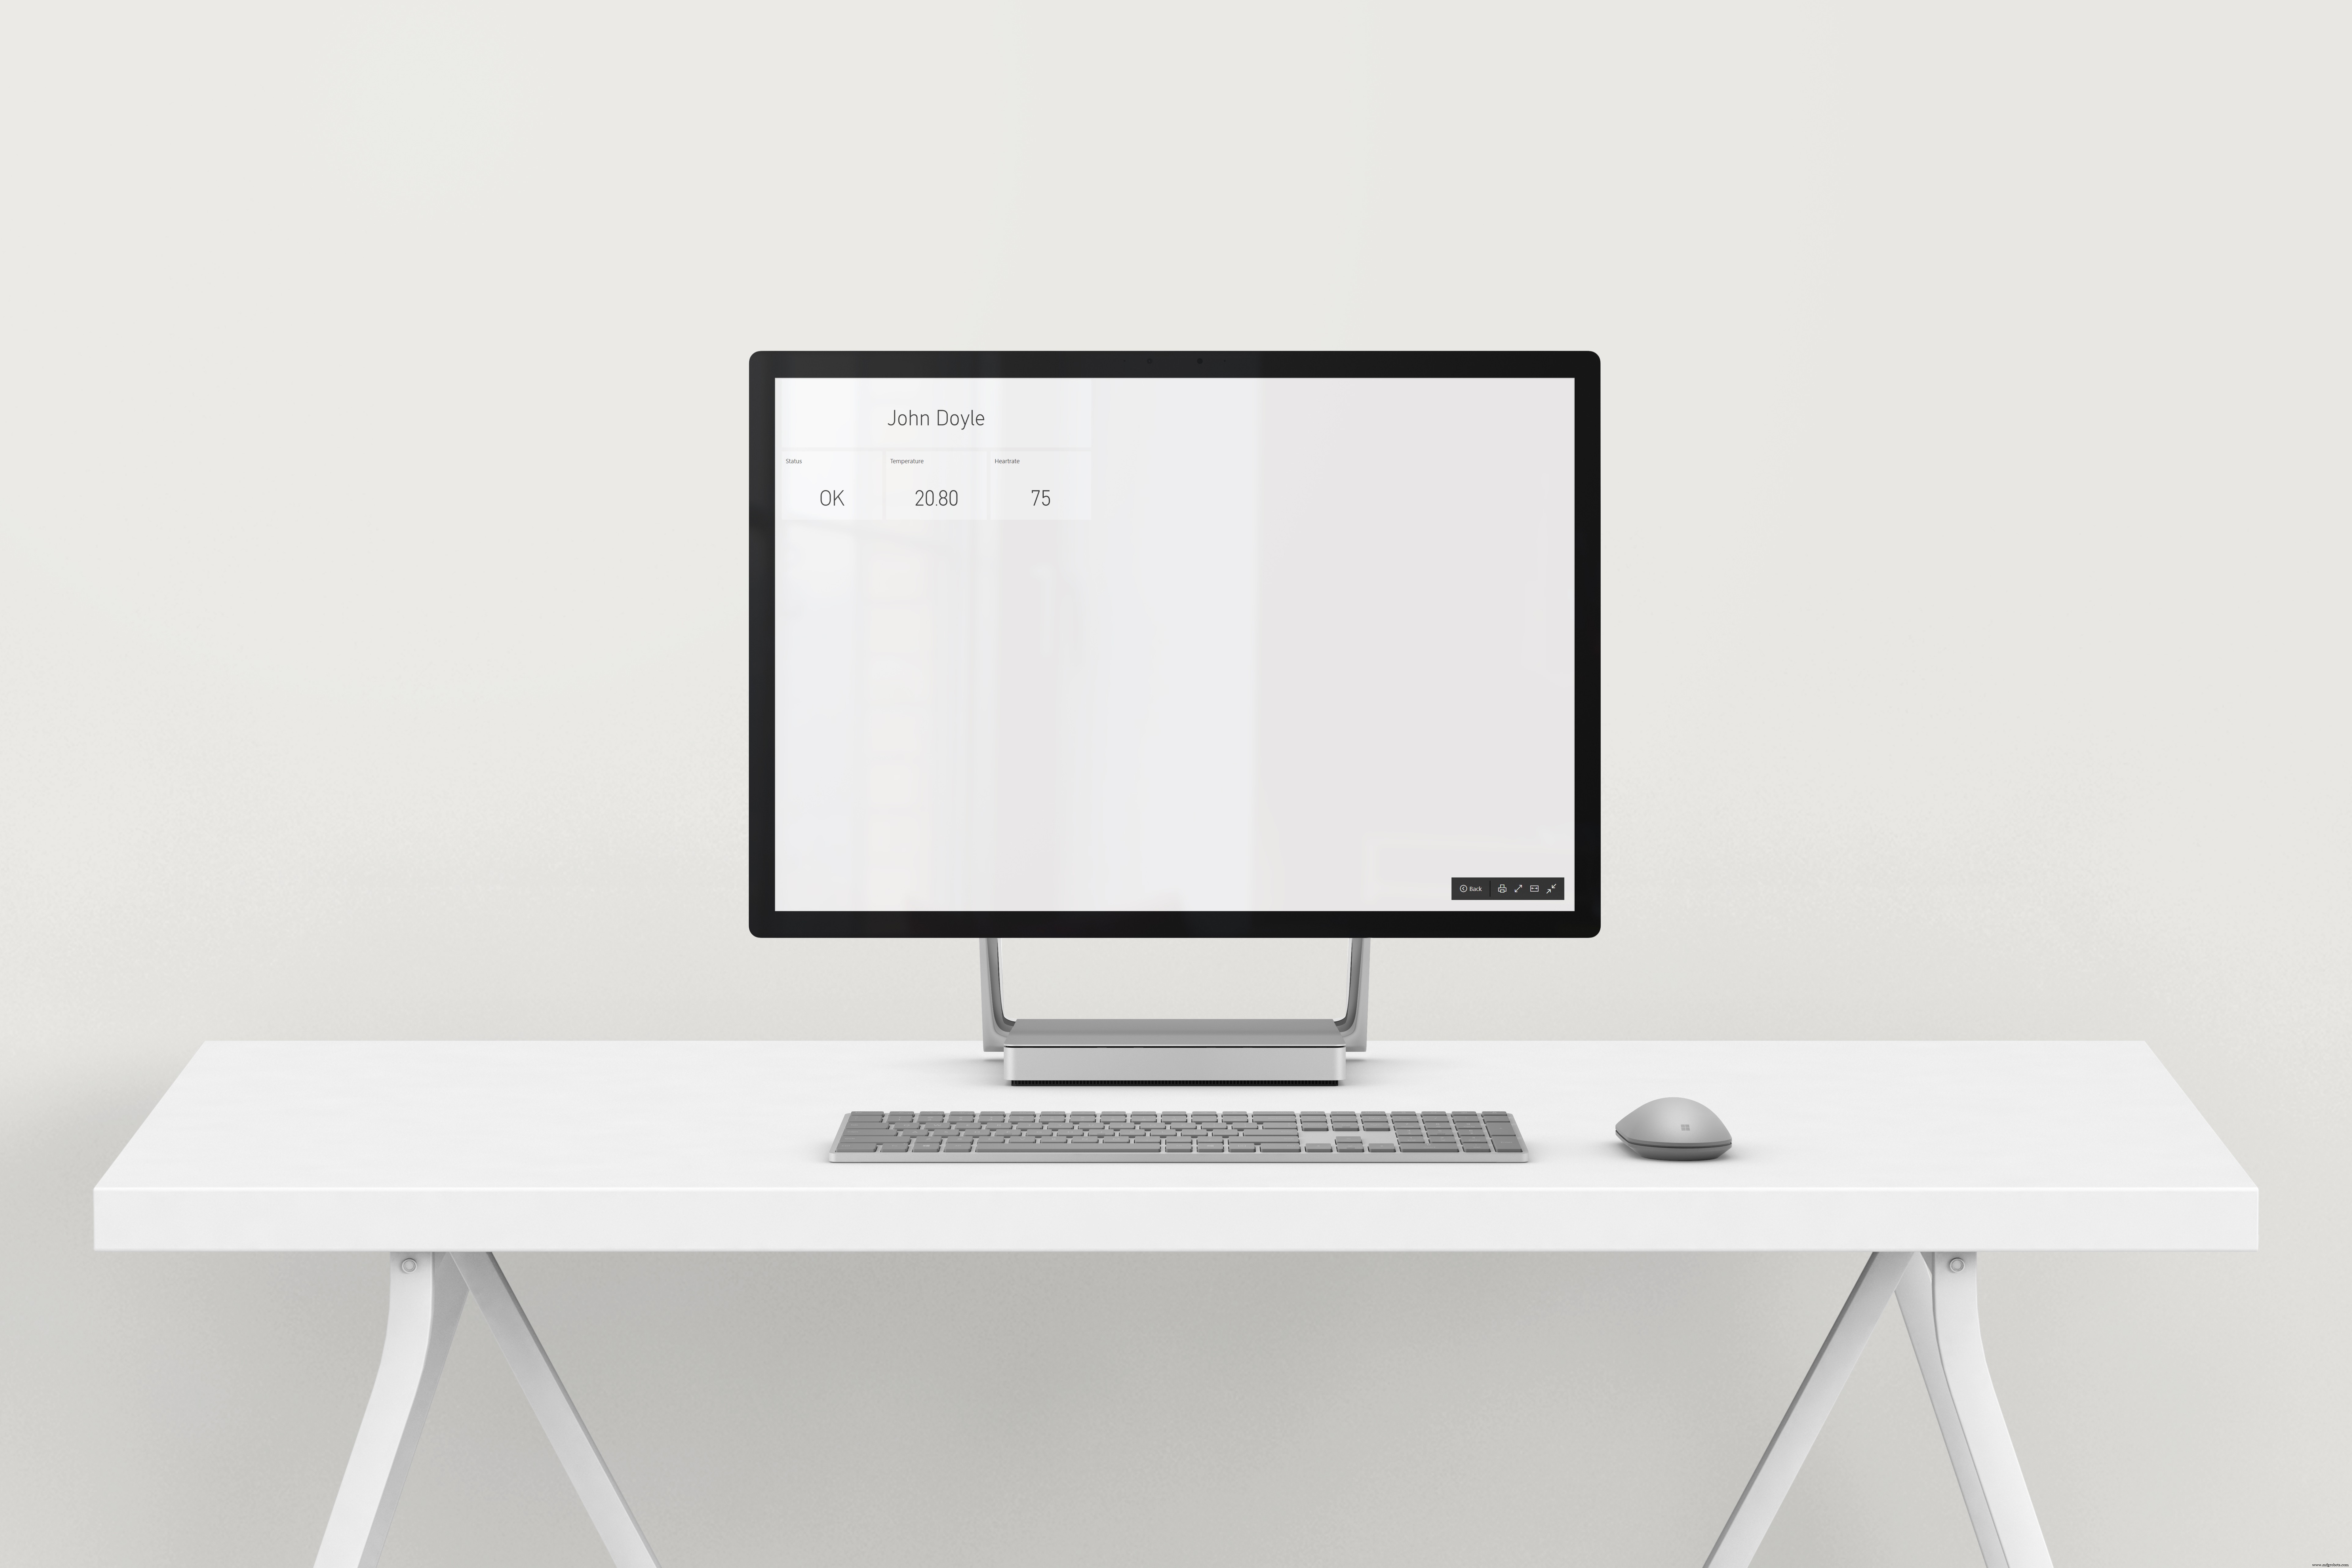
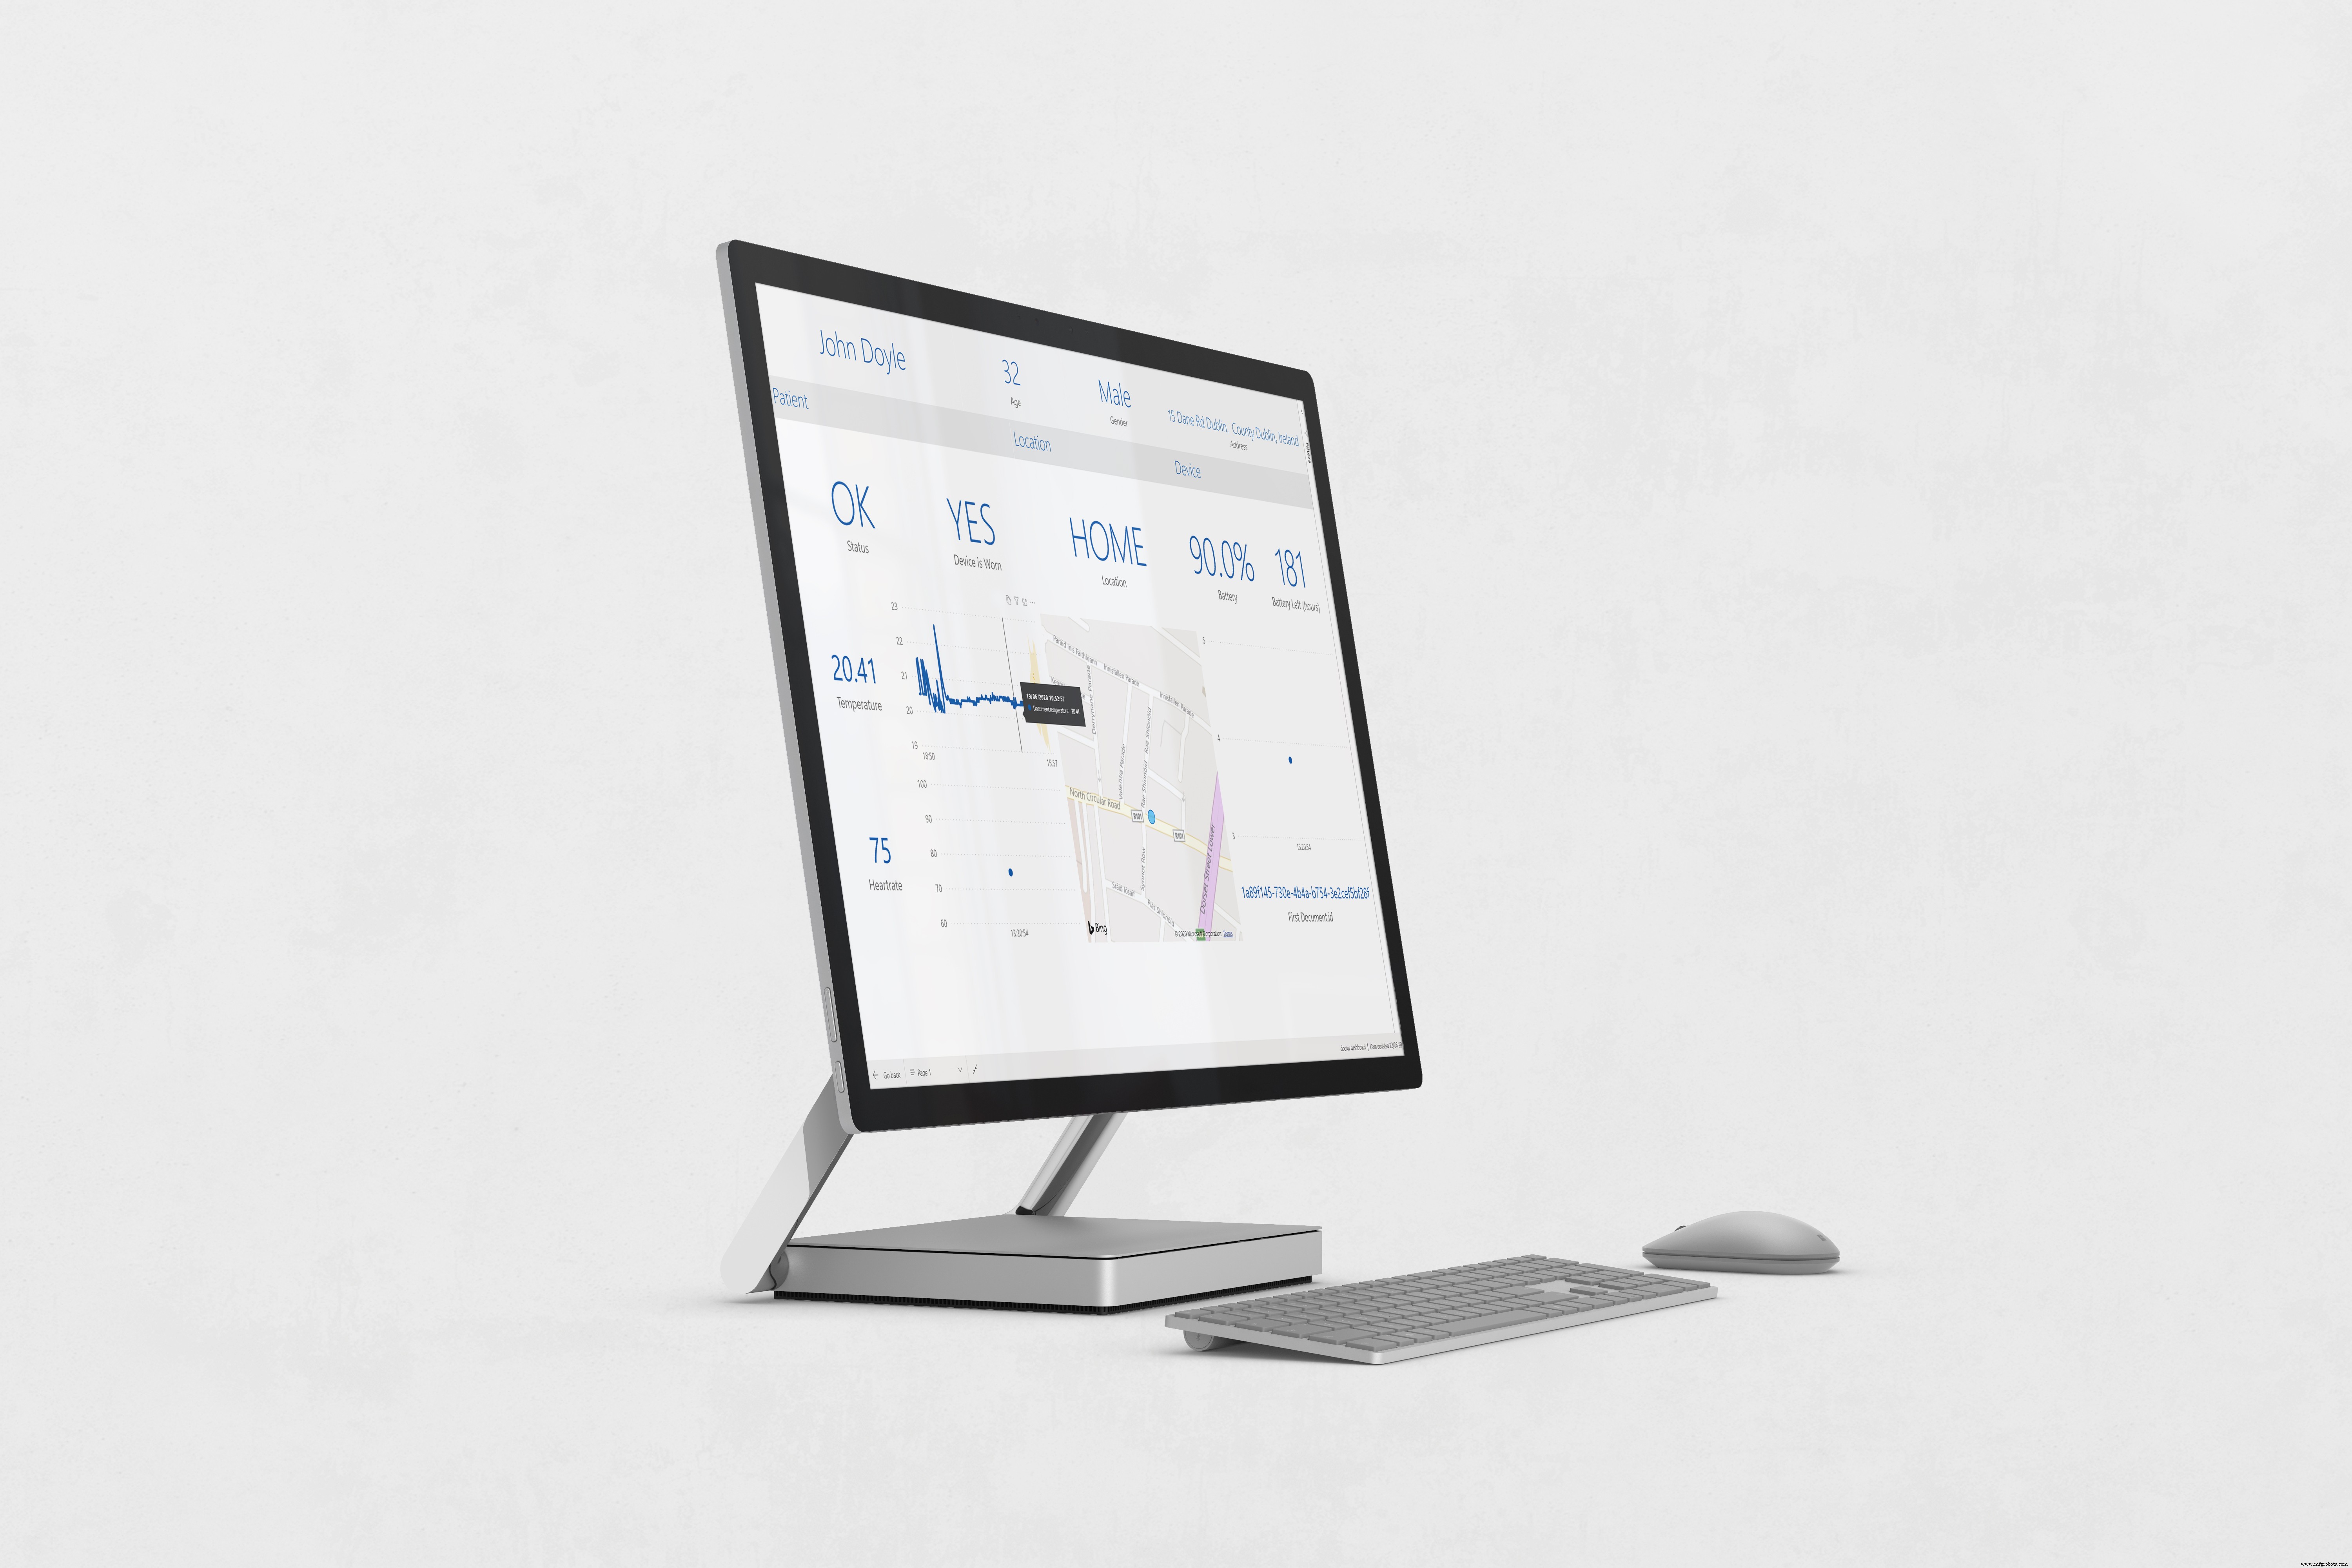
医生仪表板
医院能够随时监控这些被送到家中的患者的健康状况,并在他们身体状况不佳时得到警报,这一点非常重要。医院可以访问一个仪表板,显示所有受监控患者的生命体征以及所有患者的特定报告。这允许医生在患者需要帮助时收到通知,然后可以更详细地查看患者以确切了解问题所在。
医生将收到电子邮件形式的通知 如果患者不在家、未佩戴设备或体温和/或心率不规则,则在仪表板中发出警报 .
当患者的生命体征异常时,医生还会收到数据警报作为电子邮件,以便立即采取行动。
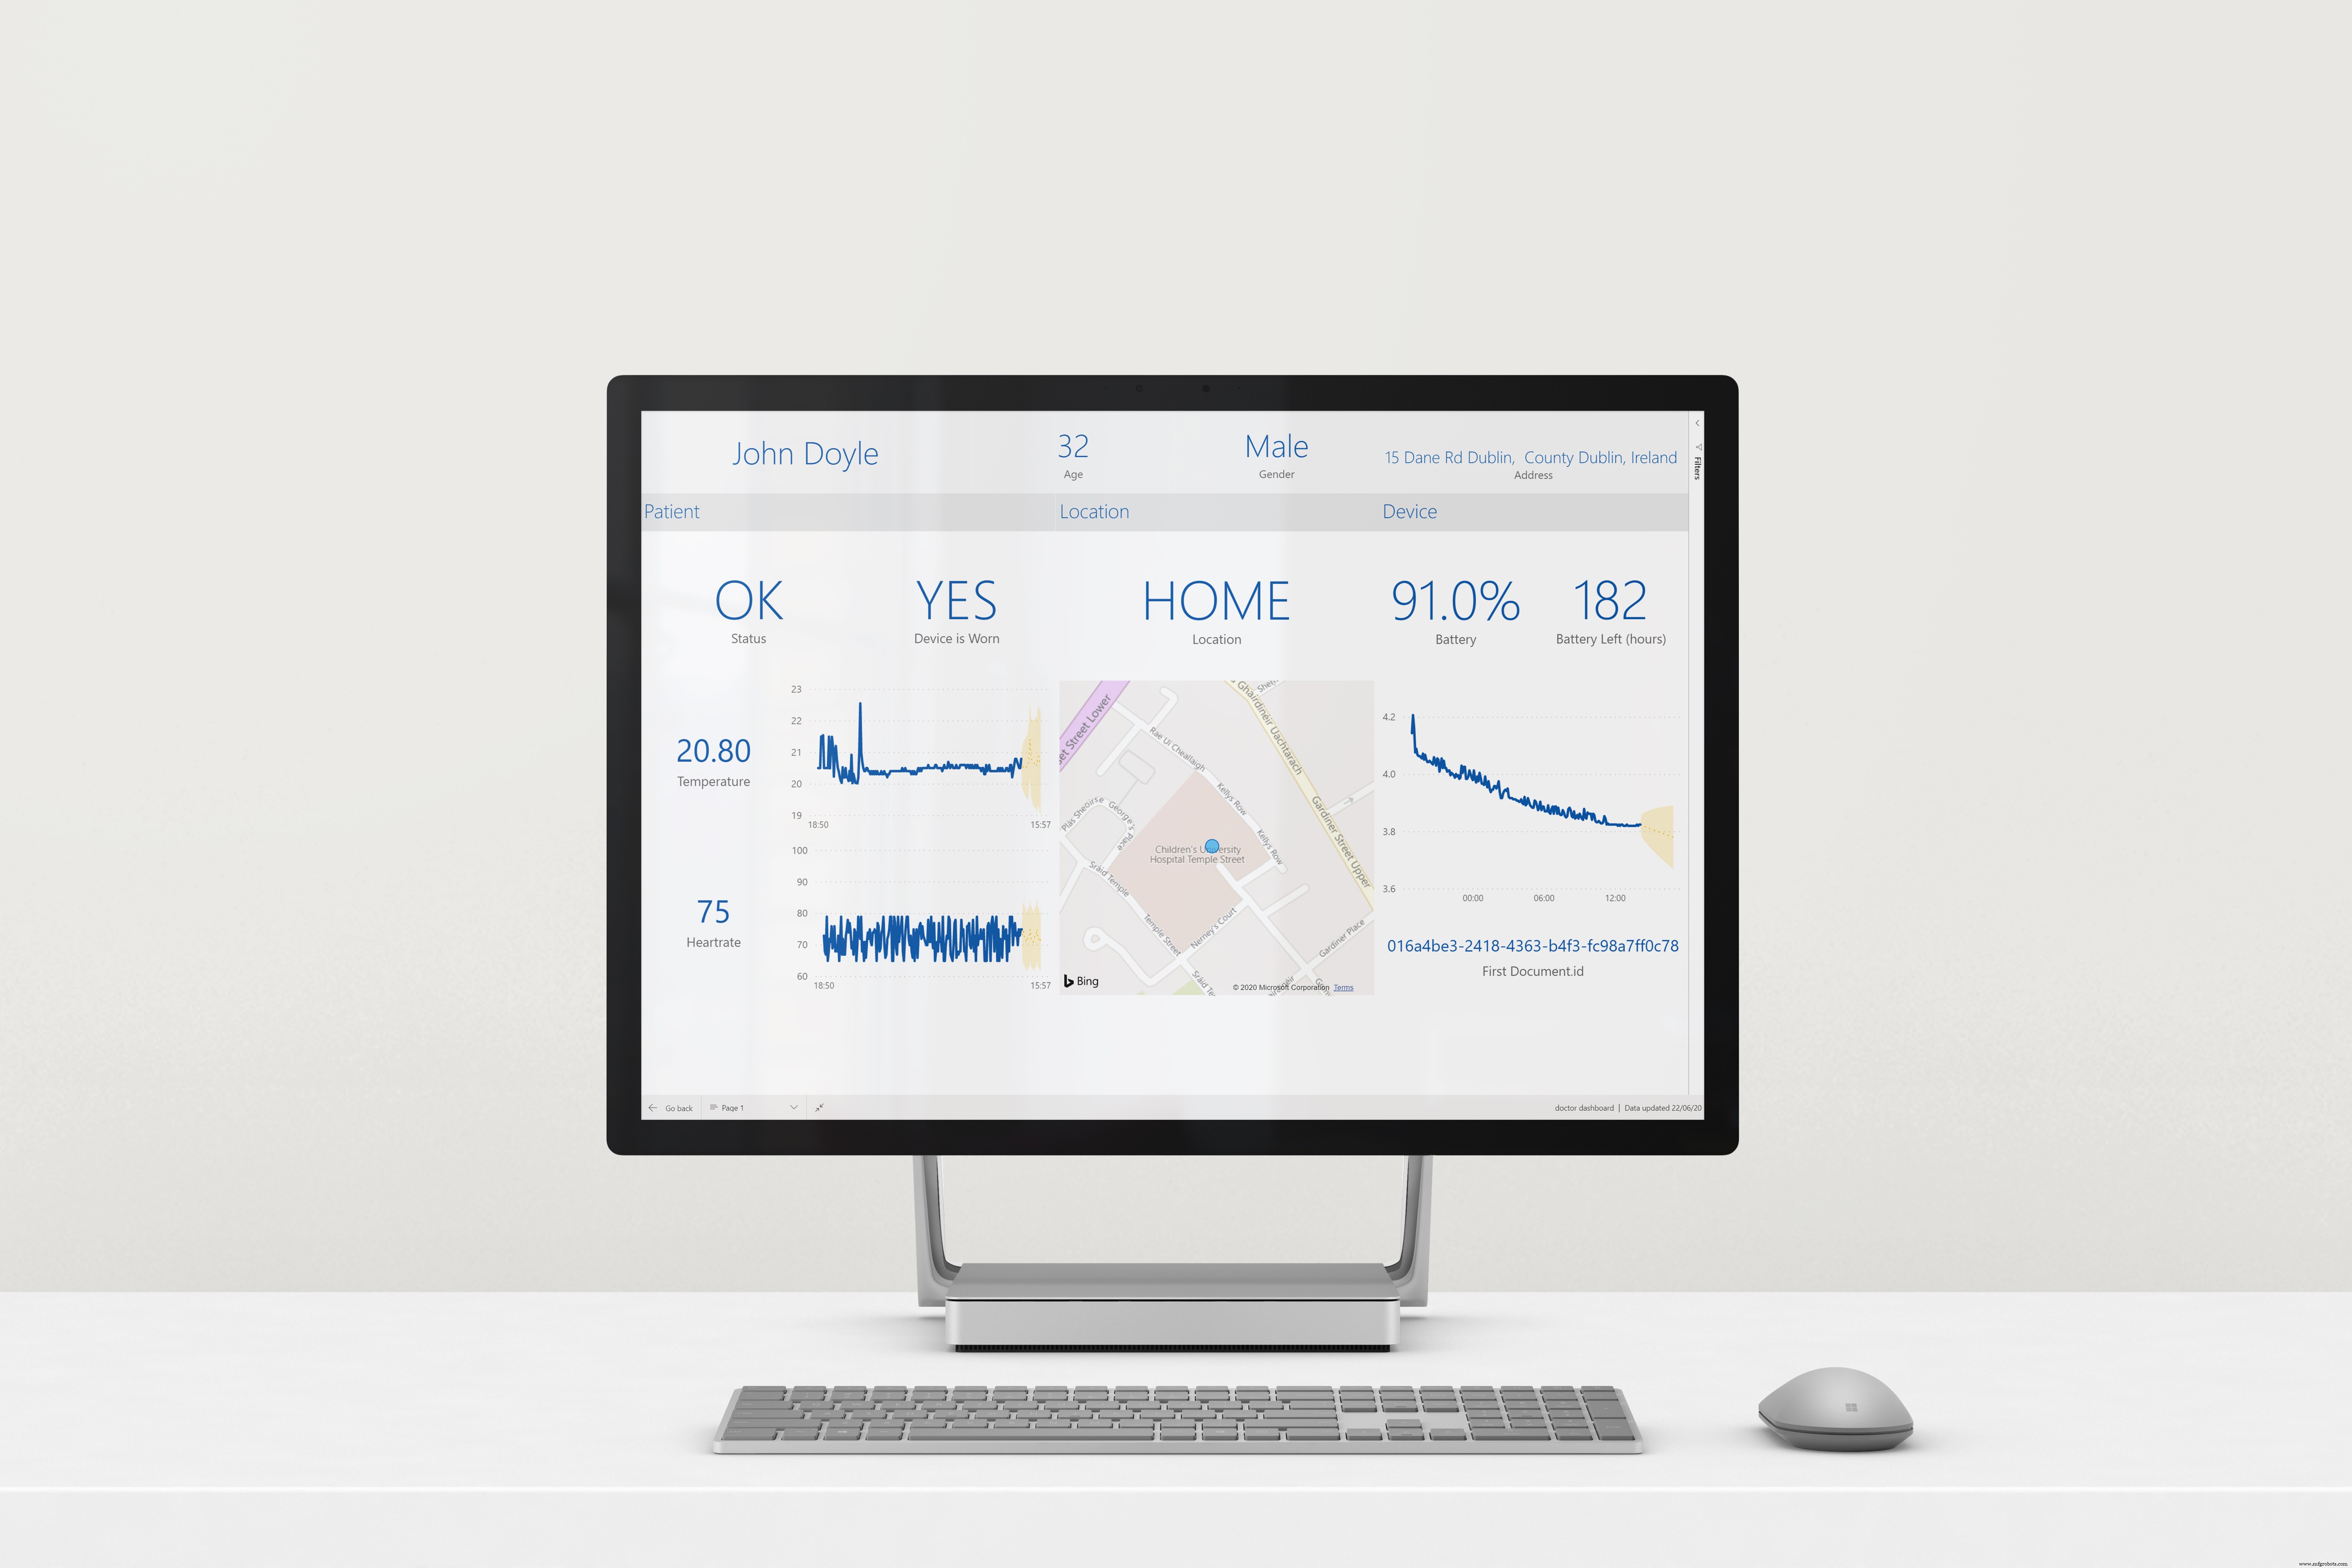
报告分为 3 个部分:患者 (提供有关生命体征的详细信息),位置 (患者的位置,如果在家)和设备 (电池电量,ID)。 机器学习 还用于在不久的将来预测患者的健康状况,向医生展示患者的健康状况是否会随着时间的推移而恶化。
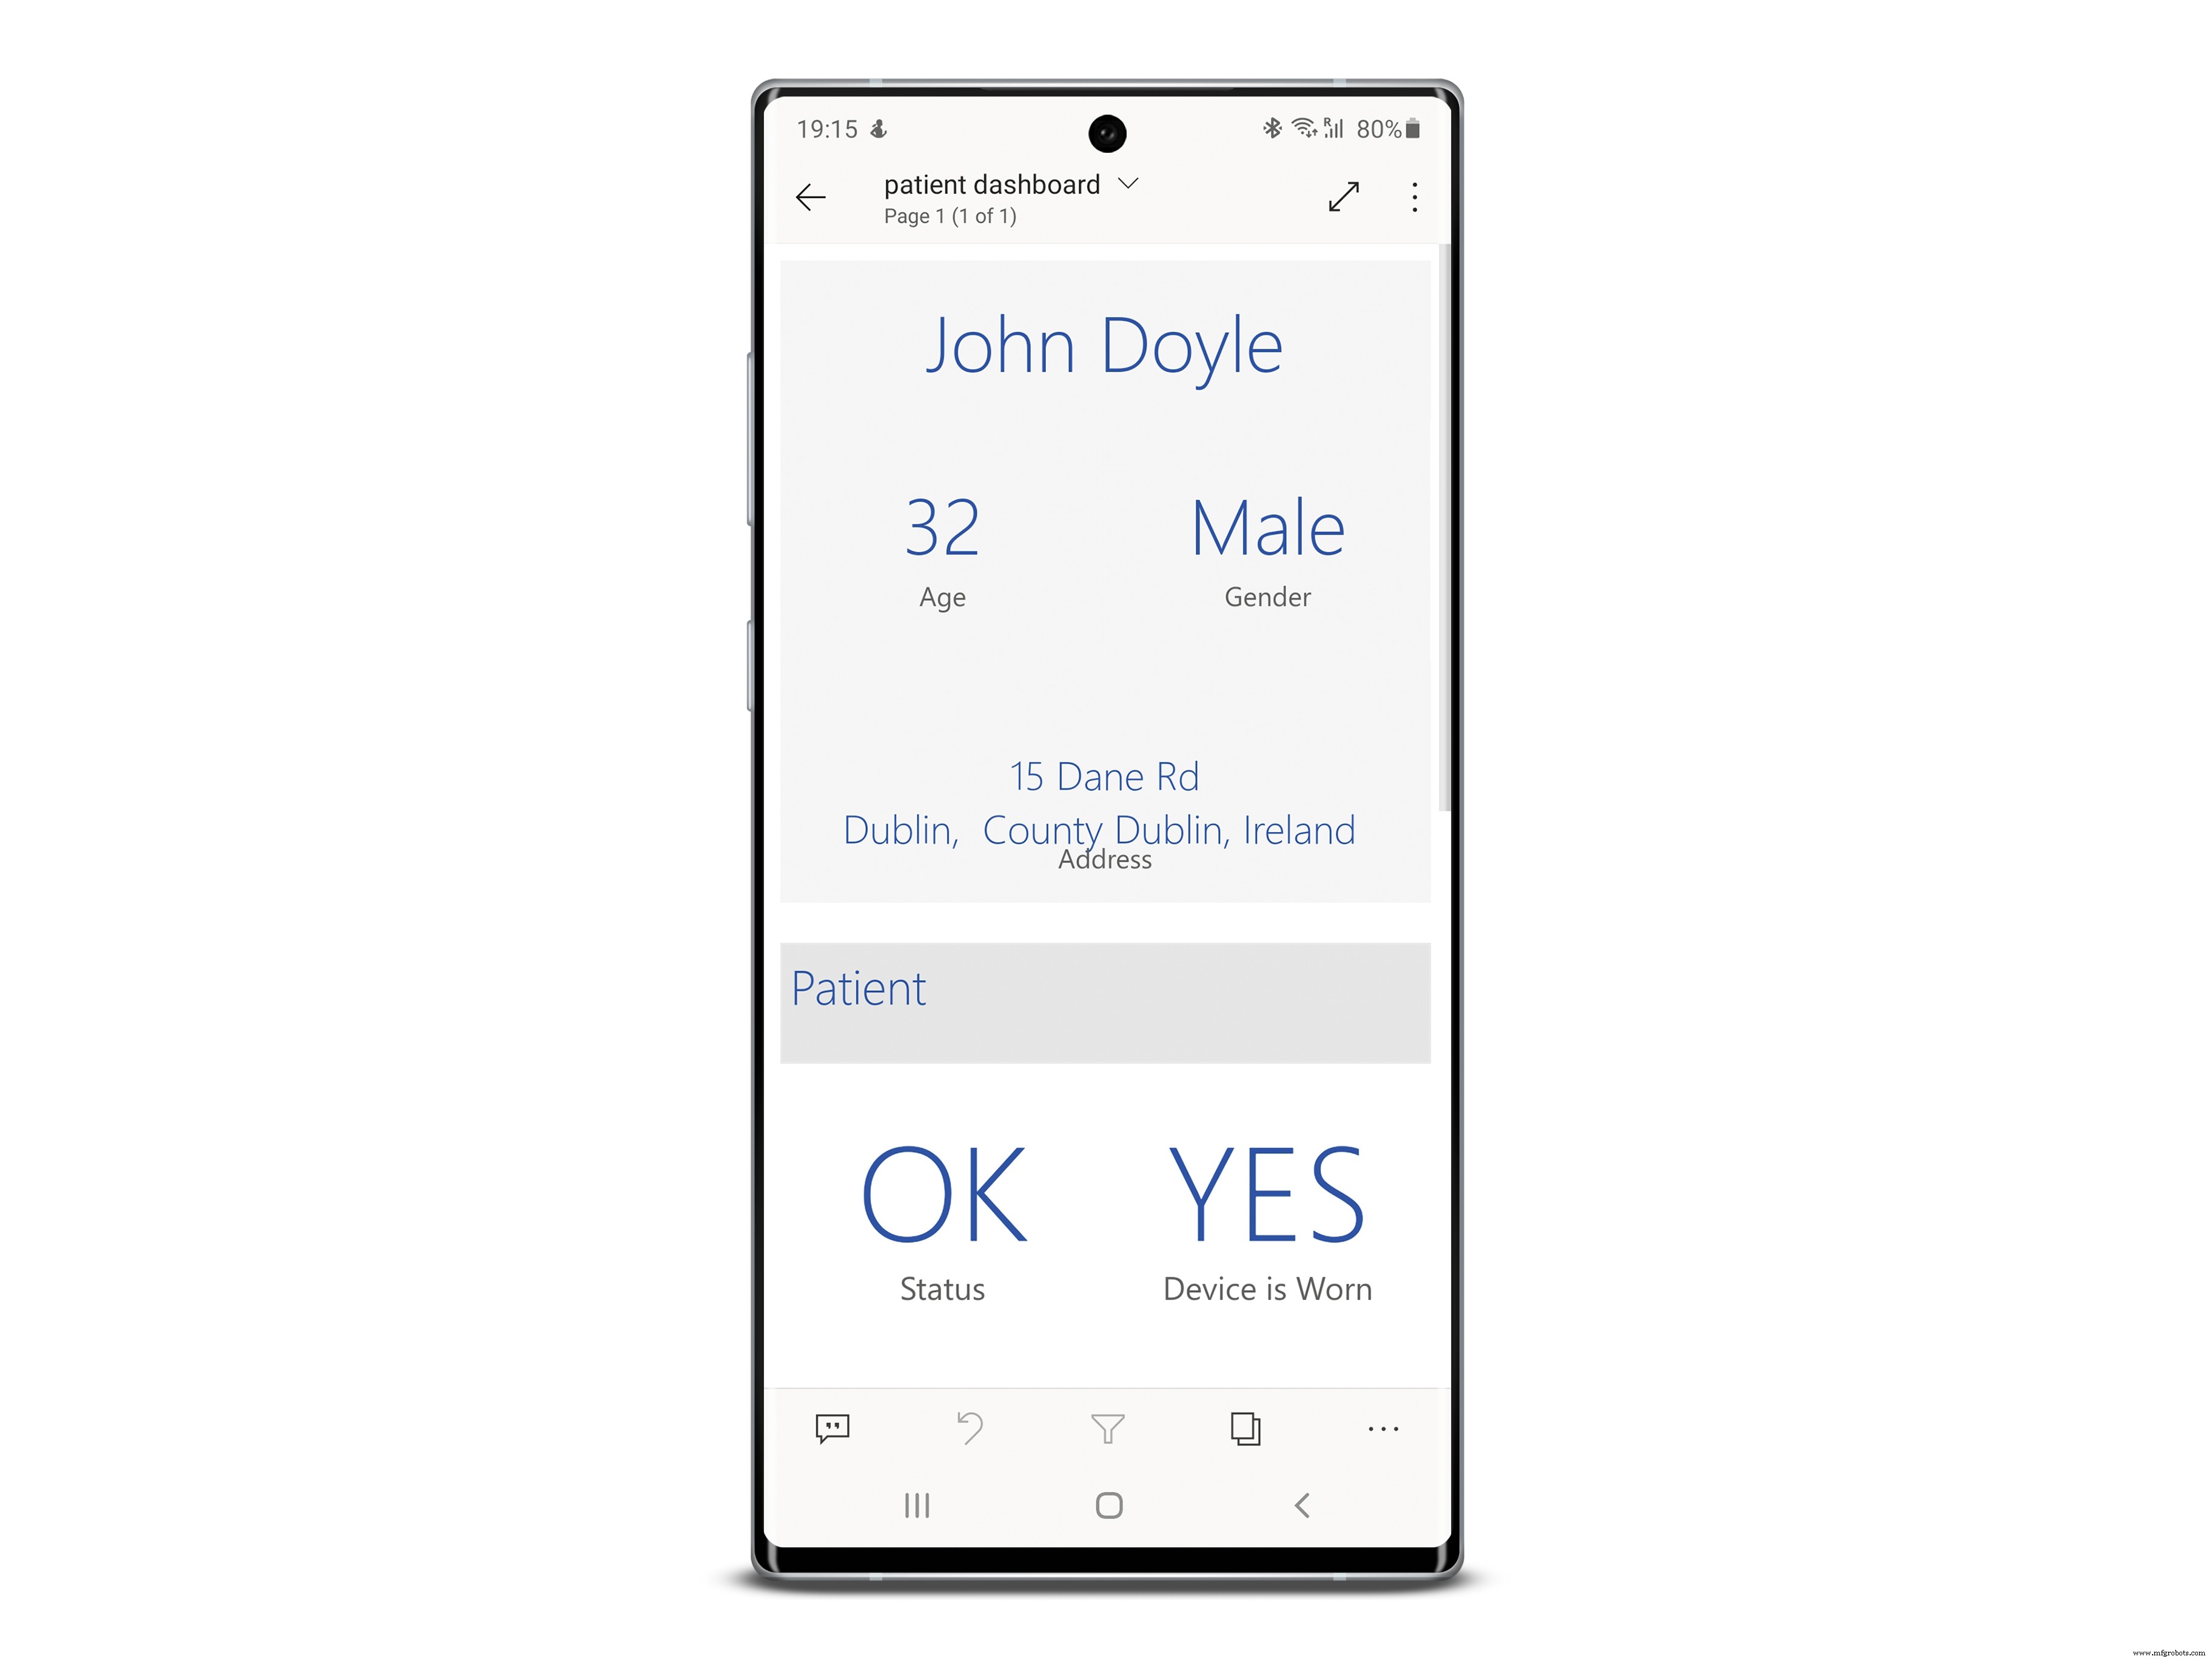
患者仪表板
我认为患者也应该能够访问这些数据以了解他们的行为并提高自我意识。患者可以使用桌面和移动体验,以便他们可以即时获取数据。
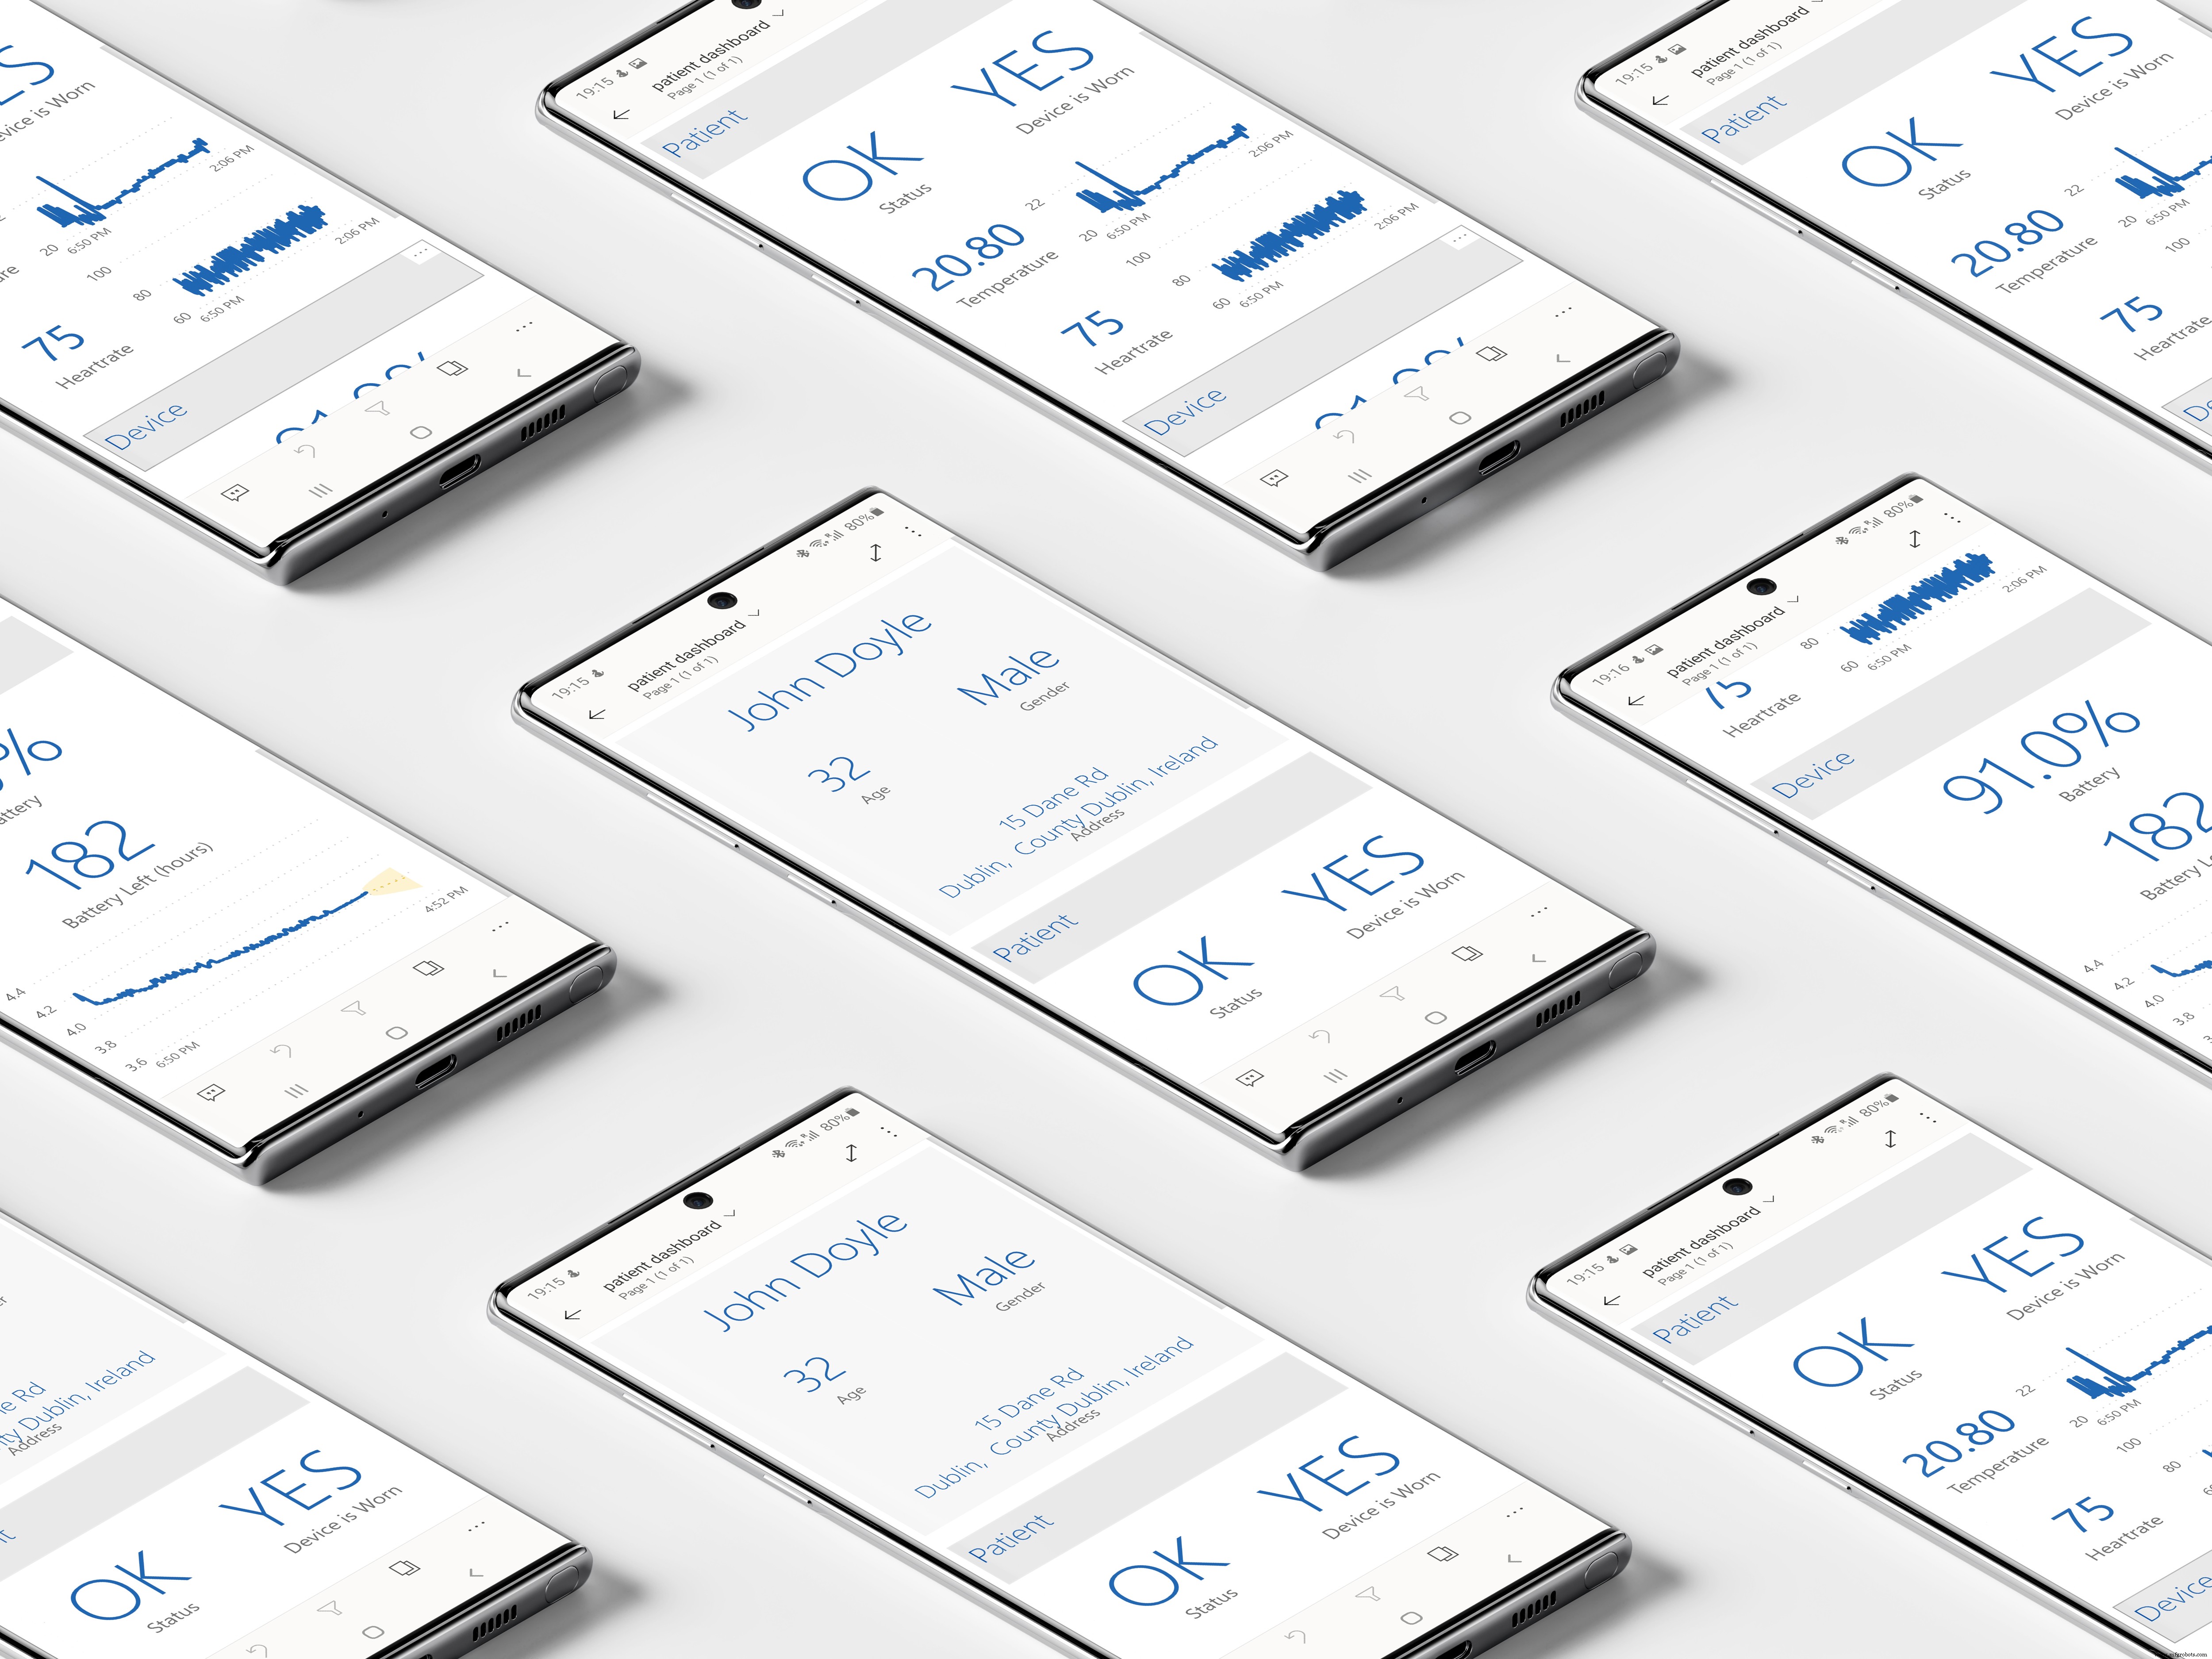
请注意,预测和地理位置数据不会显示在患者的仪表板上 因为他们不需要这些信息。
大规模生产和可扩展性
该设备价格小且易于构建,因此适合大规模生产和可扩展。该设备可以在世界任何地方使用,蜂窝覆盖可以保护全世界的人们。
100% 开源
在开发这个项目时,我确保所有使用的资产、库和其他资产都是开源的,以确保应用程序可以在没有官僚主义的情况下尽快开发和发布。该项目完全开源,可在 GitHub 上获得。
数据收集
该设备收集用户的地理位置数据,这些数据被视为机密。设备不会在本地处理这些数据,而是依靠云来安全地执行此操作,以确保用户的数据不会被劫持。与 Azure 数据库的连接经过加密且安全,确保数据不会落入他人之手。
走得更远
在开发这个项目时,想到了许多进一步开发和增强产品的想法,本节详细介绍了它们。
- 无需更改任何硬件即可实现血氧水平的收集,因为该值可以从现有的心率传感器中提取。血液中的 SpO2 水平表明病毒造成的损害。
- 可以通过放置在患者胸部和身体其他部位的电极垫收集患者的心率,这些电极垫可以提供更精确的温度表示,从而提高测量的精度。
- 在未来的迭代中开发 3D 打印外壳会更可取。设备的尺寸也可以显着减小,佩戴起来更加舒适。
应用前端

上图显示了在设备上运行的应用程序的架构。这些是设备每 5 分钟执行的步骤。设备收集所有数据 , 检查是否磨损 由用户然后打包并通过GSM发送到后端 .
该设备还跟踪时间 ,它从指定的服务器获取时间,并在第一次唤醒或关闭后将其板载 RTC 同步到此时间戳。
应用后端
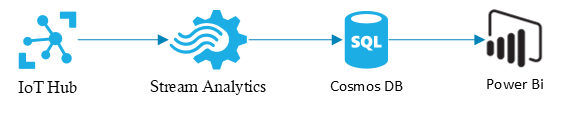
设备发送的数据在 Azure IoT 中心接收 安全交付的地方 . 流分析作业 然后从集线器中提取此数据并将其推送到 Cosmos DB 数据库。病人和医生Power Bi 报告 然后每隔一段时间从数据库中查询这些数据,运行机器学习算法,然后显示数据。 医生的仪表板 然后收集所有受监测的患者并提供他们的健康状况简介。
为什么选择 Azure?

我喜欢使用 Azure 而不是其他替代方案,因为它易于使用和导航,并且提供了很棒的免费开发计划。我也喜欢他们的用户界面以及与我使用的其他 Microsoft 产品的集成。
市场调查
许多国家一直在实施替代方法来替代在家中自我隔离的冠状病毒患者。台湾实施了革命性的追踪系统 通过手机跟踪患者 以确保他们呆在家里。
其他国家也实施了监控自我隔离人员健康的想法,并且一些系统比其他系统运行得更好。但是没有任何产品能够在一个小巧、舒适的包装中同时收集有关患者状态和他/她的位置的重要信息。
目标受众
该设备适用于因弱型病毒检测呈阳性或无症状而被医院派往家中进行自我隔离的人。
使用智能腕带的好处
- 确保患者被送往自我隔离 待在家里
- 监测患者的生命体征 无需他们住院
- 解放医院的空间 对于有严重病毒表现的人
- 提醒医生 25/7 自我隔离的所有患者的状态
- 提供舒适的监控解决方案 为病人
- 为医院提供预测 病人的健康
- 告知患者他们的健康状况 通过移动和桌面仪表板
- 性价比高 和可扩展
项目实施
本节将指导整个项目的构建,并将涵盖开发此应用程序所需的步骤。
第 1 步:将所有内容放在一起
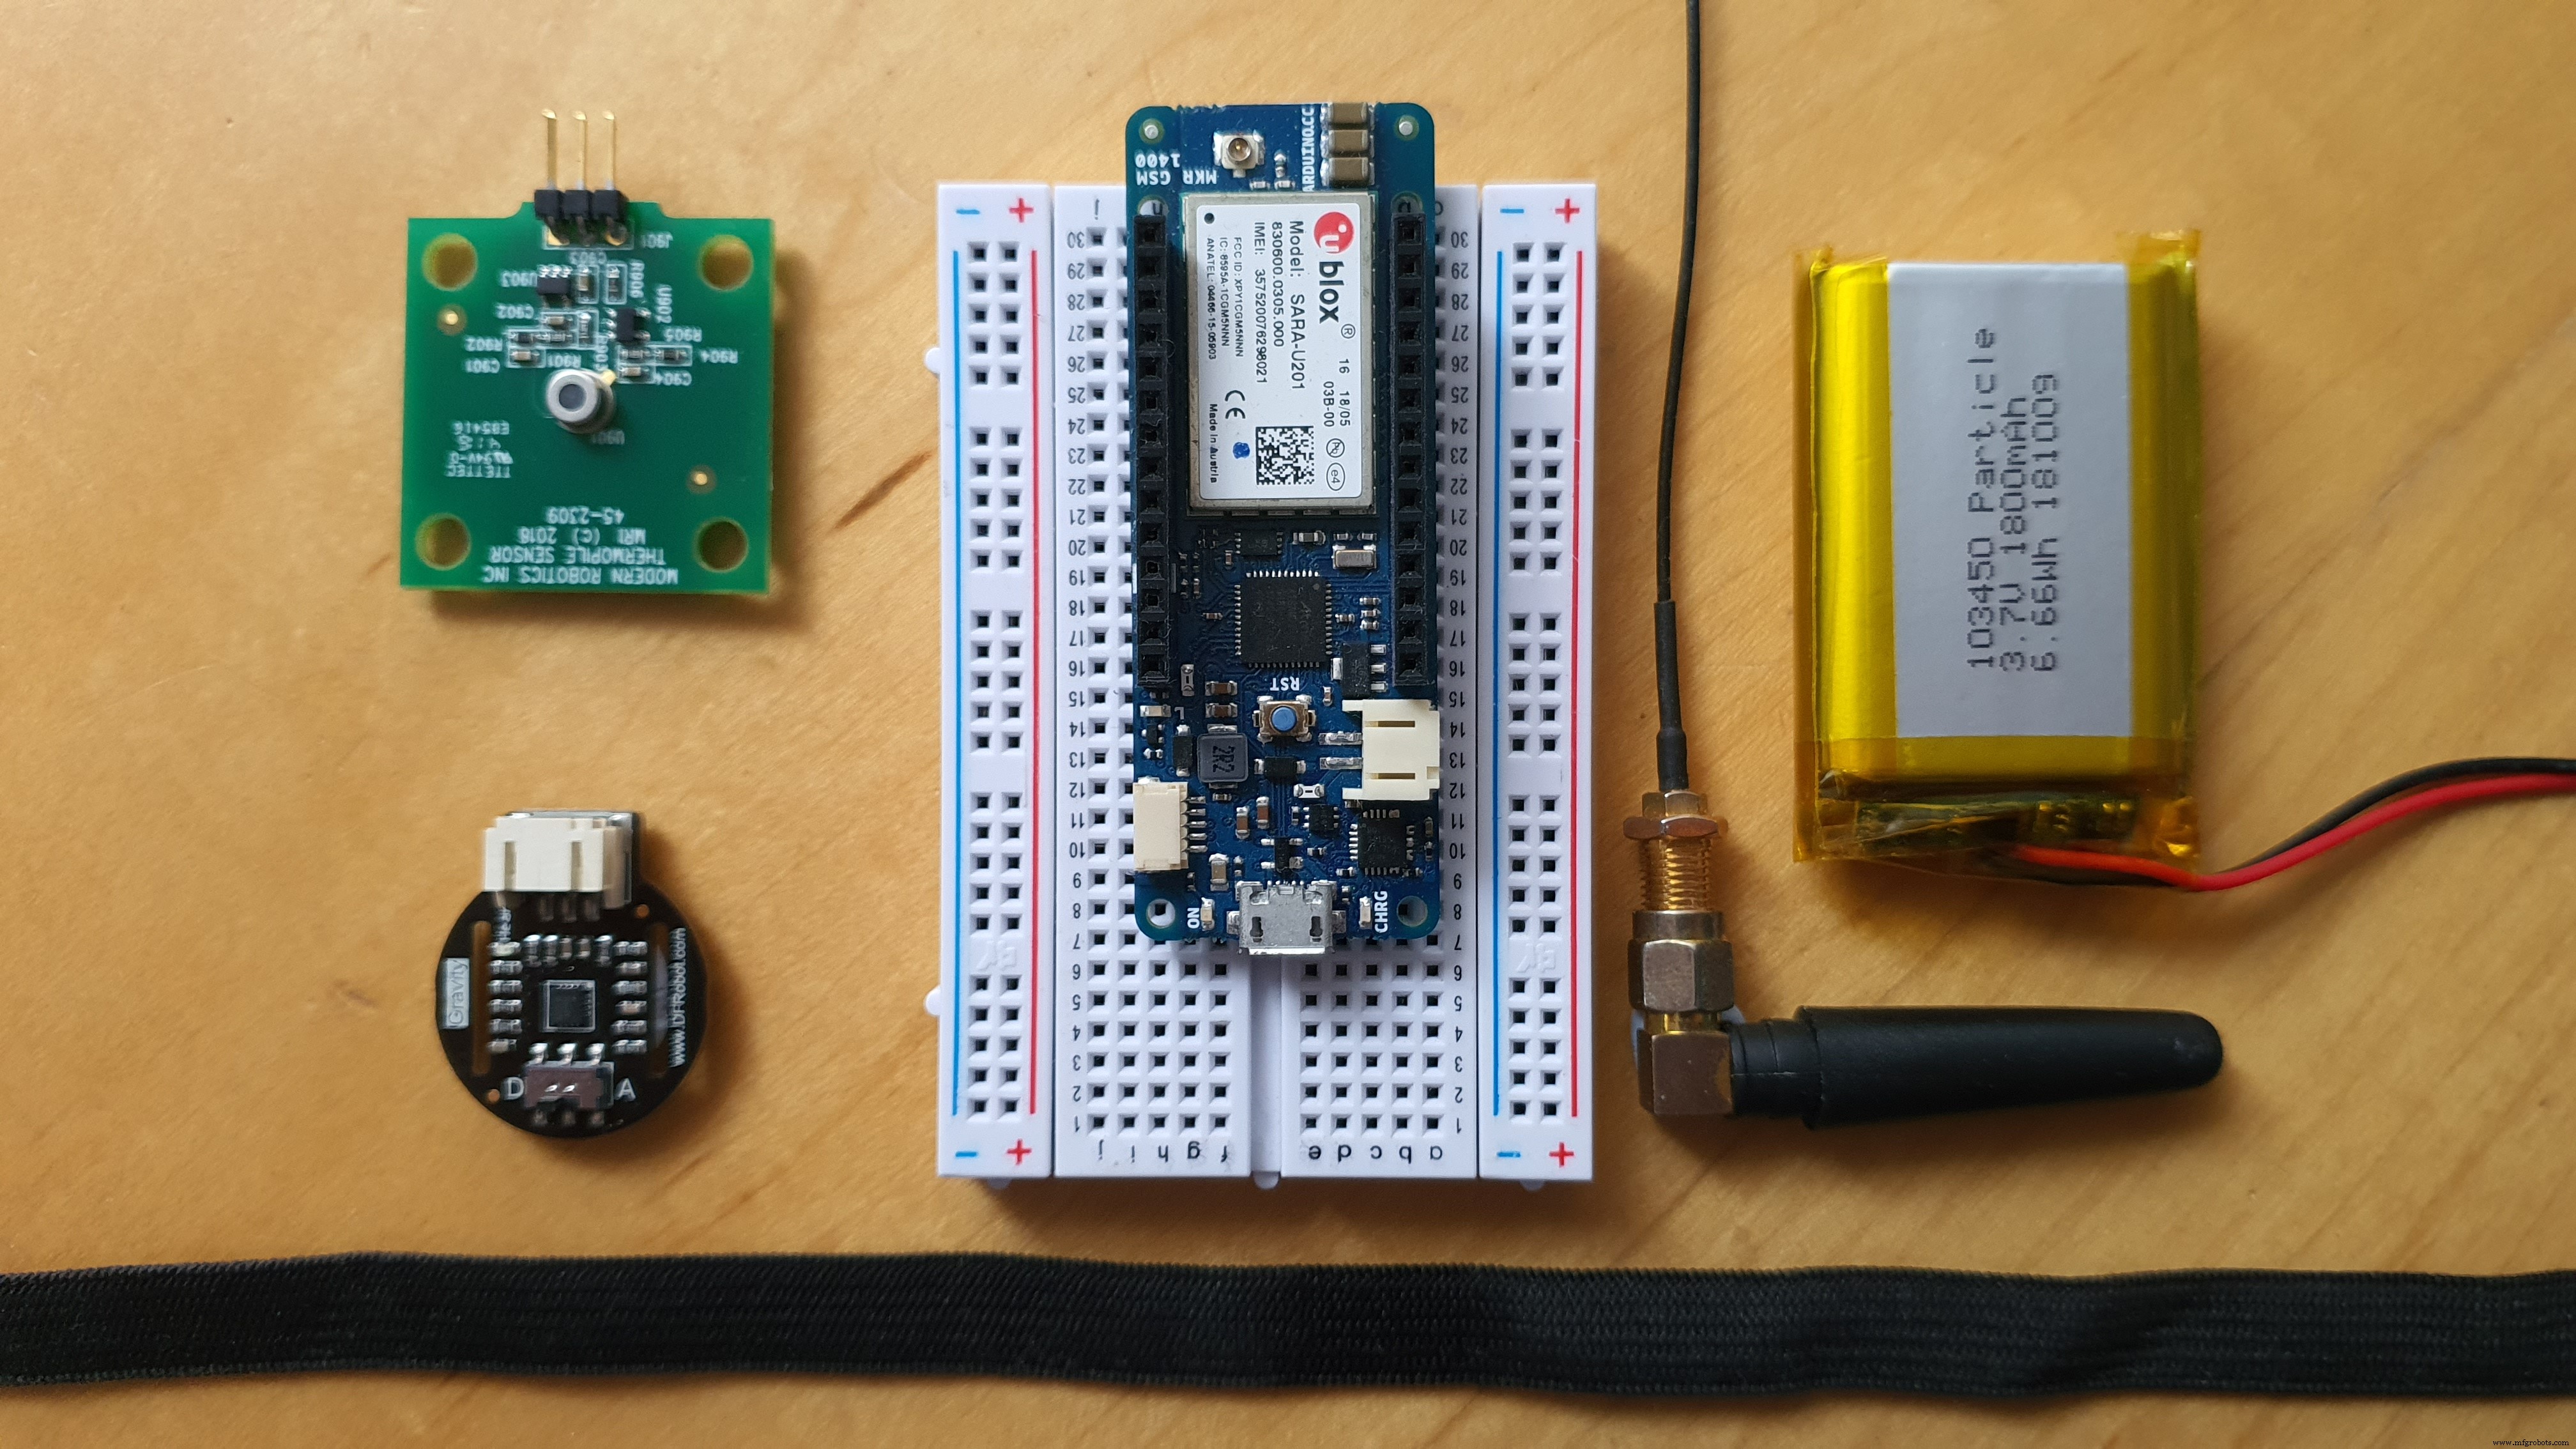
我们需要做的第一件事是将所有需要的组件放在一起。下面列出了所需的组件和服务:
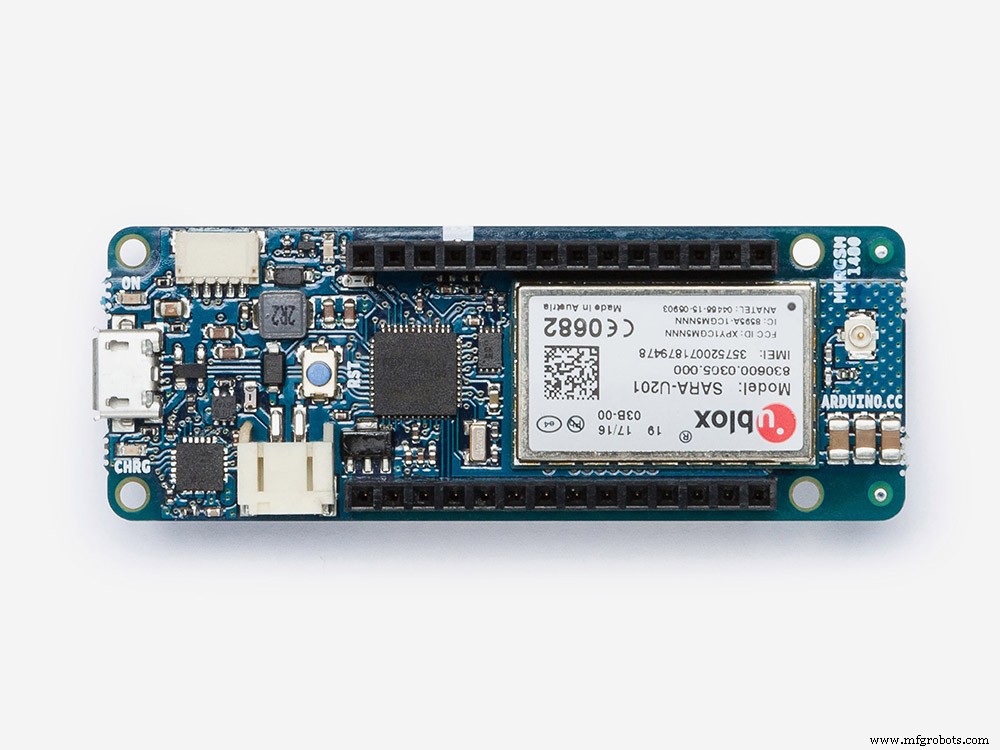
- Arduino MKR GSM 1400
- GSM 天线(与 MKR GSM 一起提供)
- DFRobot 心率传感器
- 红外温度传感器
- 3.7v LiPo 电池(我用了 1 个,800mAh)
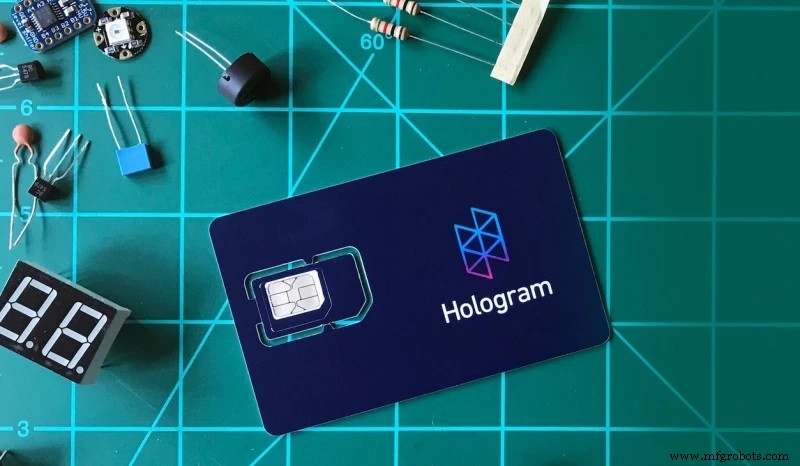
- 全息 SIM 卡
除了所需的硬件之外,在我们开始项目之前,还必须设置几个服务。使用下面链接的教程开始。
- 获取 Arduino IDE 或使用 Web 编辑器
- 创建您的 Hologram 帐户并连接您的 SIM 卡
- 创建 Azure 帐户
- 创建 Power Bi 帐户
第 2 步:使用 MKR GSM
在我们开始制作项目本身之前,我们需要配置 MKR GSM 以连接到 Azure IoT .为此,我们需要生成并存储证书 在设备上能够验证与后端的连接。
有一个关于 Hackster 的教程涵盖了 MKR NB 的这一点。请从头开始学习本教程,并注意您应该在生成证书后停止 .请确保保存 SHA1 字符串 因为我们稍后会需要它。教程在这里。
第 3 步:将所有内容连接在一起
接下来我们必须做的就是把所有东西都连接起来。下面是描述原理图的图像 用于创建此项目。请注意,您的组件可能与原理图中的不同。确保您将温度传感器连接到 A4 在设备和心率传感器到 A5 . 别忘了把 SIM 卡放进去!

第 4 步:进入 IoT 中心
好的,现在我们已经完成了所有这些,我们可以继续使用 IoT 中心 .我们将在后端工作 在接下来的几个步骤中,首先要解决这个问题。 在继续之前确保您拥有 Azure 帐户。
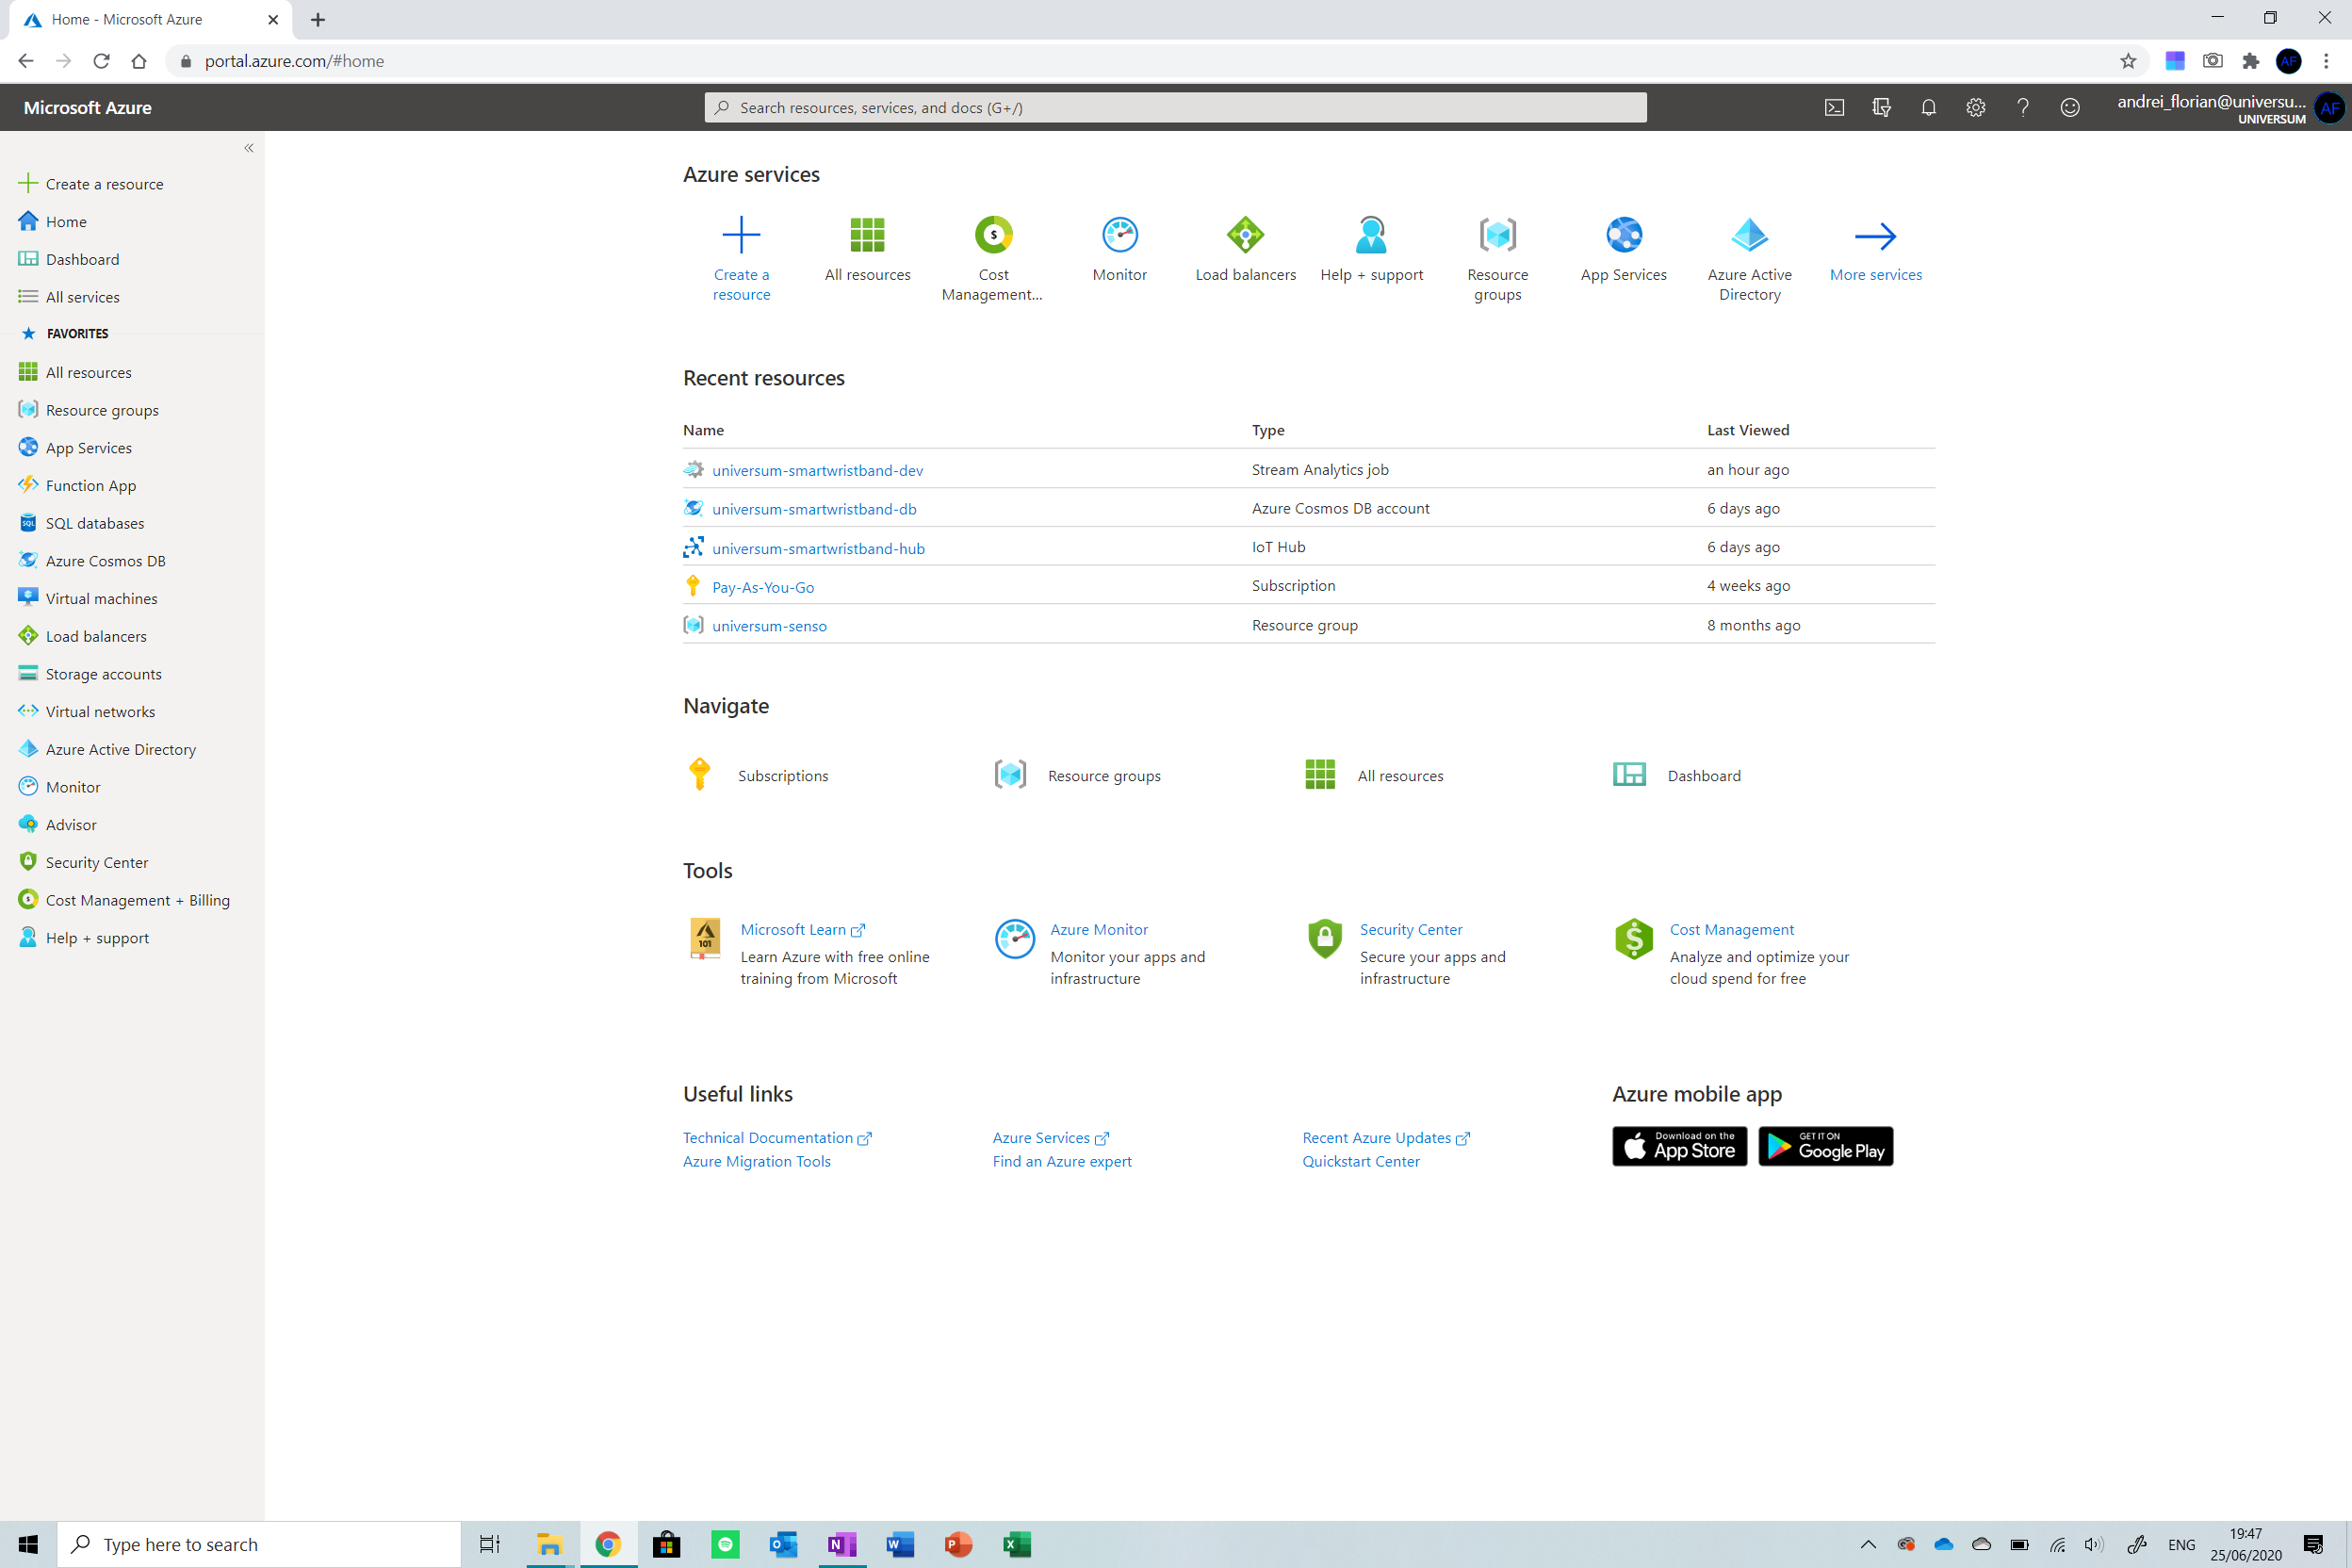
您需要做的第一件事是导航到您的控制台 (portal.azure.com) 并点击创建资源 屏幕左上角的按钮。现在输入 IoT 中心 并从下拉列表中选择选项。
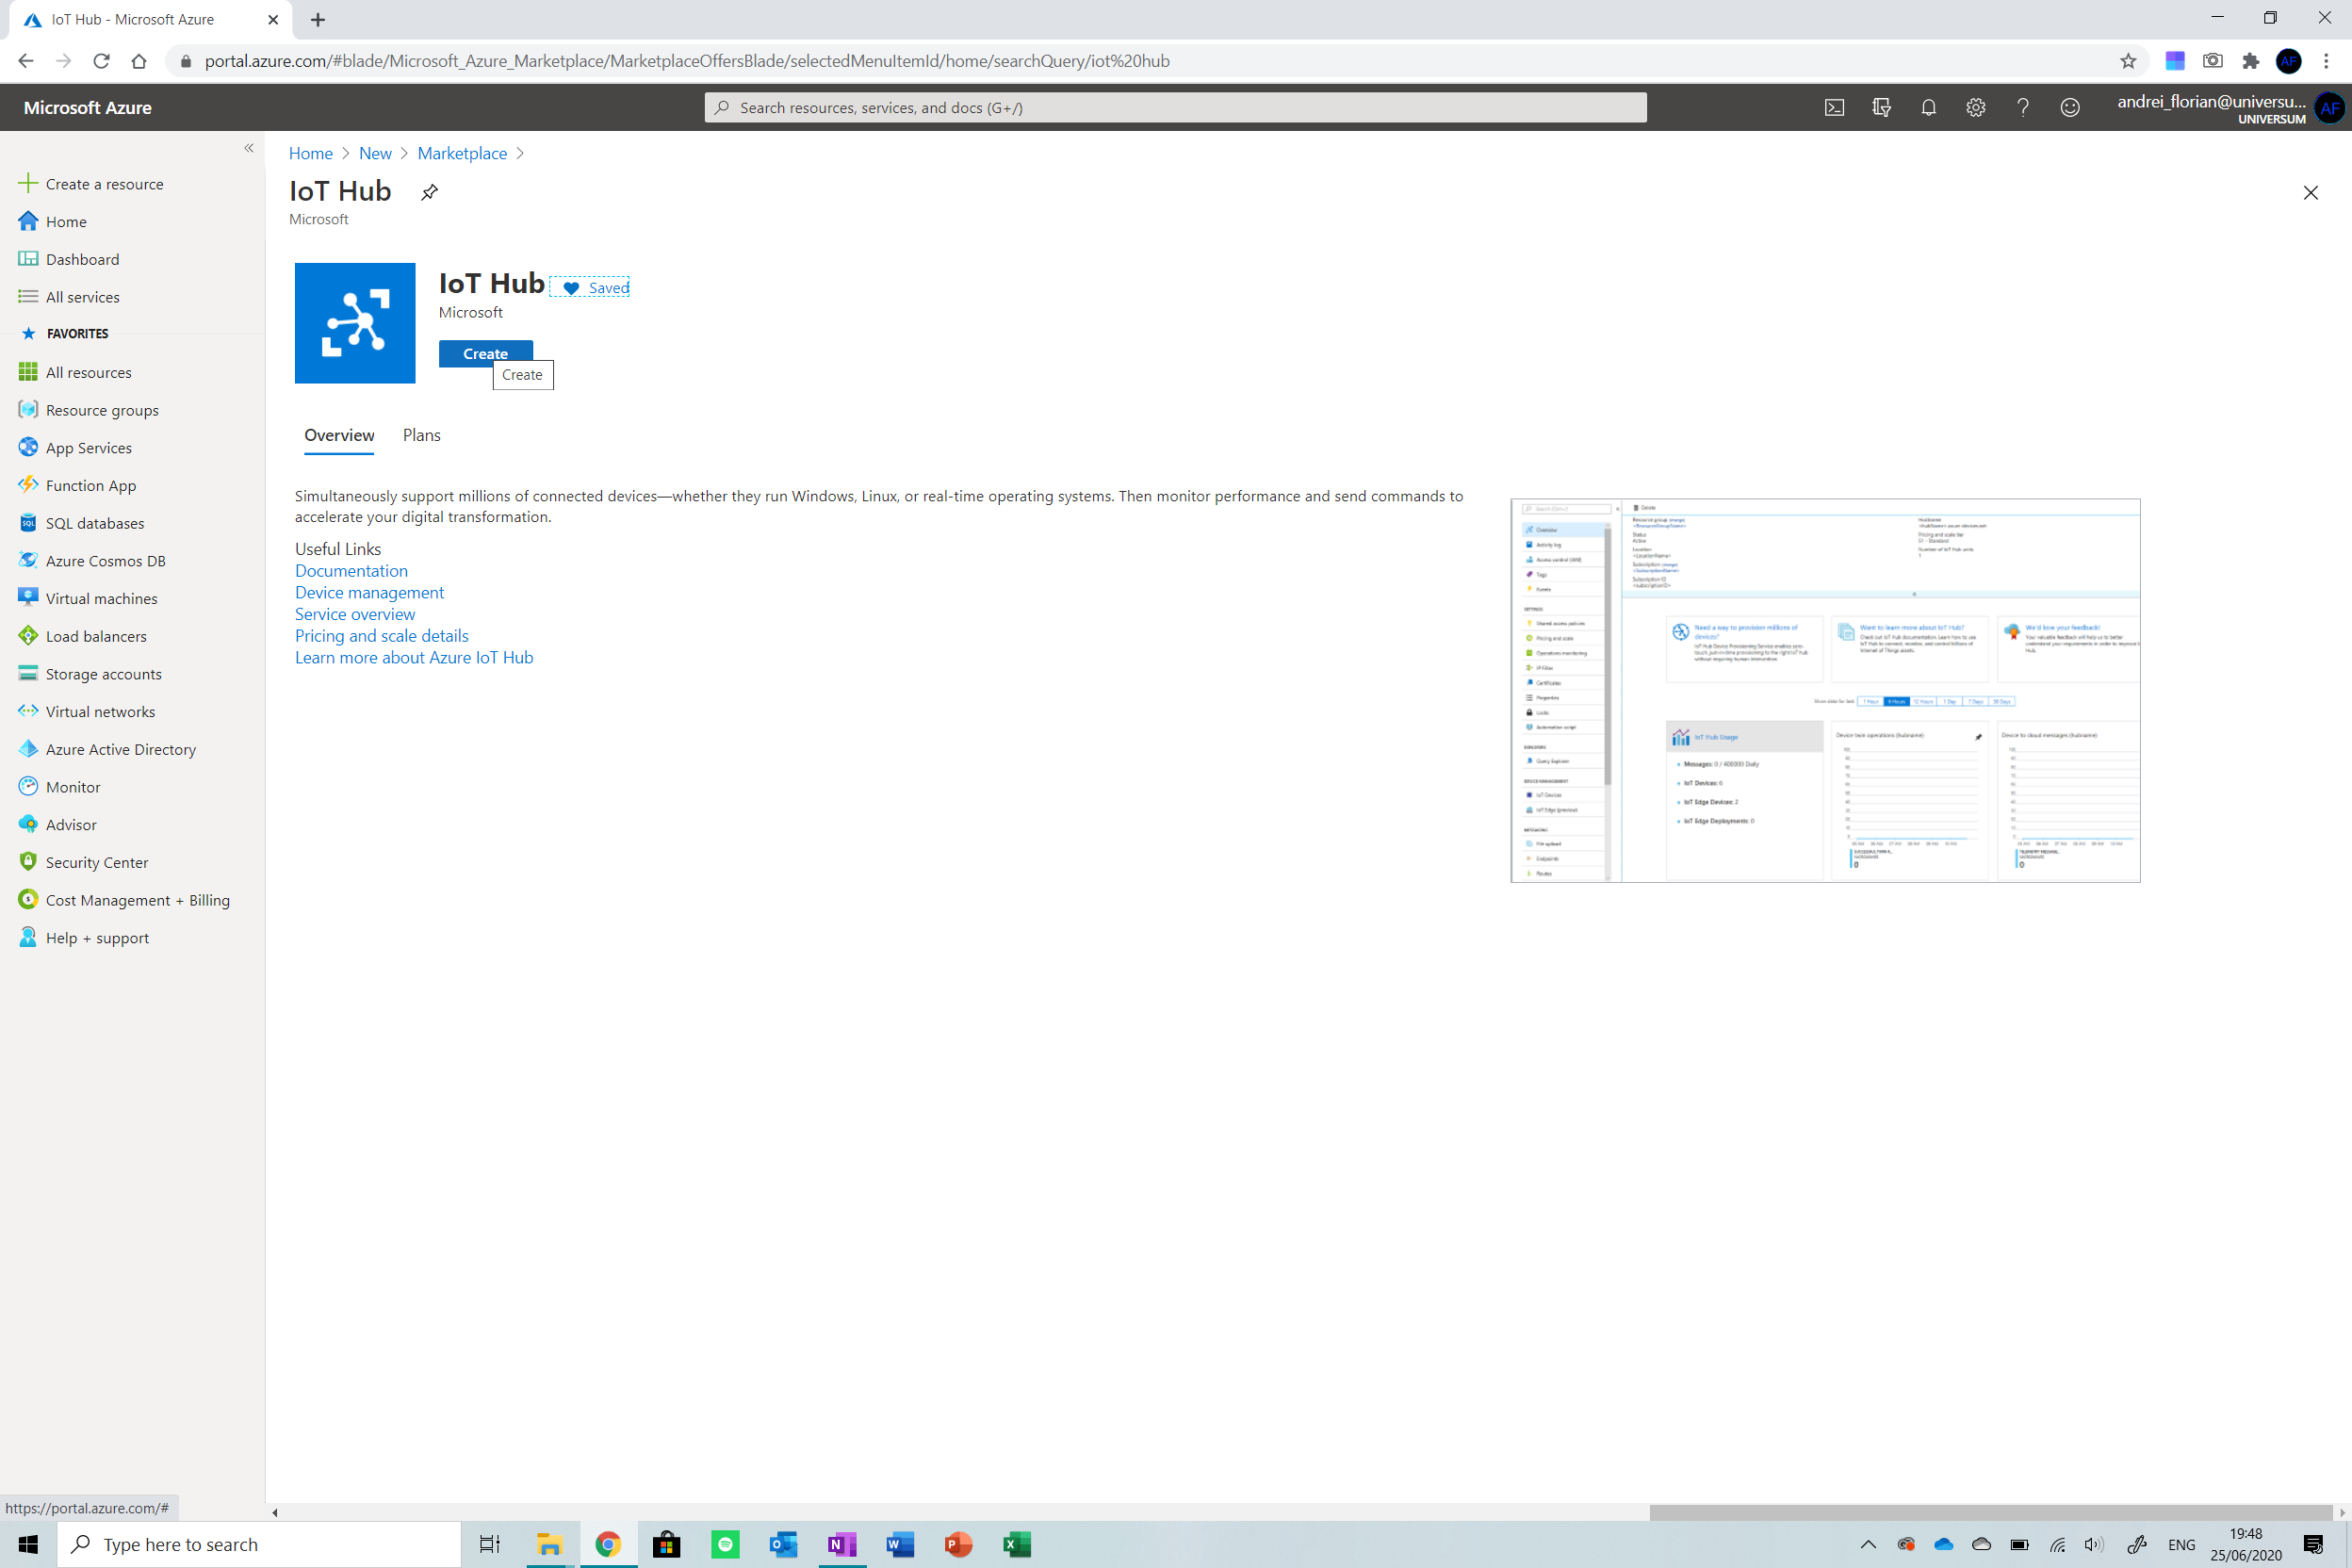
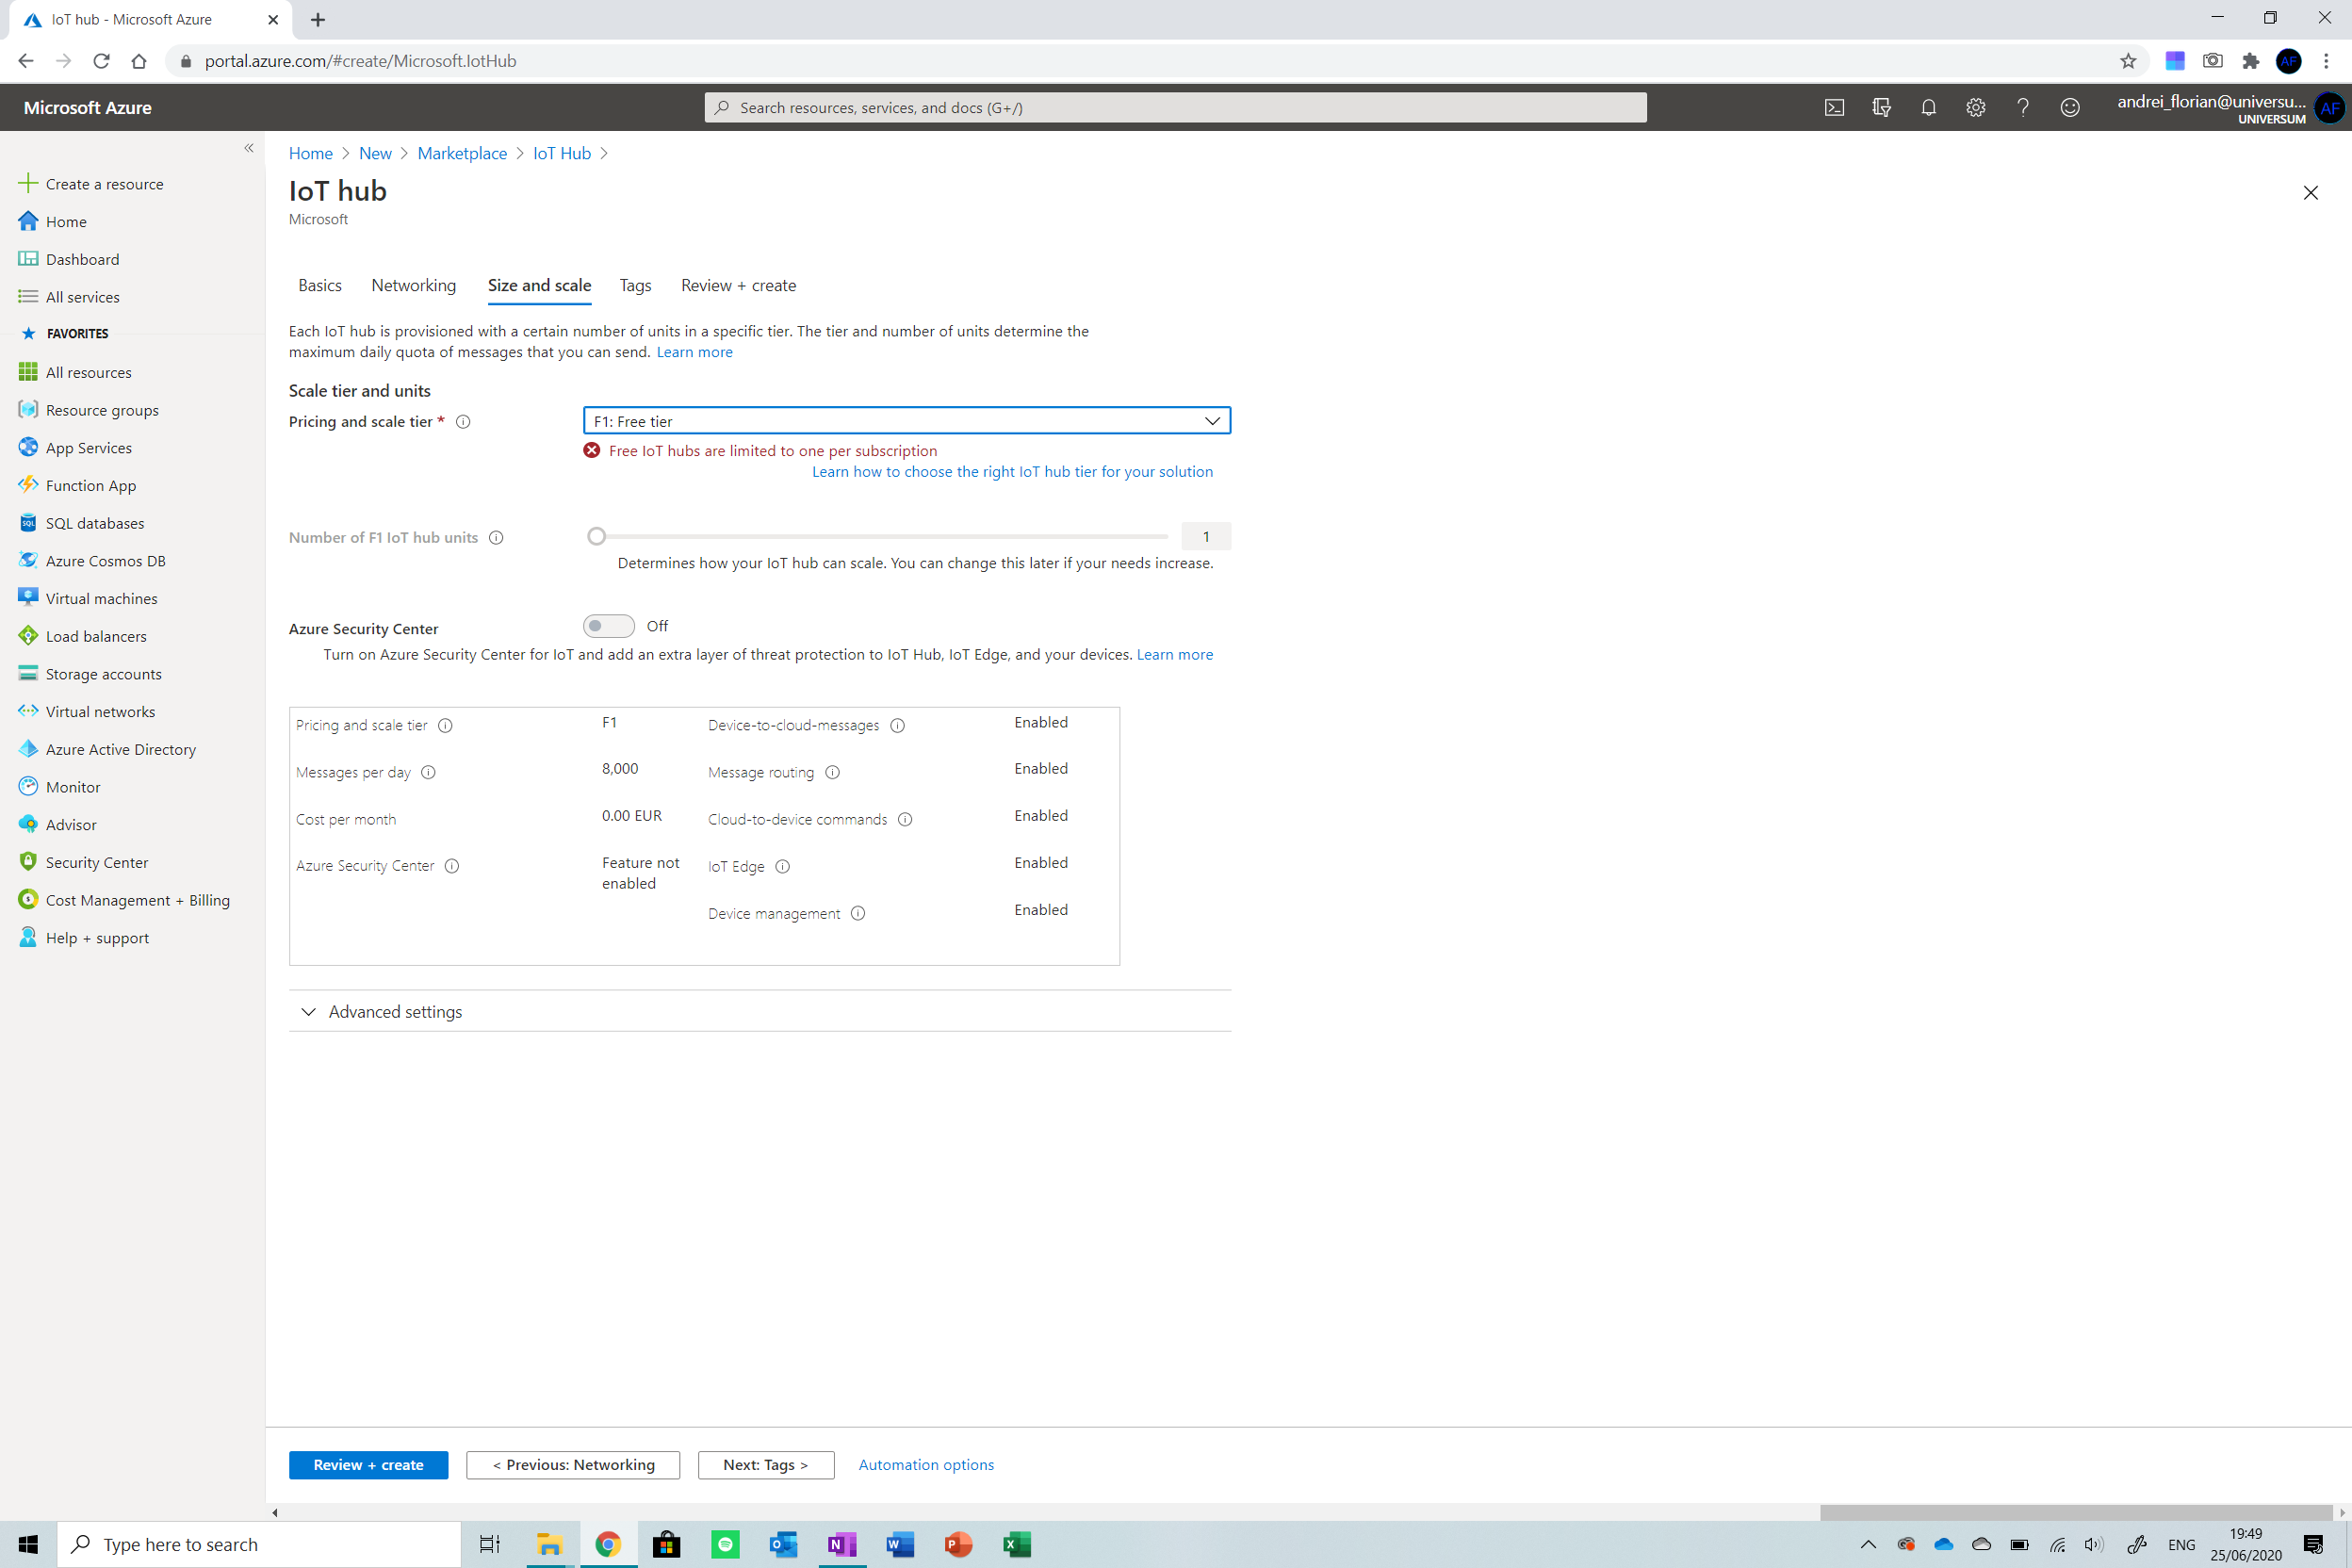
点击创建 设置完成后。请注意,在此示例中,我们将使用免费层 IoT 中心 以便我们不会对其使用收费。如果部署此解决方案,考虑将层更改为 S1 (或 S2/S3 取决于规模)。
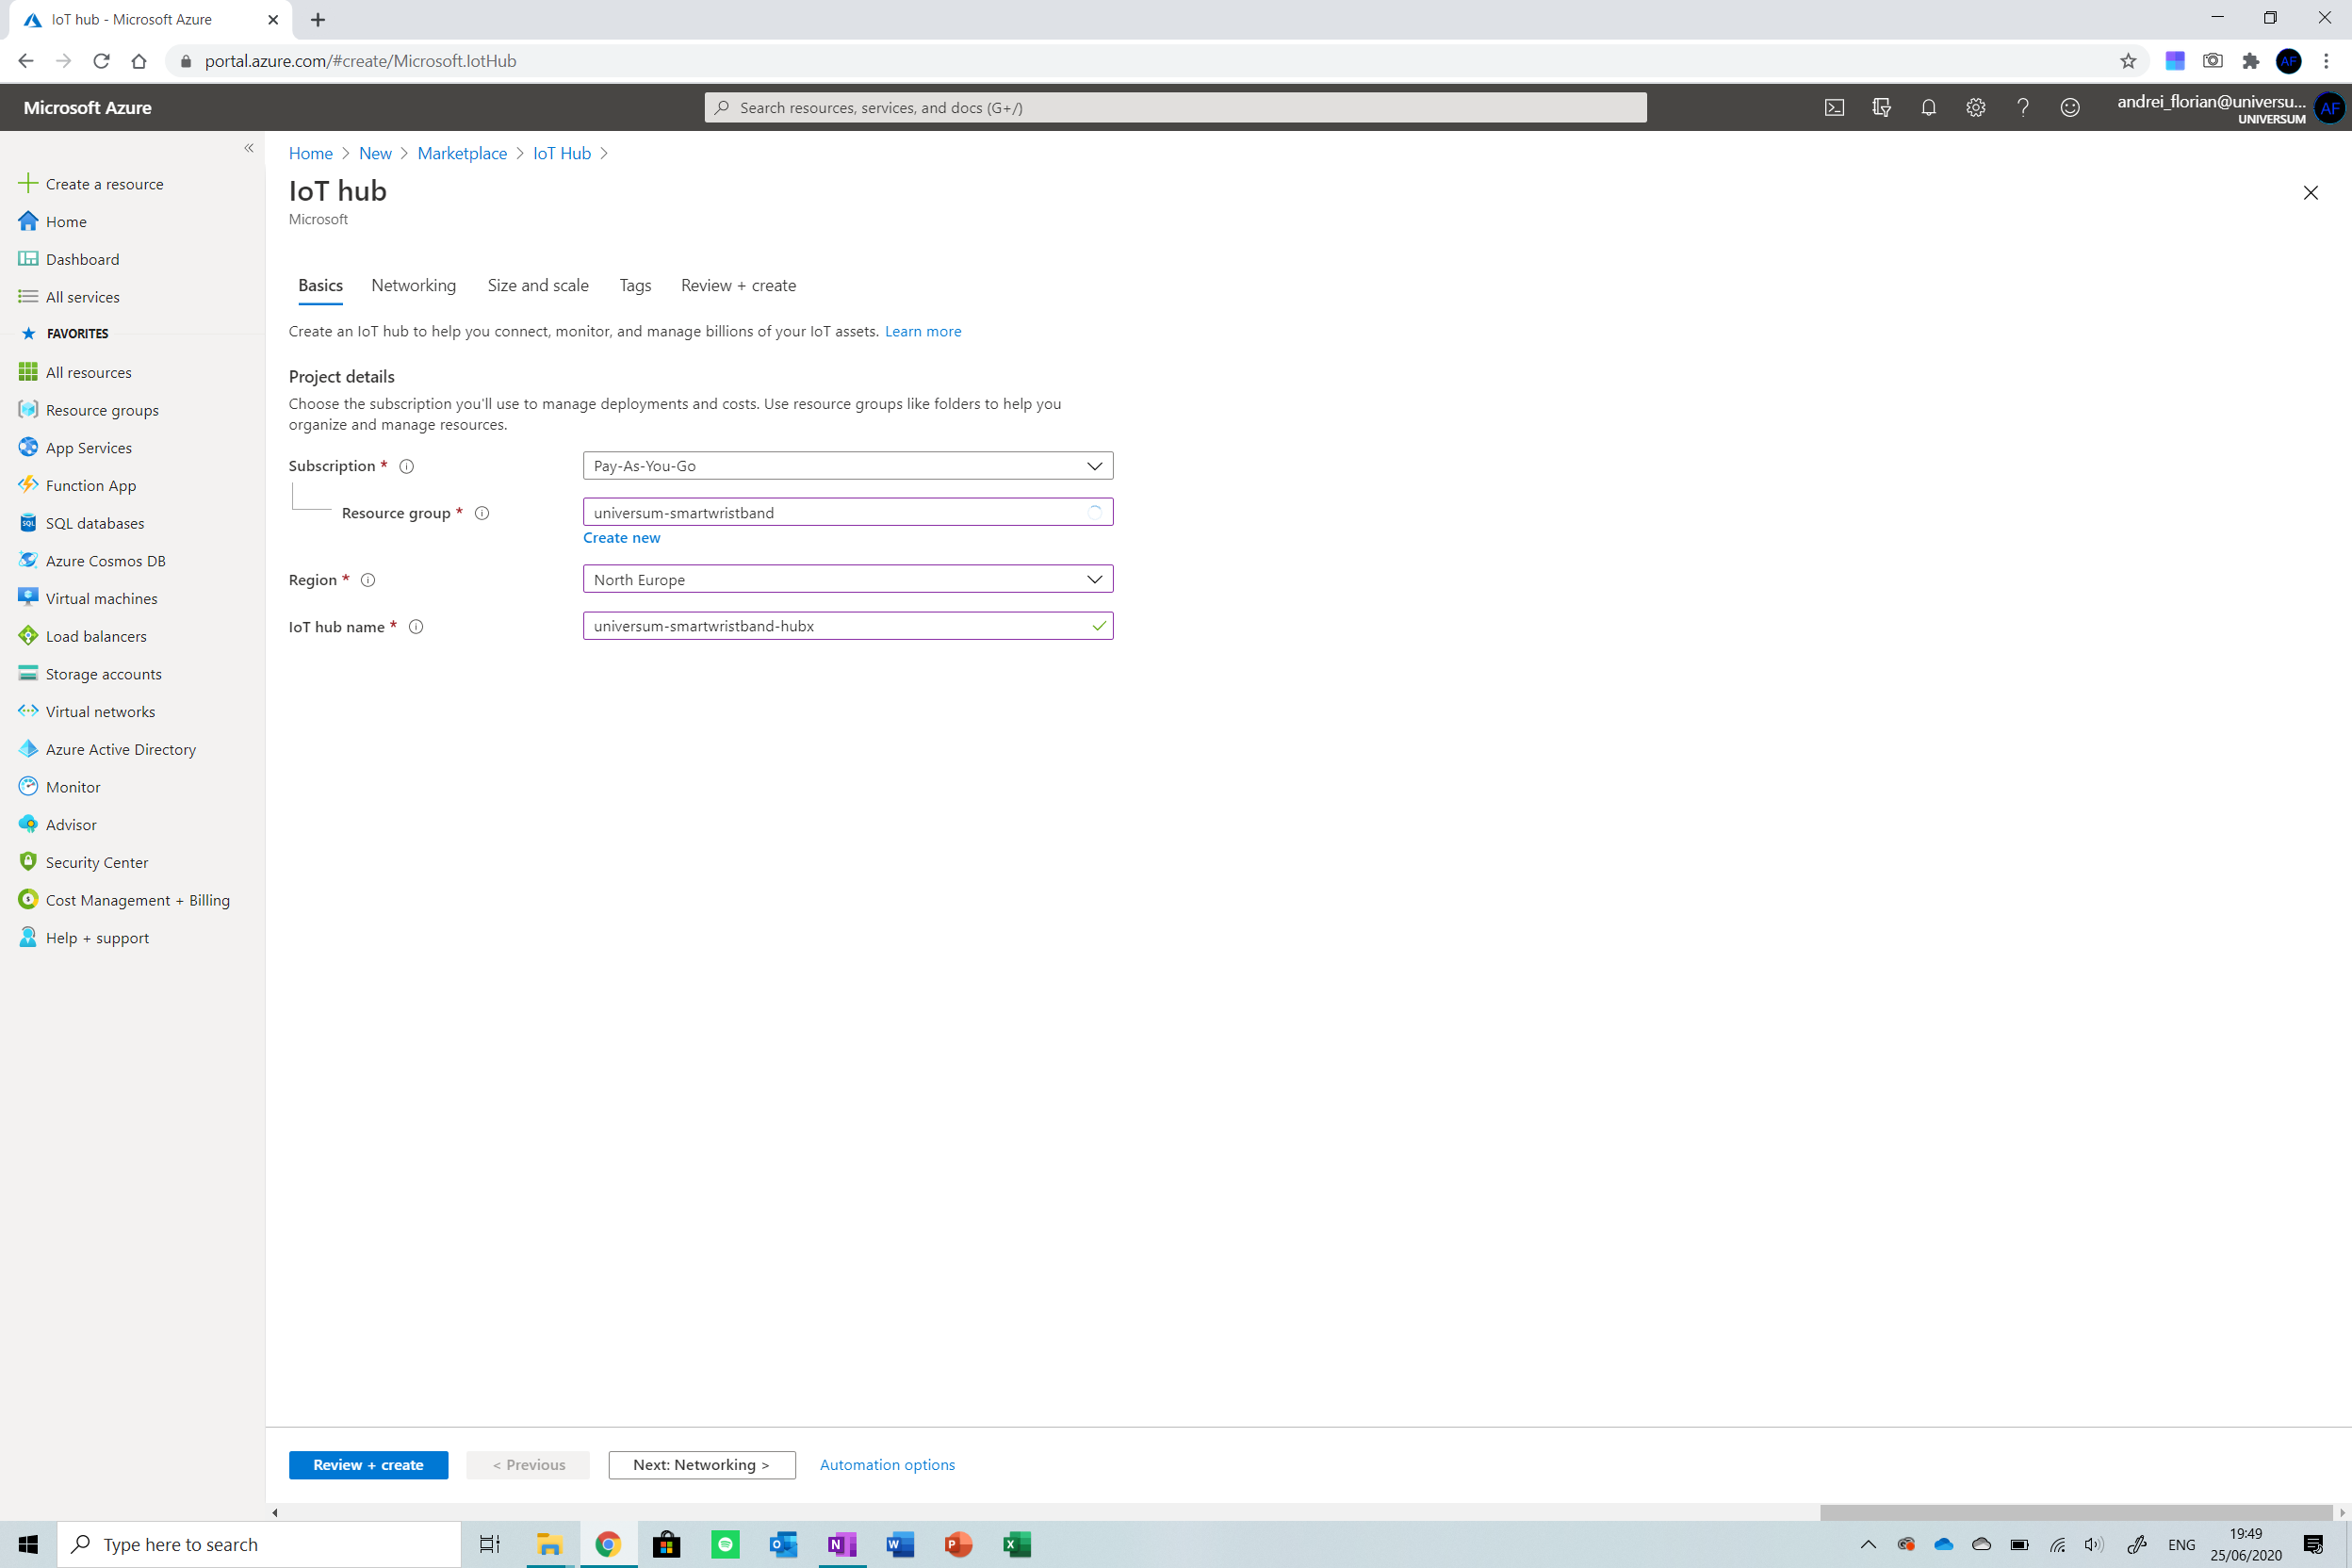
创建一个新的资源组并命名您的 IoT 中心。 现在点击大小和比例 从上述步骤中选择。确保您的设置如下。
现在点击查看并创建 并部署资源 .等待 IoT 中心创建,然后 openit 点击所有资源 从屏幕右侧的菜单中。
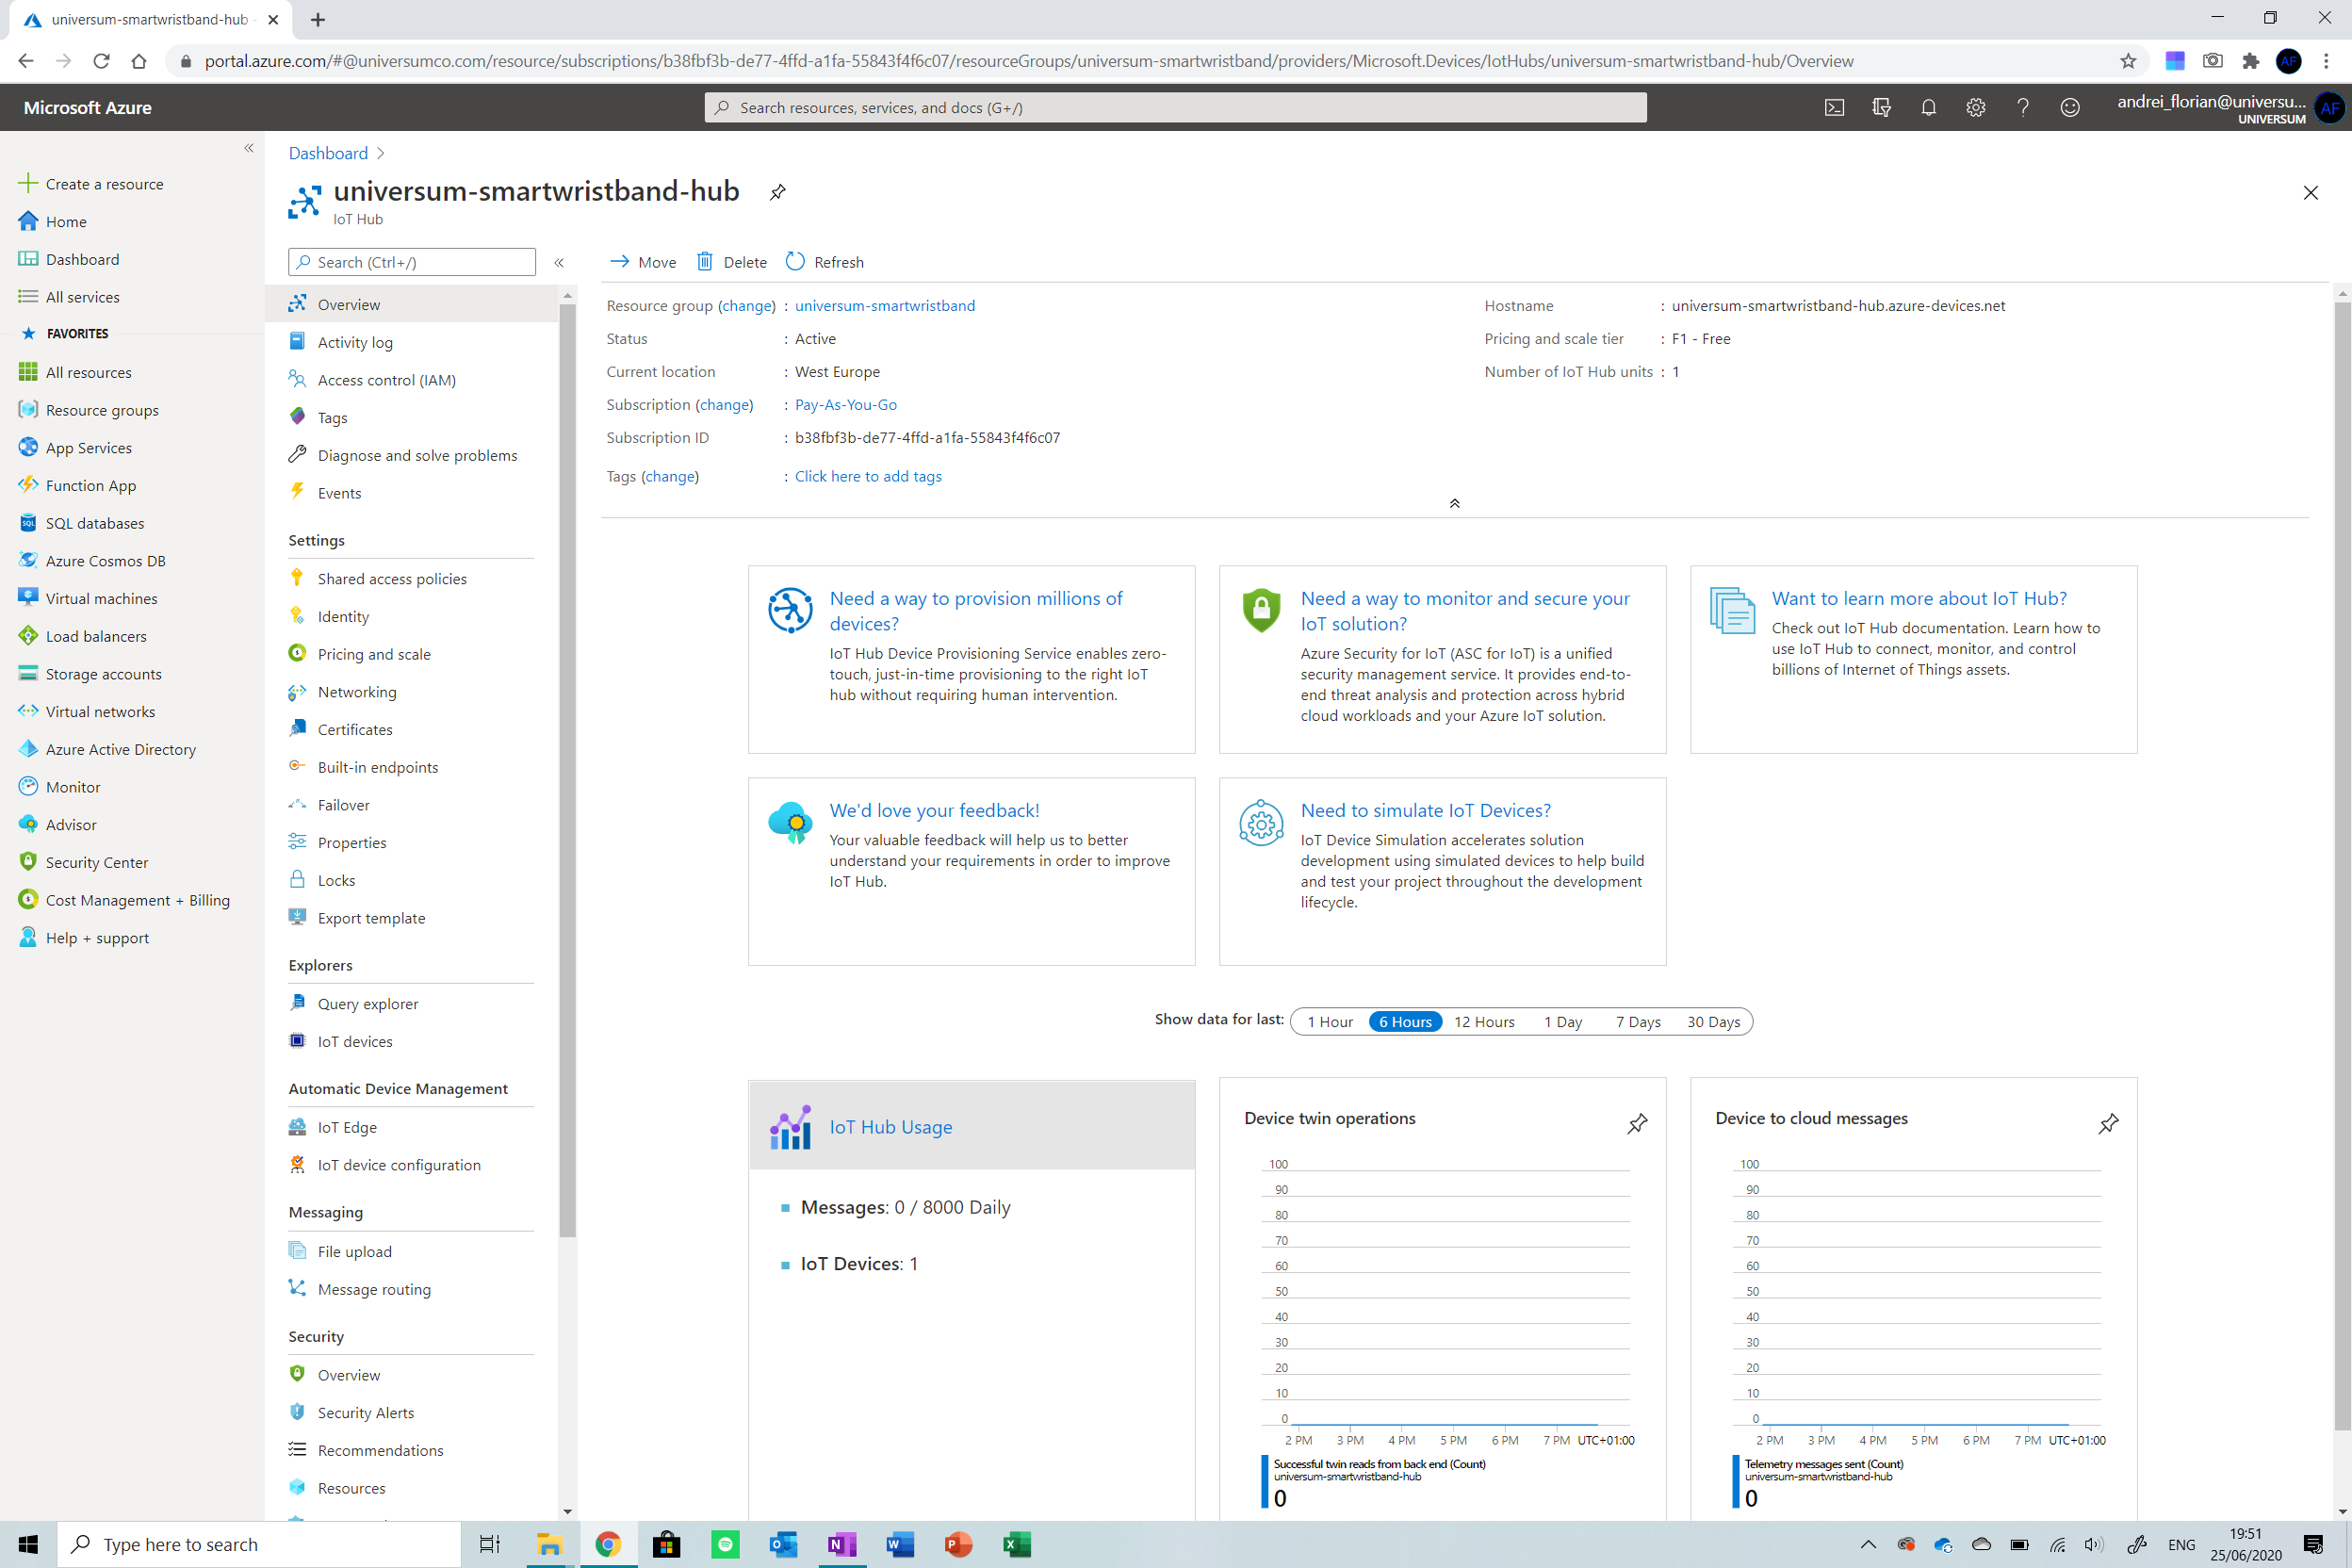
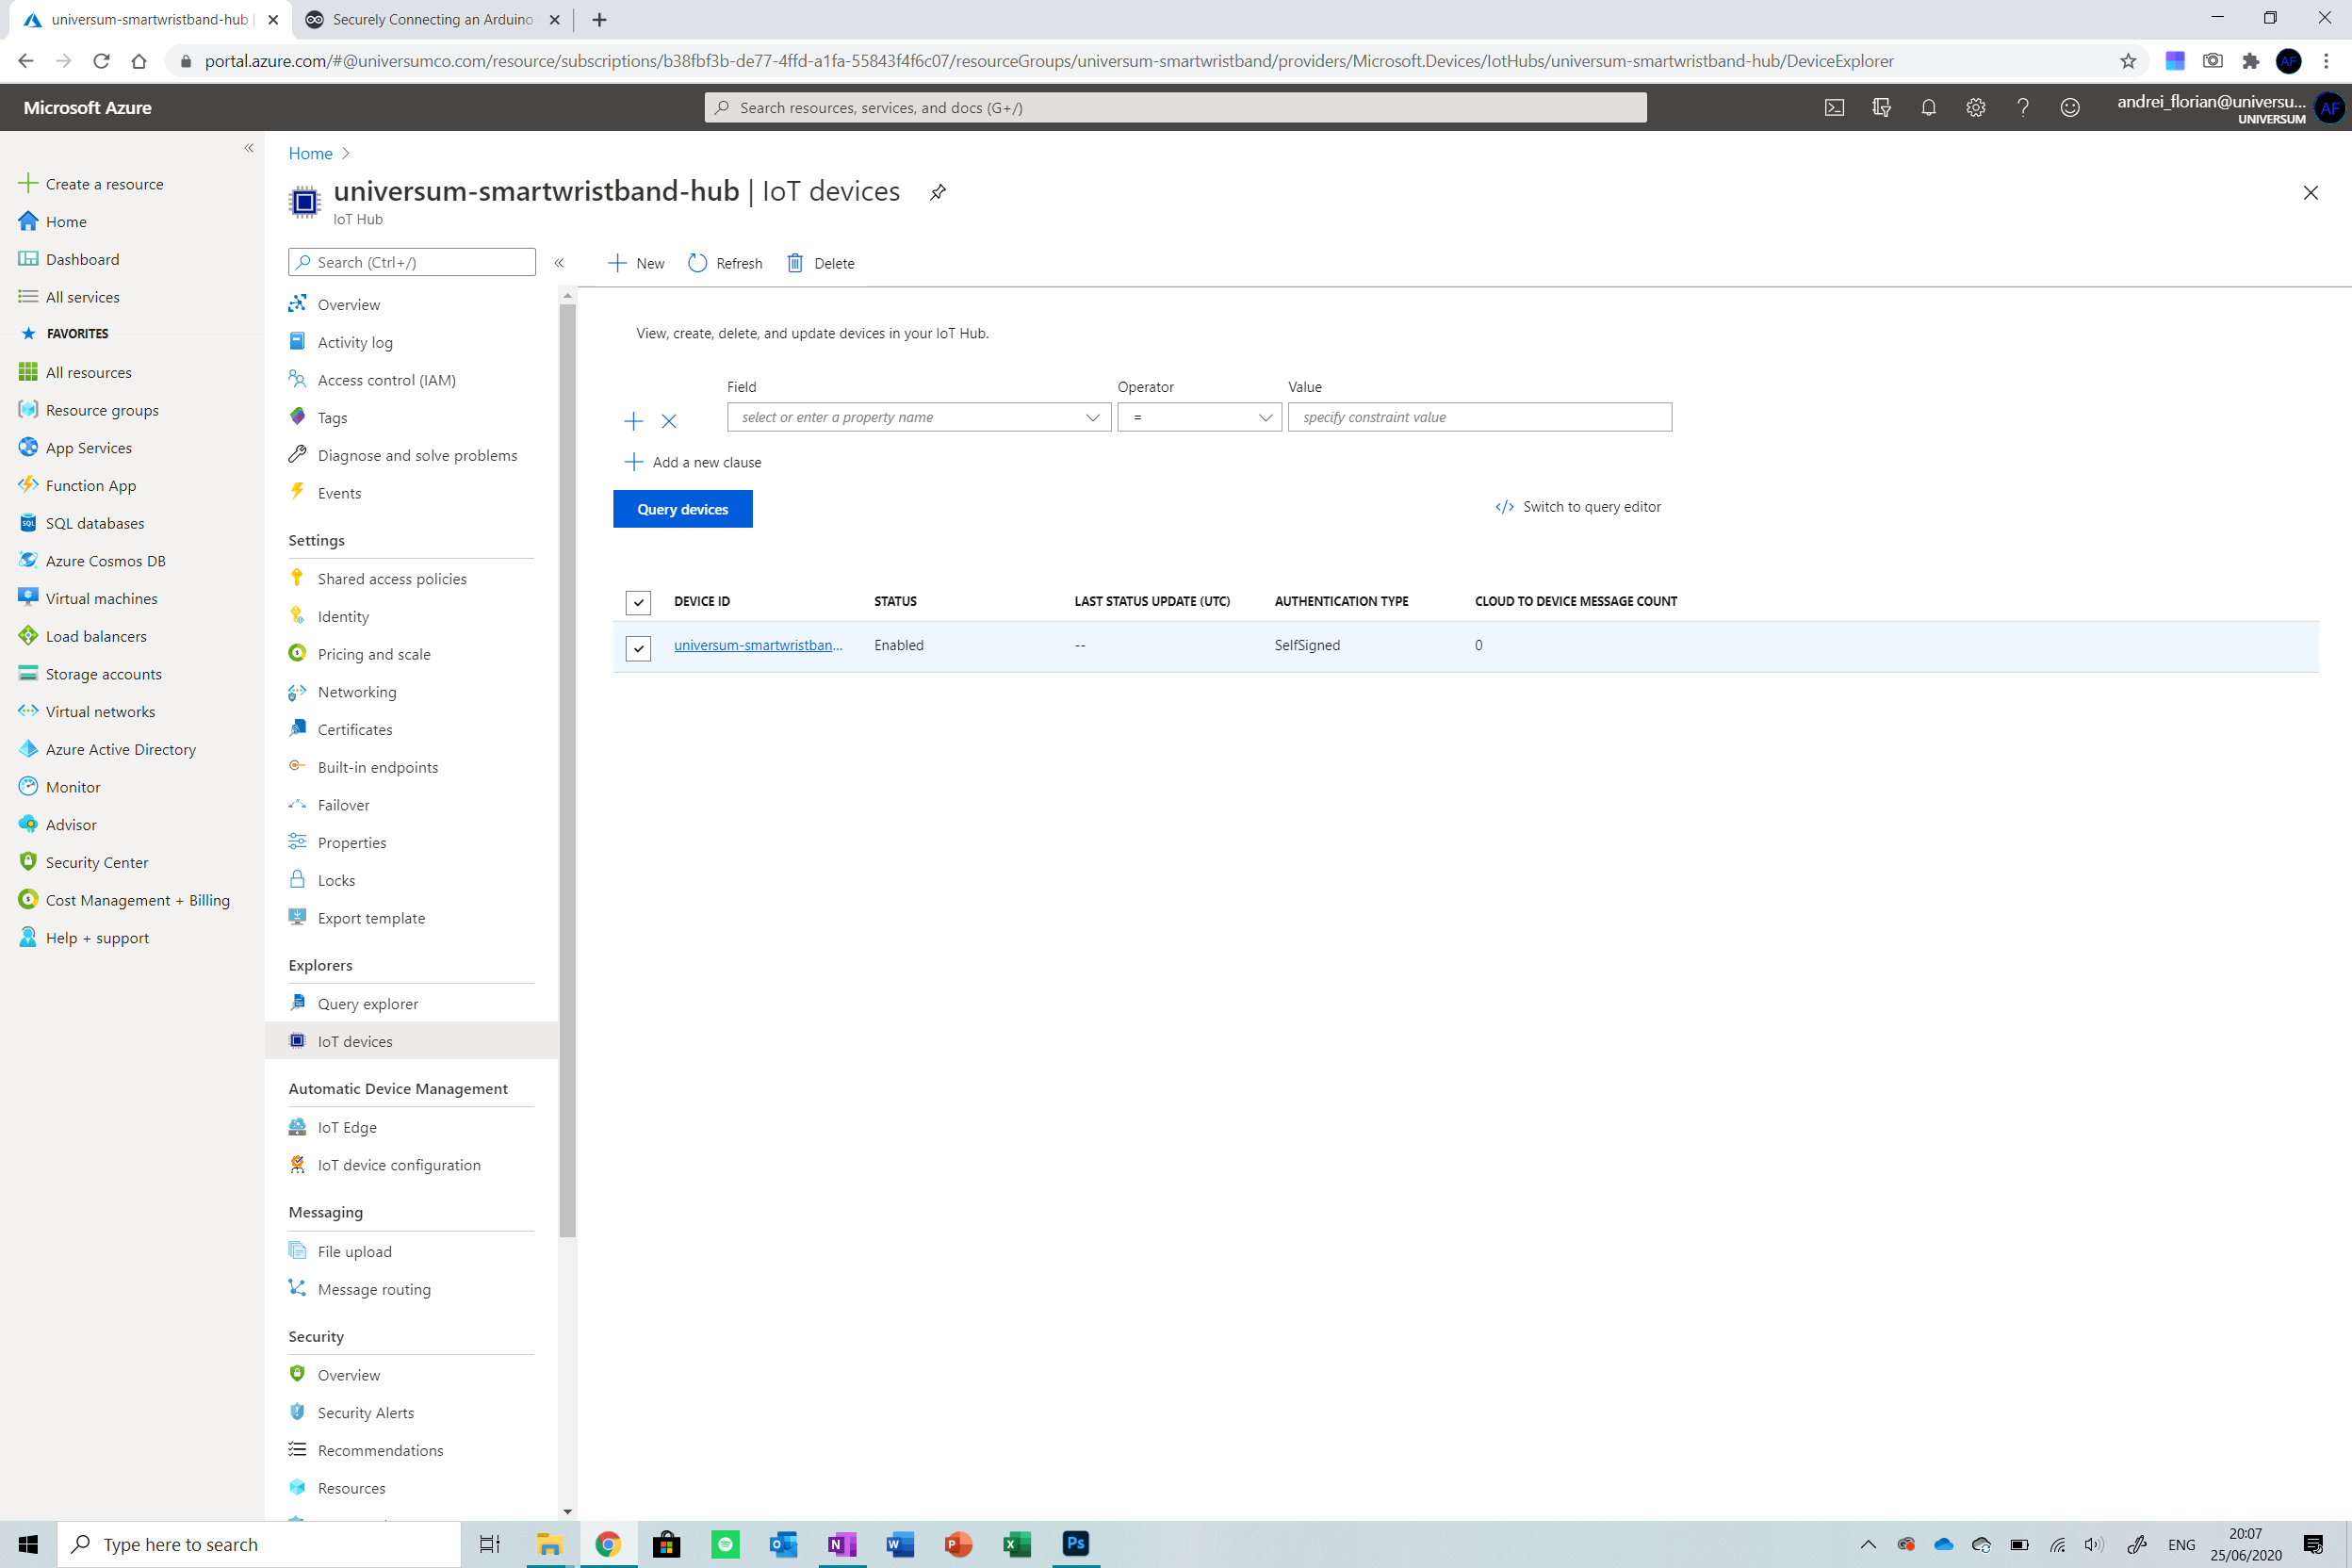
我们现在需要创建一个设备 并将其附加到 IoT 中心。导航到物联网设备 屏幕右侧菜单上的选项,然后单击该选项。点击新建 按钮添加新设备 到物联网中心。输入以下凭据:
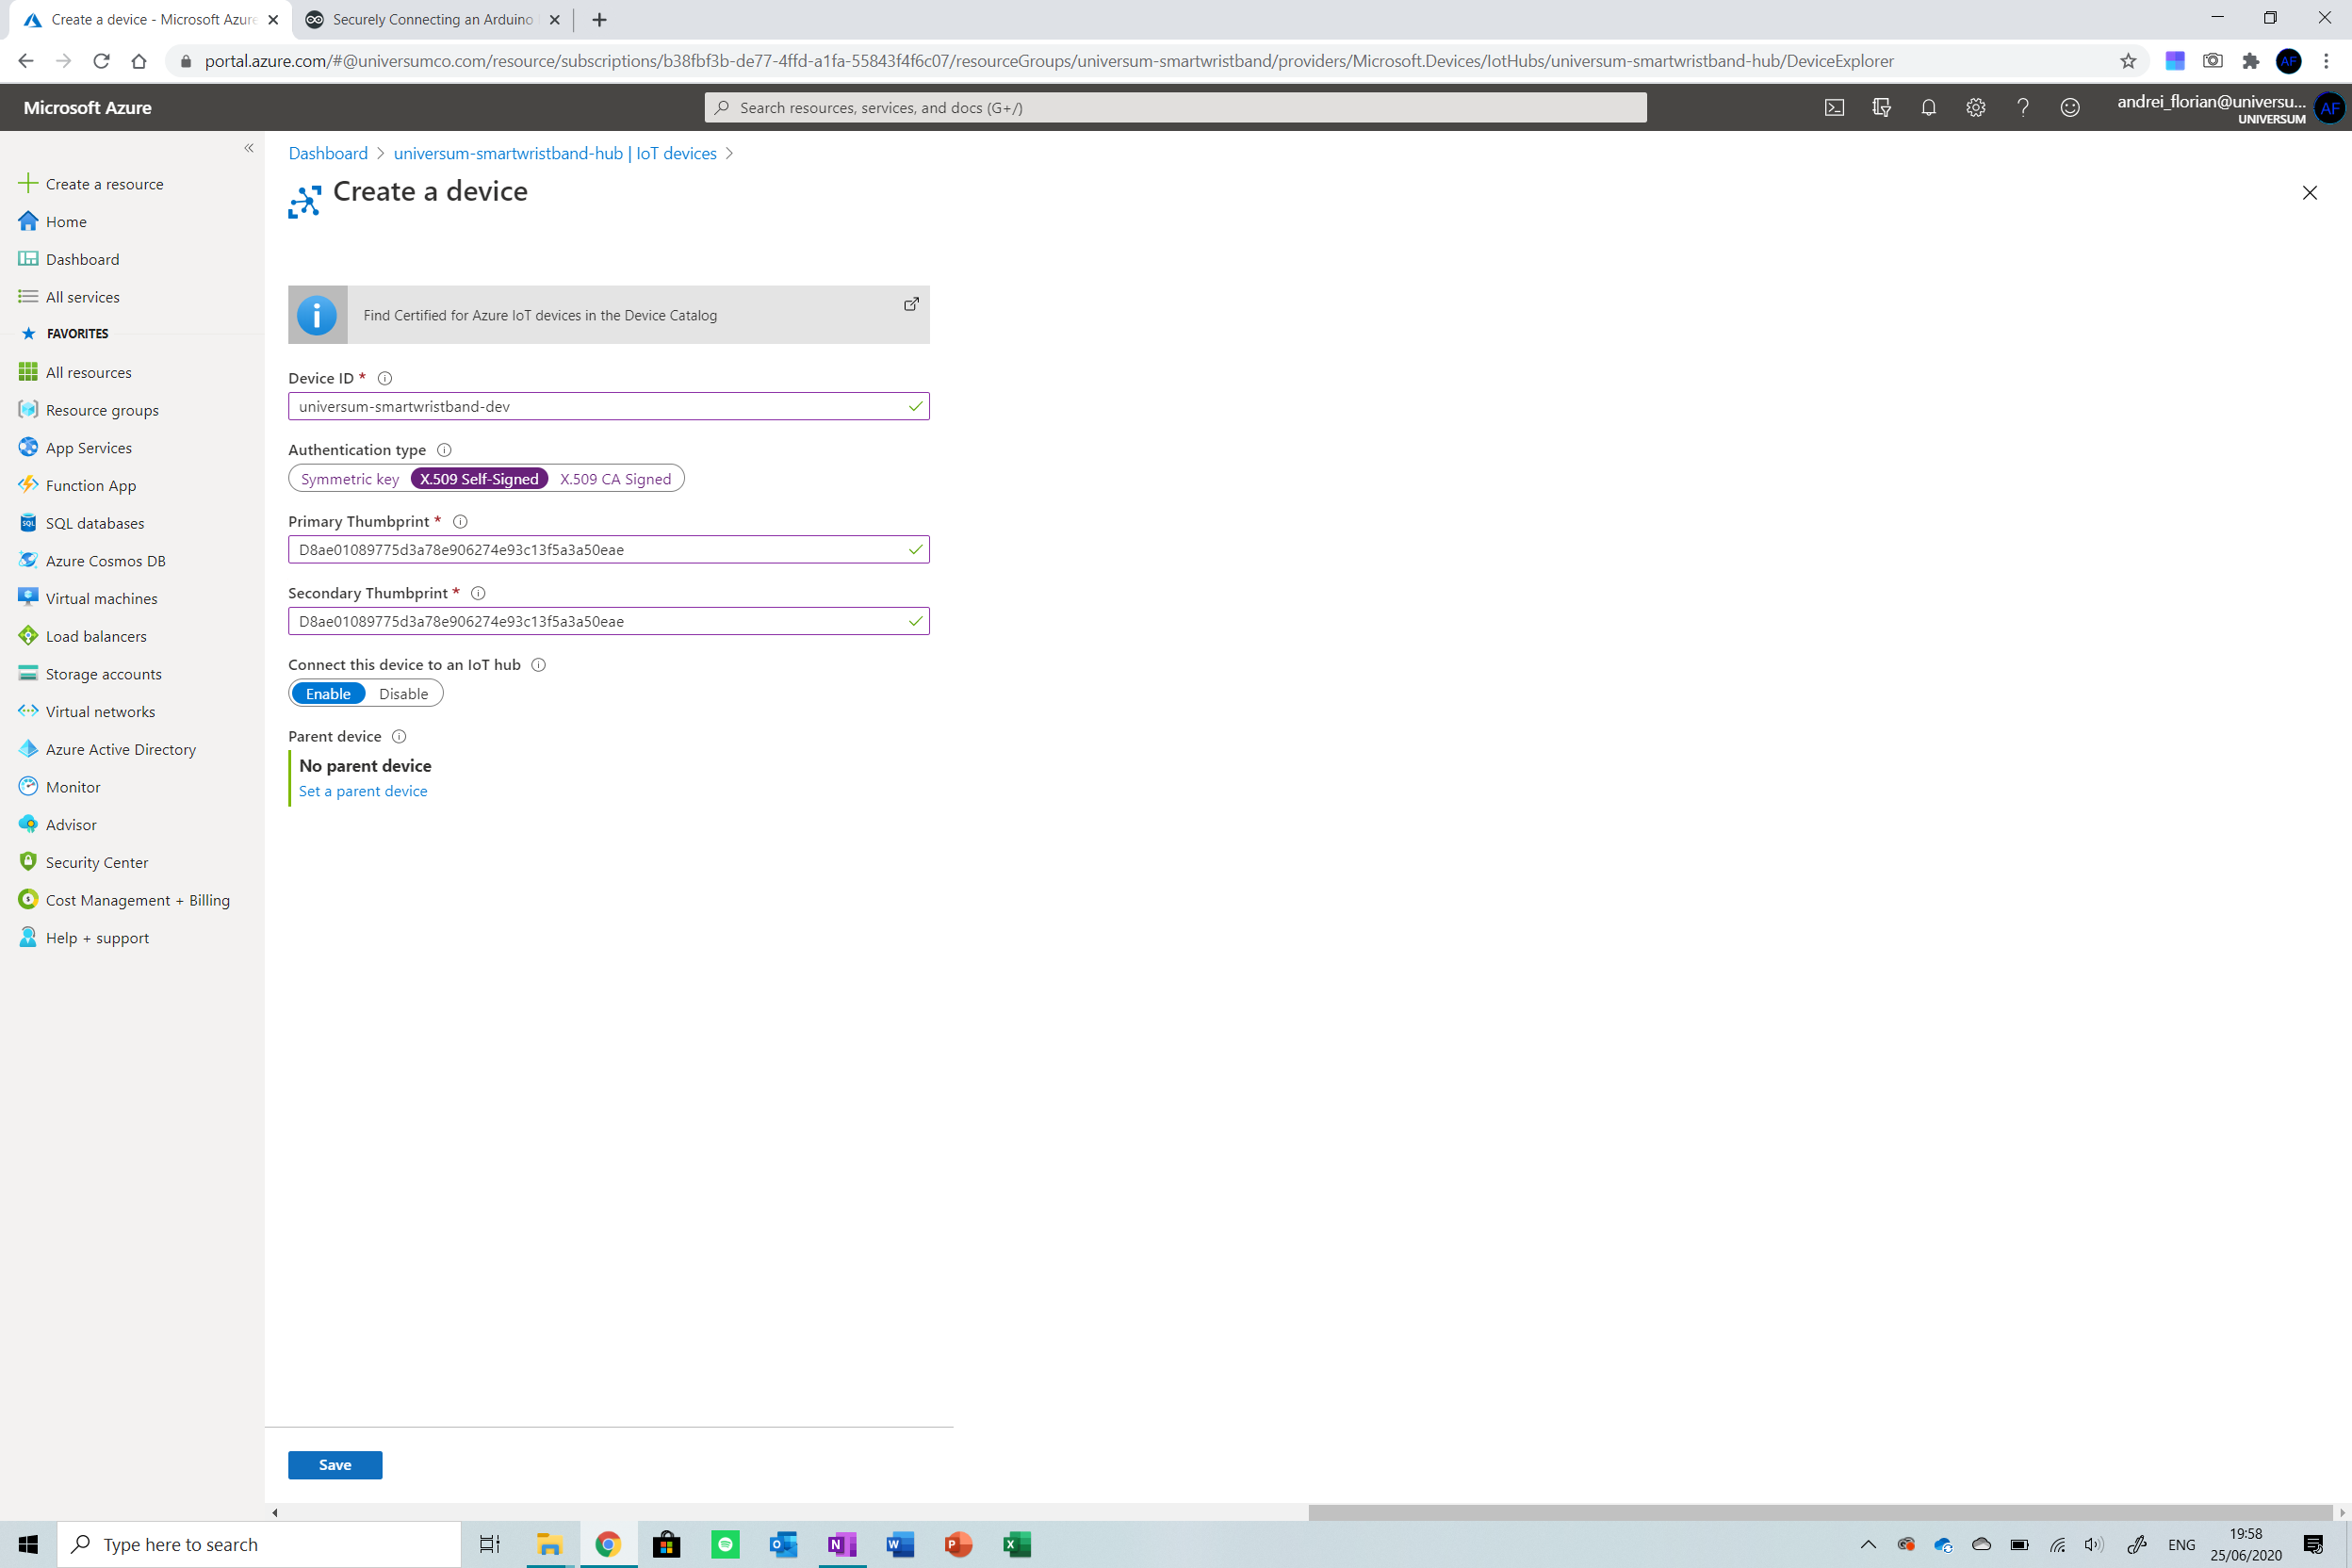
确保用您的 SHA1 值替换主要指纹和次要指纹 第二步提取。
点击保存,我们准备好了!
步骤 5:创建 Cosmos DB 数据库
现在我们需要创建数据库,我们的设备发送的数据将存储在其中。我正在使用 Azure 的 Cosmos DB 因为它习惯于存储 JSON 文件 这是我们从设备发送的内容。
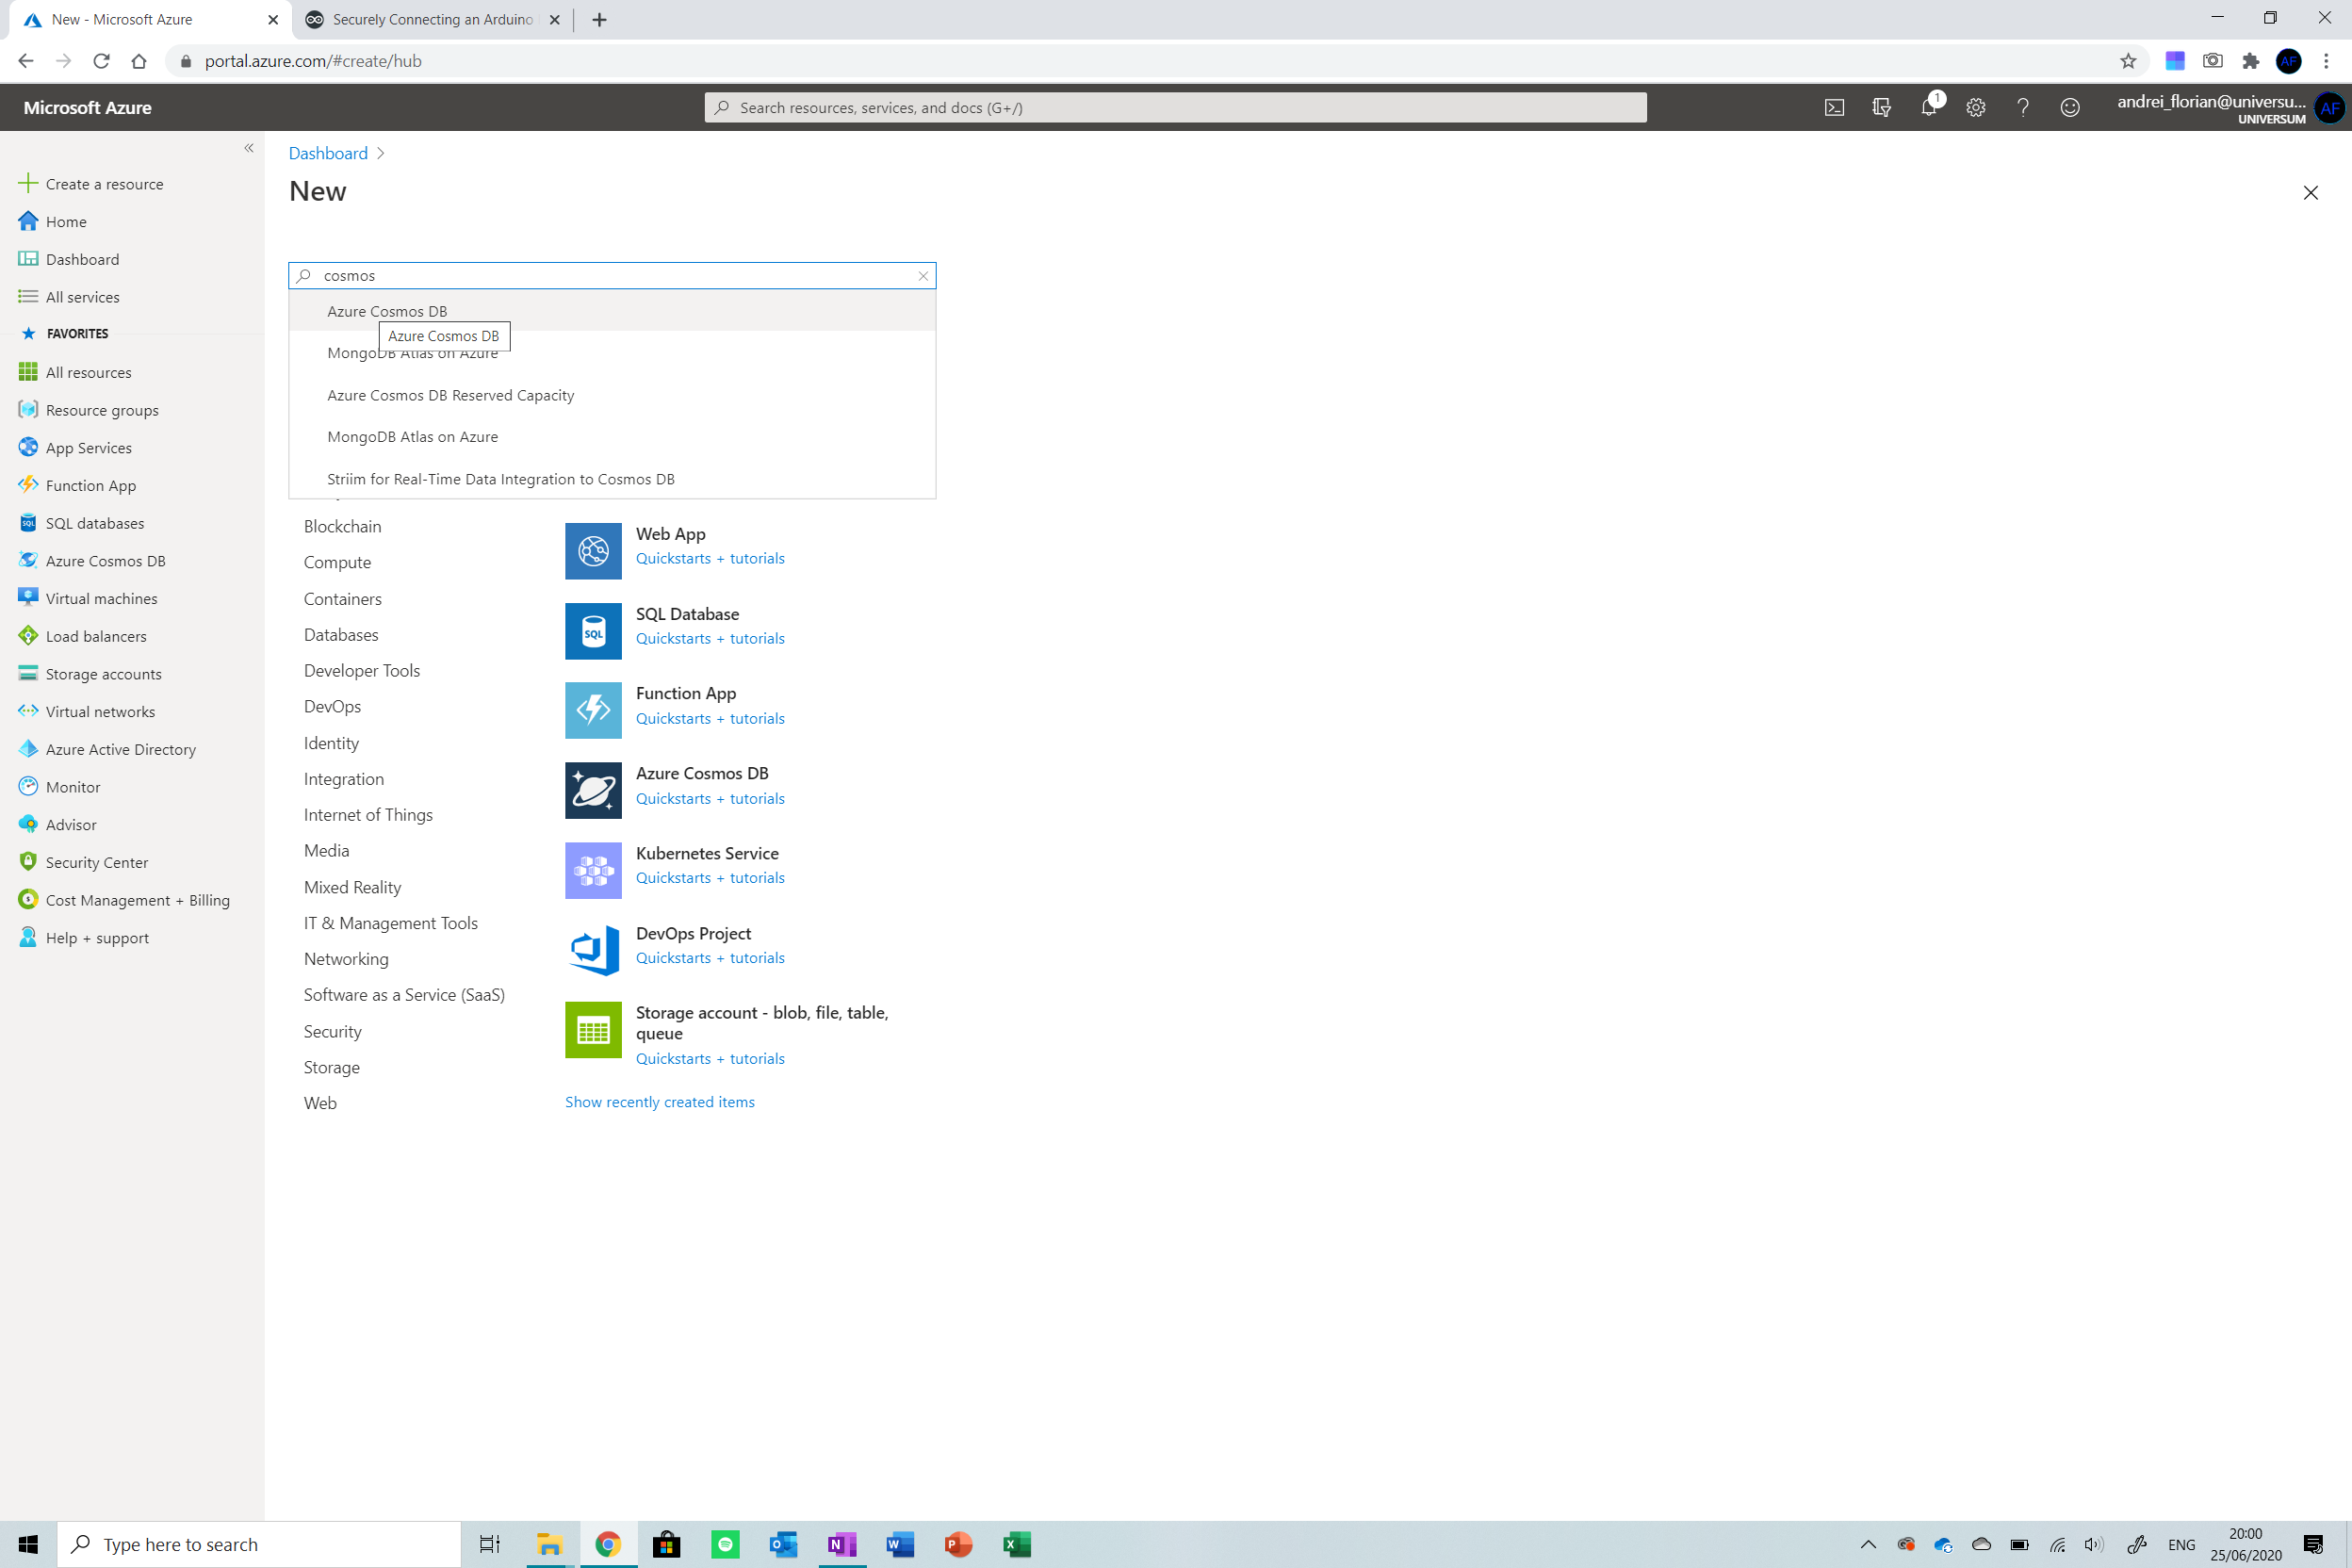
首先,导航回创建资源按钮 从右侧的菜单中单击它。搜索 Cosmos DB 然后选择选项。
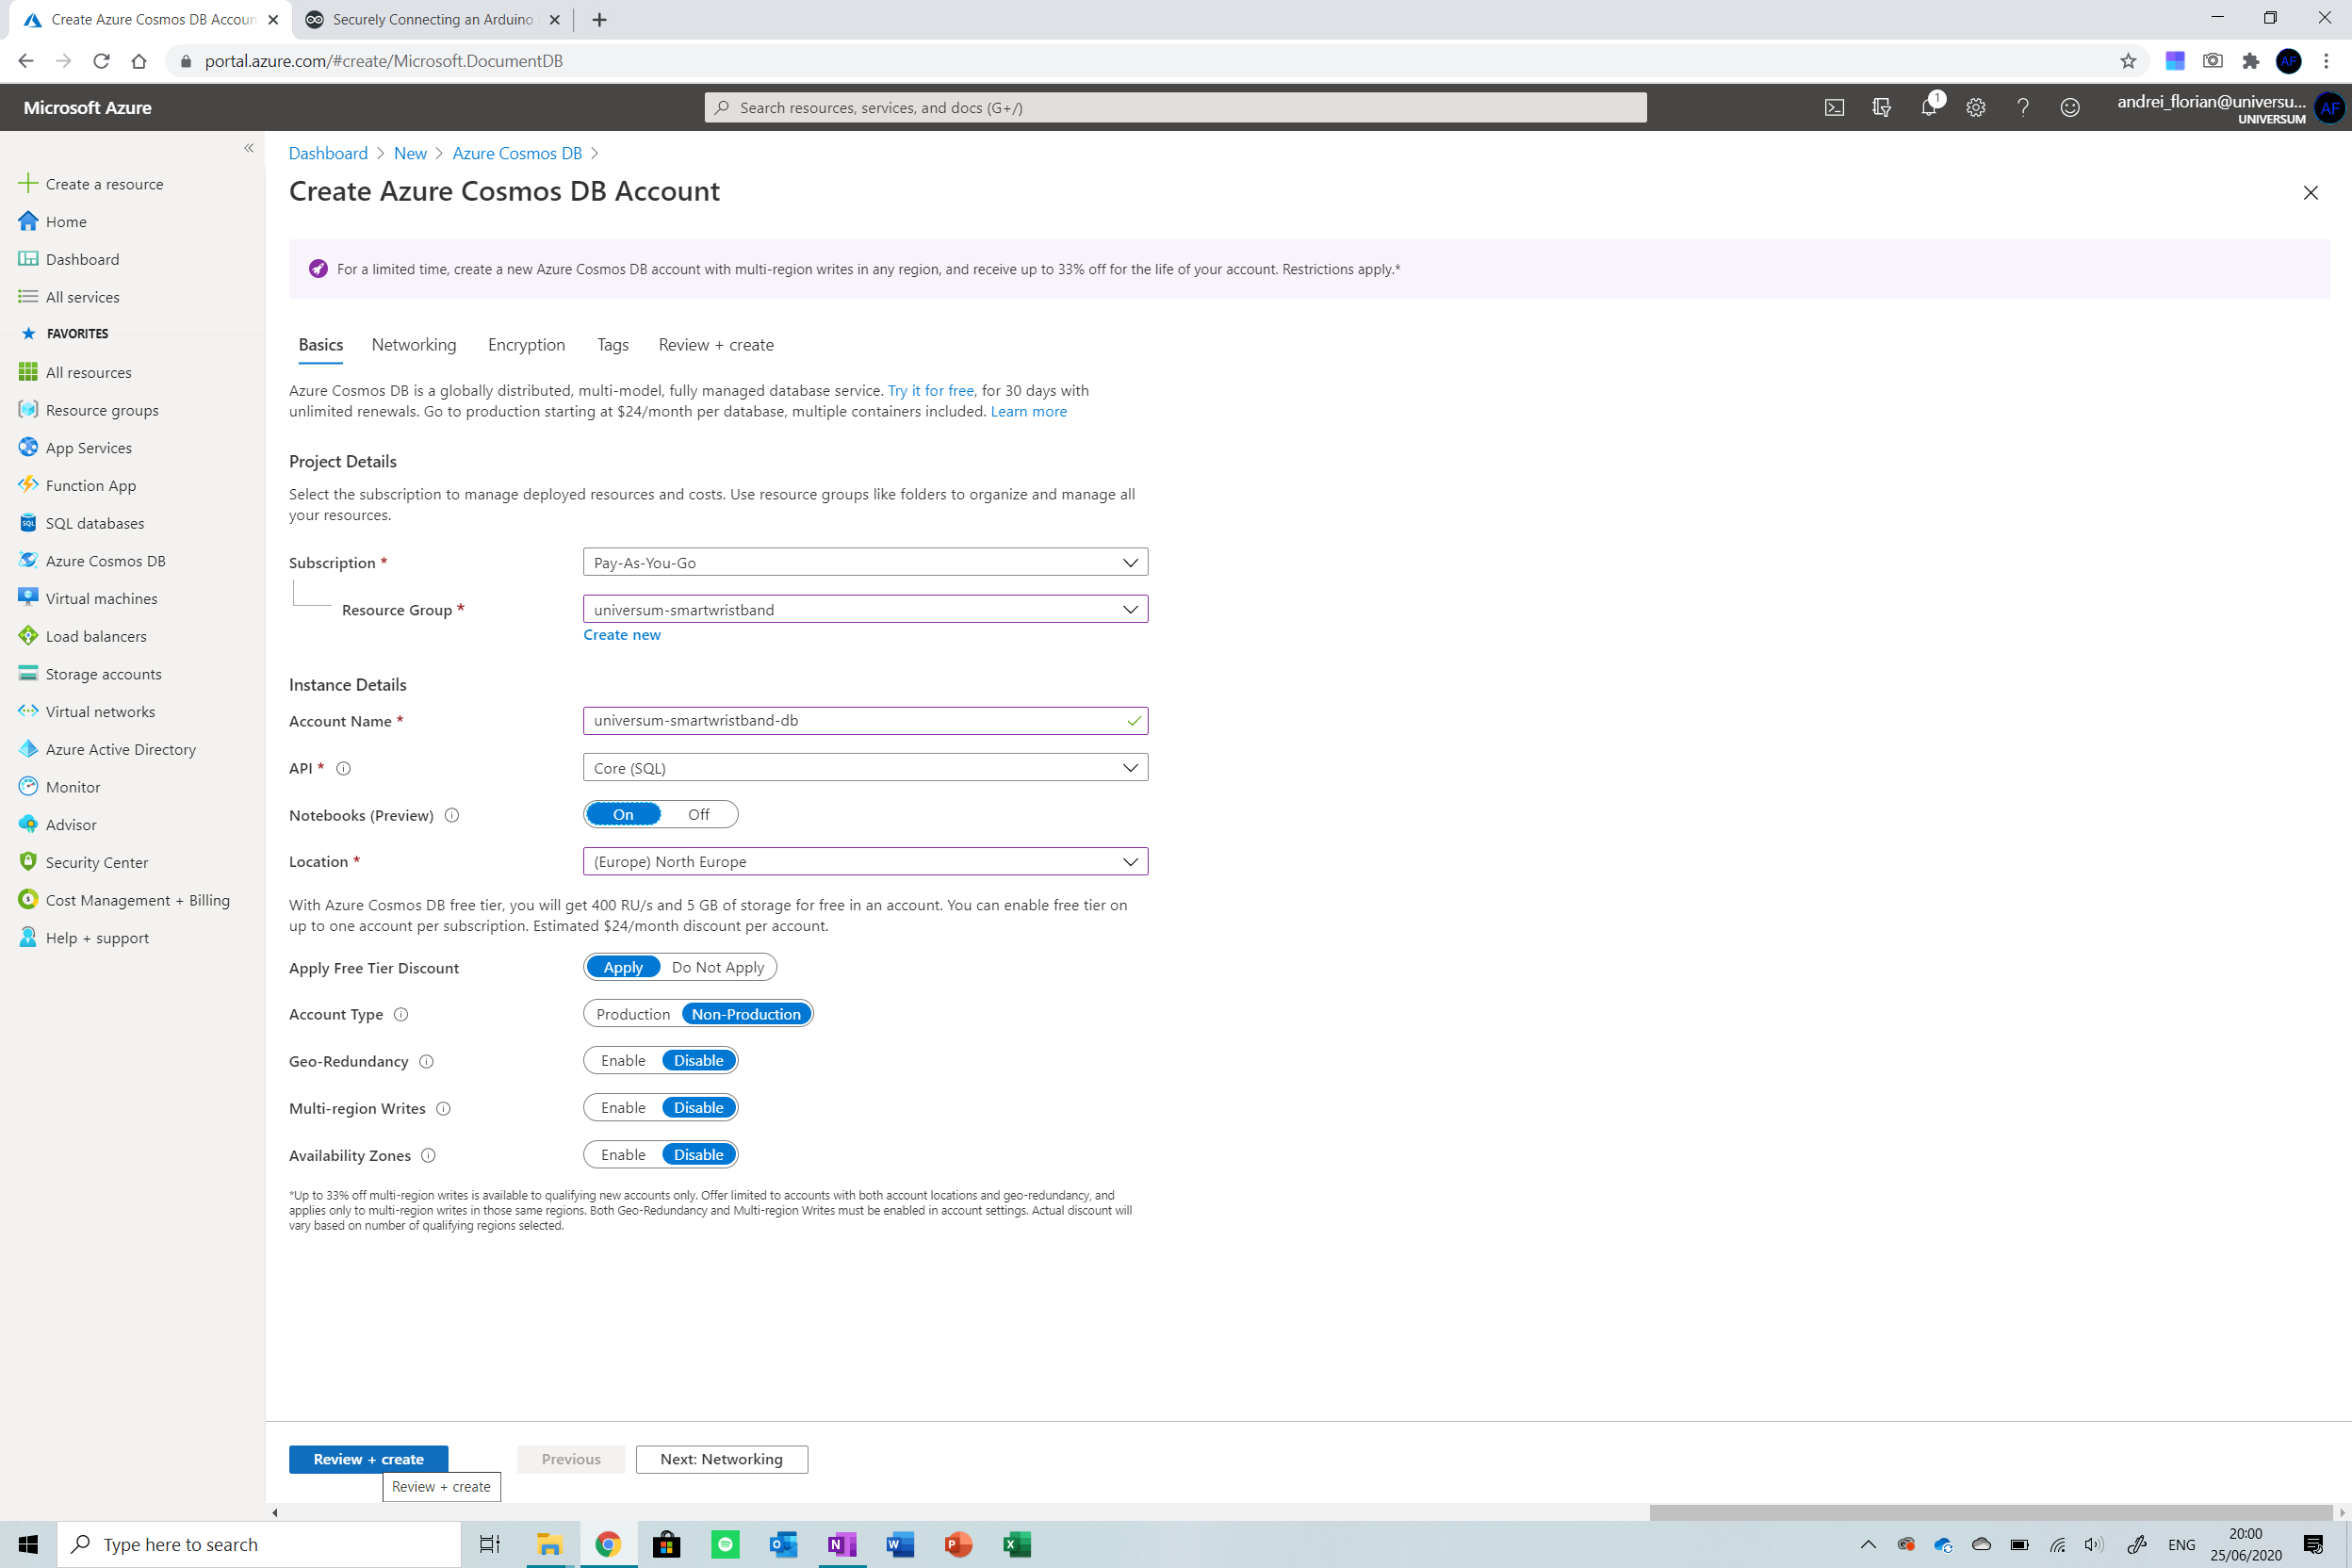
选择使用 IoT 中心创建的资源组 并为其命名,其余设置保持不变。确保区域相同 在物联网中心和数据库上,以防止区域转移成本。
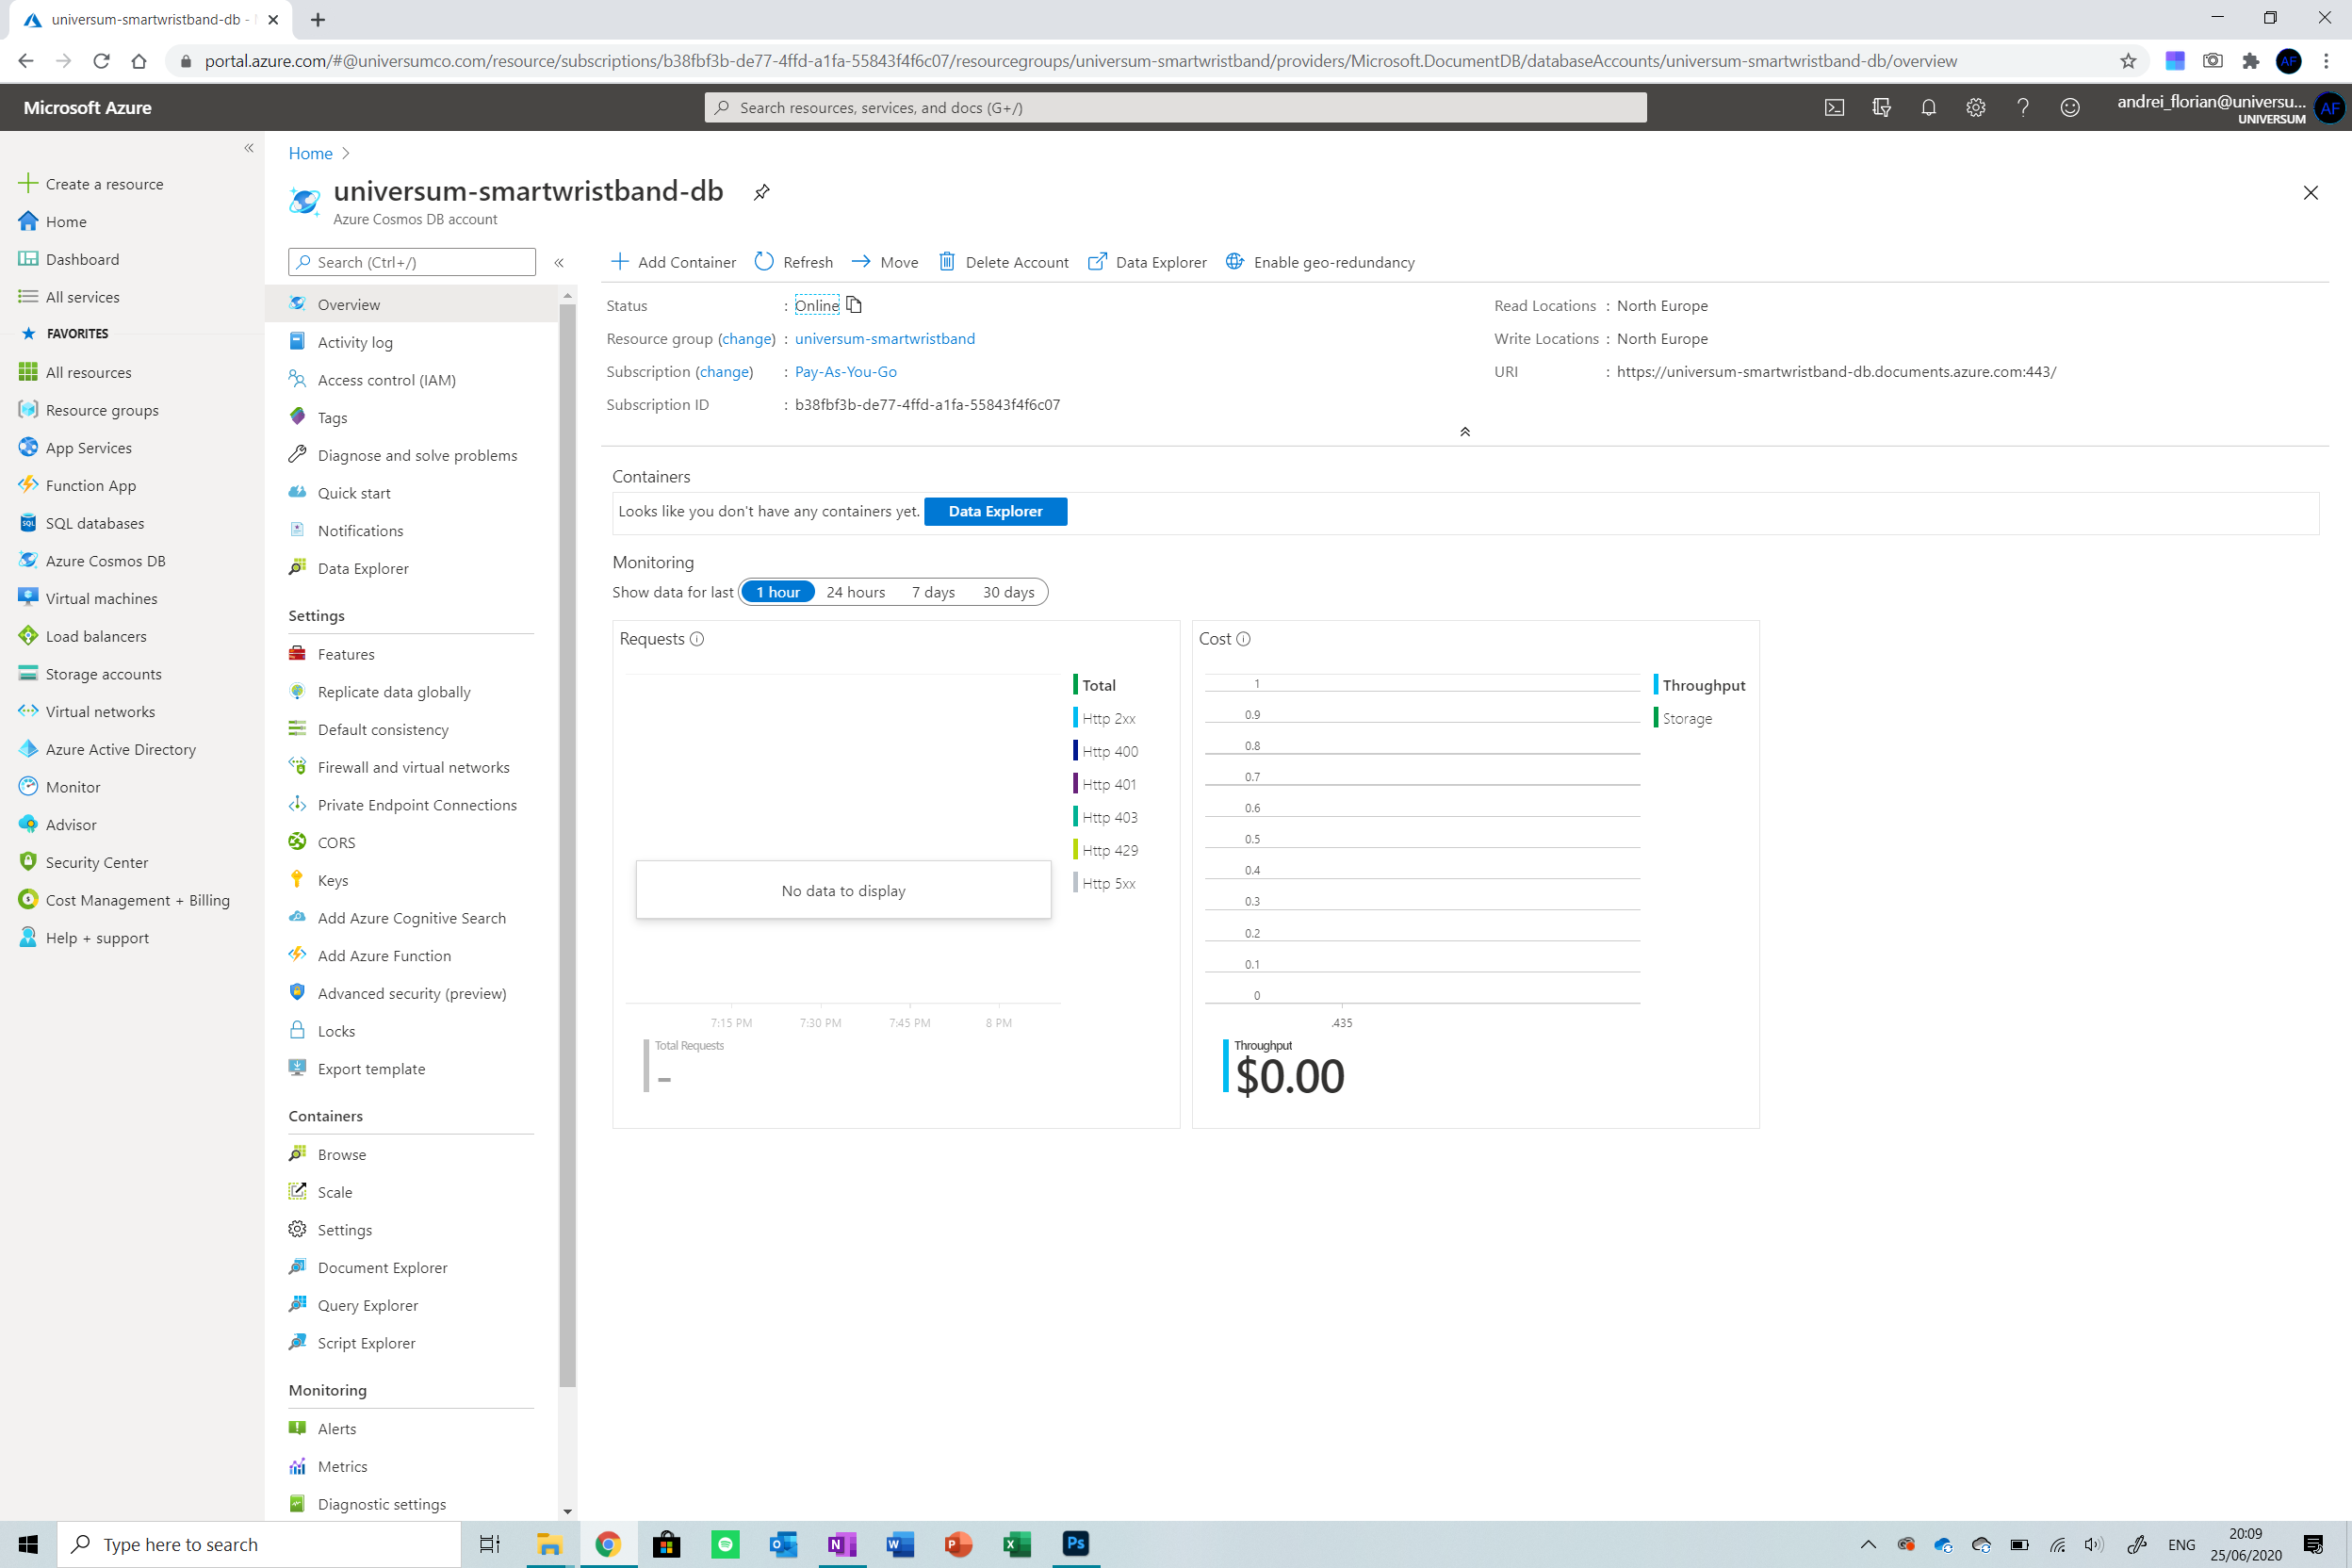
就是这样!等待资源部署完毕,然后我们就可以继续前进了!
第 6 步:创建流分析作业
因此,现在我们已经设置了 IoT 中心和数据库,我们需要将两者连接在一起 以便输入到我们的 IoT 中心的数据在收到时流式传输到数据库中。

从创建新资源开始 通过输入Stream Analytics Job .现在选择到目前为止使用的资源组并确保流单元的数量设置为 1。如果提供大量设备,您可能需要考虑创建更多的流单元 处理更多设备。
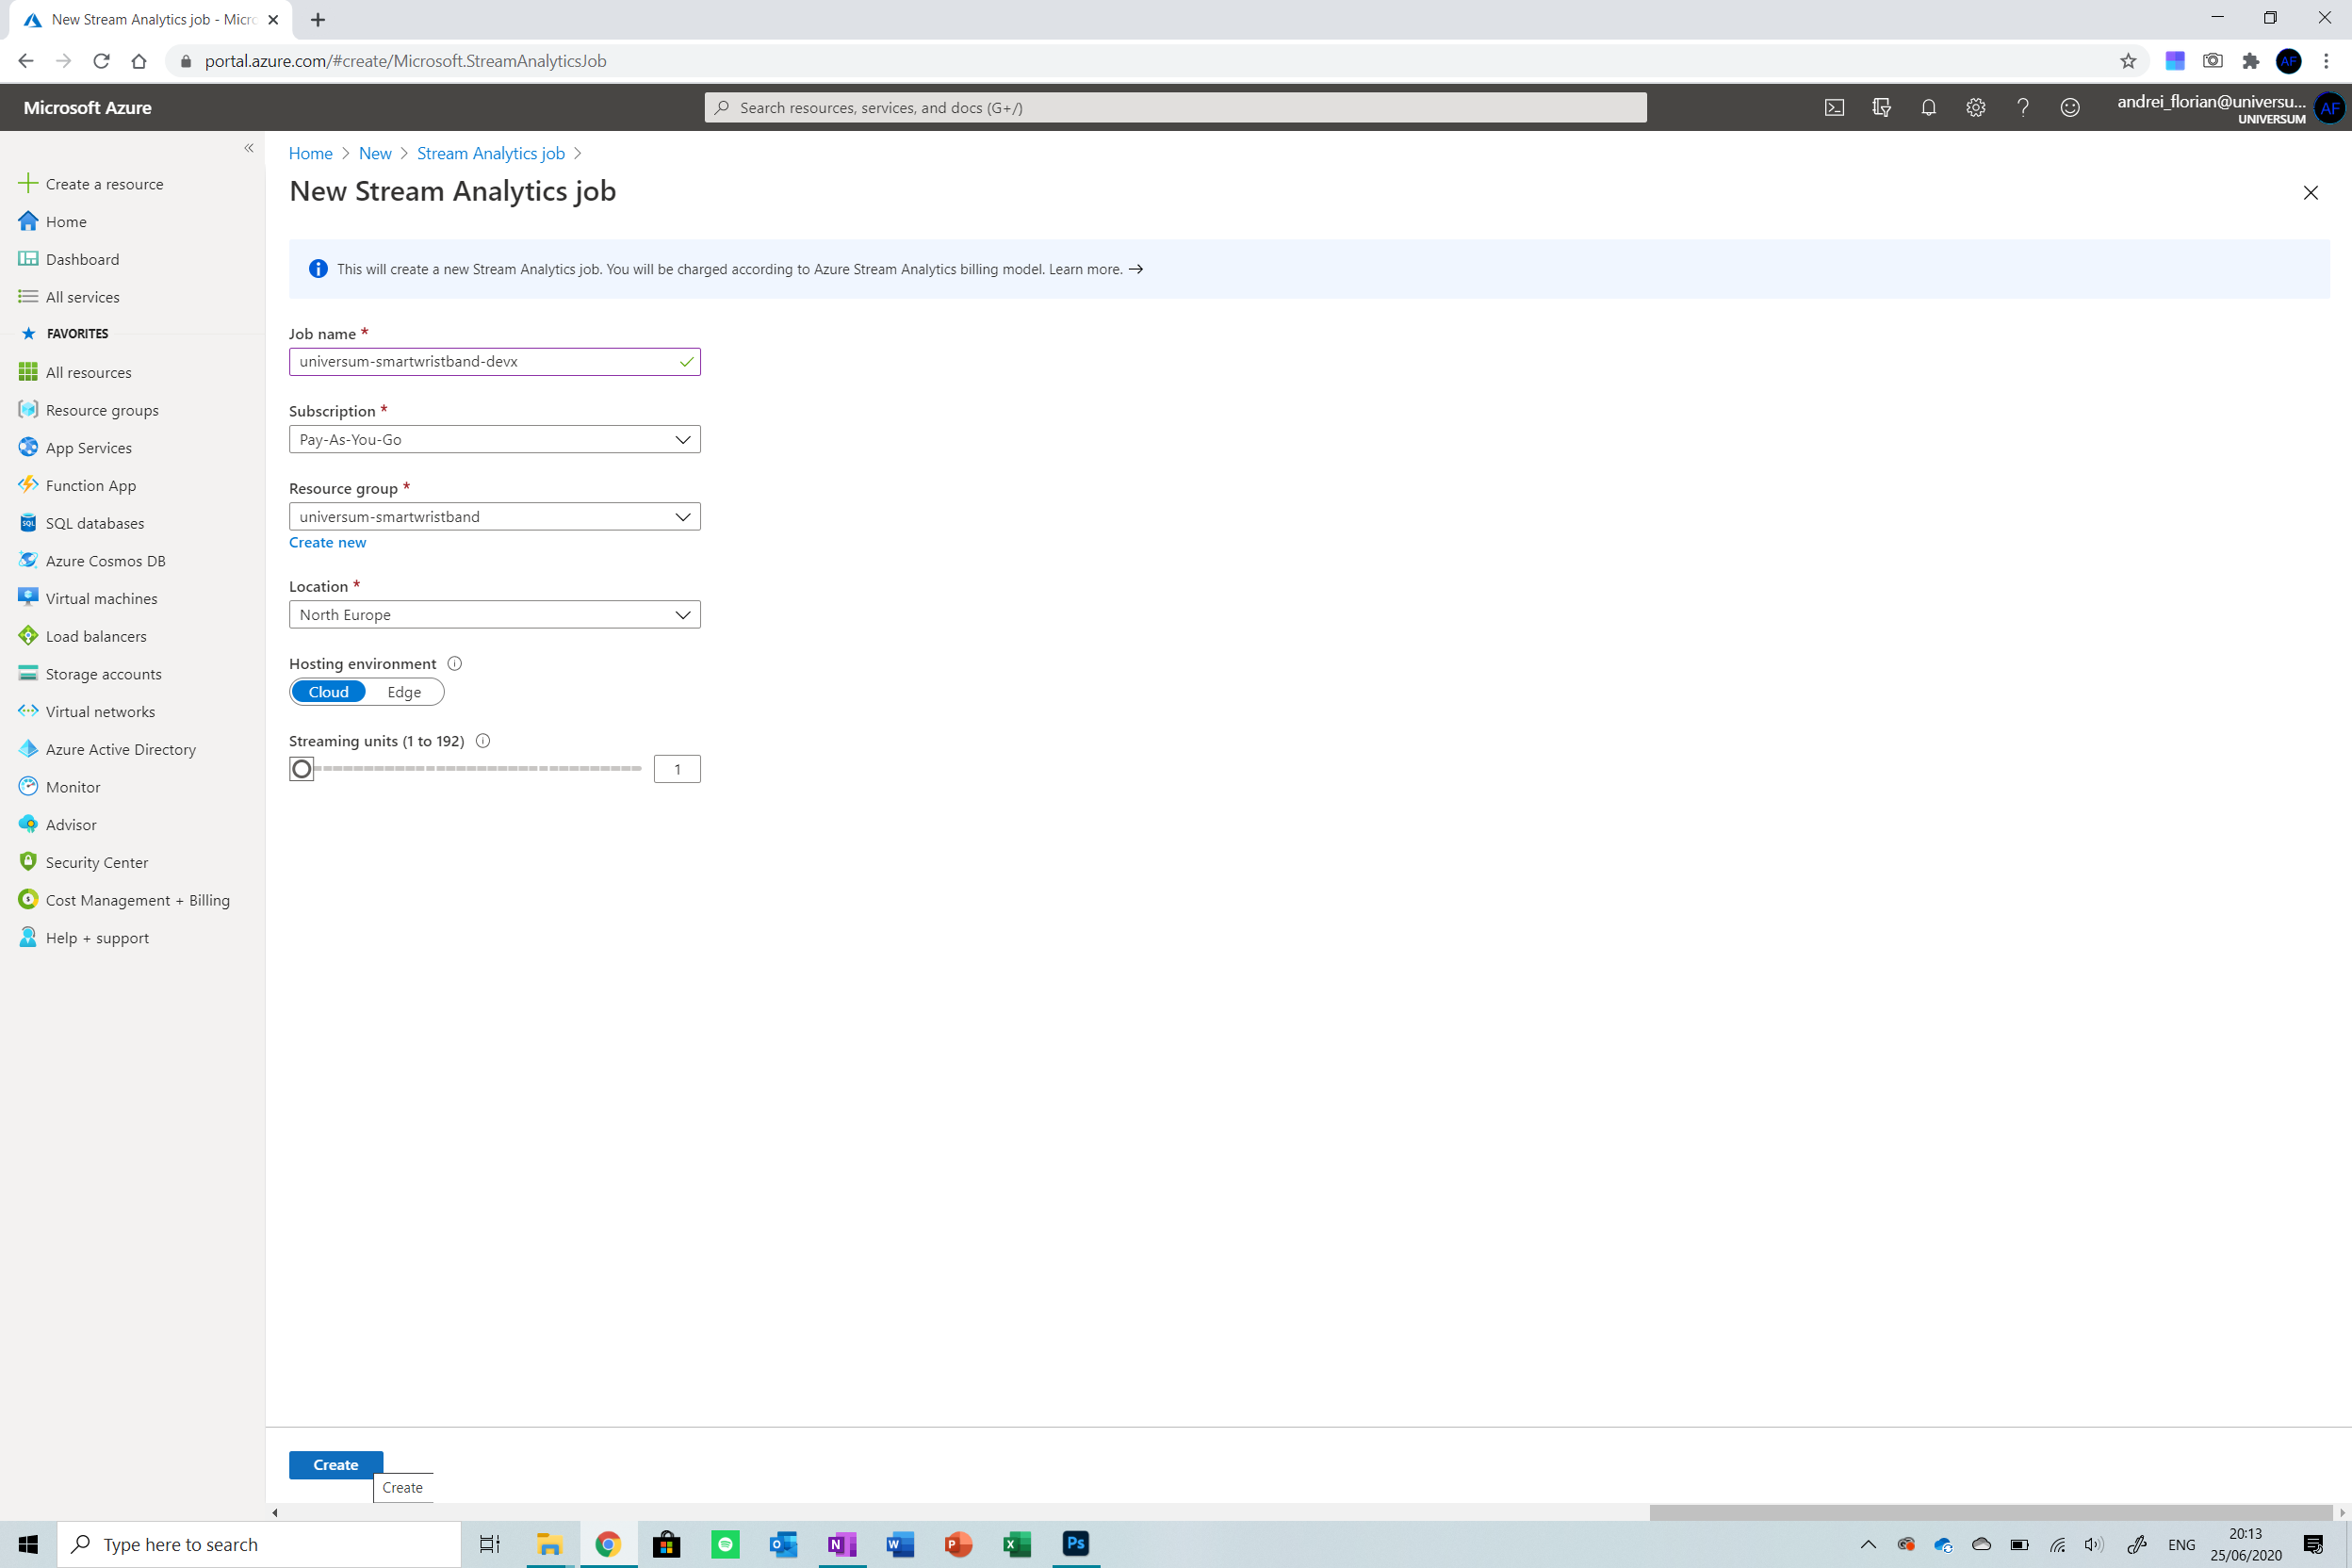
等待资源部署,然后从所有资源中选择它 左侧菜单上的按钮。
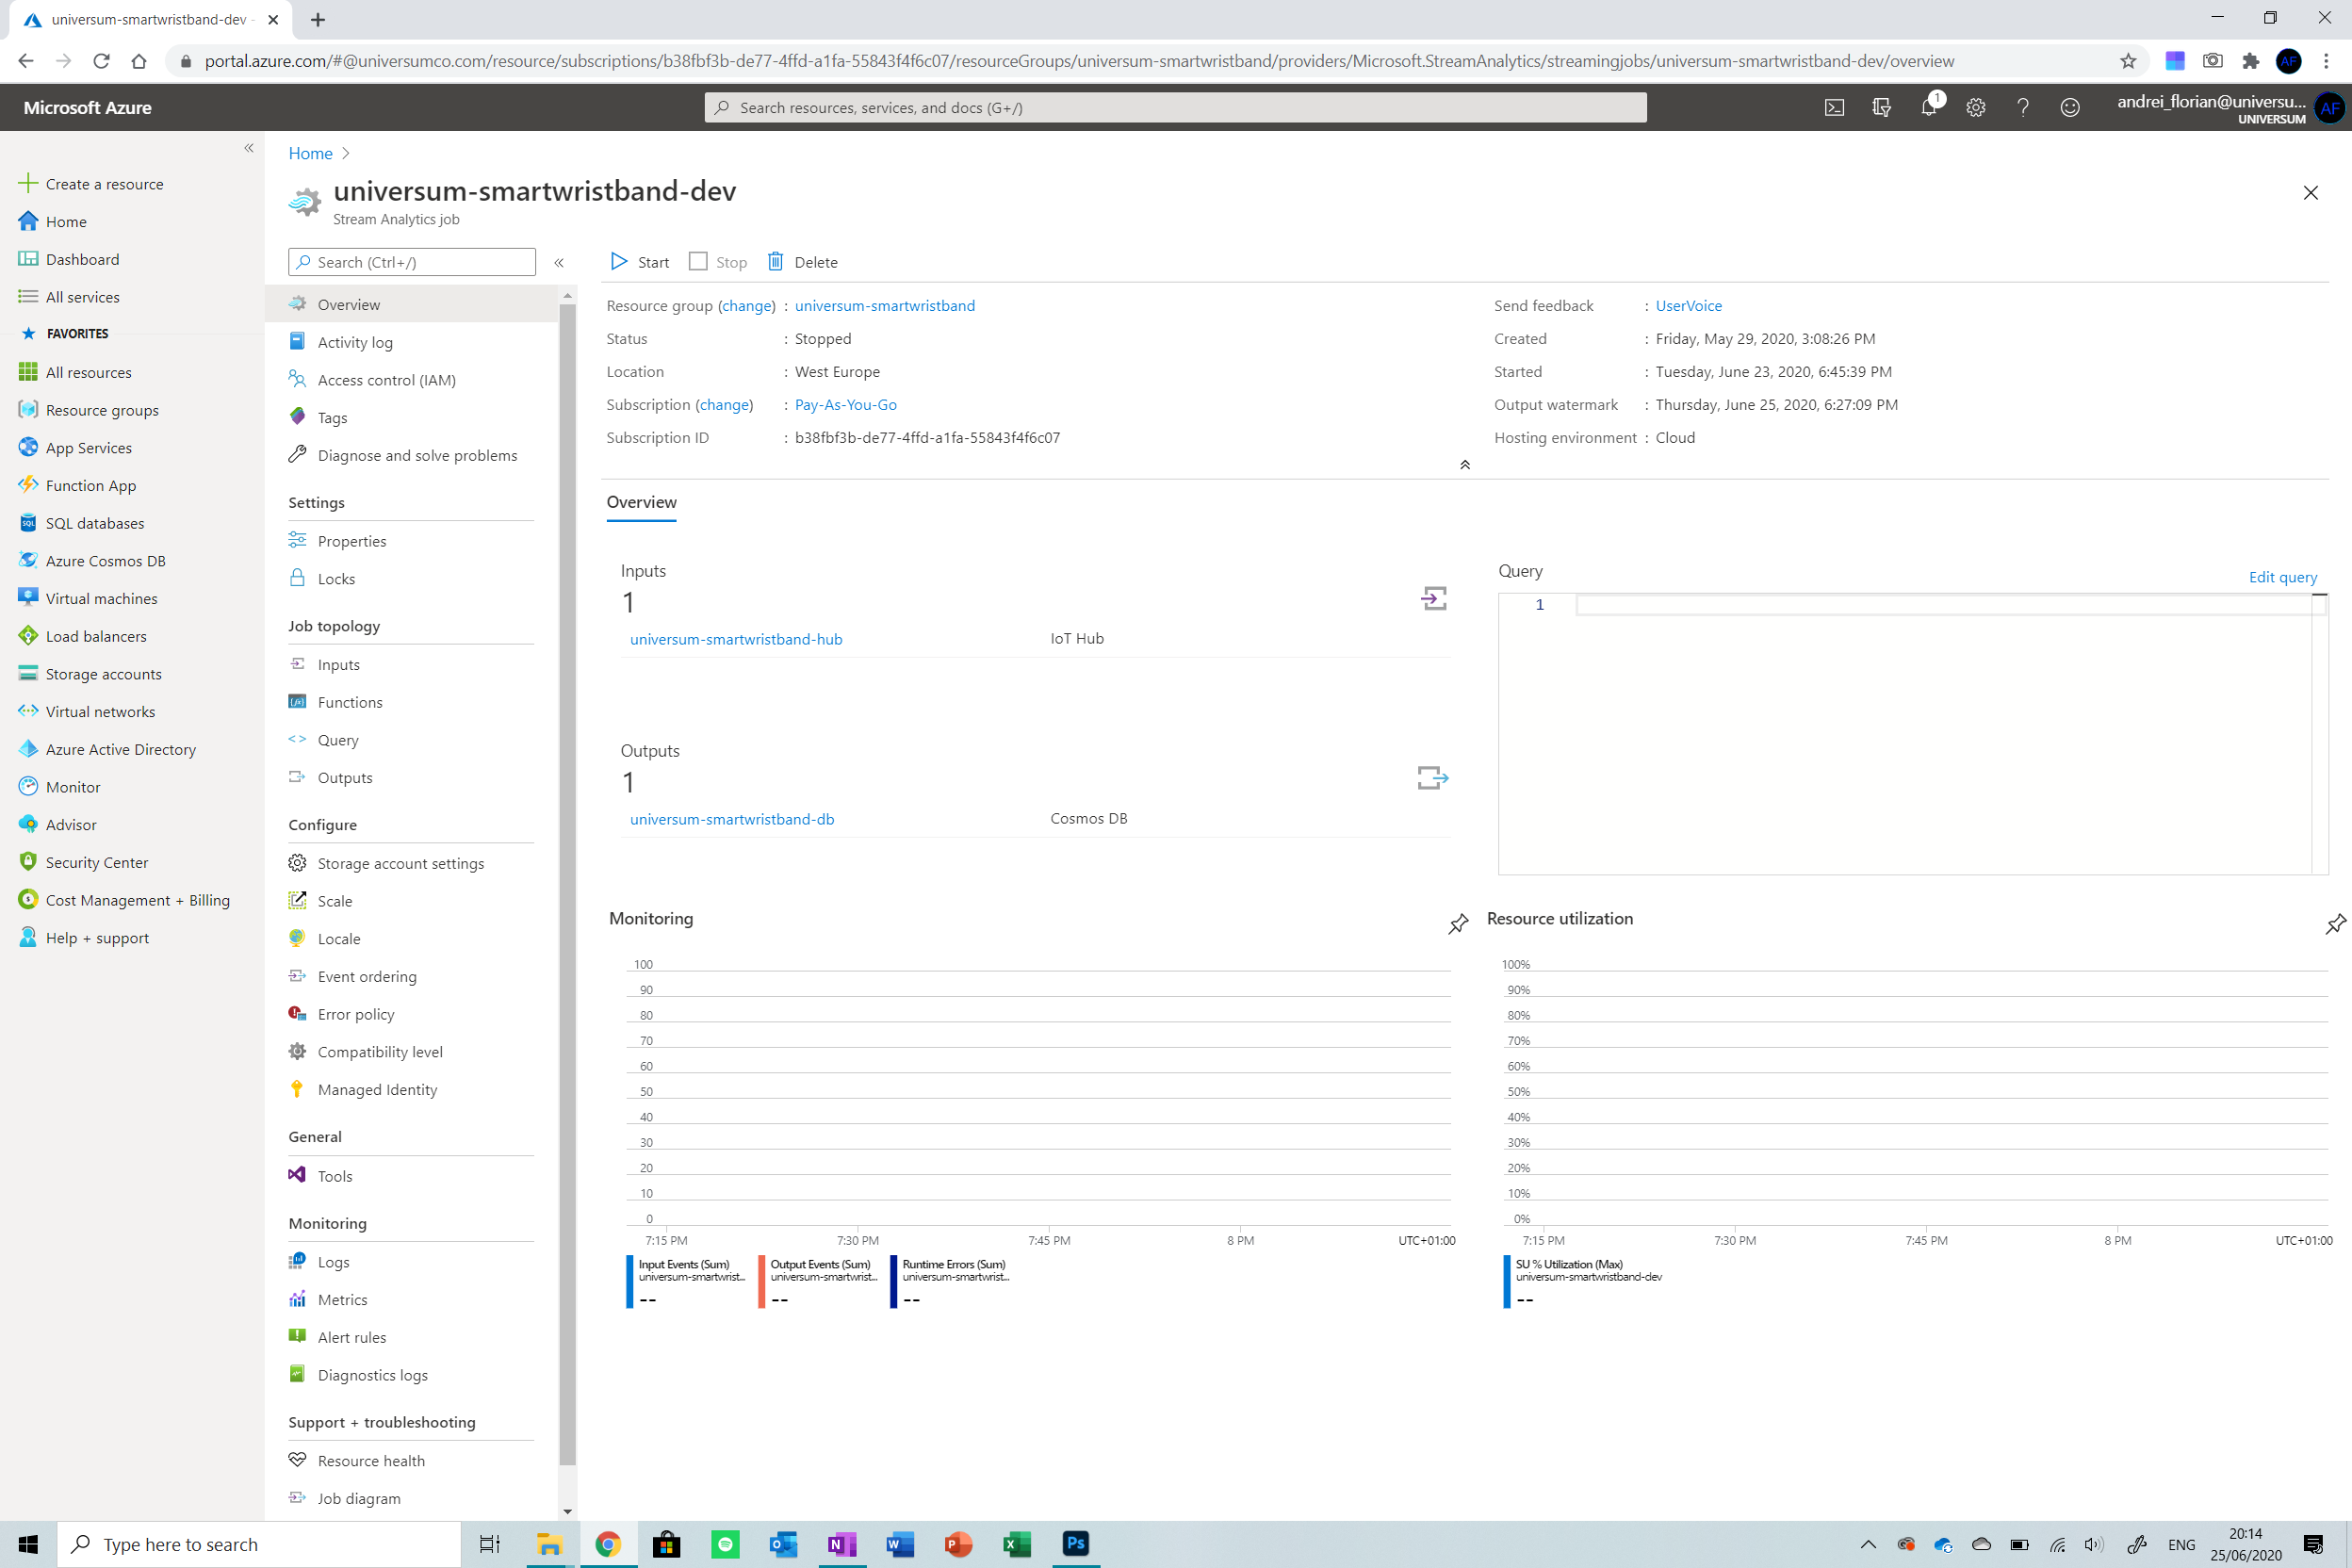
现在我们在资源中,选择输入按钮 从左侧的菜单中选择我们的输入。点击添加流输入 然后选择IoT Hub 从选项列表中。
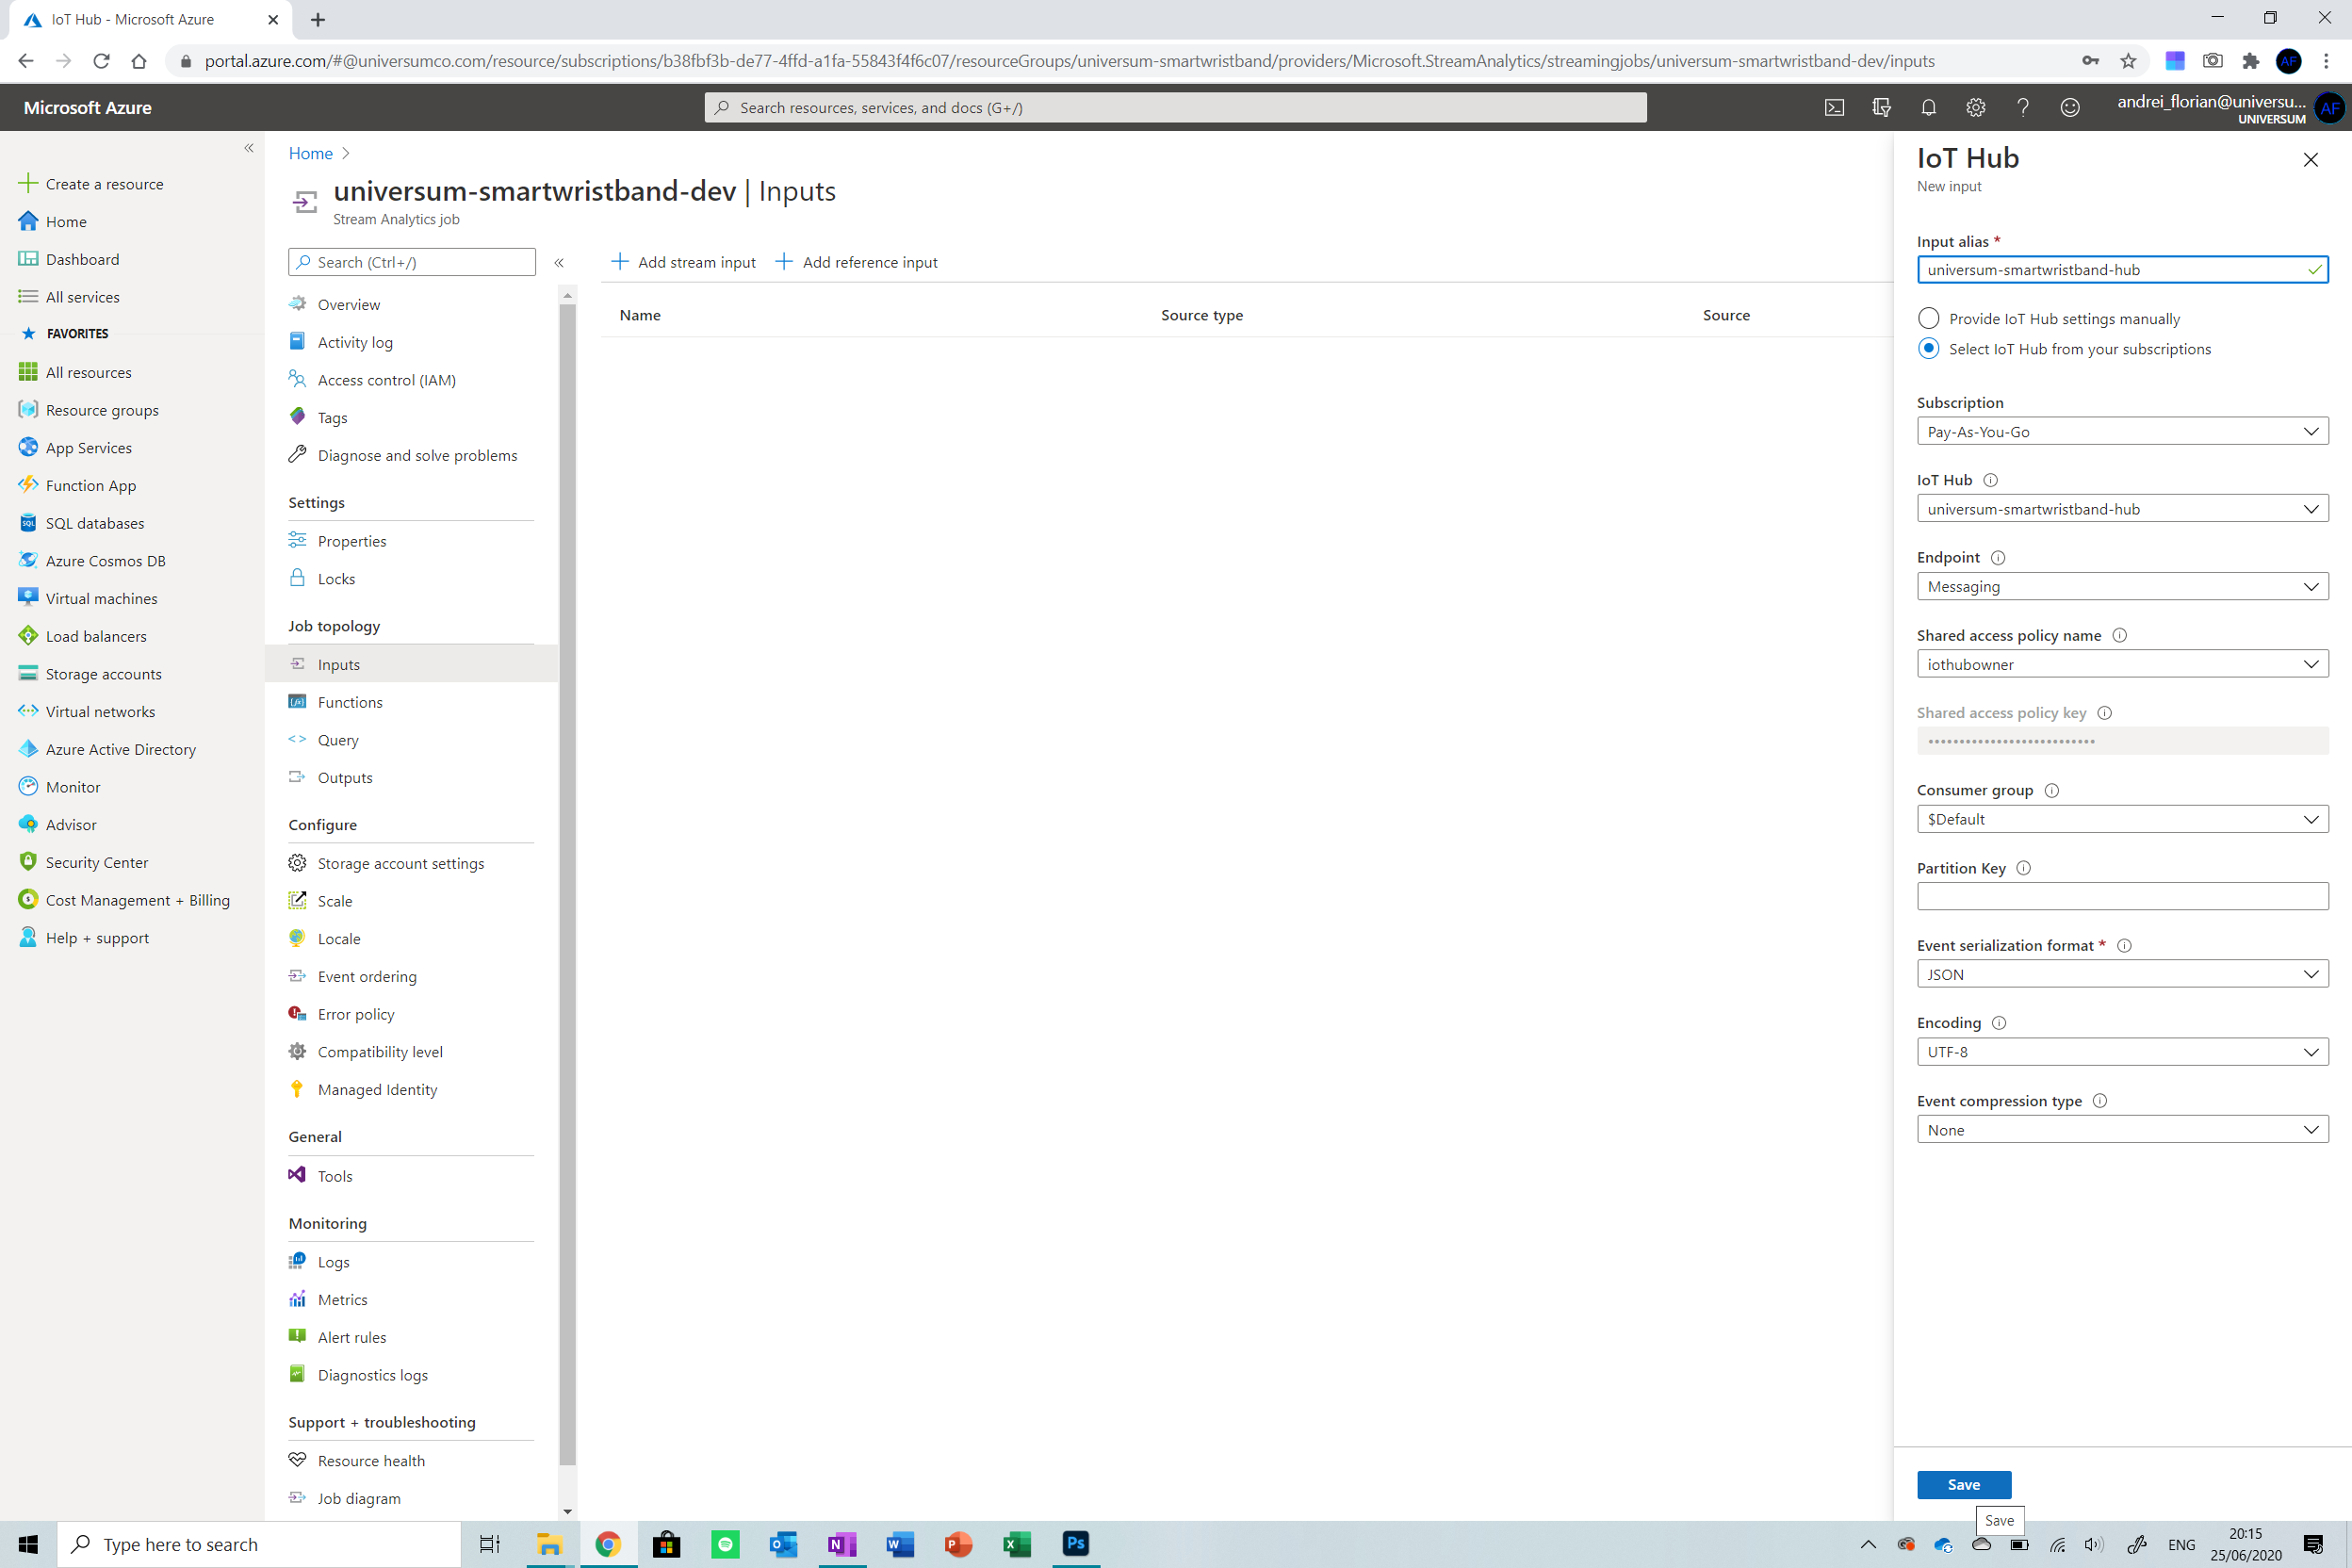
输入您的 IoT 中心的名称 然后从显示的菜单中选择它。不要更改任何其他设置。单击保存。现在点击输出 从屏幕左侧的菜单中选择选项,然后选择 Cosmos DB 提供的列表中的选项。
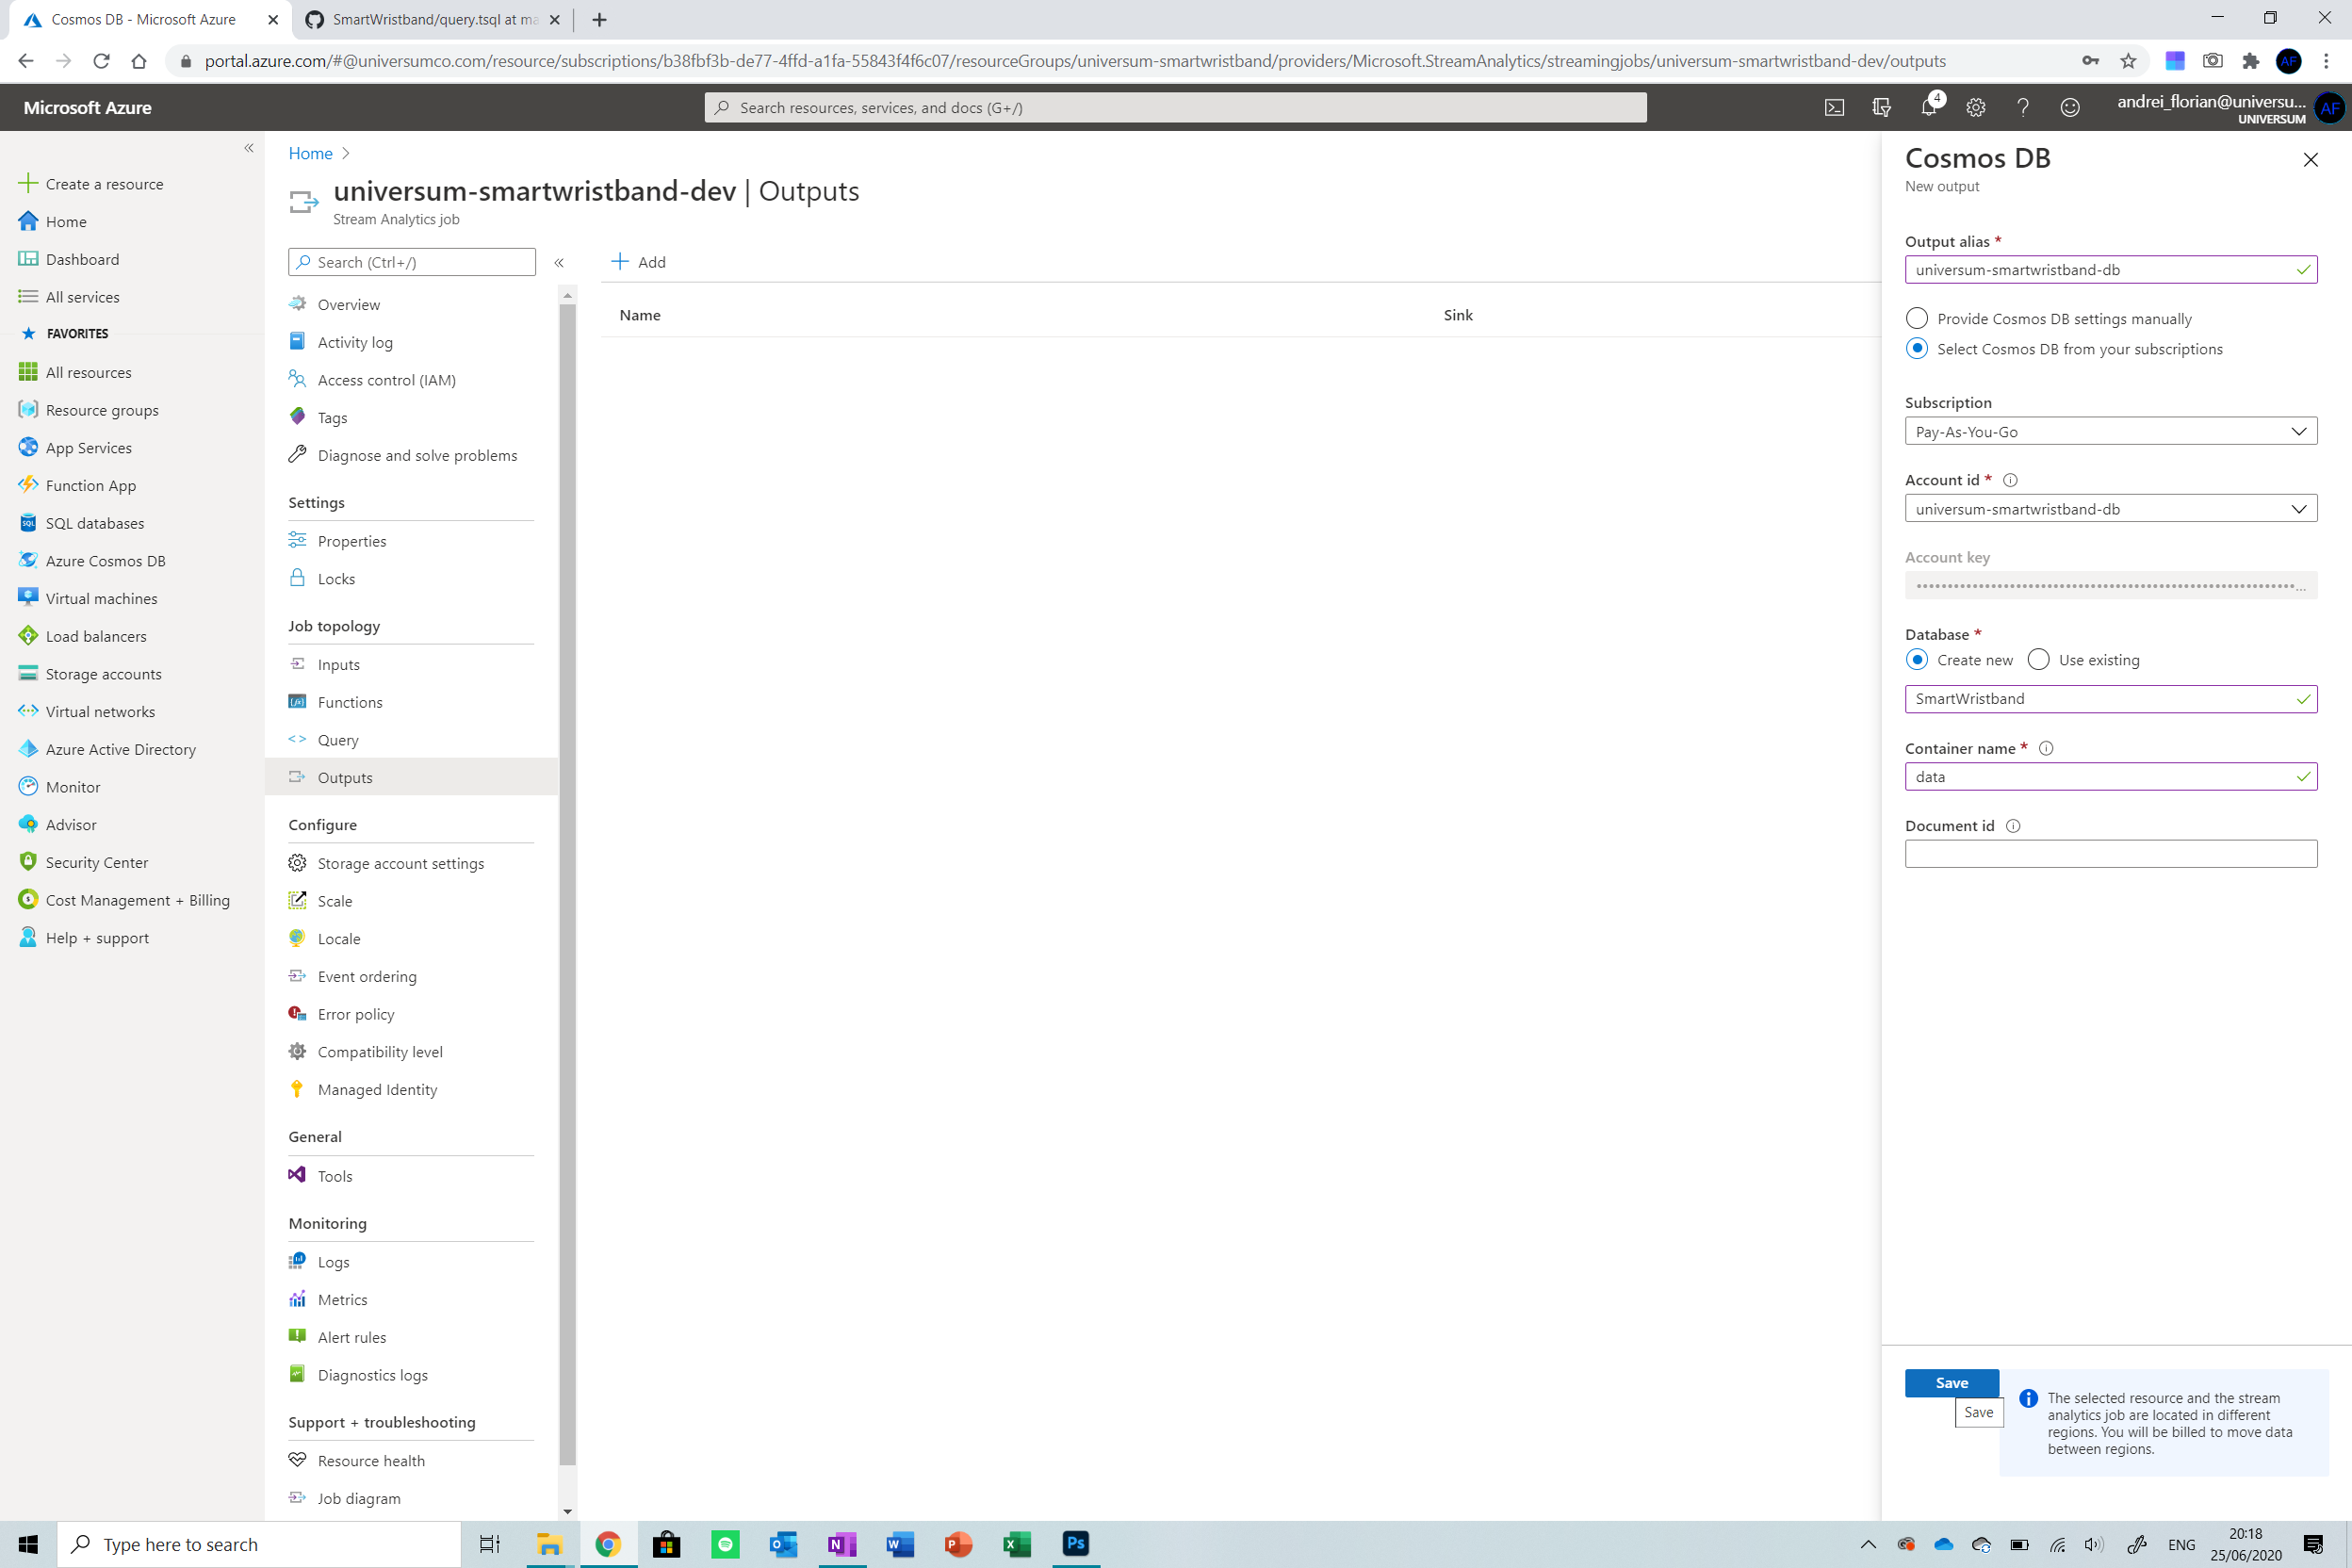
命名输出 然后从提供的选项中选择数据库。选择新建 在 Database 下并将数据库名称设置为 SmartWristband 和容器名称到数据 .将文档 ID 留空。 现在点击保存 .
我们需要做的最后一件事是点击Query 从选项。 We need to supply the service with code to route all the data from the IoT hub into the database. Copy and paste the code below into the space provided. The code will map all inputted values to outputs which will then be stored in a JSON format in the Cosmos DB.
SELECT
time as time,
id as name,
geoLat as latitude,
geoLng as longitude,
isWorn as isWorn,
heartrate as heartrate,
temperature as temperature,
battery as battery
INTO
[universum-smartwristband-db]
FROM
[universum-smartwristband-hub] 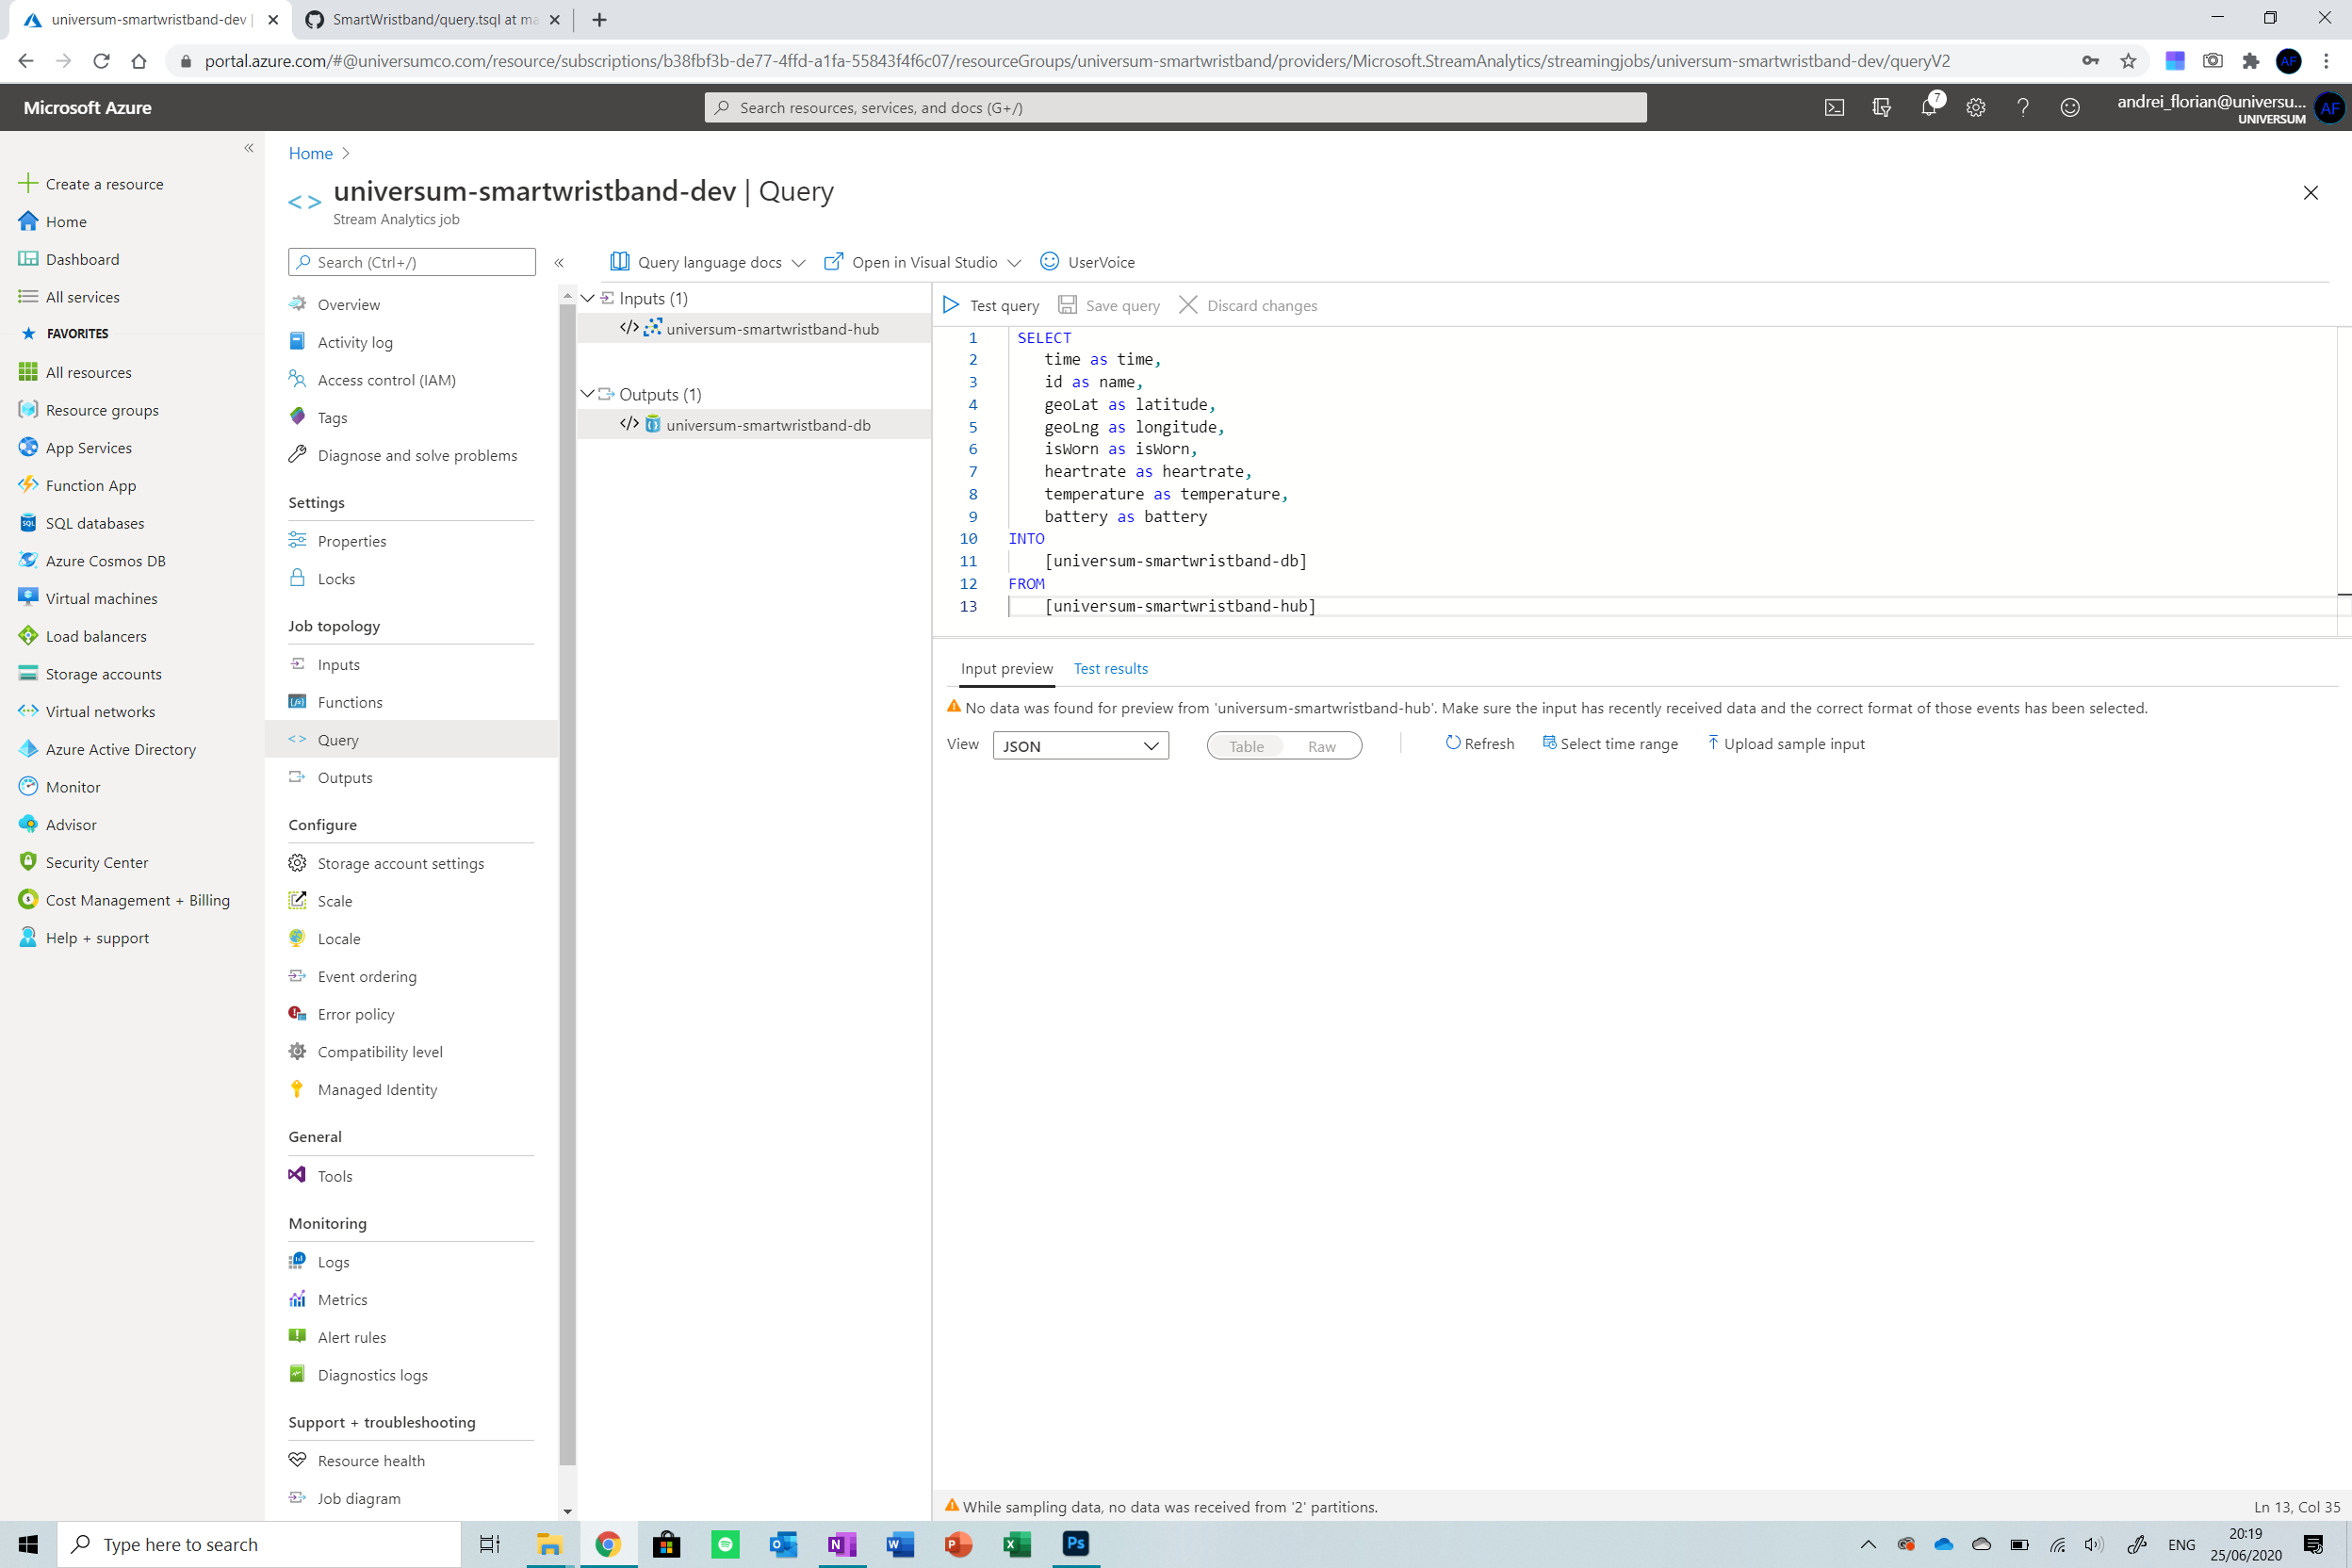
After that is done, click on the Save Query button from the menu at the top of the screen and we are ready to go. Now all we need to do is click back on Overview from the menu on the left and then start the streaming by pressing the Start button.
Step 7:Libraries Required
All libraries used in this project are open source. Below is the list of all libraries used and the links to their GitHub repositories. Please make sure you download and install them before moving on.
- MKRGSM Library - https://github.com/arduino-libraries/MKRGSM
- RTCZero Library - https://github.com/arduino-libraries/RTCZero
- Arduino Bear SSL Library - https://github.com/arduino-libraries/ArduinoBearSSL
- ArduinoECCX08 Library - https://github.com/arduino-libraries/ArduinoECCX08
- Arduino MQTT Client Library - https://github.com/arduino-libraries/ArduinoMqttClient
- Arduino Low Power Library - https://github.com/arduino-libraries/ArduinoLowPower
- DFRobot Heartrate Library - https://github.com/DFRobot/DFRobot_Heartrate
Step 8:Preparing the Variables
Now we can focus on the frontend of the application . Open the code from the GitHub repo in the Arduino IDE or web IDE and follow along with the steps below to edit the variables in the document so that the MKR GSM will be able to connect to Azure IoT.
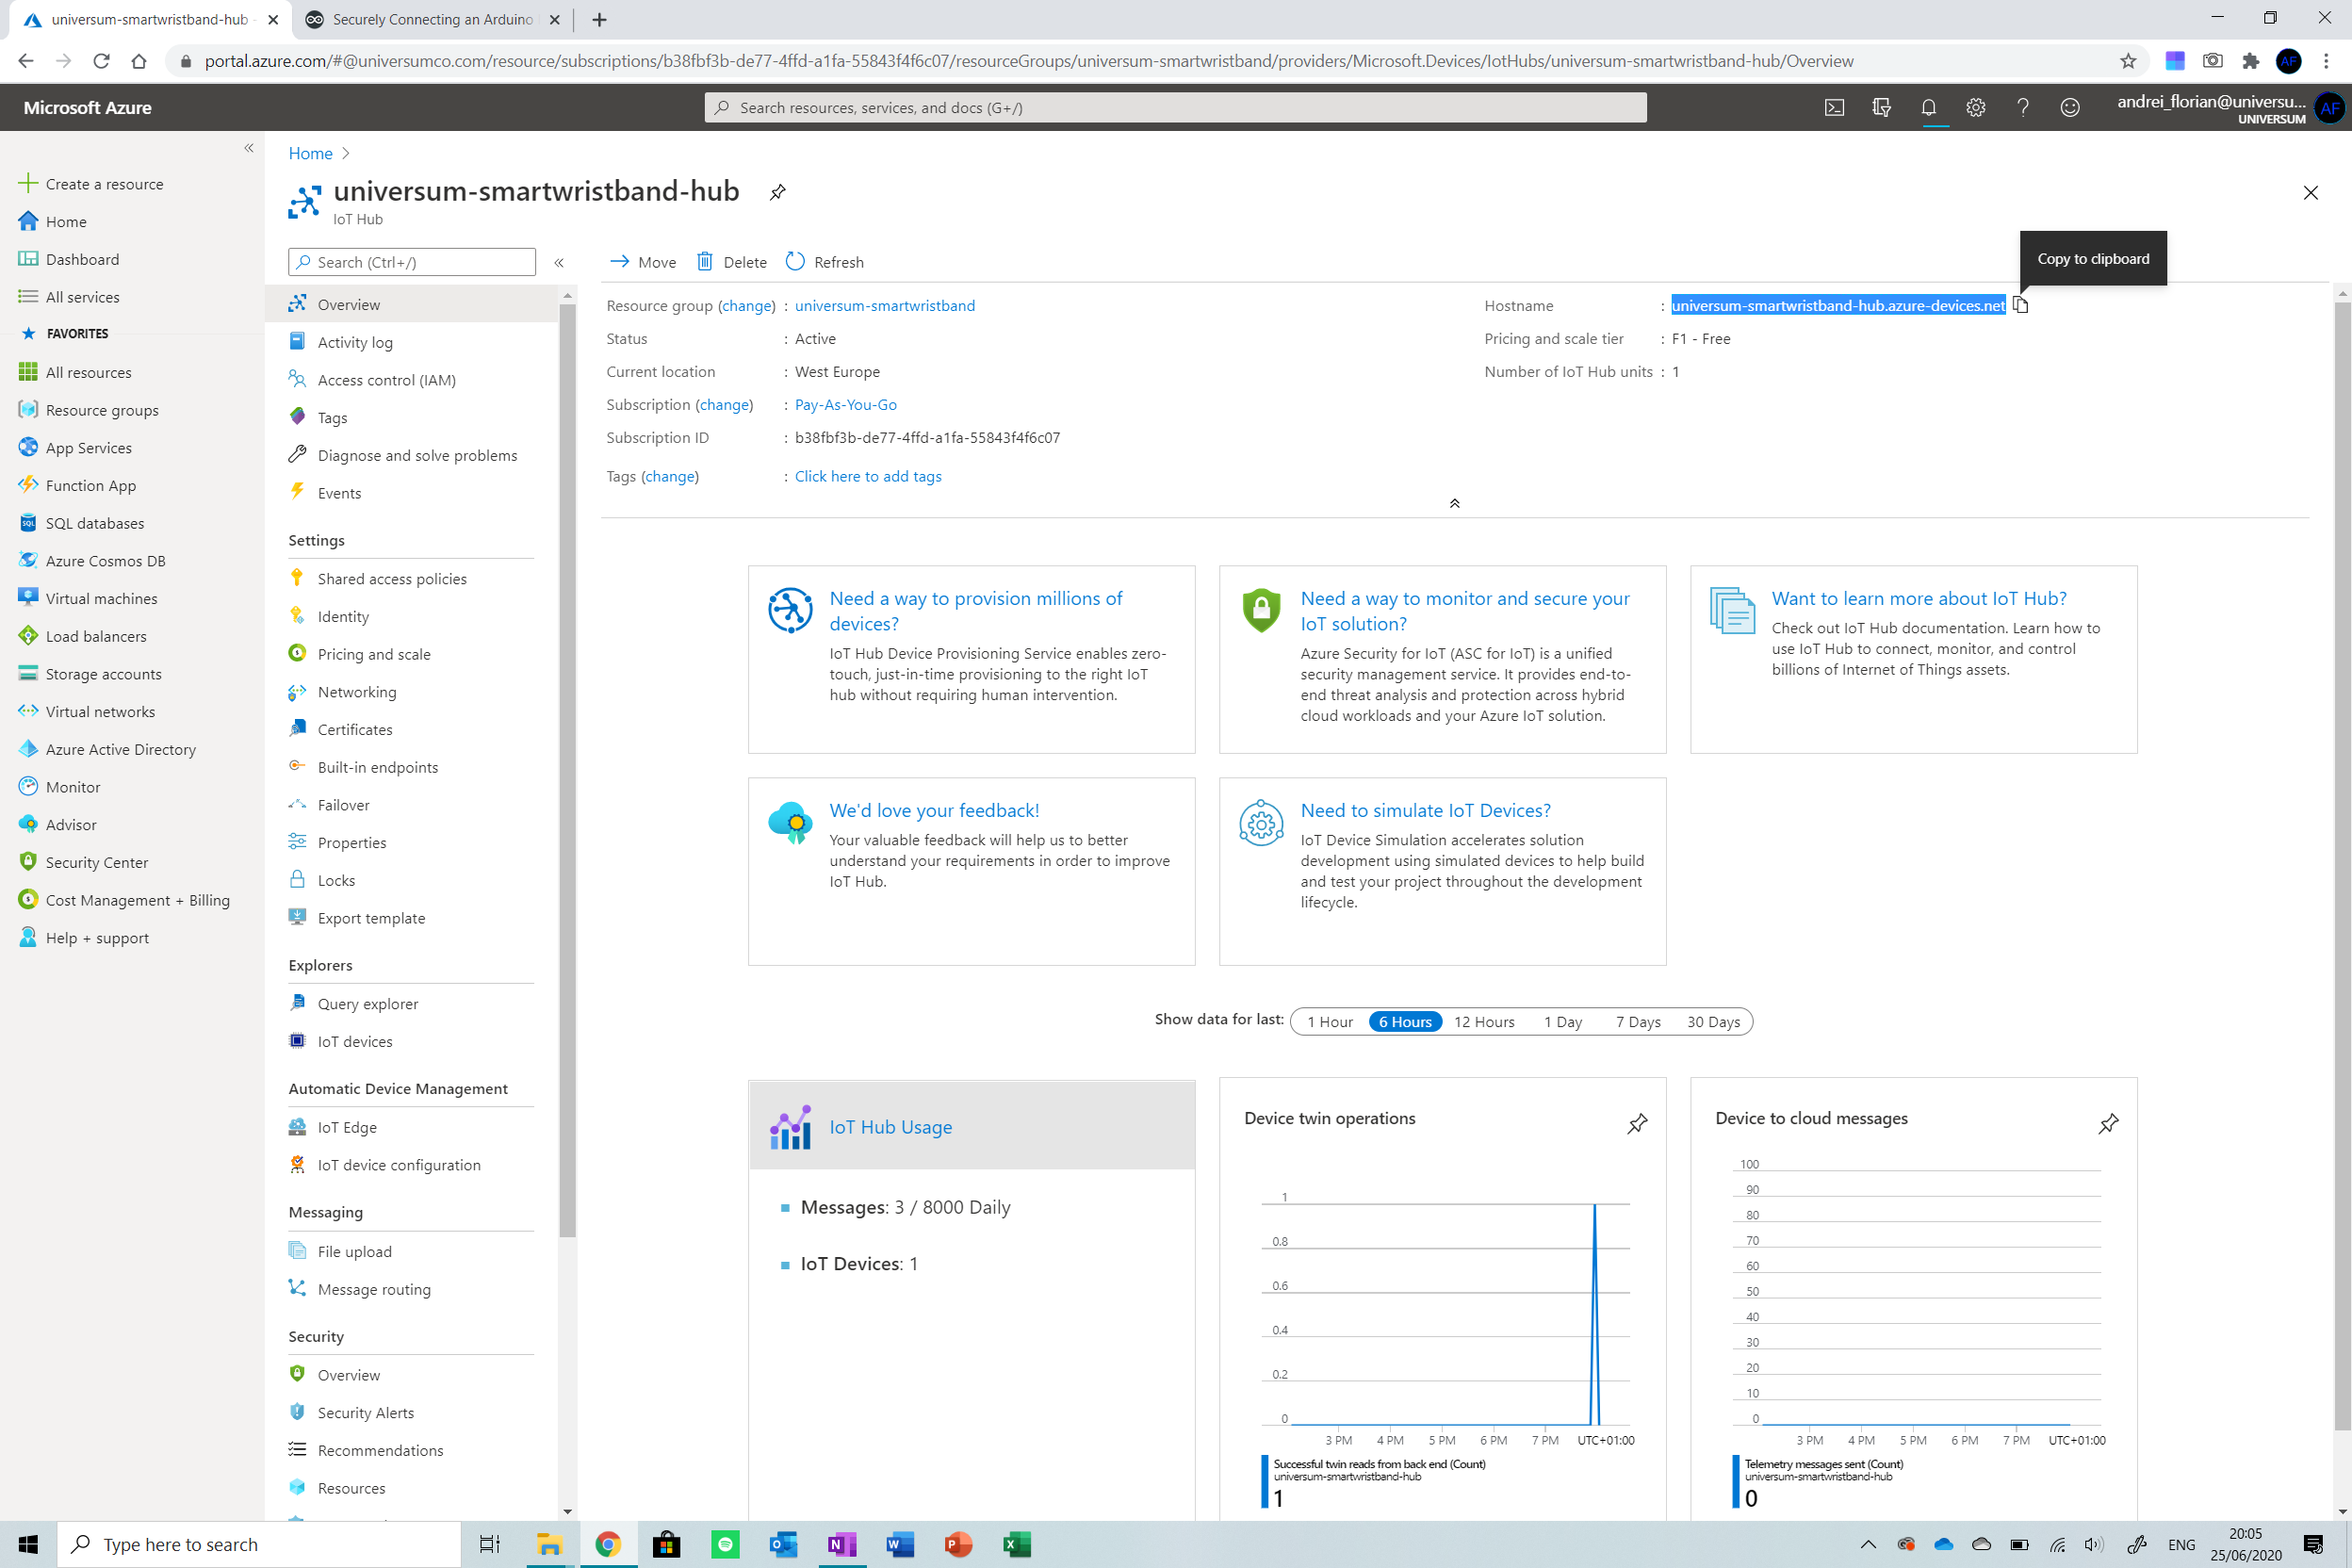
The first thing we will need to do is navigate to the IoT hub created and copy the hostname 显示。 Now open the secrets.h file from the project and input this string into the SECRET_BROKER field.
The next thing is getting the device name. This is simply the name given to the device in the IoT Hub. Copy the name displayed and then paste it in the SECRET_DEVICEID field in the secrets.h 文件。 At the end, your file should look something like this.
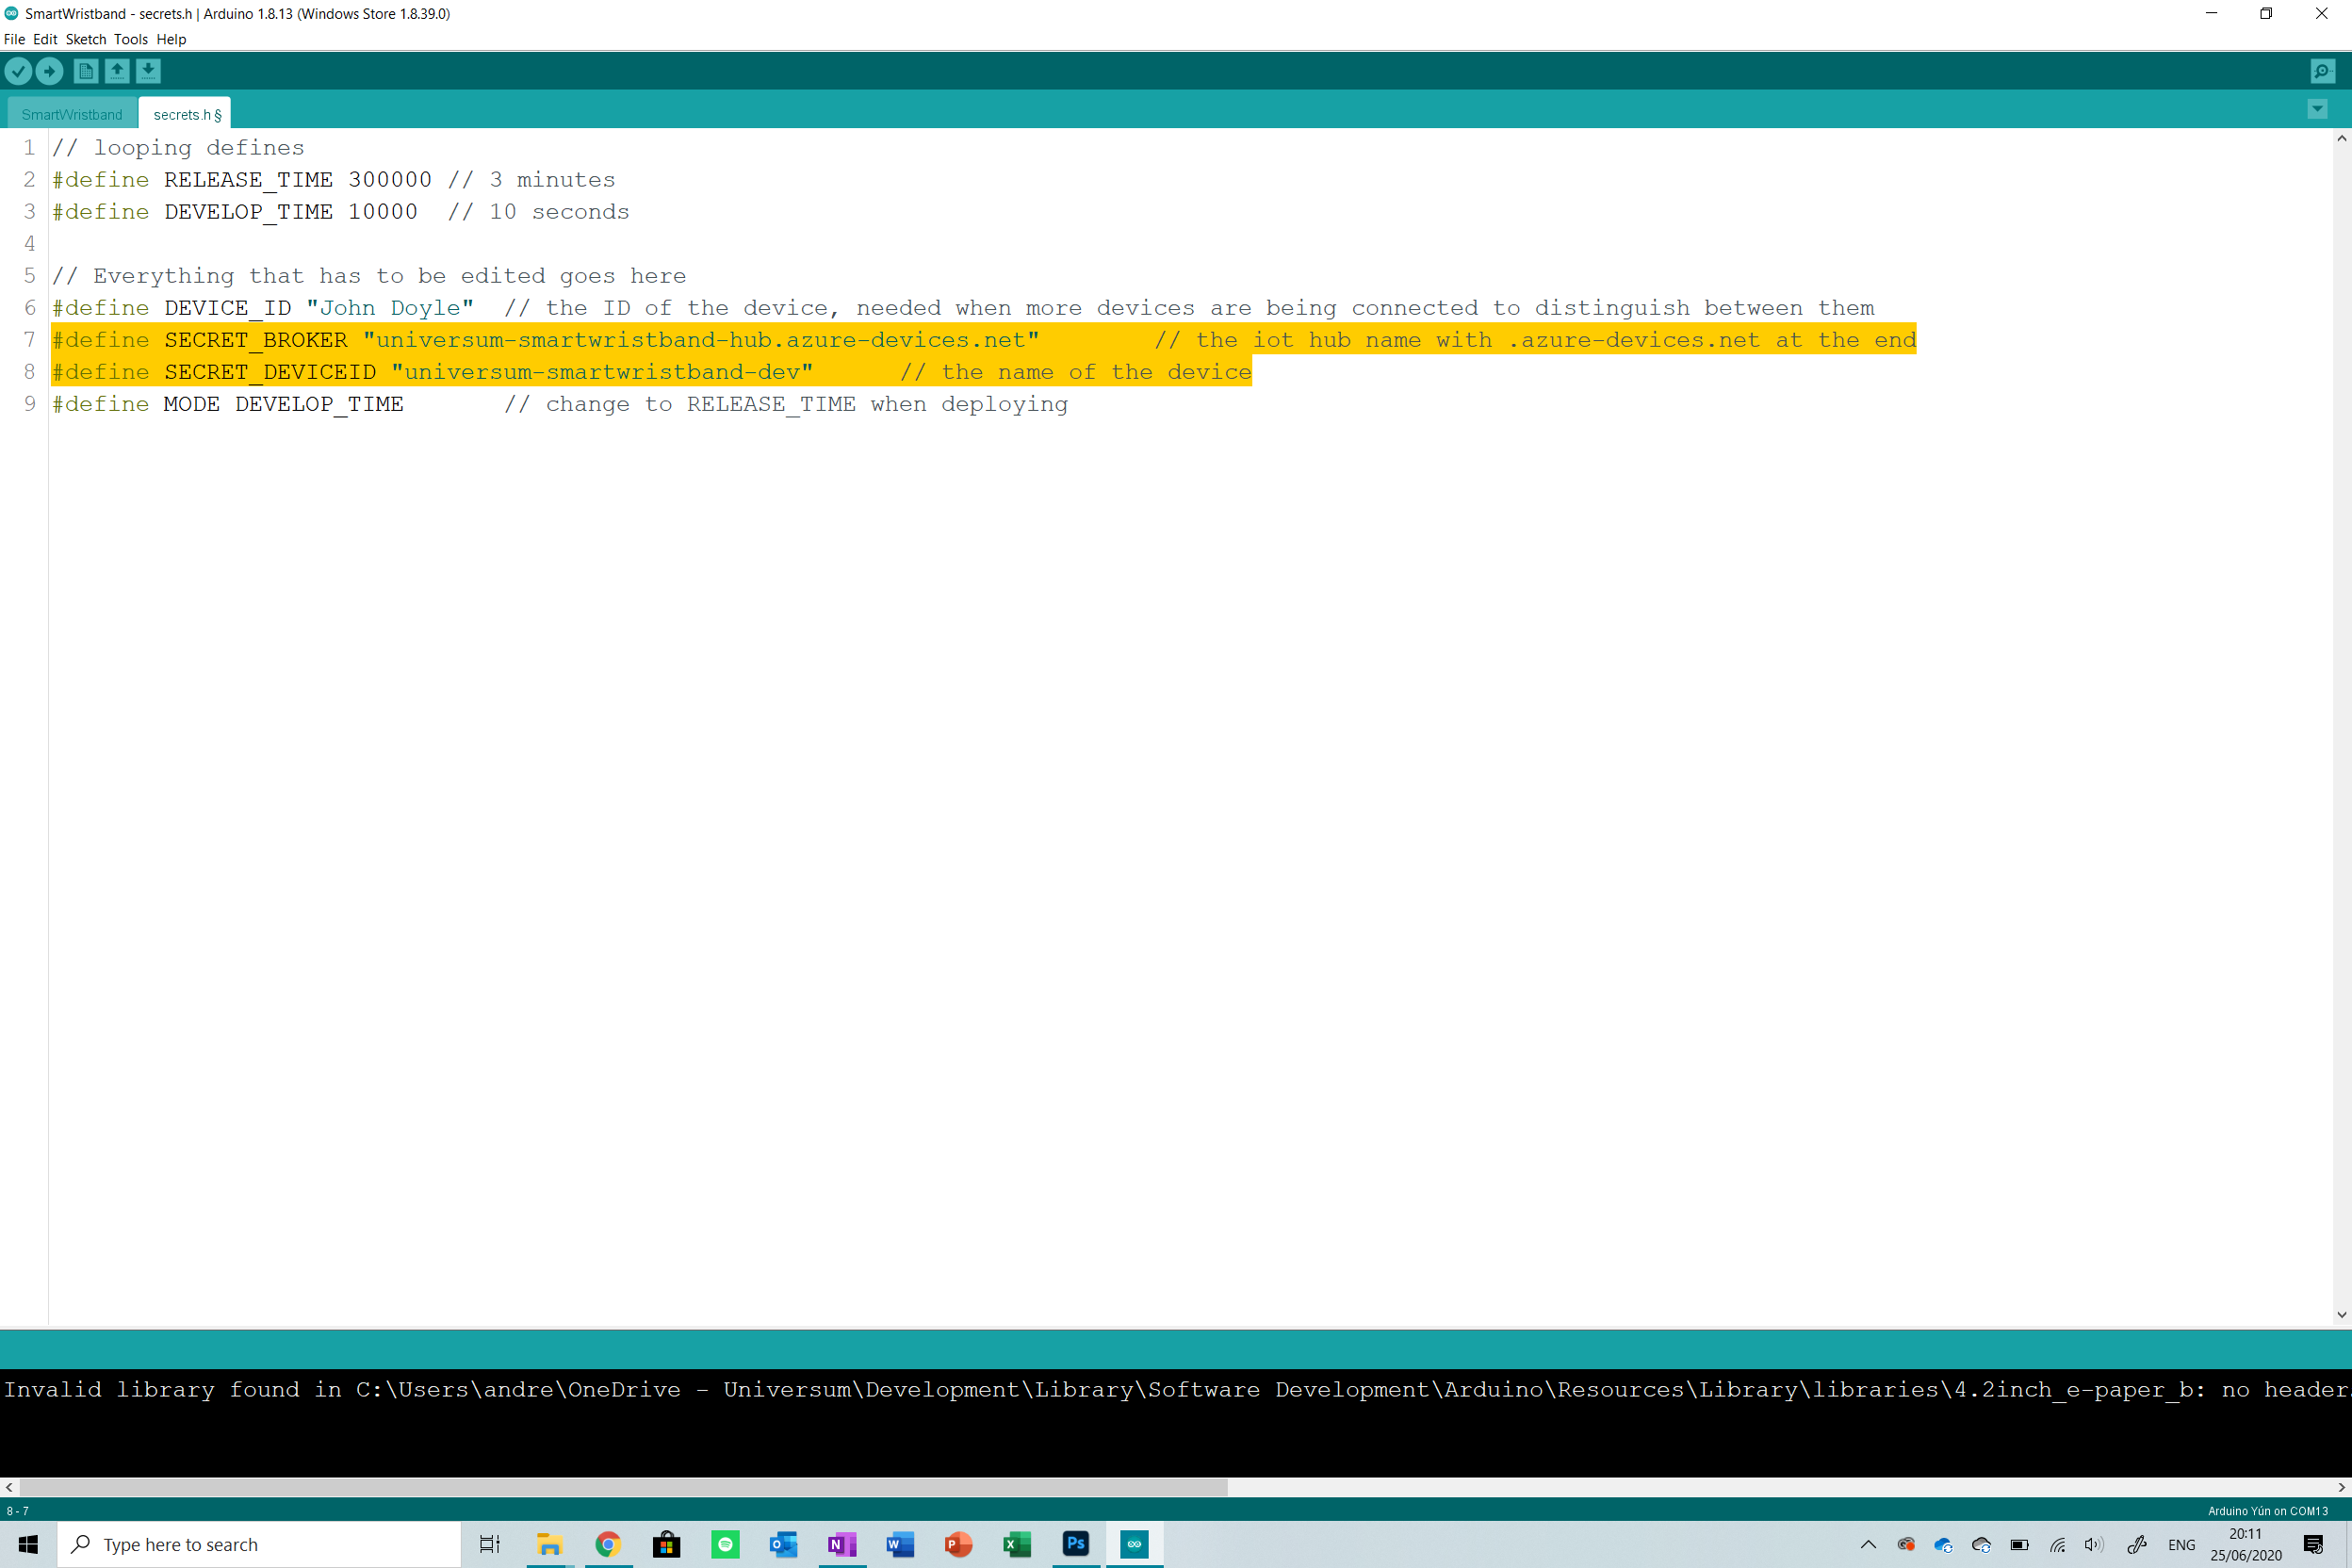
The last thing you need to do is change the DEVICE_ID . I included this feature so that all devices would have a specific ID when deployed . You can set the ID to the name of the patient or a string to be able to identify the devices and distinguish them.
Finally, I want to talk about the MODE option . When I created this project, I needed to have a way to easily test and troubleshoot the application before deploying it. The mode of the application solves this. There are two modes in which the application can be set:
- DEVELOP_TIME is the developing mode. Here, the device prints verbose to the serial (the device only works connected to the computer with the serial monitor on). The device also wakes up and collects data every 10 seconds.
- RELEASE_TIME is the release mode. Here, the application works as expected, it can work on the field without the need of a connection to a computer, it will also take samples every 5 minutes as opposed to 10 seconds.
We will toggle between these modes later, for now, leave it in DEVELOP_MODE .
Step 9:Flashing the Developer Version
Now that all the setup is done, we need to test the code out to ensure it is running in the DEVELOP_MODE. To do this, ensure that you followed all the steps above and then connect your device to your PC or mac via USB and then upload the sketch.
Open the serial monitor (ctrl/cmd-shift-m) and view the verbose. It will take a while to configure the first time, ensure that the data is being sent to the IoT Hub correctly. Then visit the IoT Hub and check the graphs to see if data was received. You are now ready to deploy the application! If you need help troubleshooting, you can contact me through Hackster.
Step 10:Shipping the release version
To change to the release version, all you need to do is change the MODE definition in the secrets.h file to RELEASE_TIME . Now upload this code to the device, ensure the LiPo battery is connected and then unplug it from the computer.
You should see the onboard LED of the device flashing every 10 minuets indicating that a cycle is running. Check the IoT Hub and Cosmos DB database to ensure that the data is going through. Now you are ready to deploy the device!
Ensure you send some data to the backend before continuing as we will need this when creating the dashboard.
Step 11:Onto the Dashboard
Creating the dashboard is meticulous work and takes a long amount of time. In this section I will explain working with the data in the Power Bi dashboards and reports , I will not go over how to design the dashboard because this is up to personal preference but will link tutorials that show you how to do this in detail.
Doctor Dashboard
I will start with the doctor dashboard. Make sure you have Power Bi desktop installed on your PC. Mac users can use the Power Bi online version to create this report, everything is basically the same.
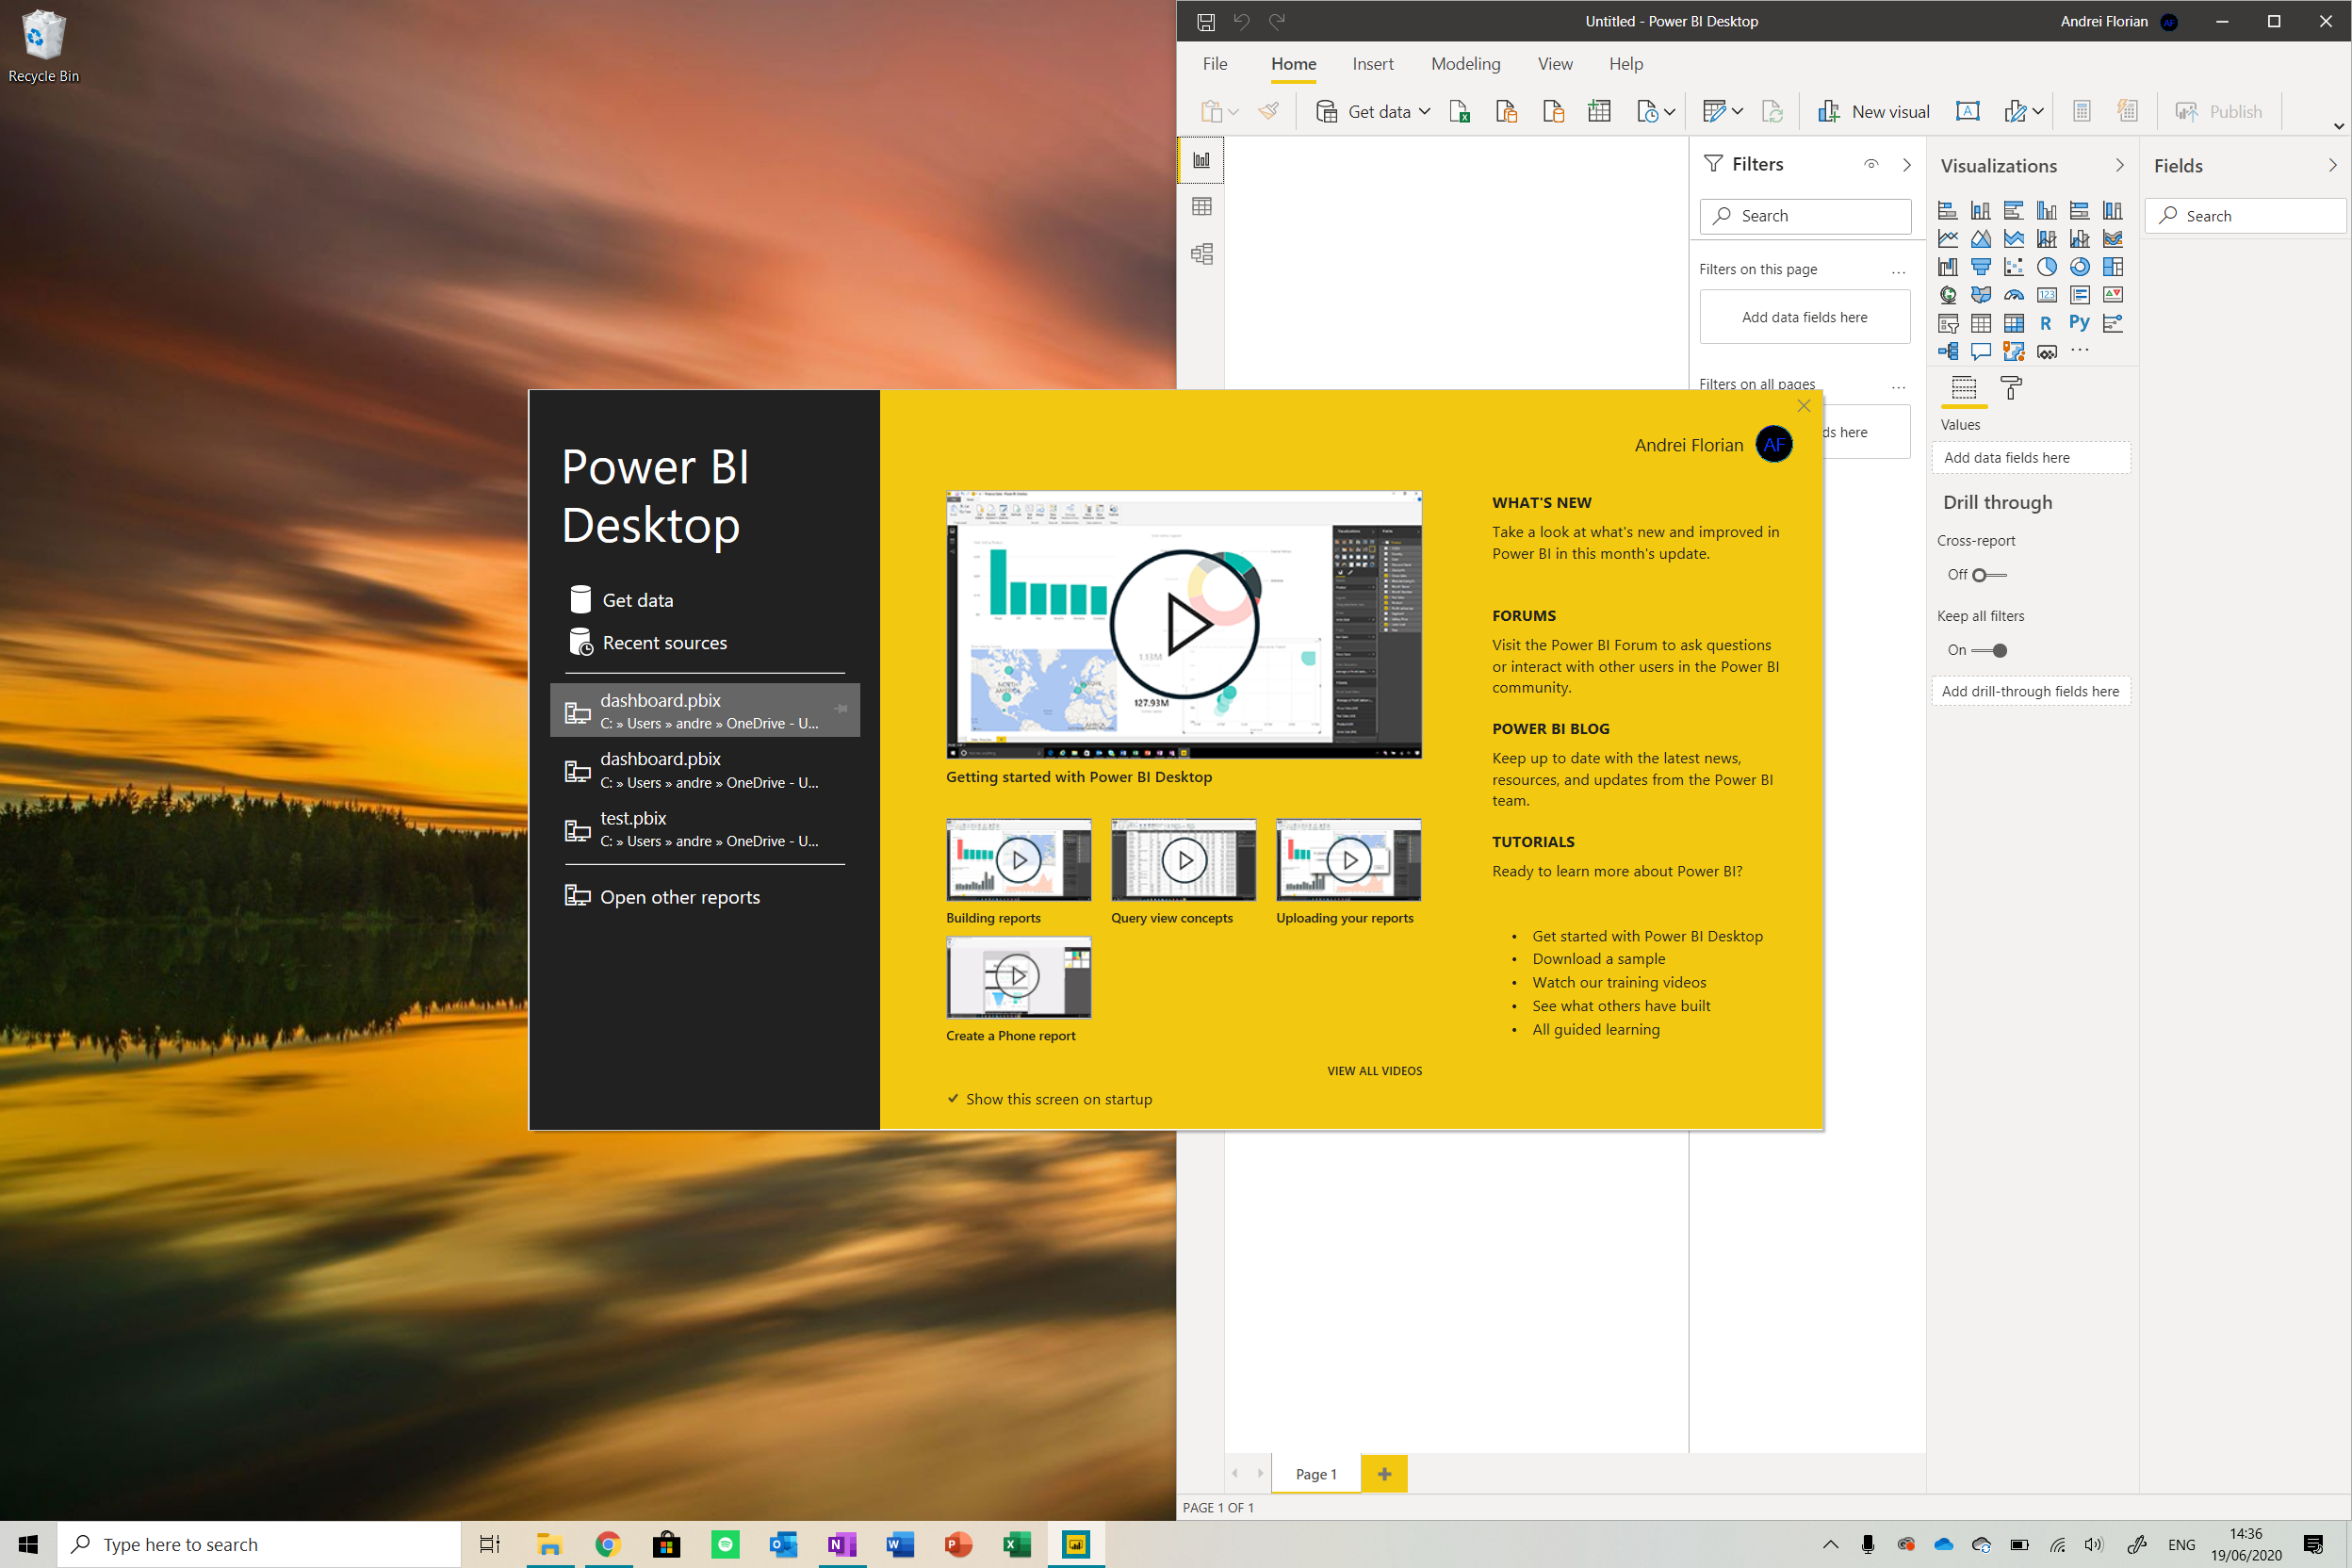
Launch the application and click on the Get Databutton . Now navigate to the Azure option and select Cosmos DB from the options.

Now go to your Cosmos DB resource and copy the URI link and paste it in the field in Power Bi. Sign in if this is required.
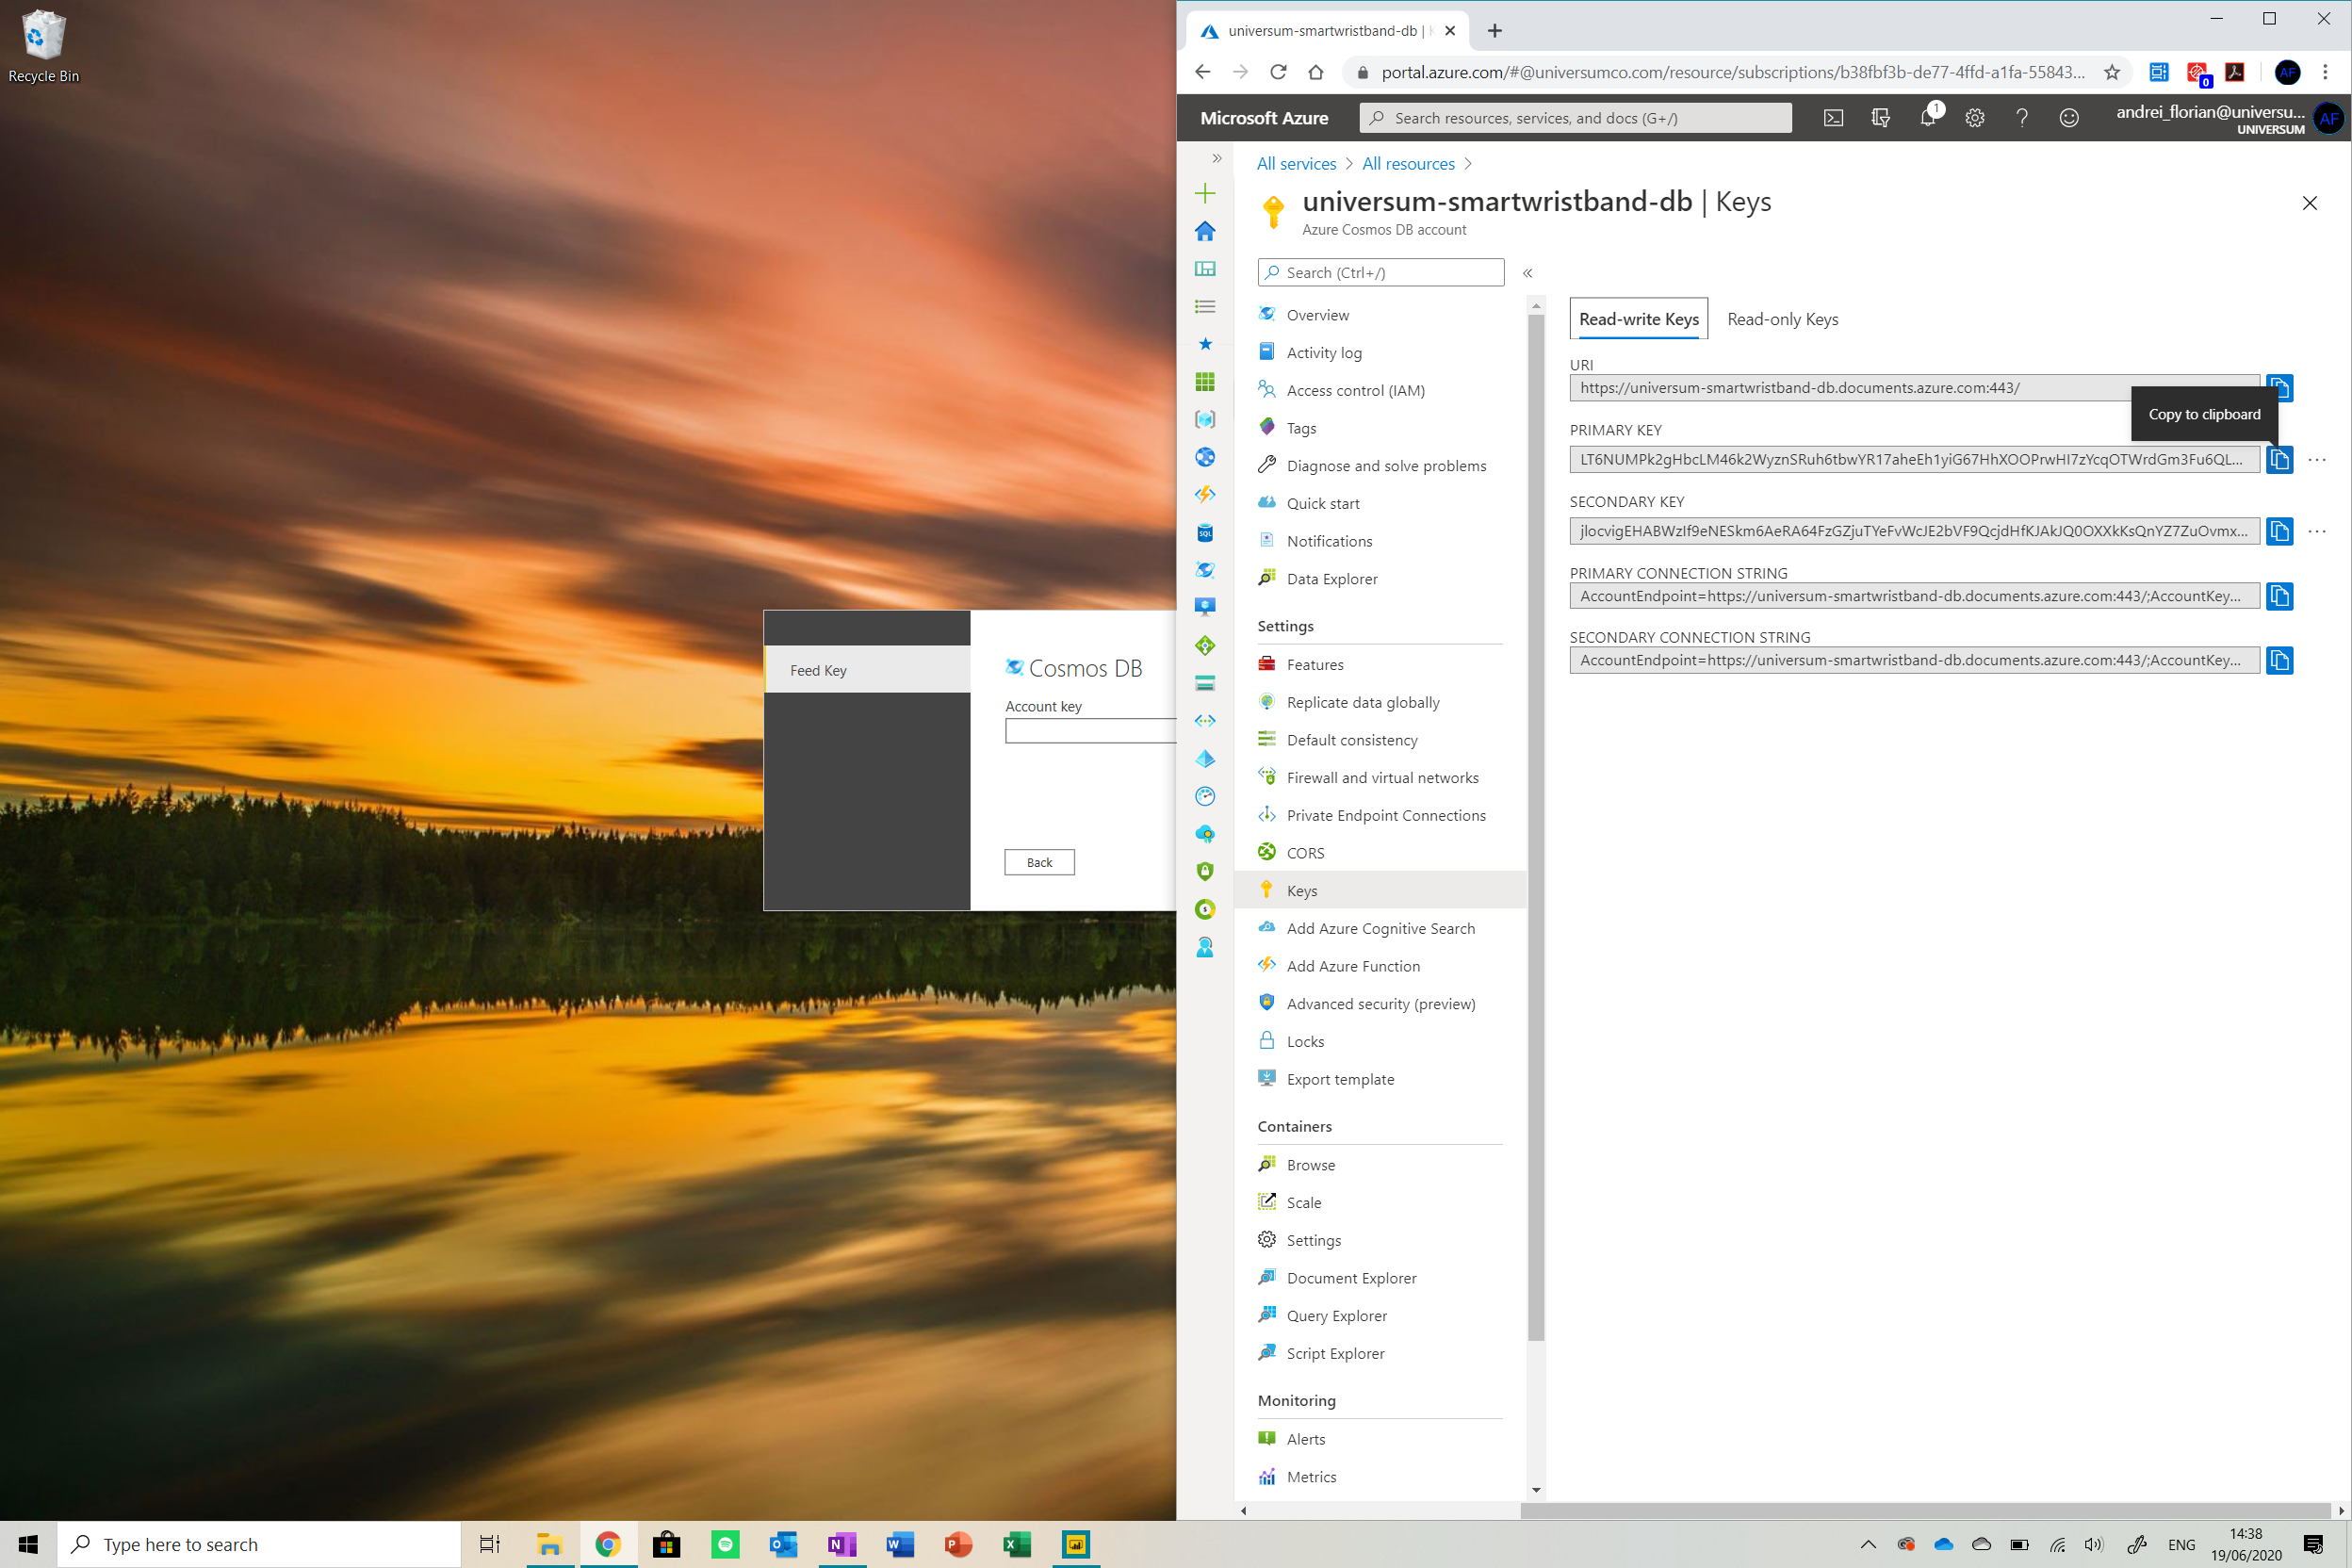
Now we need to go to the keys window in the Cosmos DB dashboard and copy the PRIMARY KEY and paste it into the Account Key field . Now navigate through the database and ensure that the datafile 被检查。 Click load and then we are ready to go!
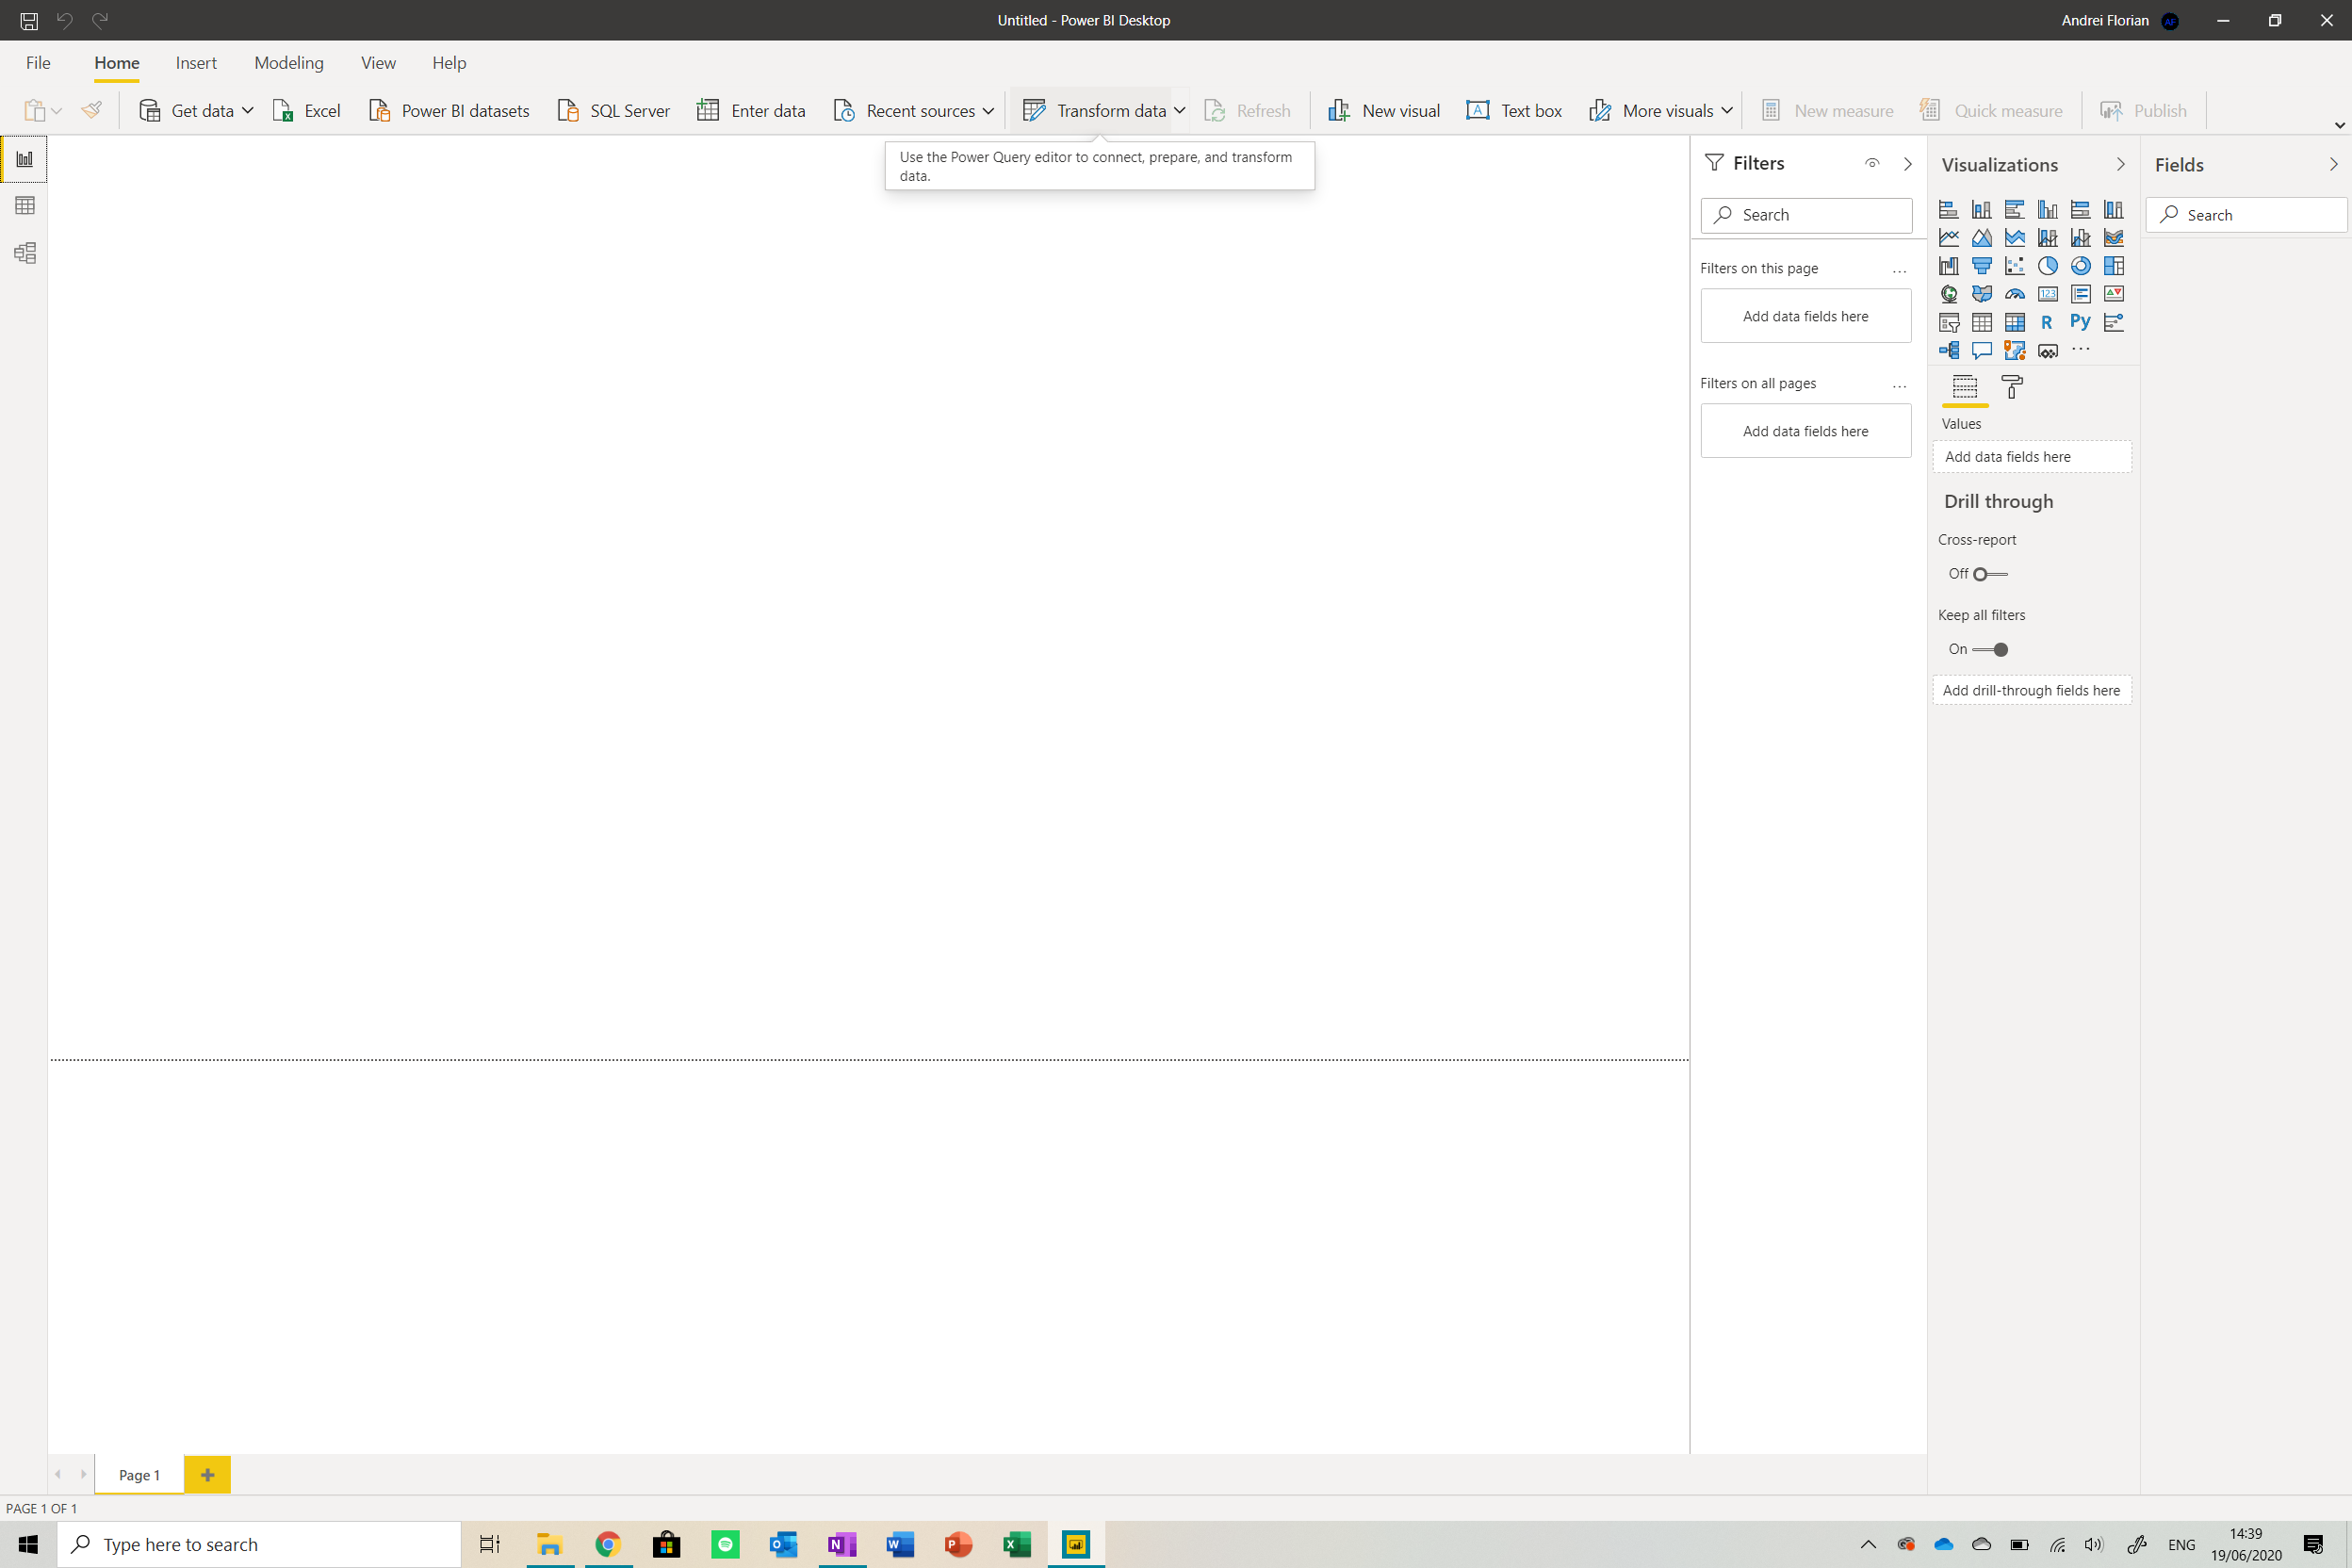
Now that you are in the report, find the Transform databutton from the menu at the top of the screen. Click it to get a table with data.
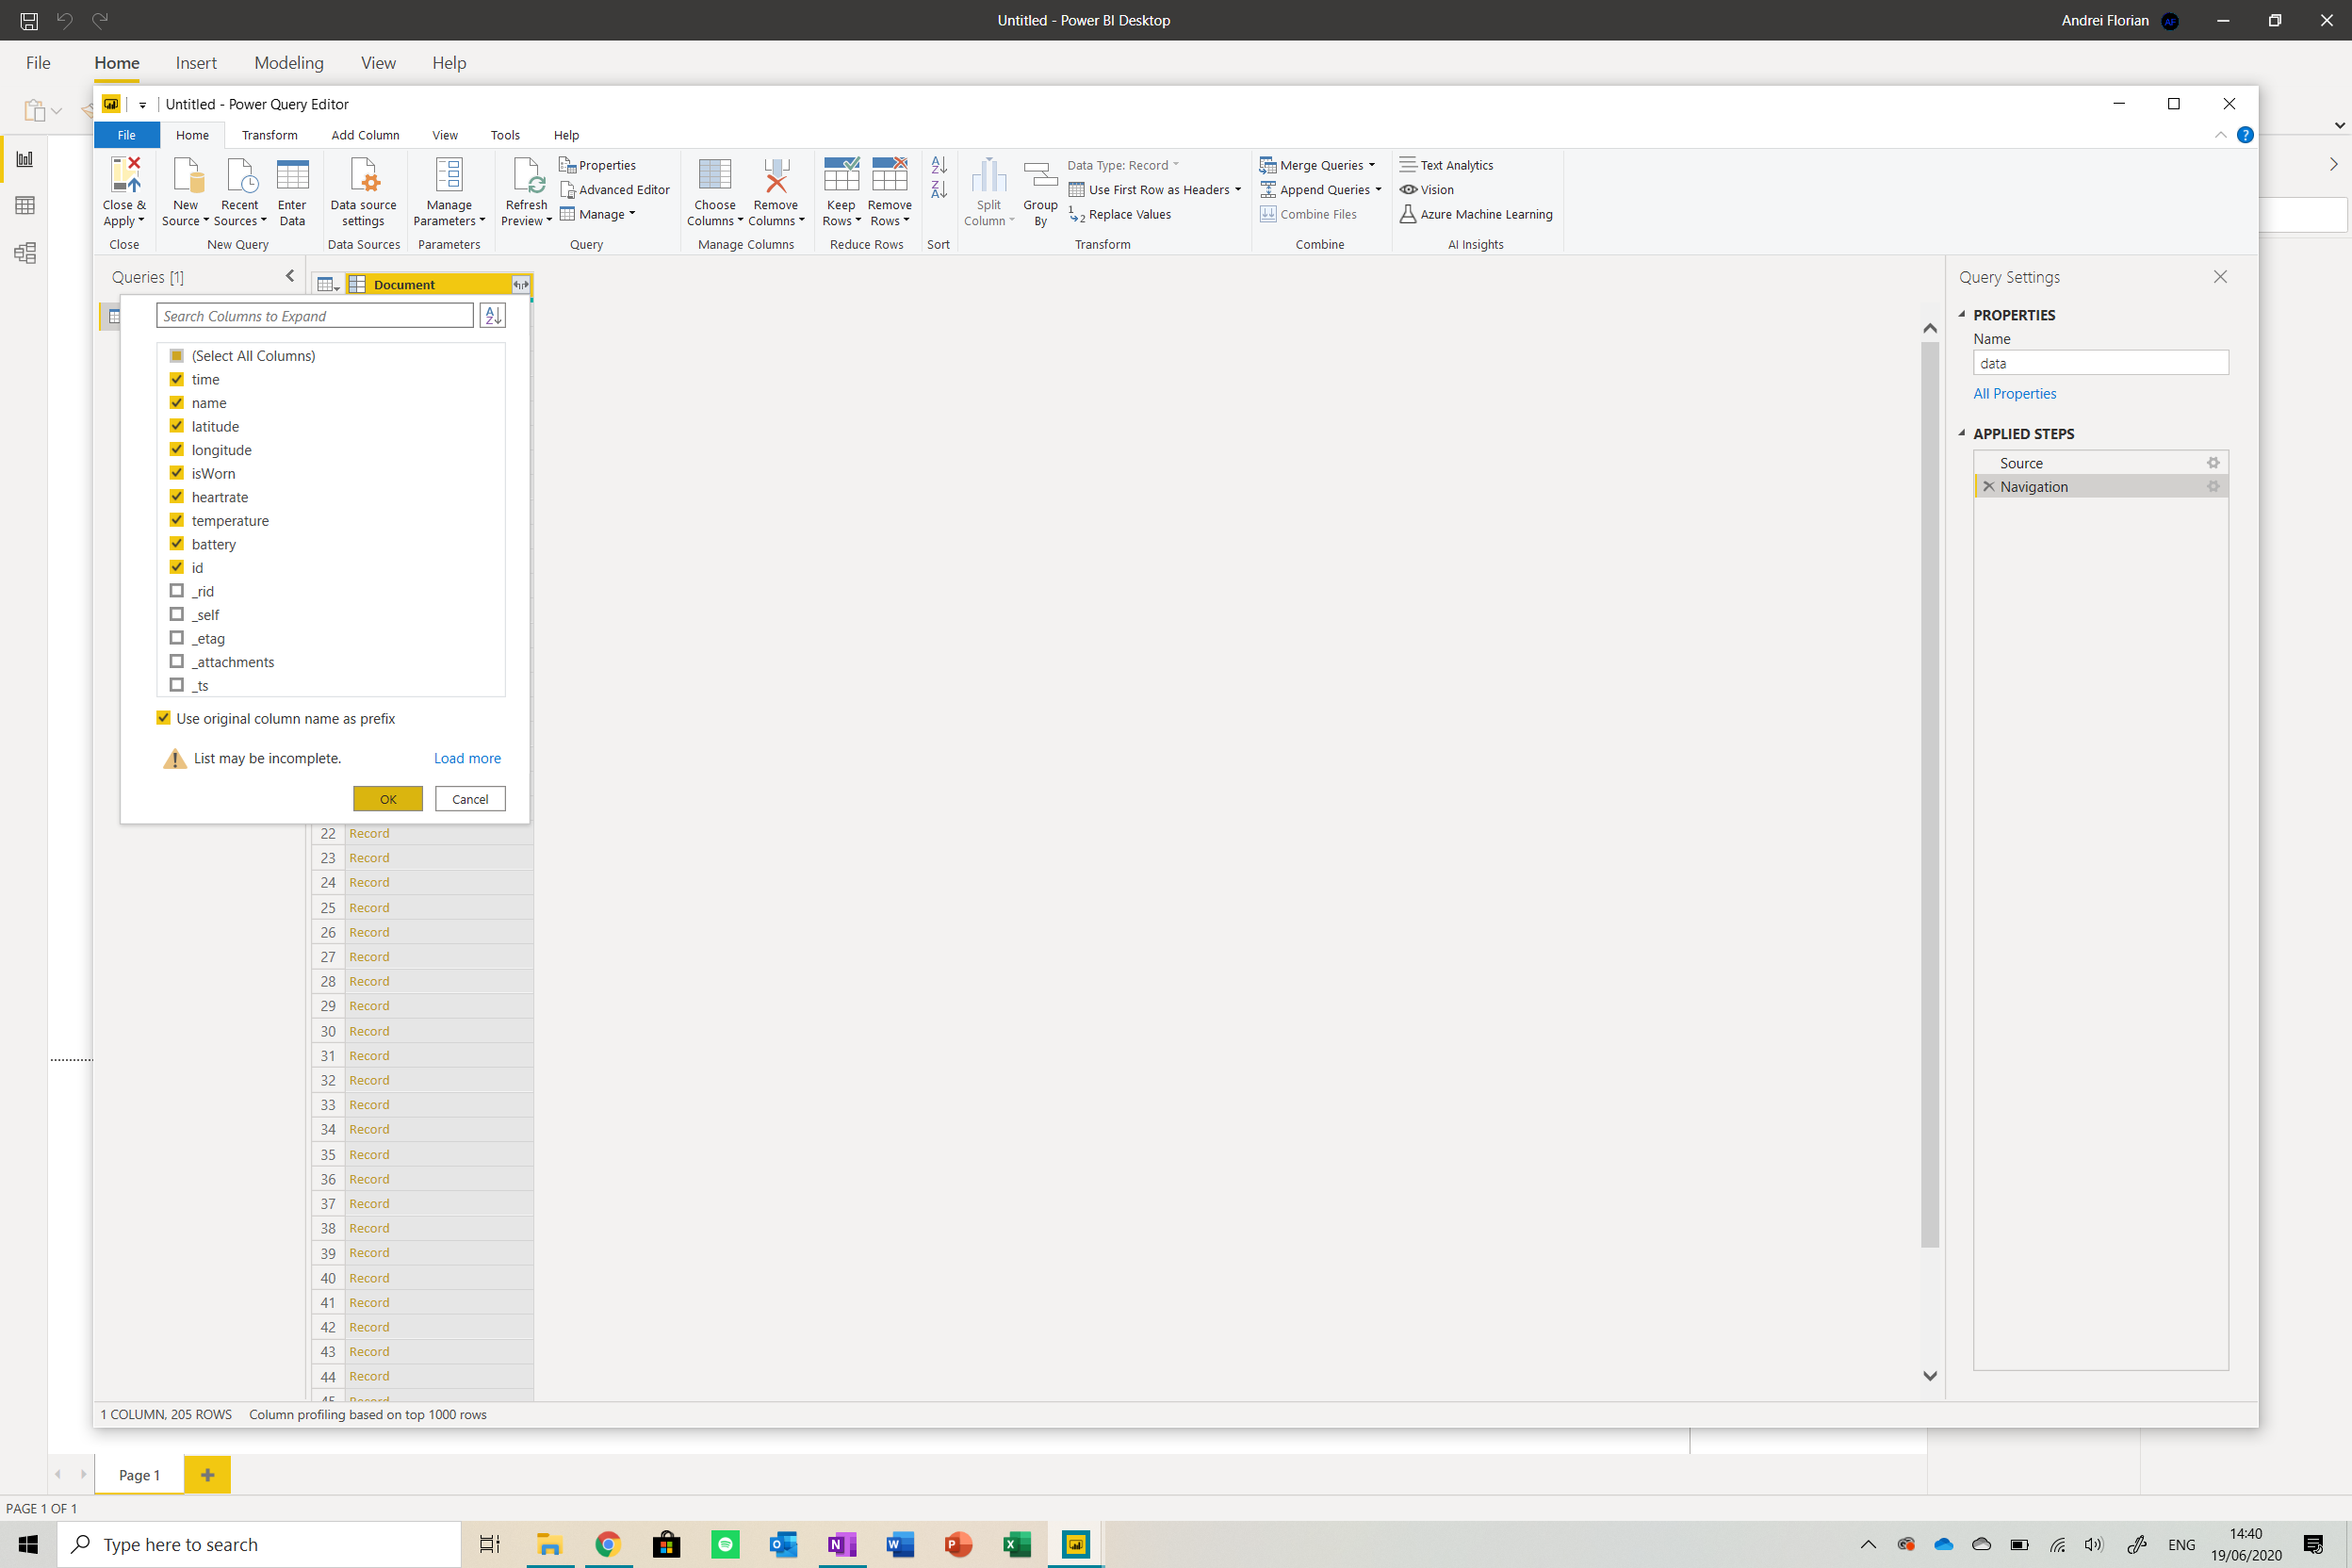
Click on the button next to the title of the table and select the fields shown above. You should see your table expand.

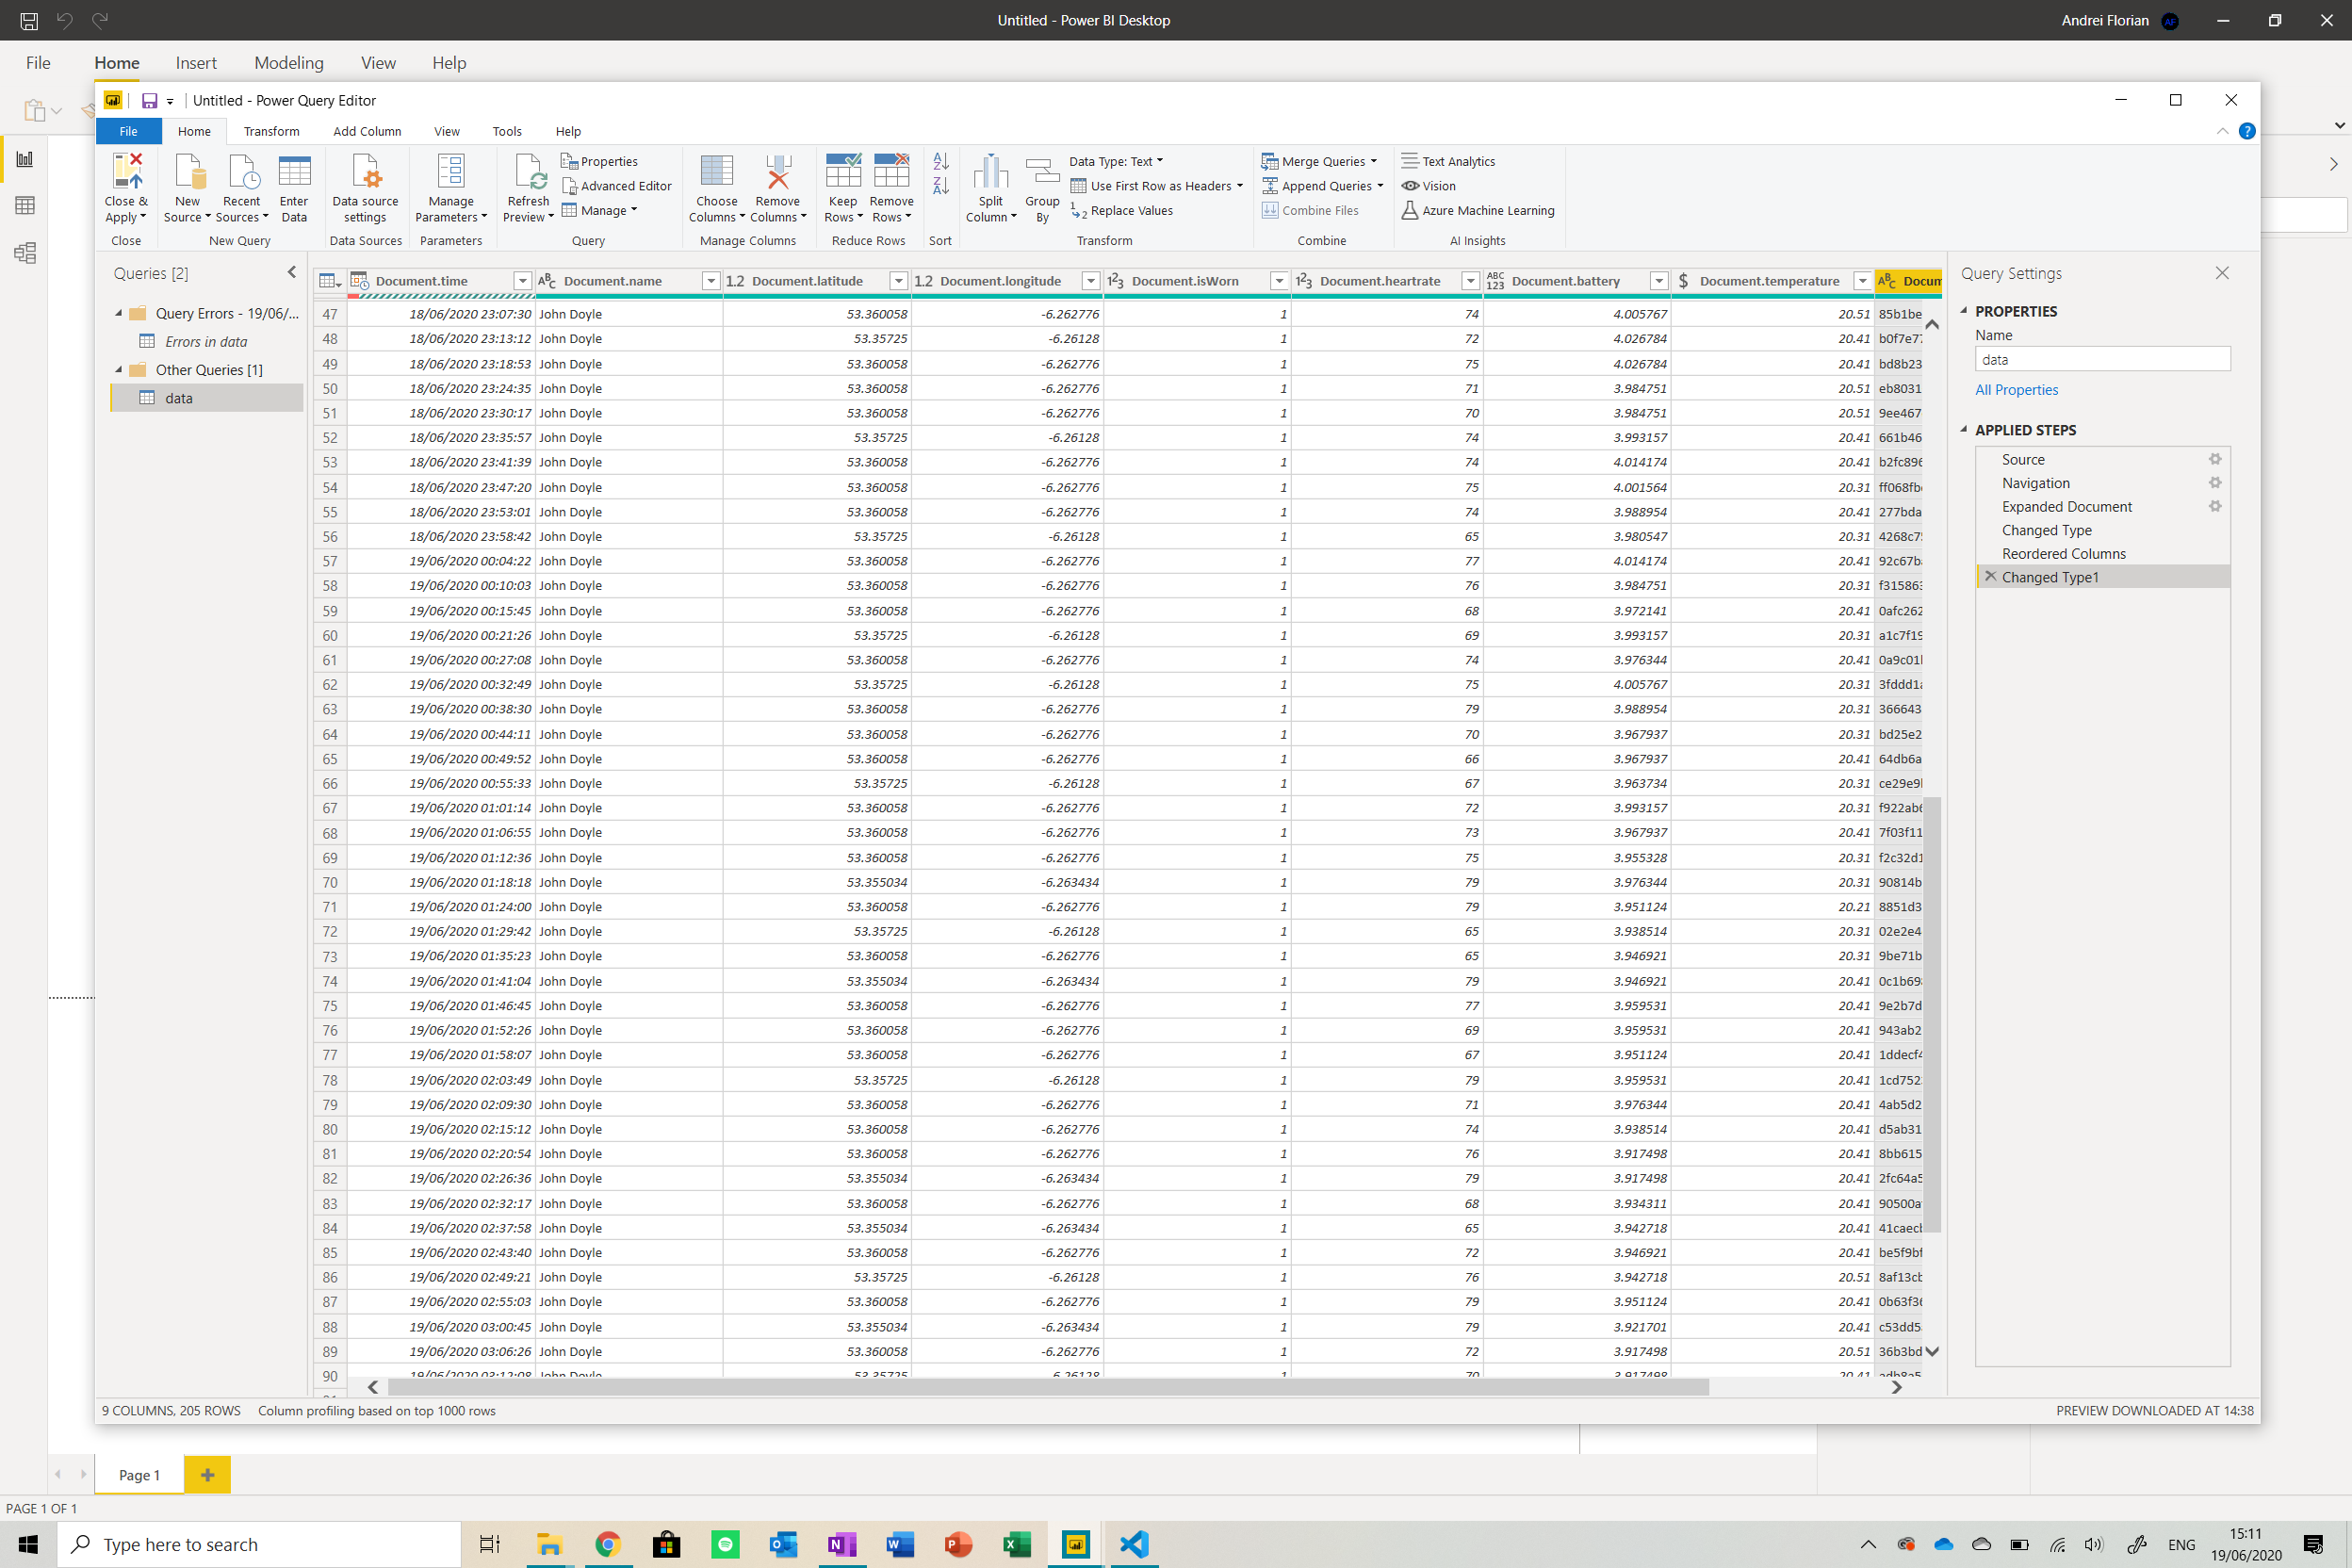
Now we need to change the data types of the rows. Identify the Data Type button from the menu at the top of the screen and change the values accordingly.
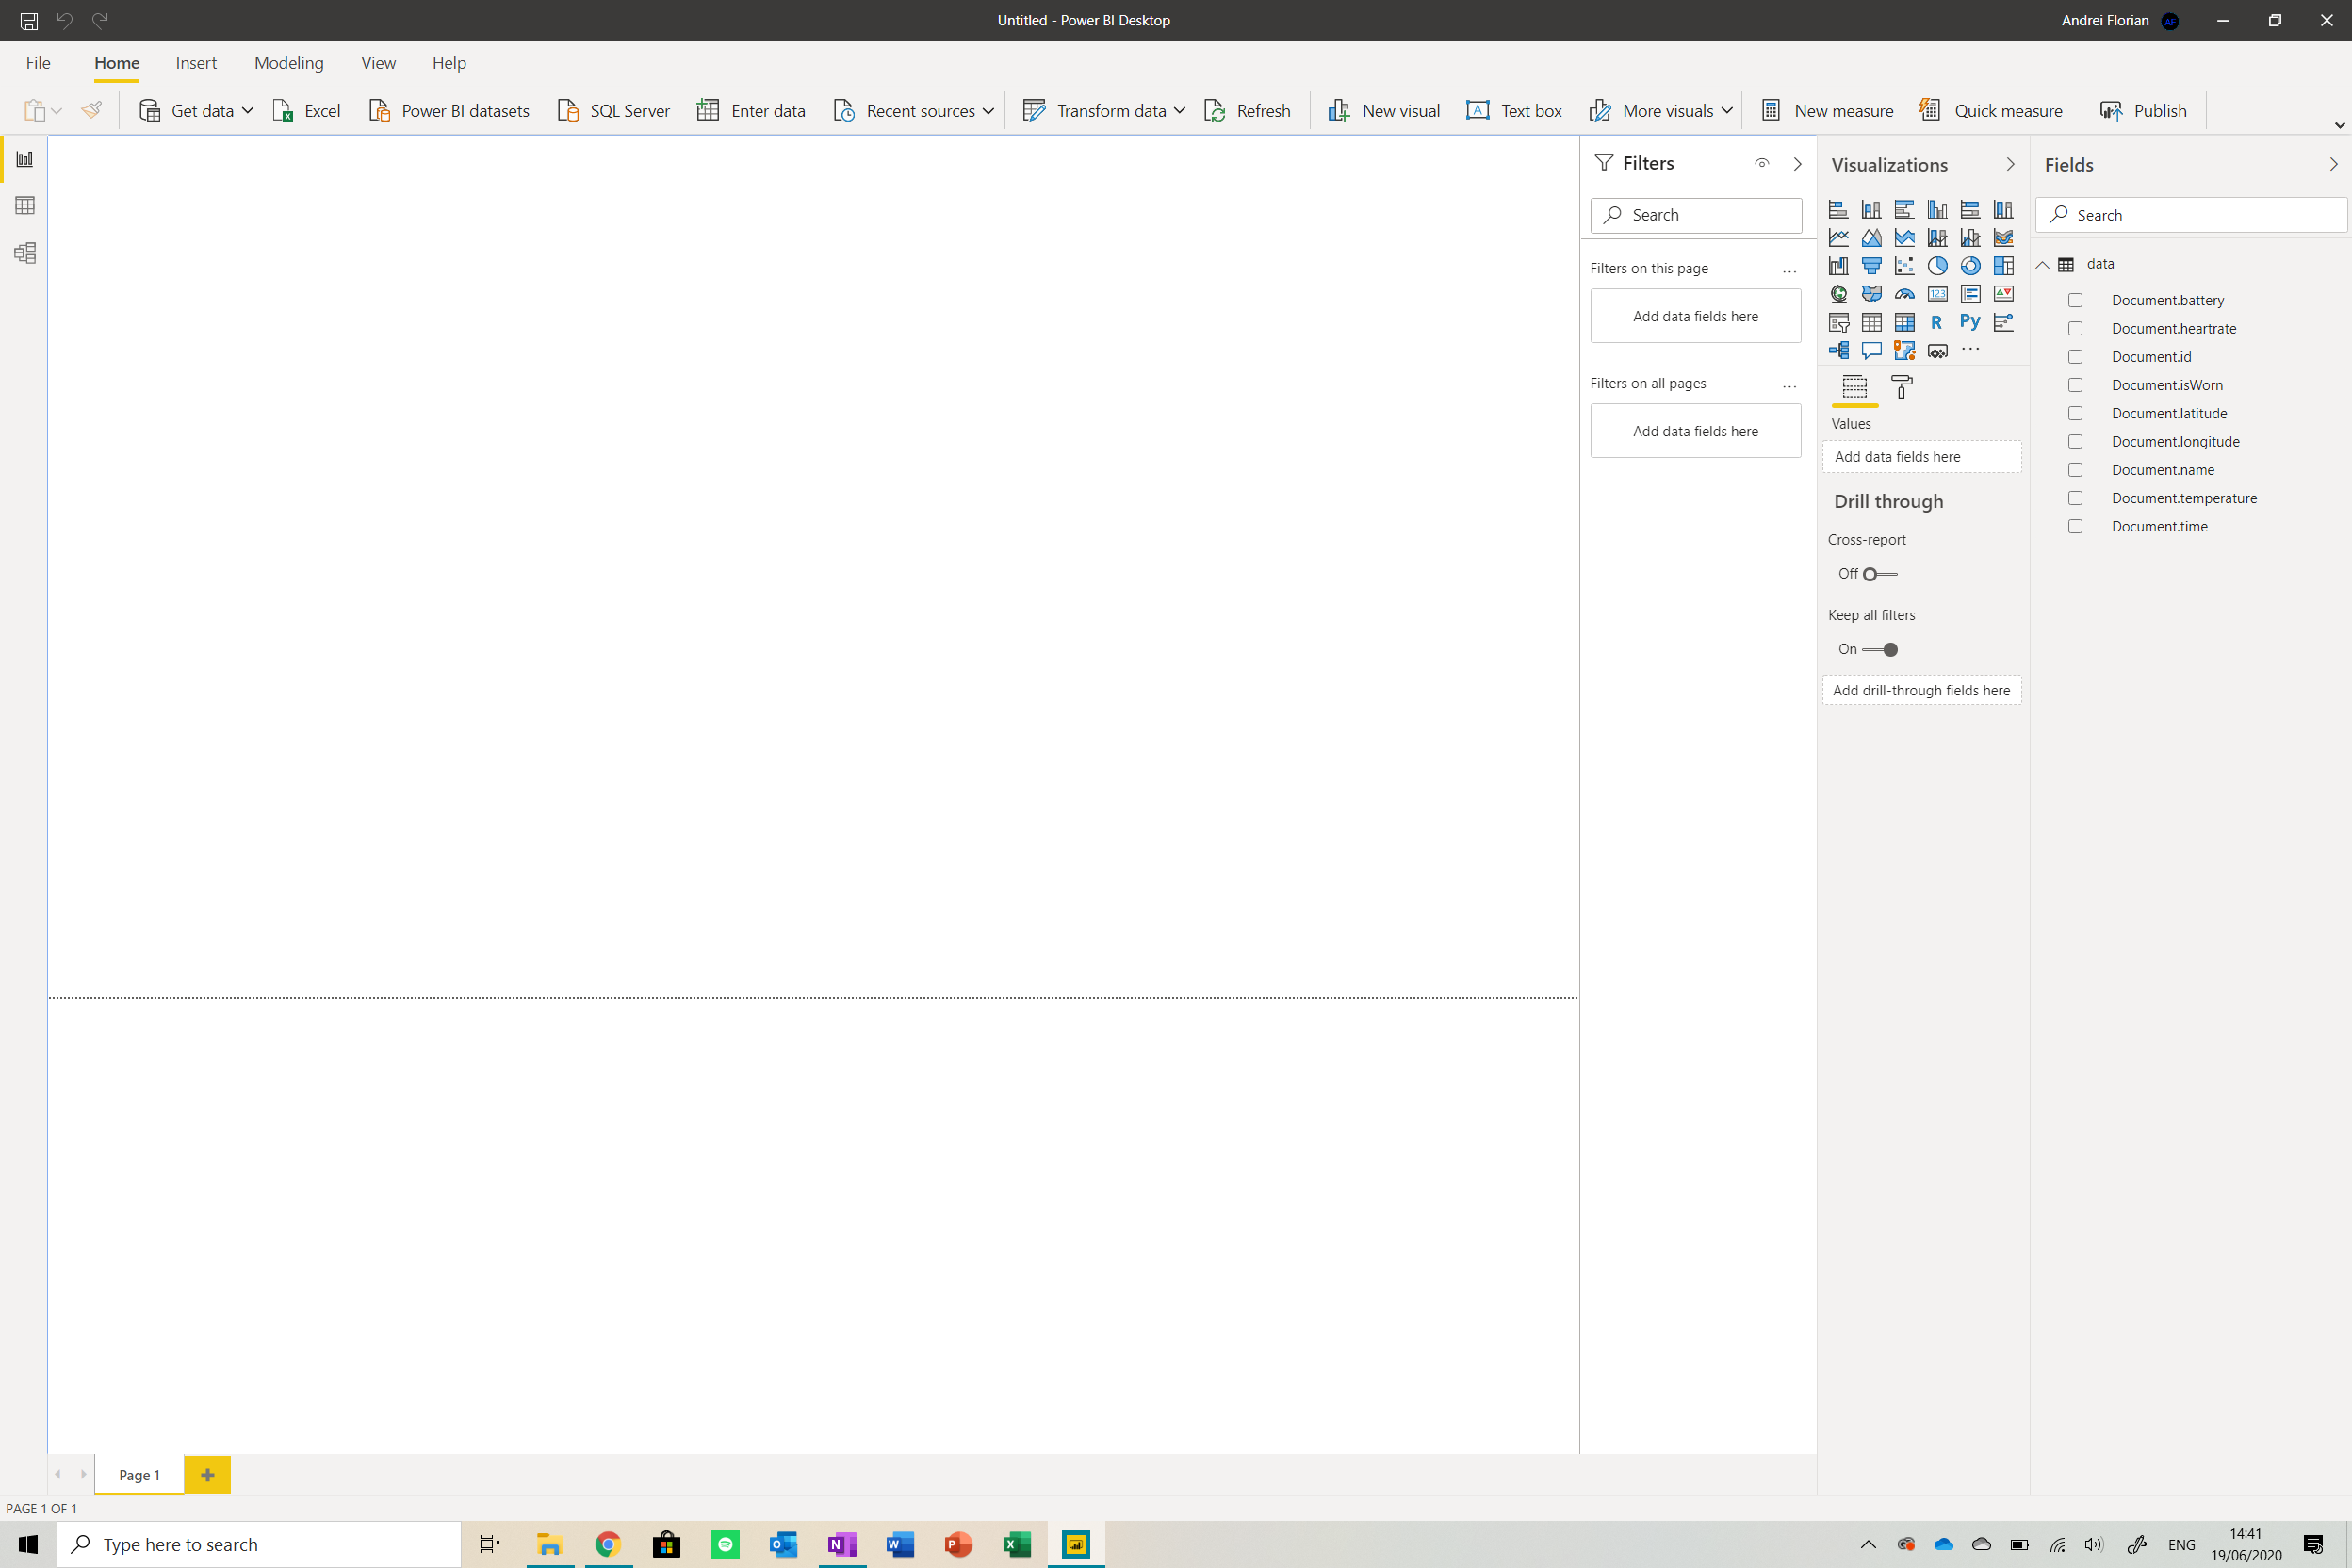
Now click on Close and Apply and you will be brought back to the dashboard. Your dashboard should look something like this.
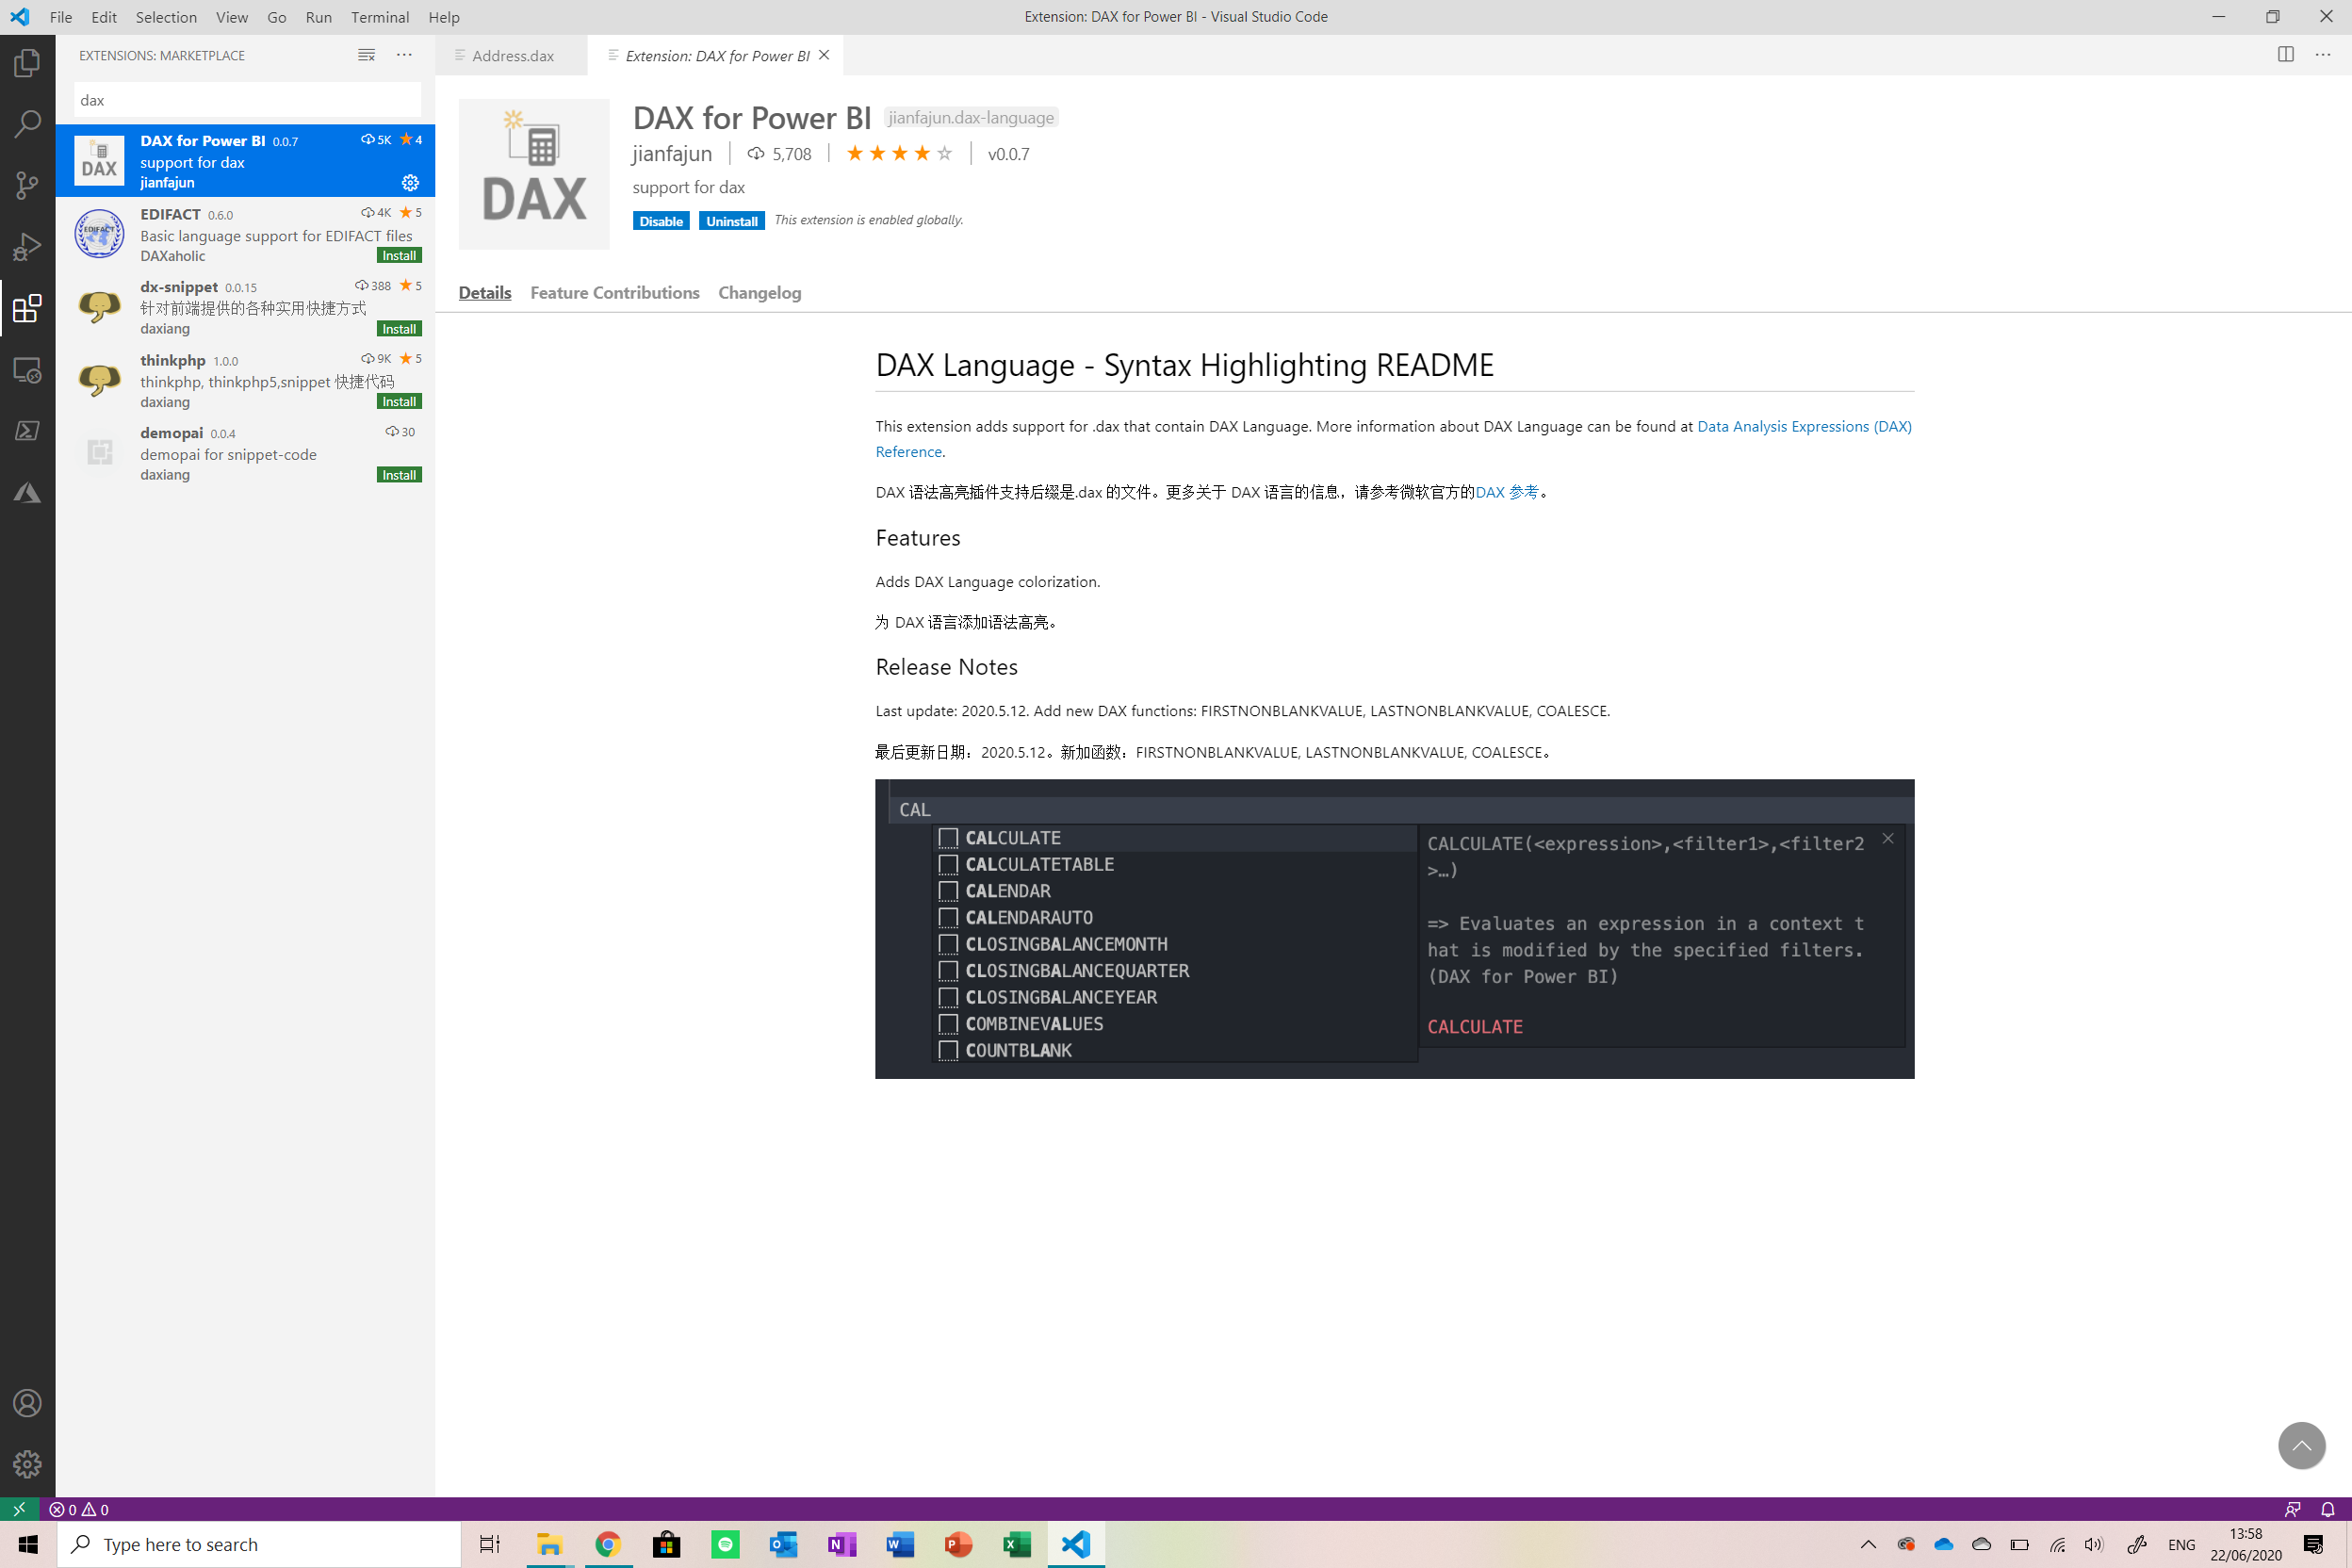
The next thing we will need to do is create measures to process data and convert it into different forms in the report. Open the Stream Analytics Script folder from the GitHub repo in Visual Studio code . I installed an extension called DAX for Power Bi to get context highlighting:
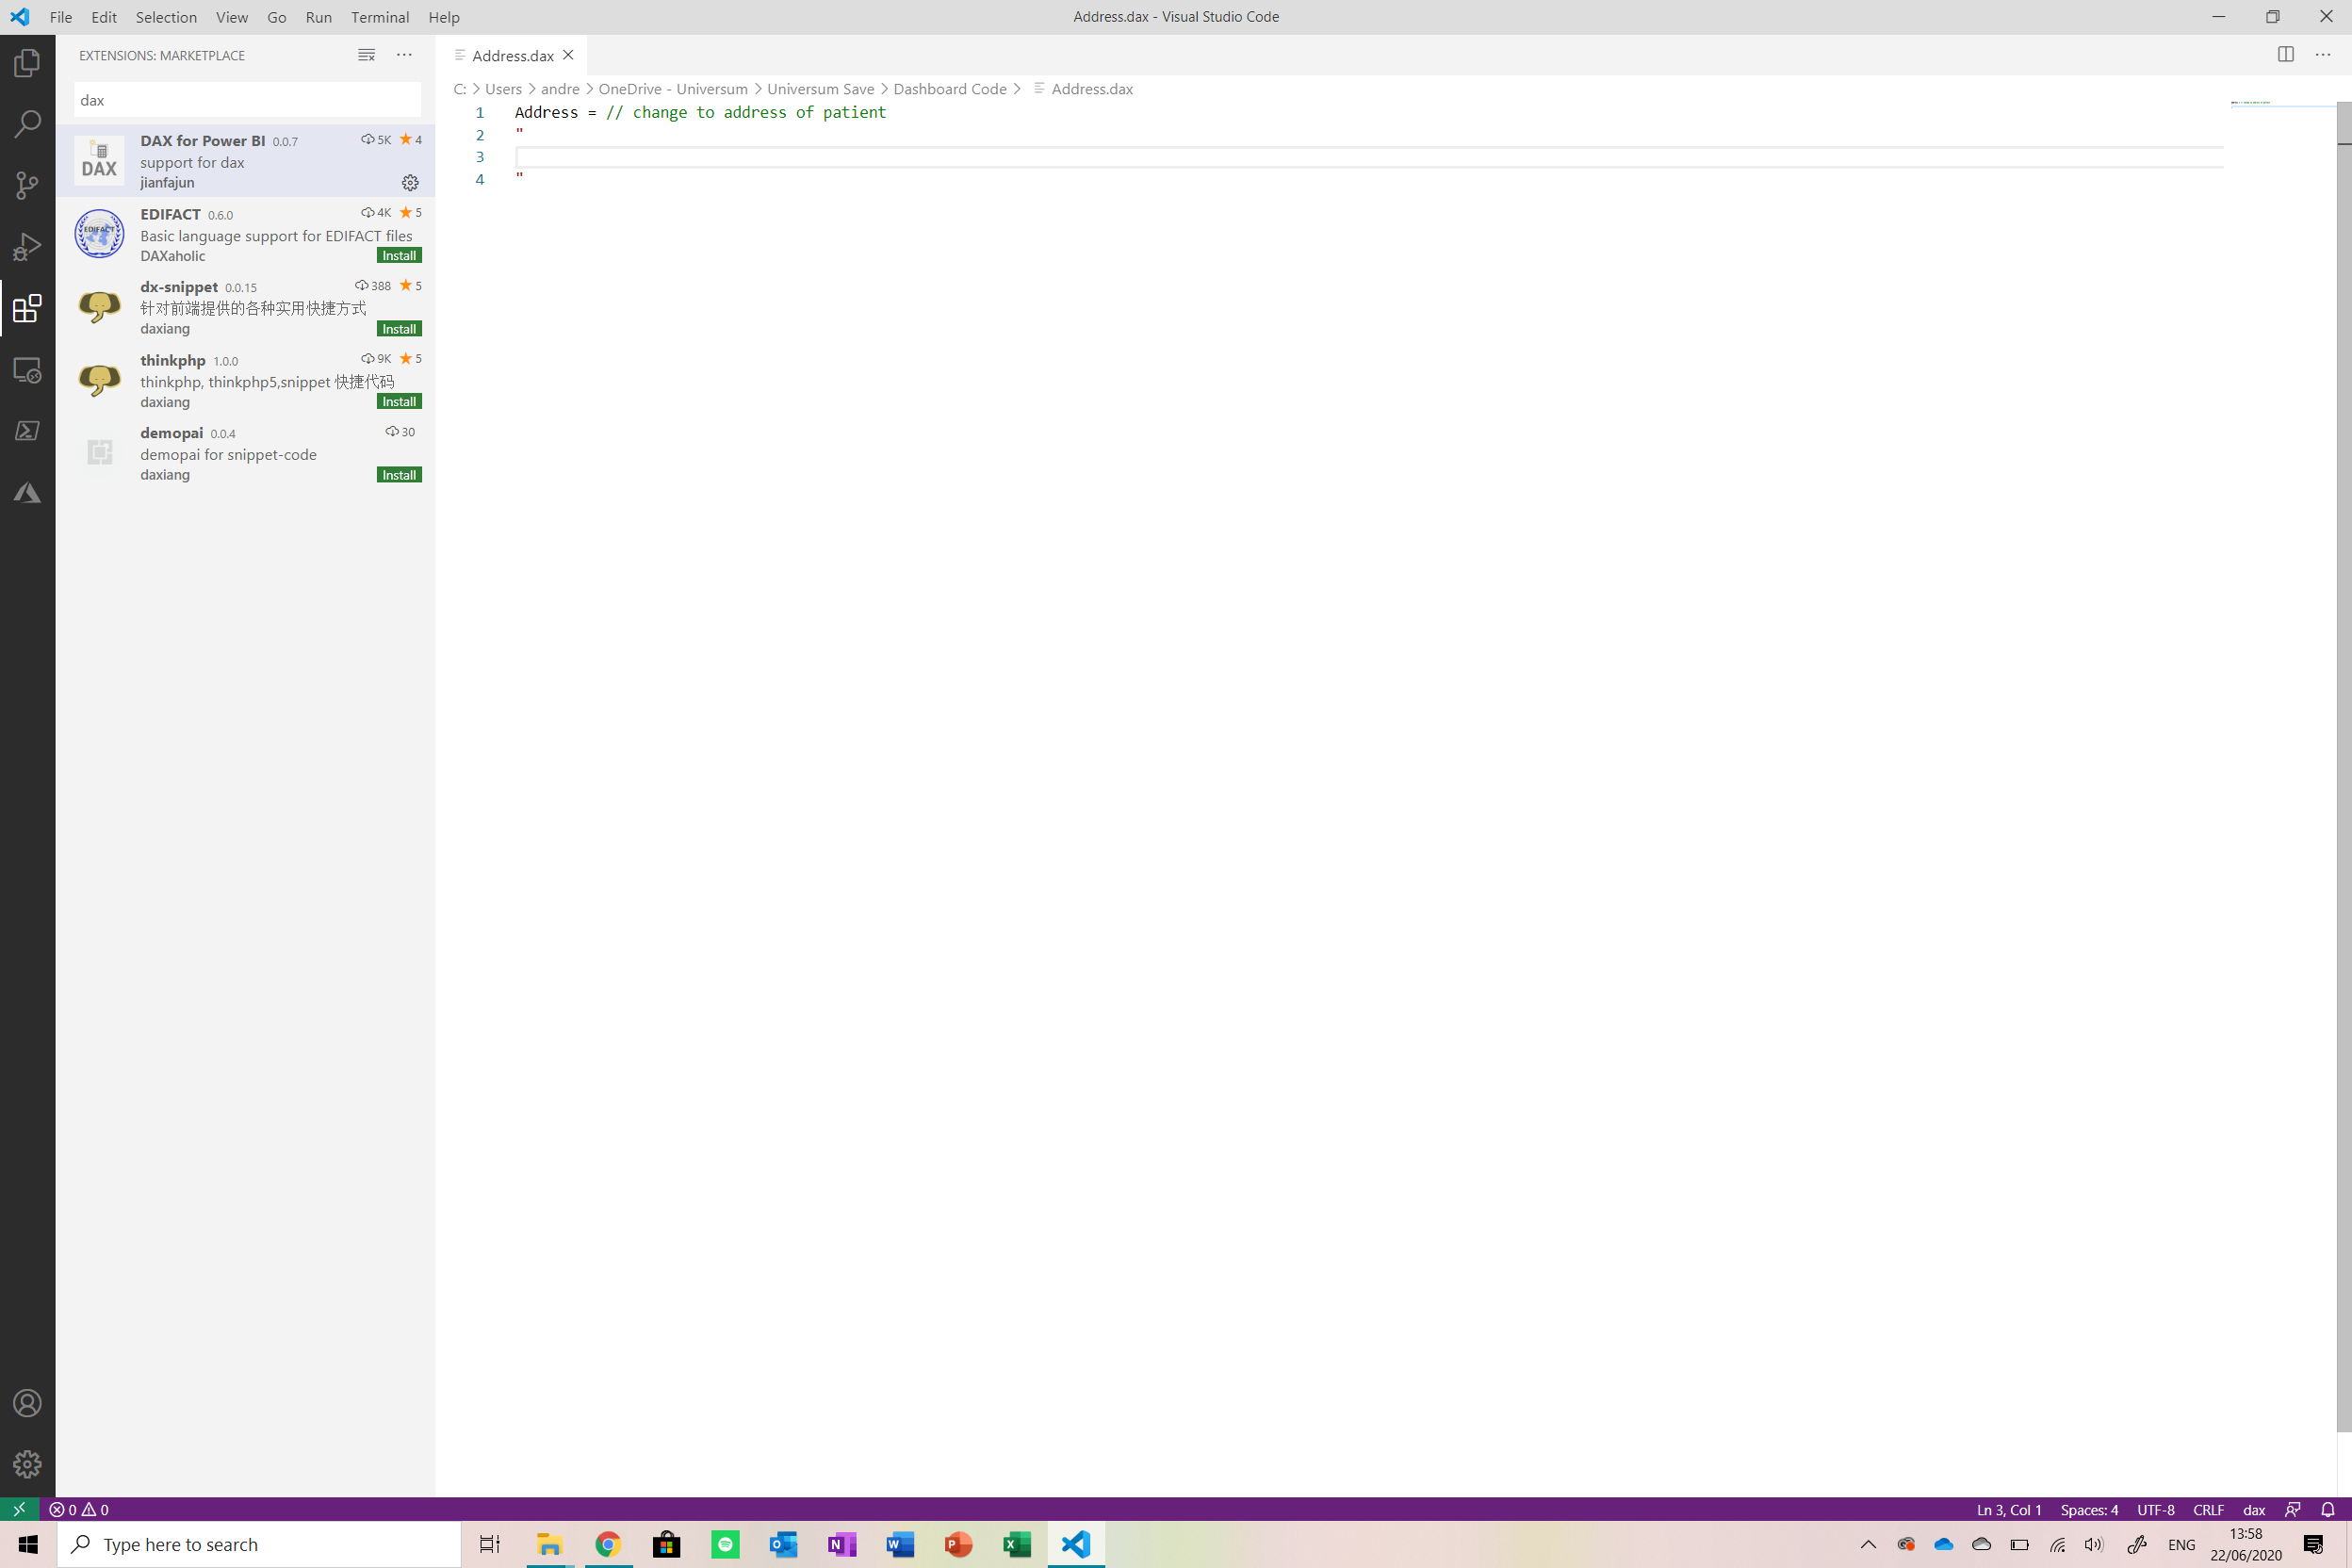
There are a number of files which have to be edited specifically for the patient as they hold the patient’s information. The list of files that must be edited is below:
- Address.dax
- Age.dax
- Gender.dax
Open these files in VS code and edit them there.
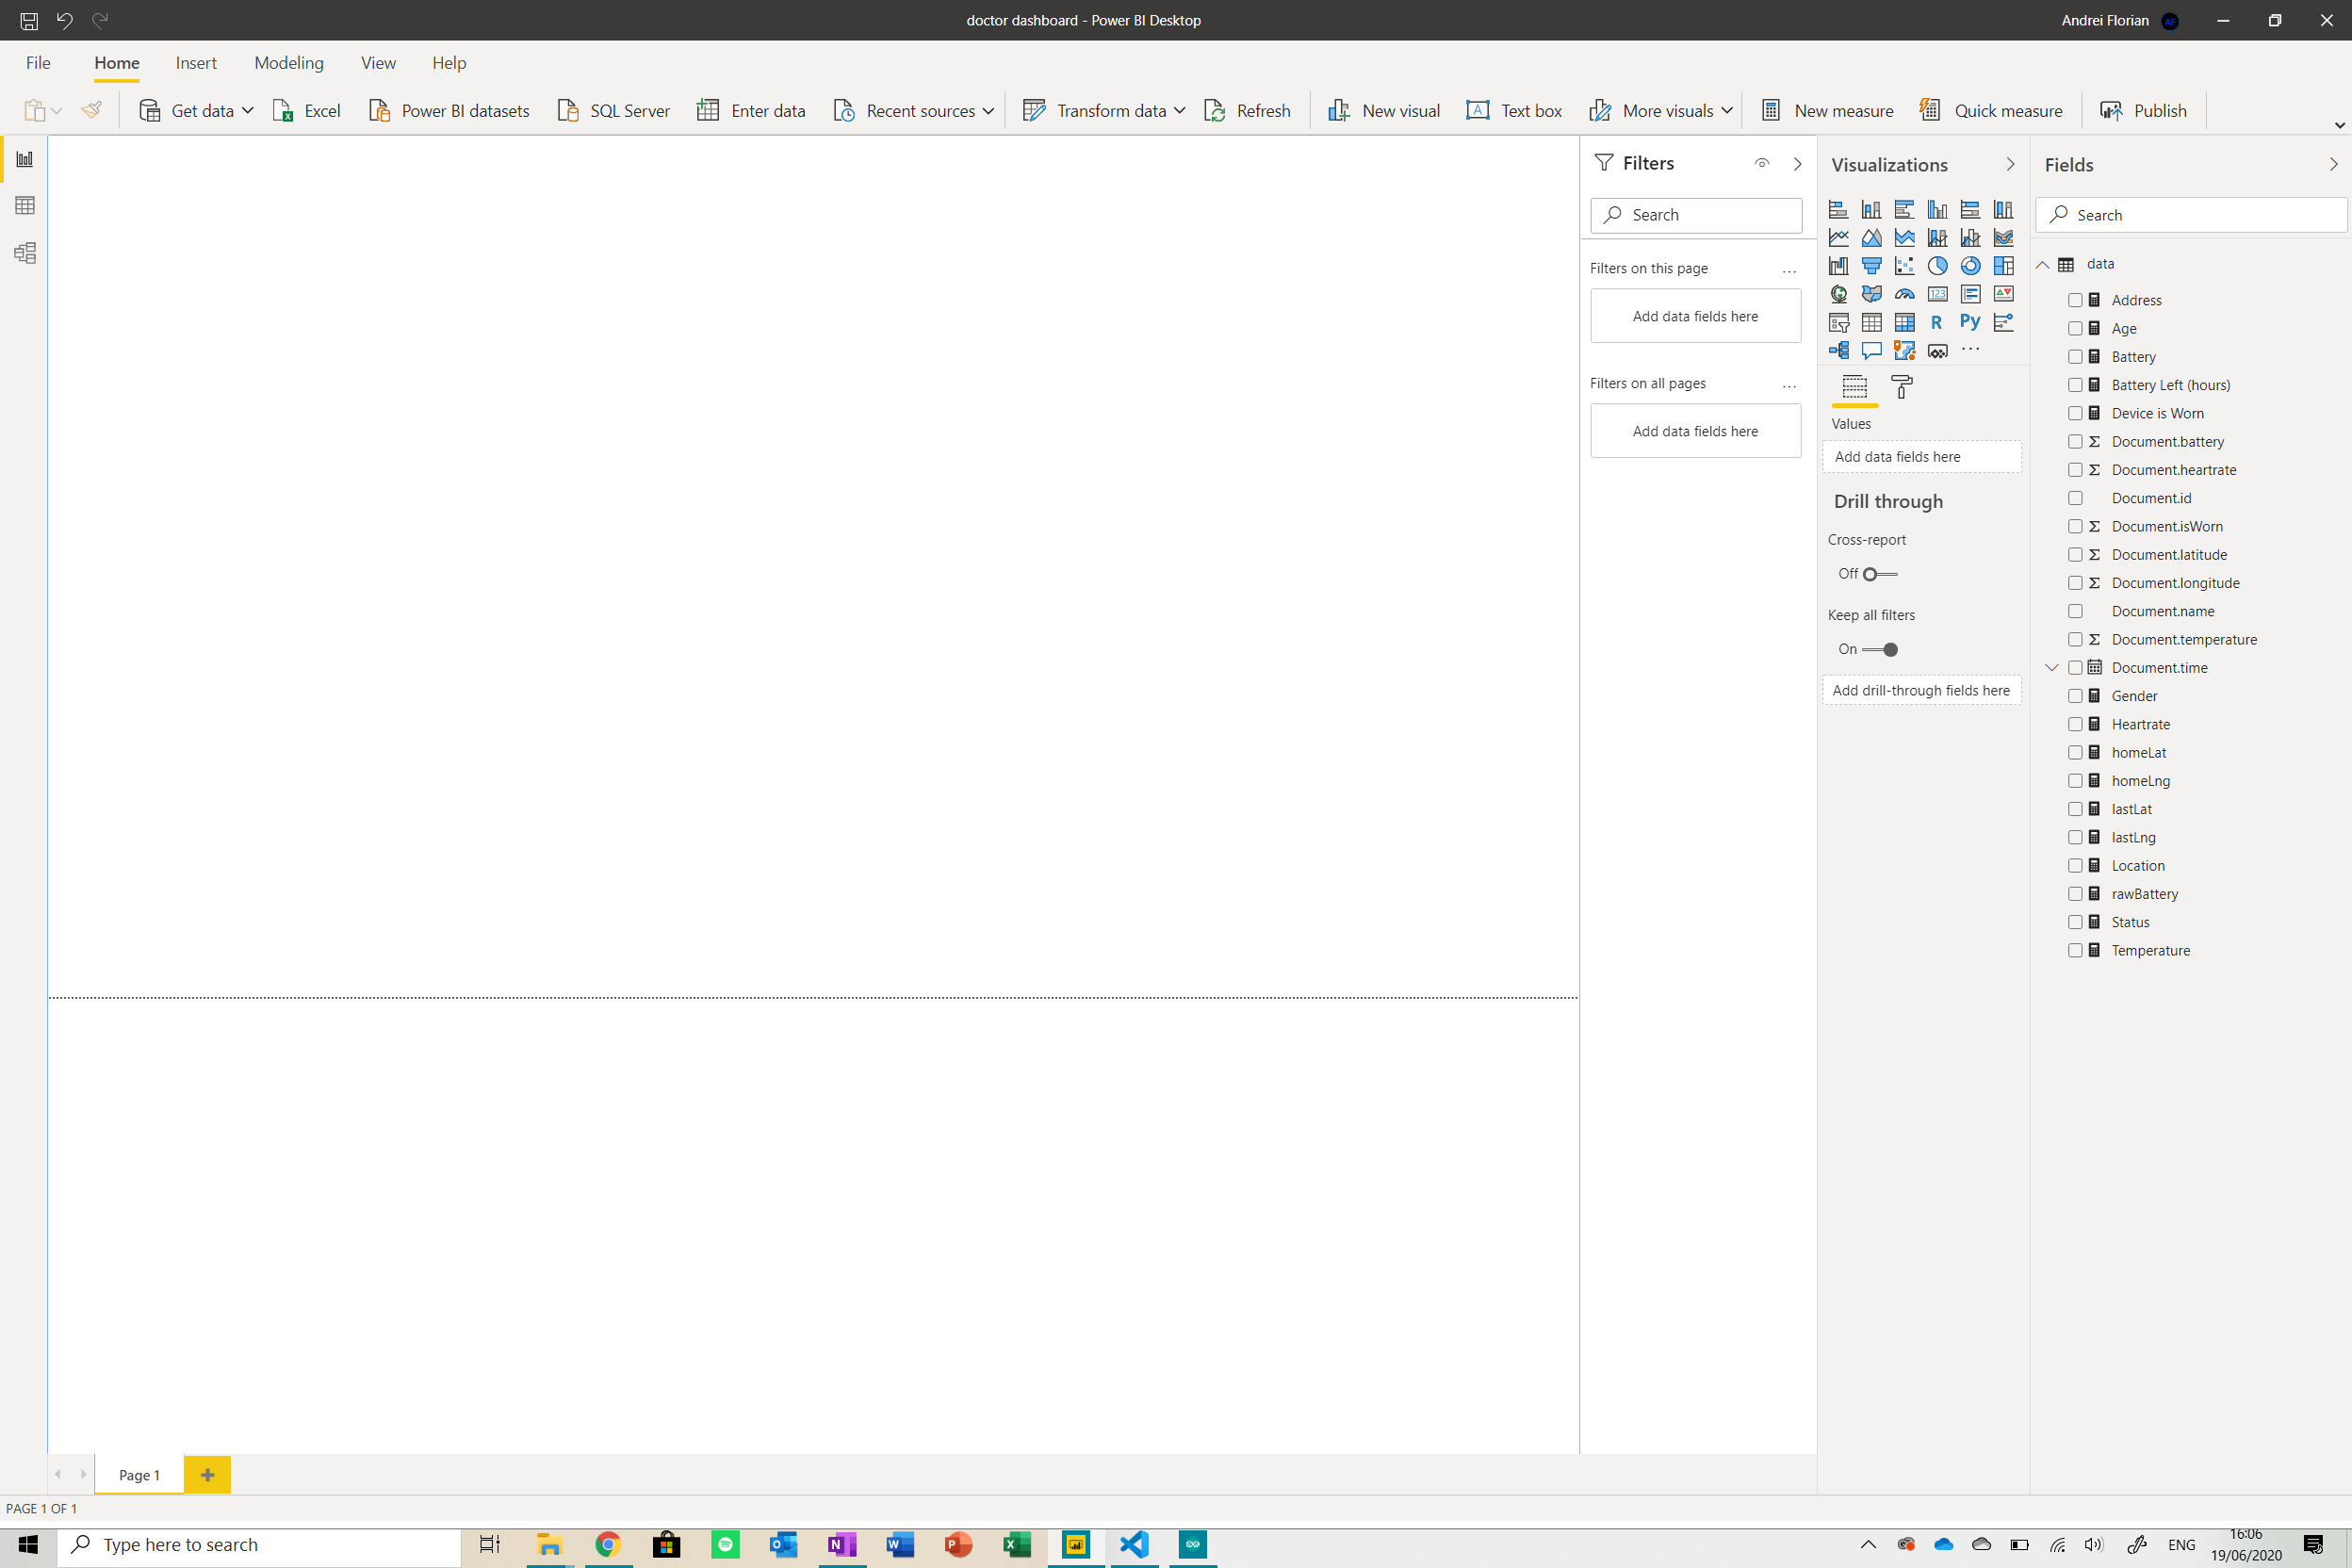
Now we will create new measures in Power Bi using these files. To do so, open the Power Bi report and click on the New Measurebutton from the menu at the top of the screen.
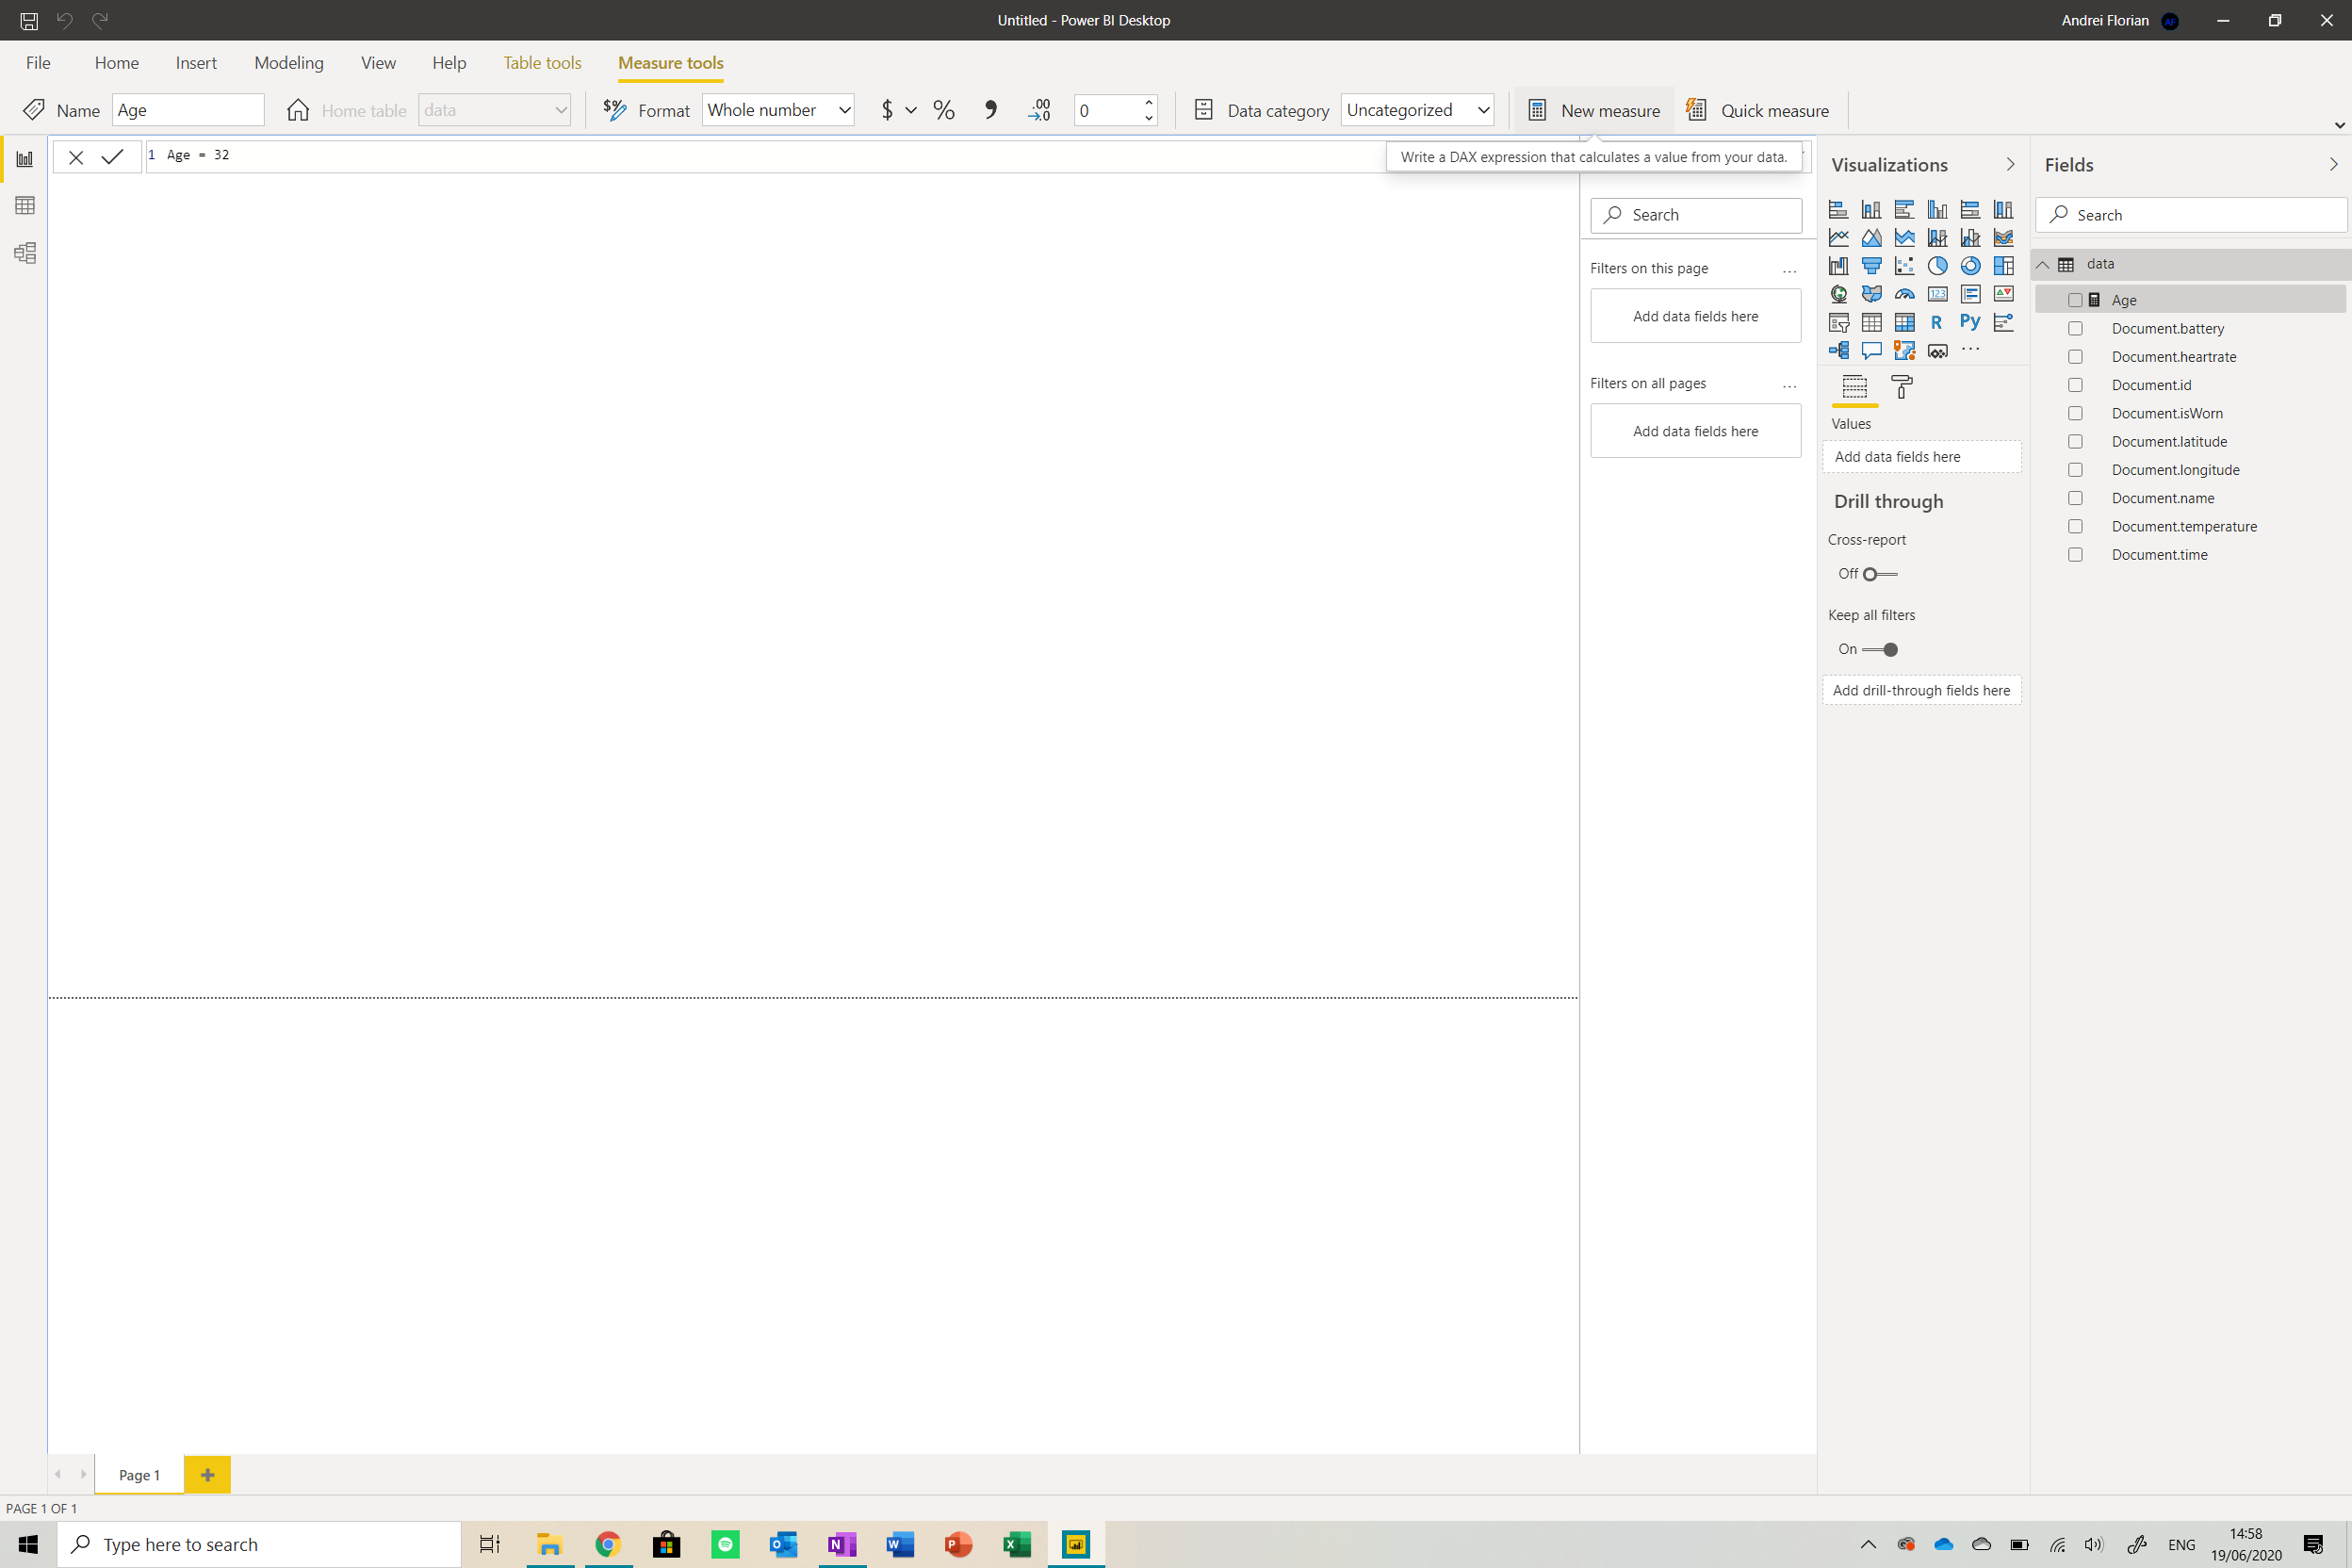
Copy and paste the first file’s content into the text bar. Ensure that the Format and Data Category are set accordingly (i.e. set the category of latitude data to latitude). Now repeat this step for all other files , creating a new measure for each . Your dashboard should look like below:
Now we are moving on to the fun part – designing the dashboard. Please look at the tutorials below to get an idea of how to create infographics and style the dashboard:
- Basic Power Bi
- Complete Guide to Power Bi
- Free Udemy Course on Power Bi
- Forecasting data (ML) in Power Bi (used on temperature, heart rate and battery level)
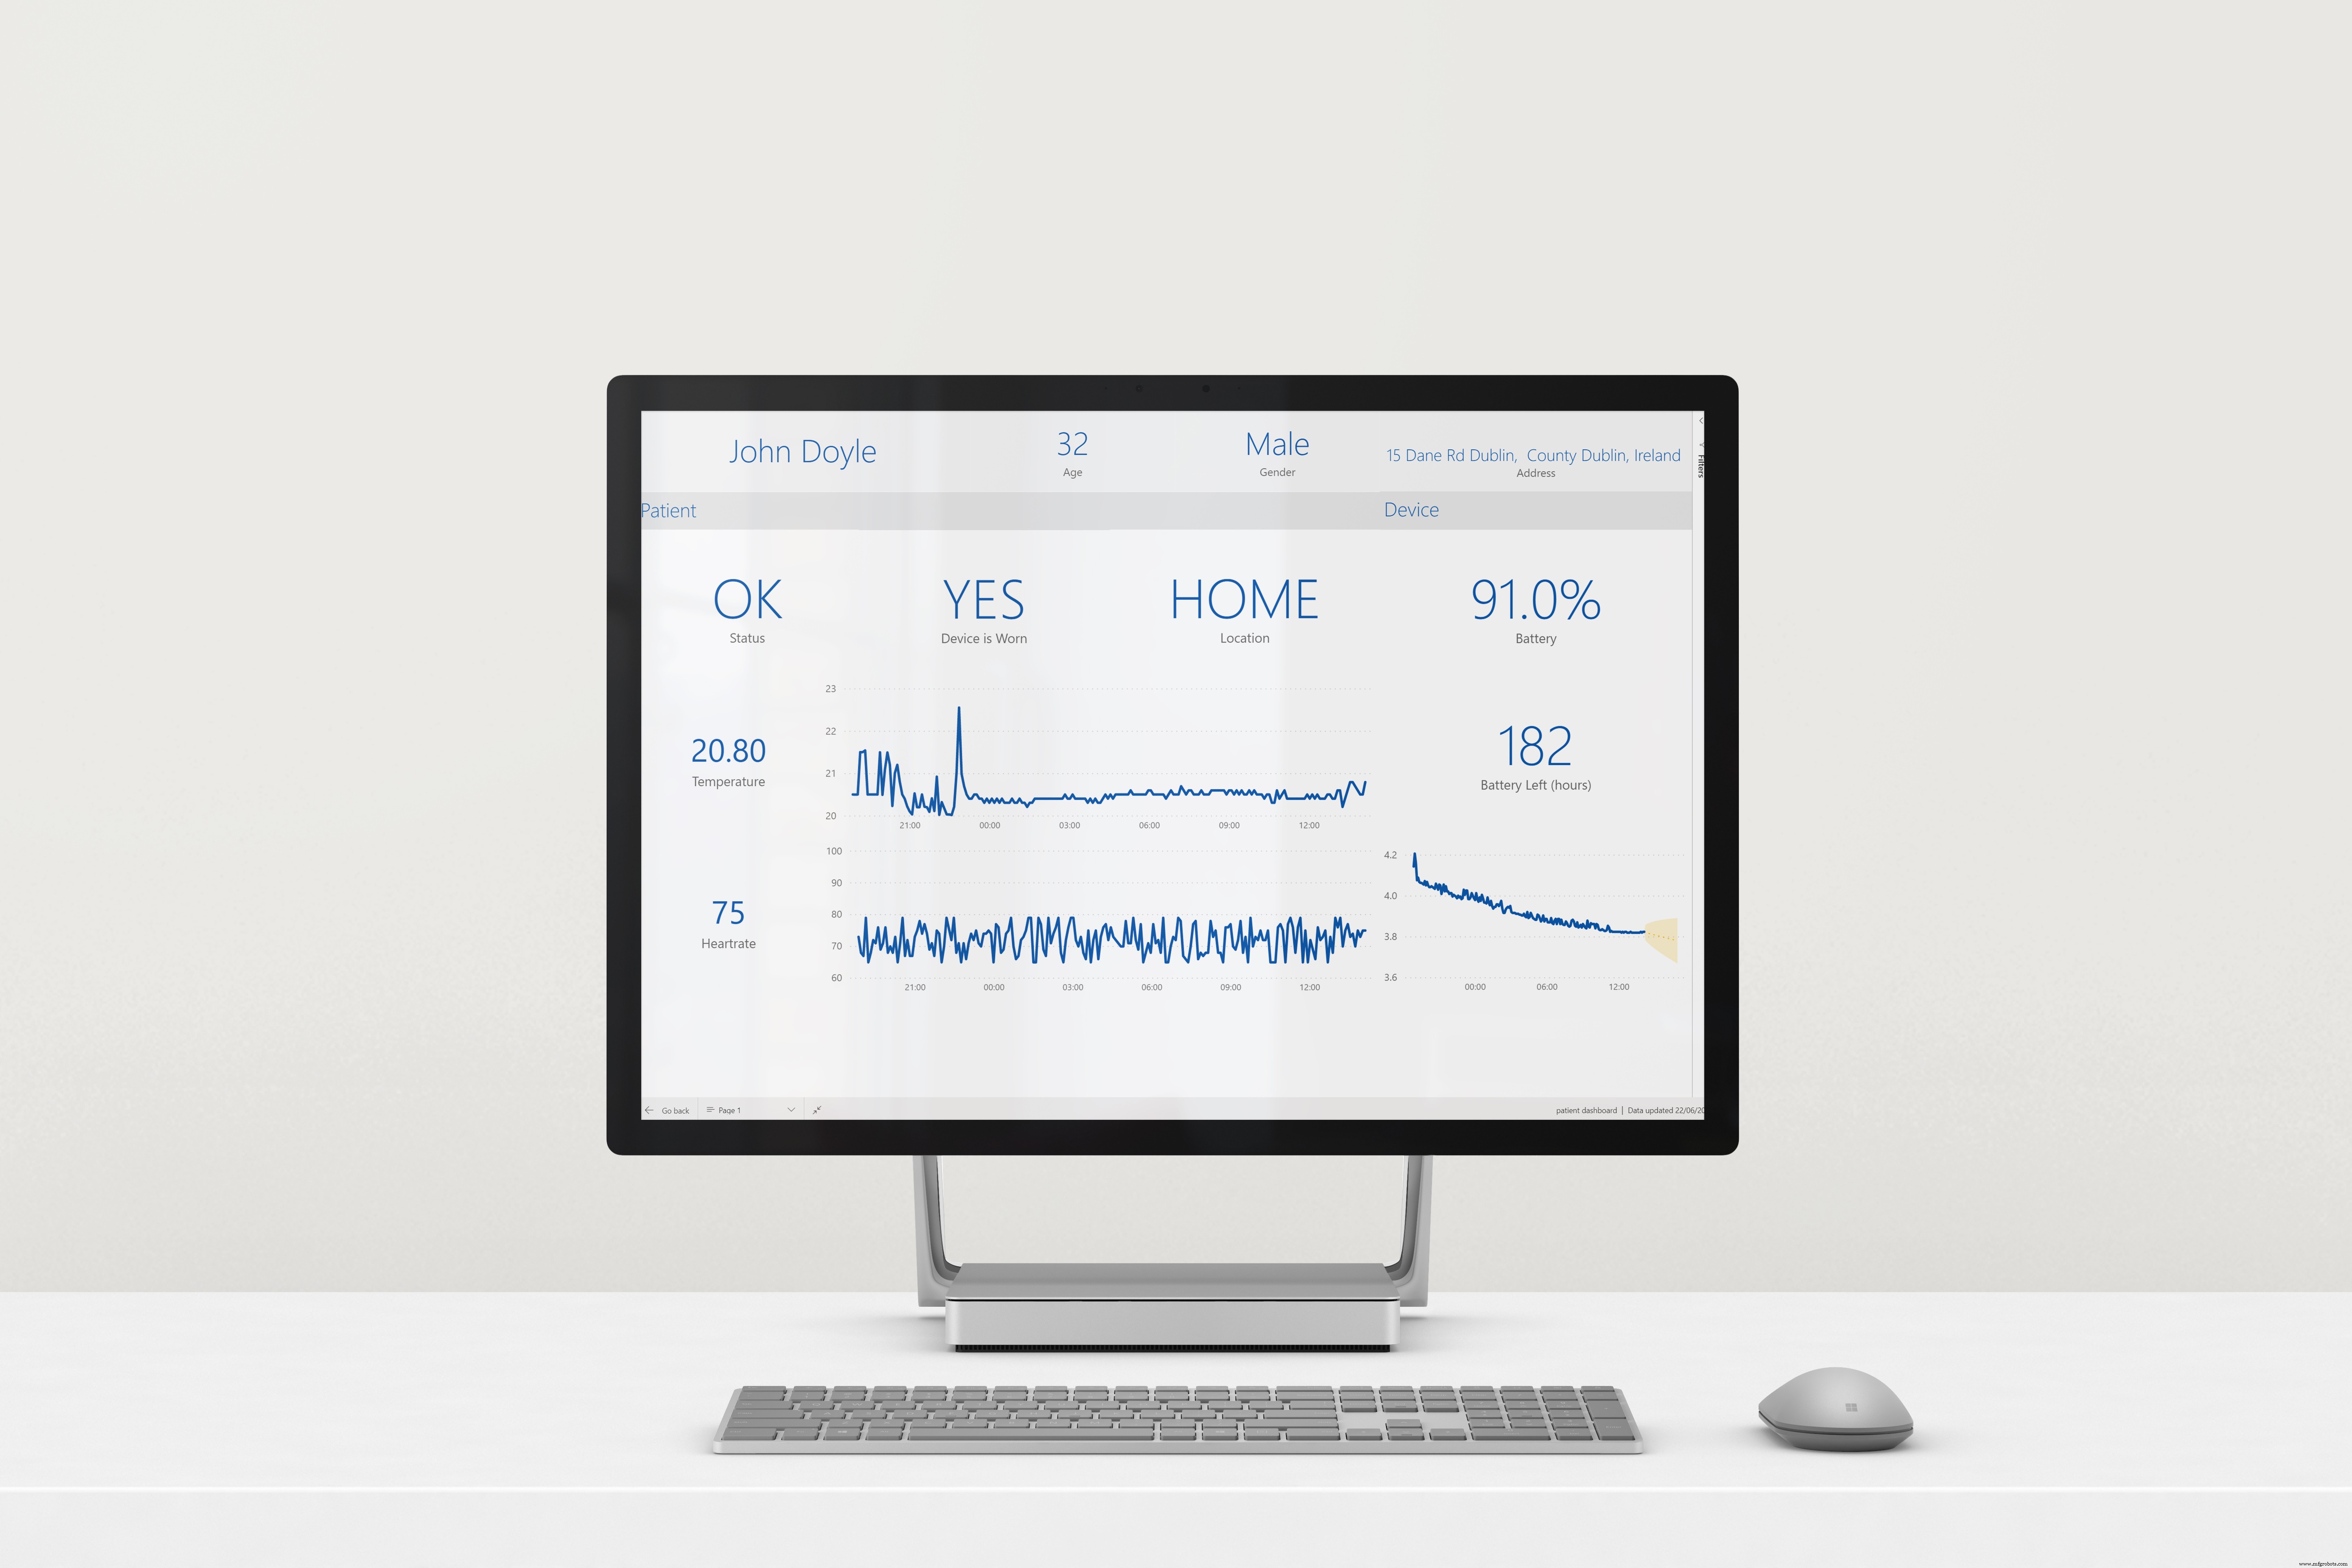
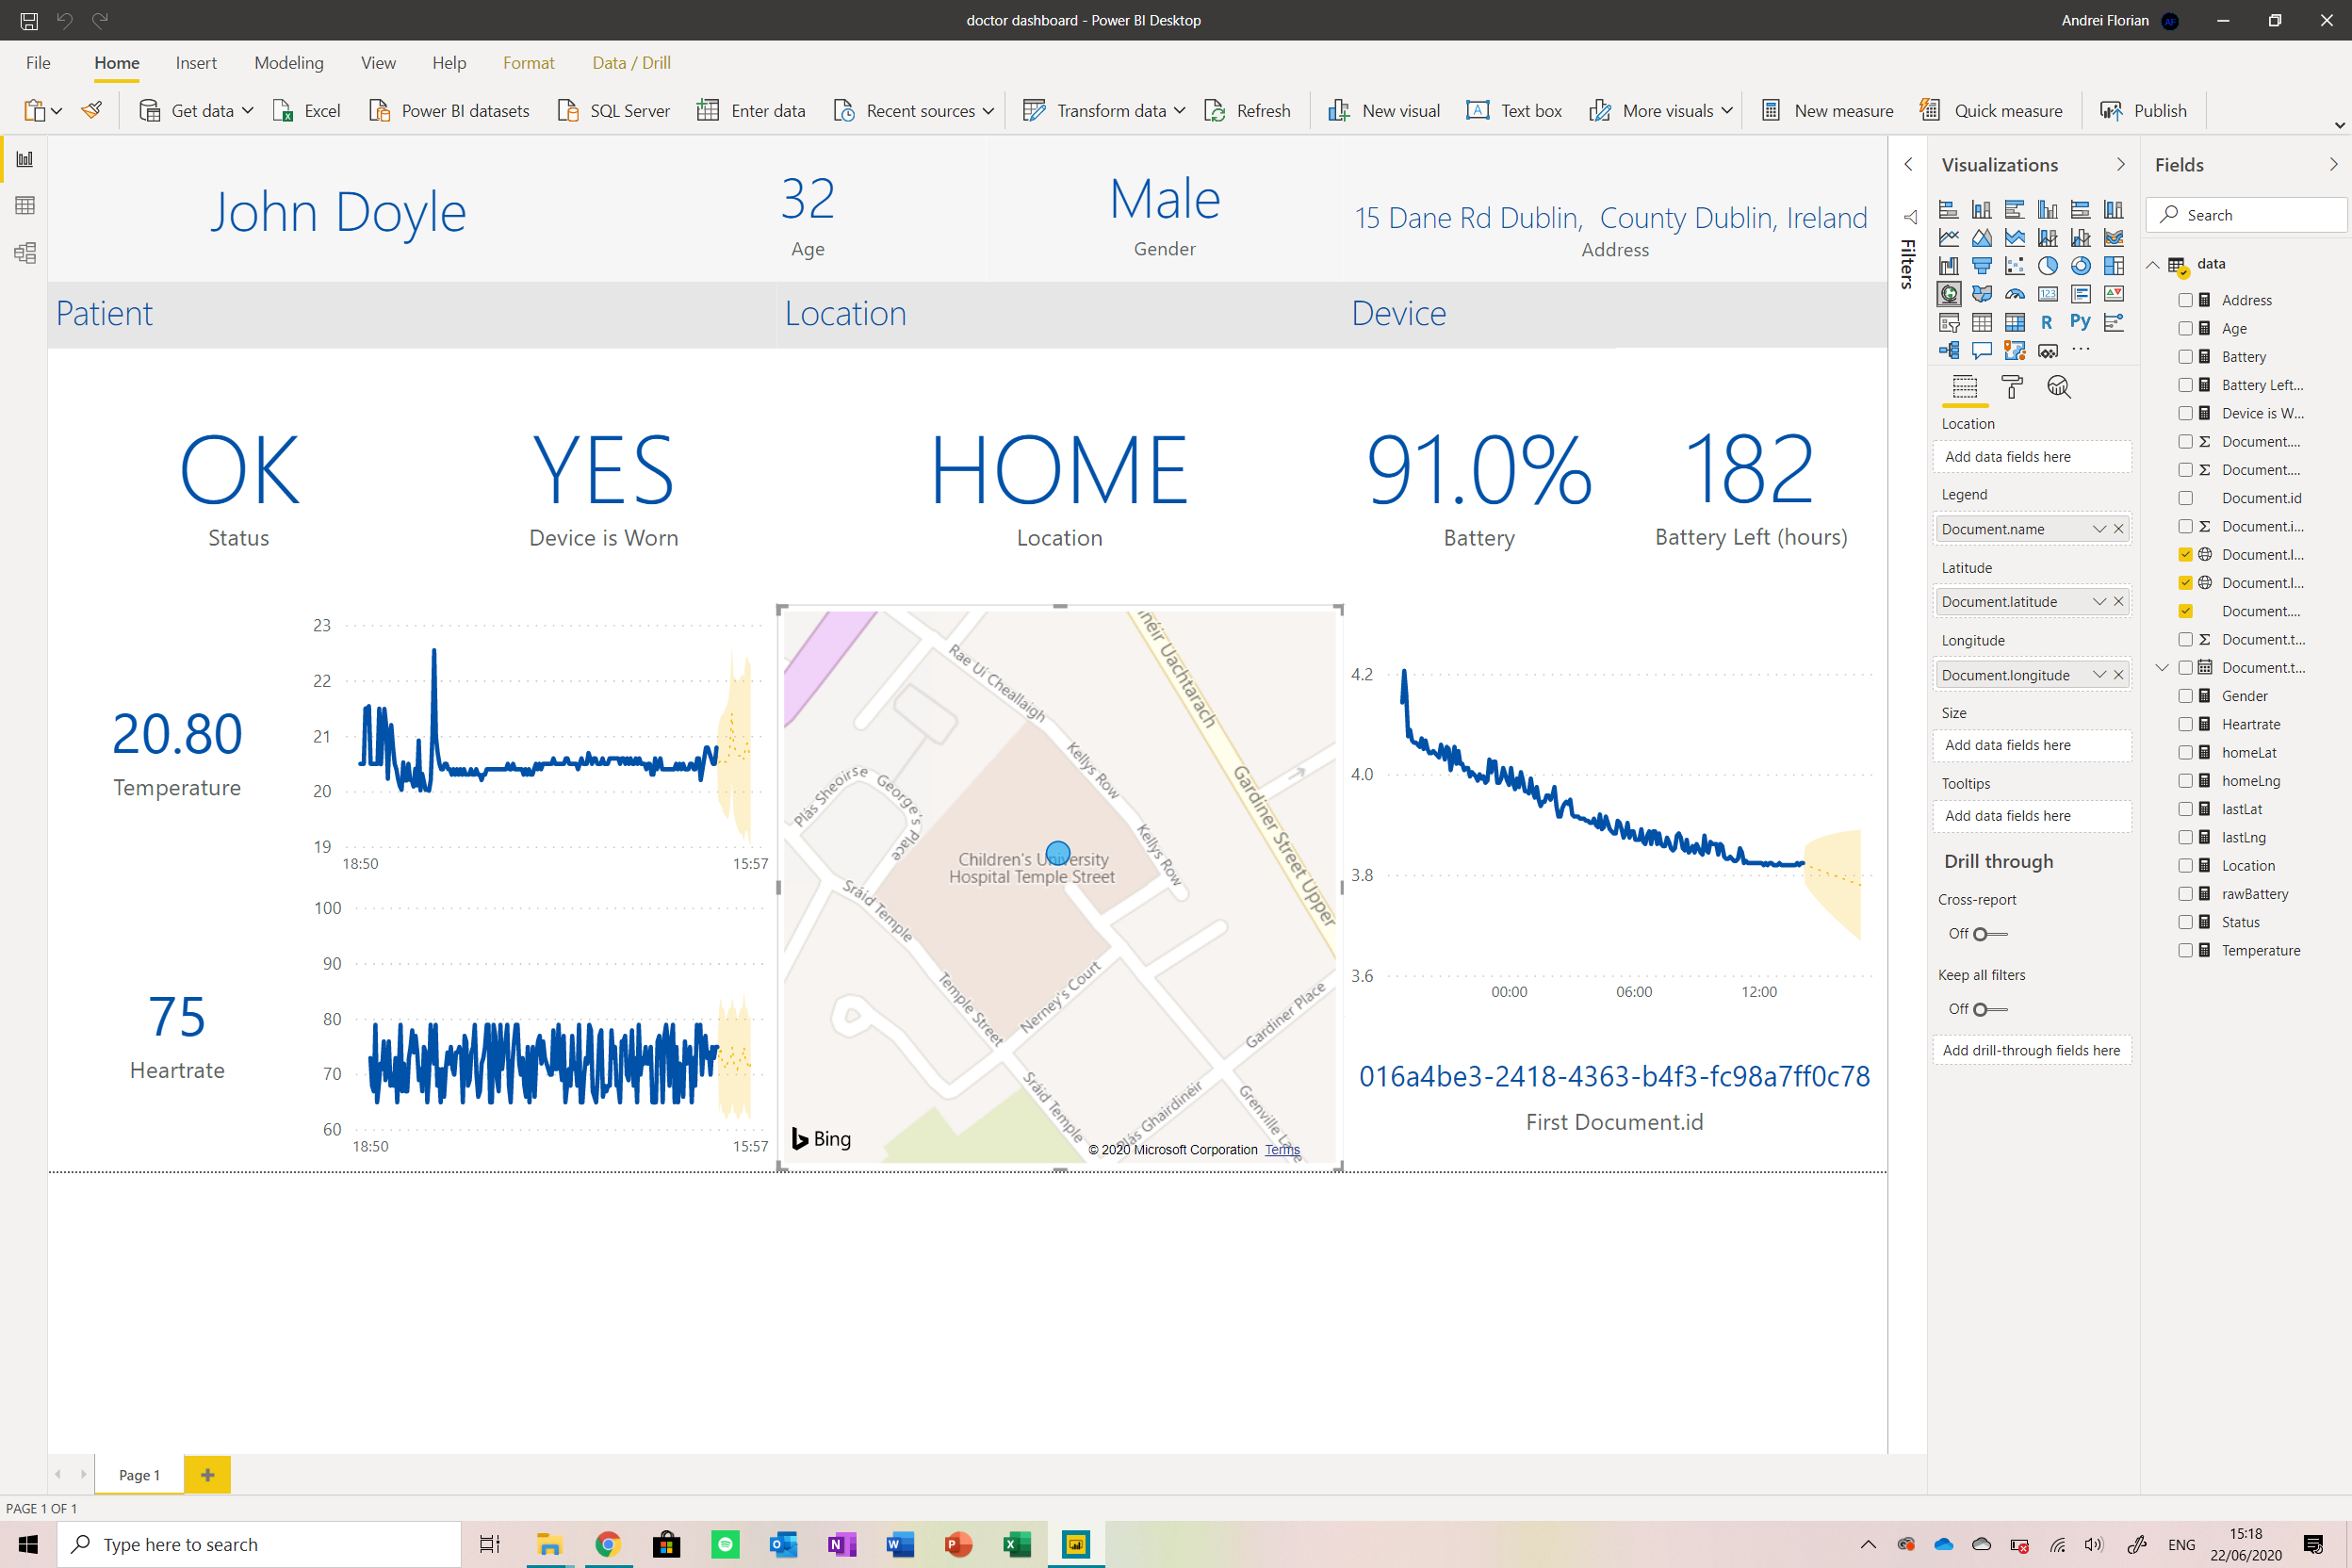
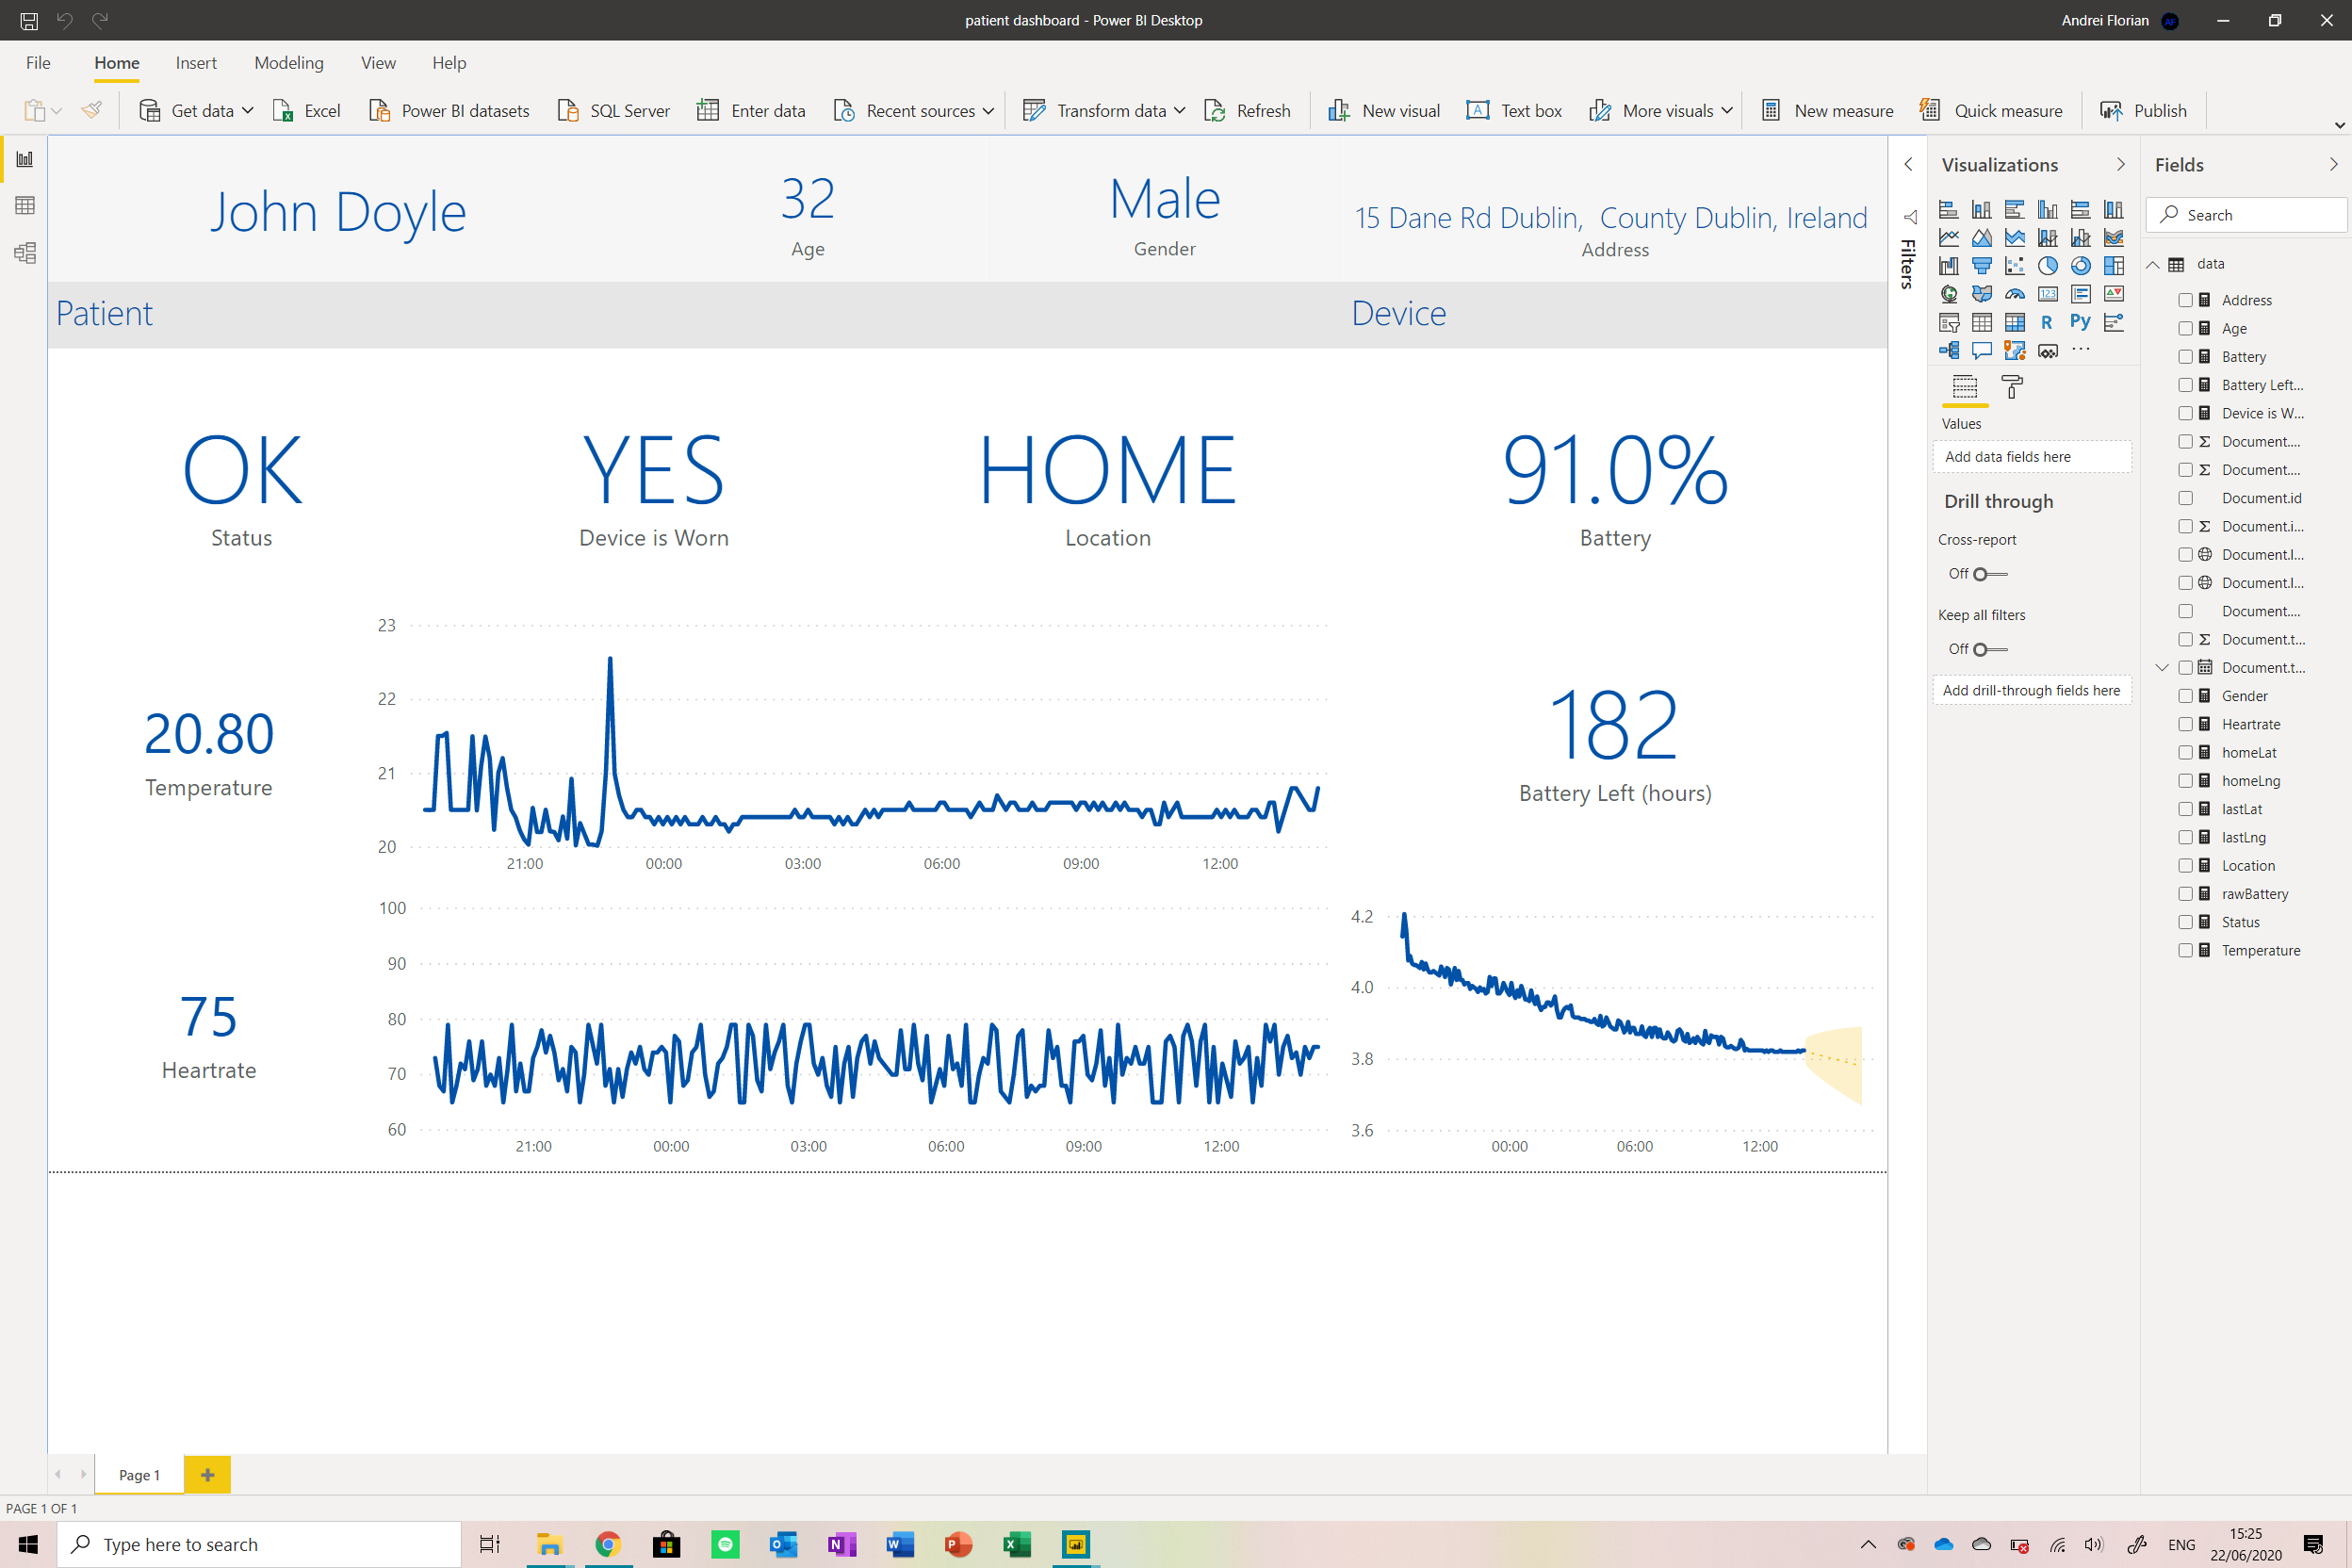
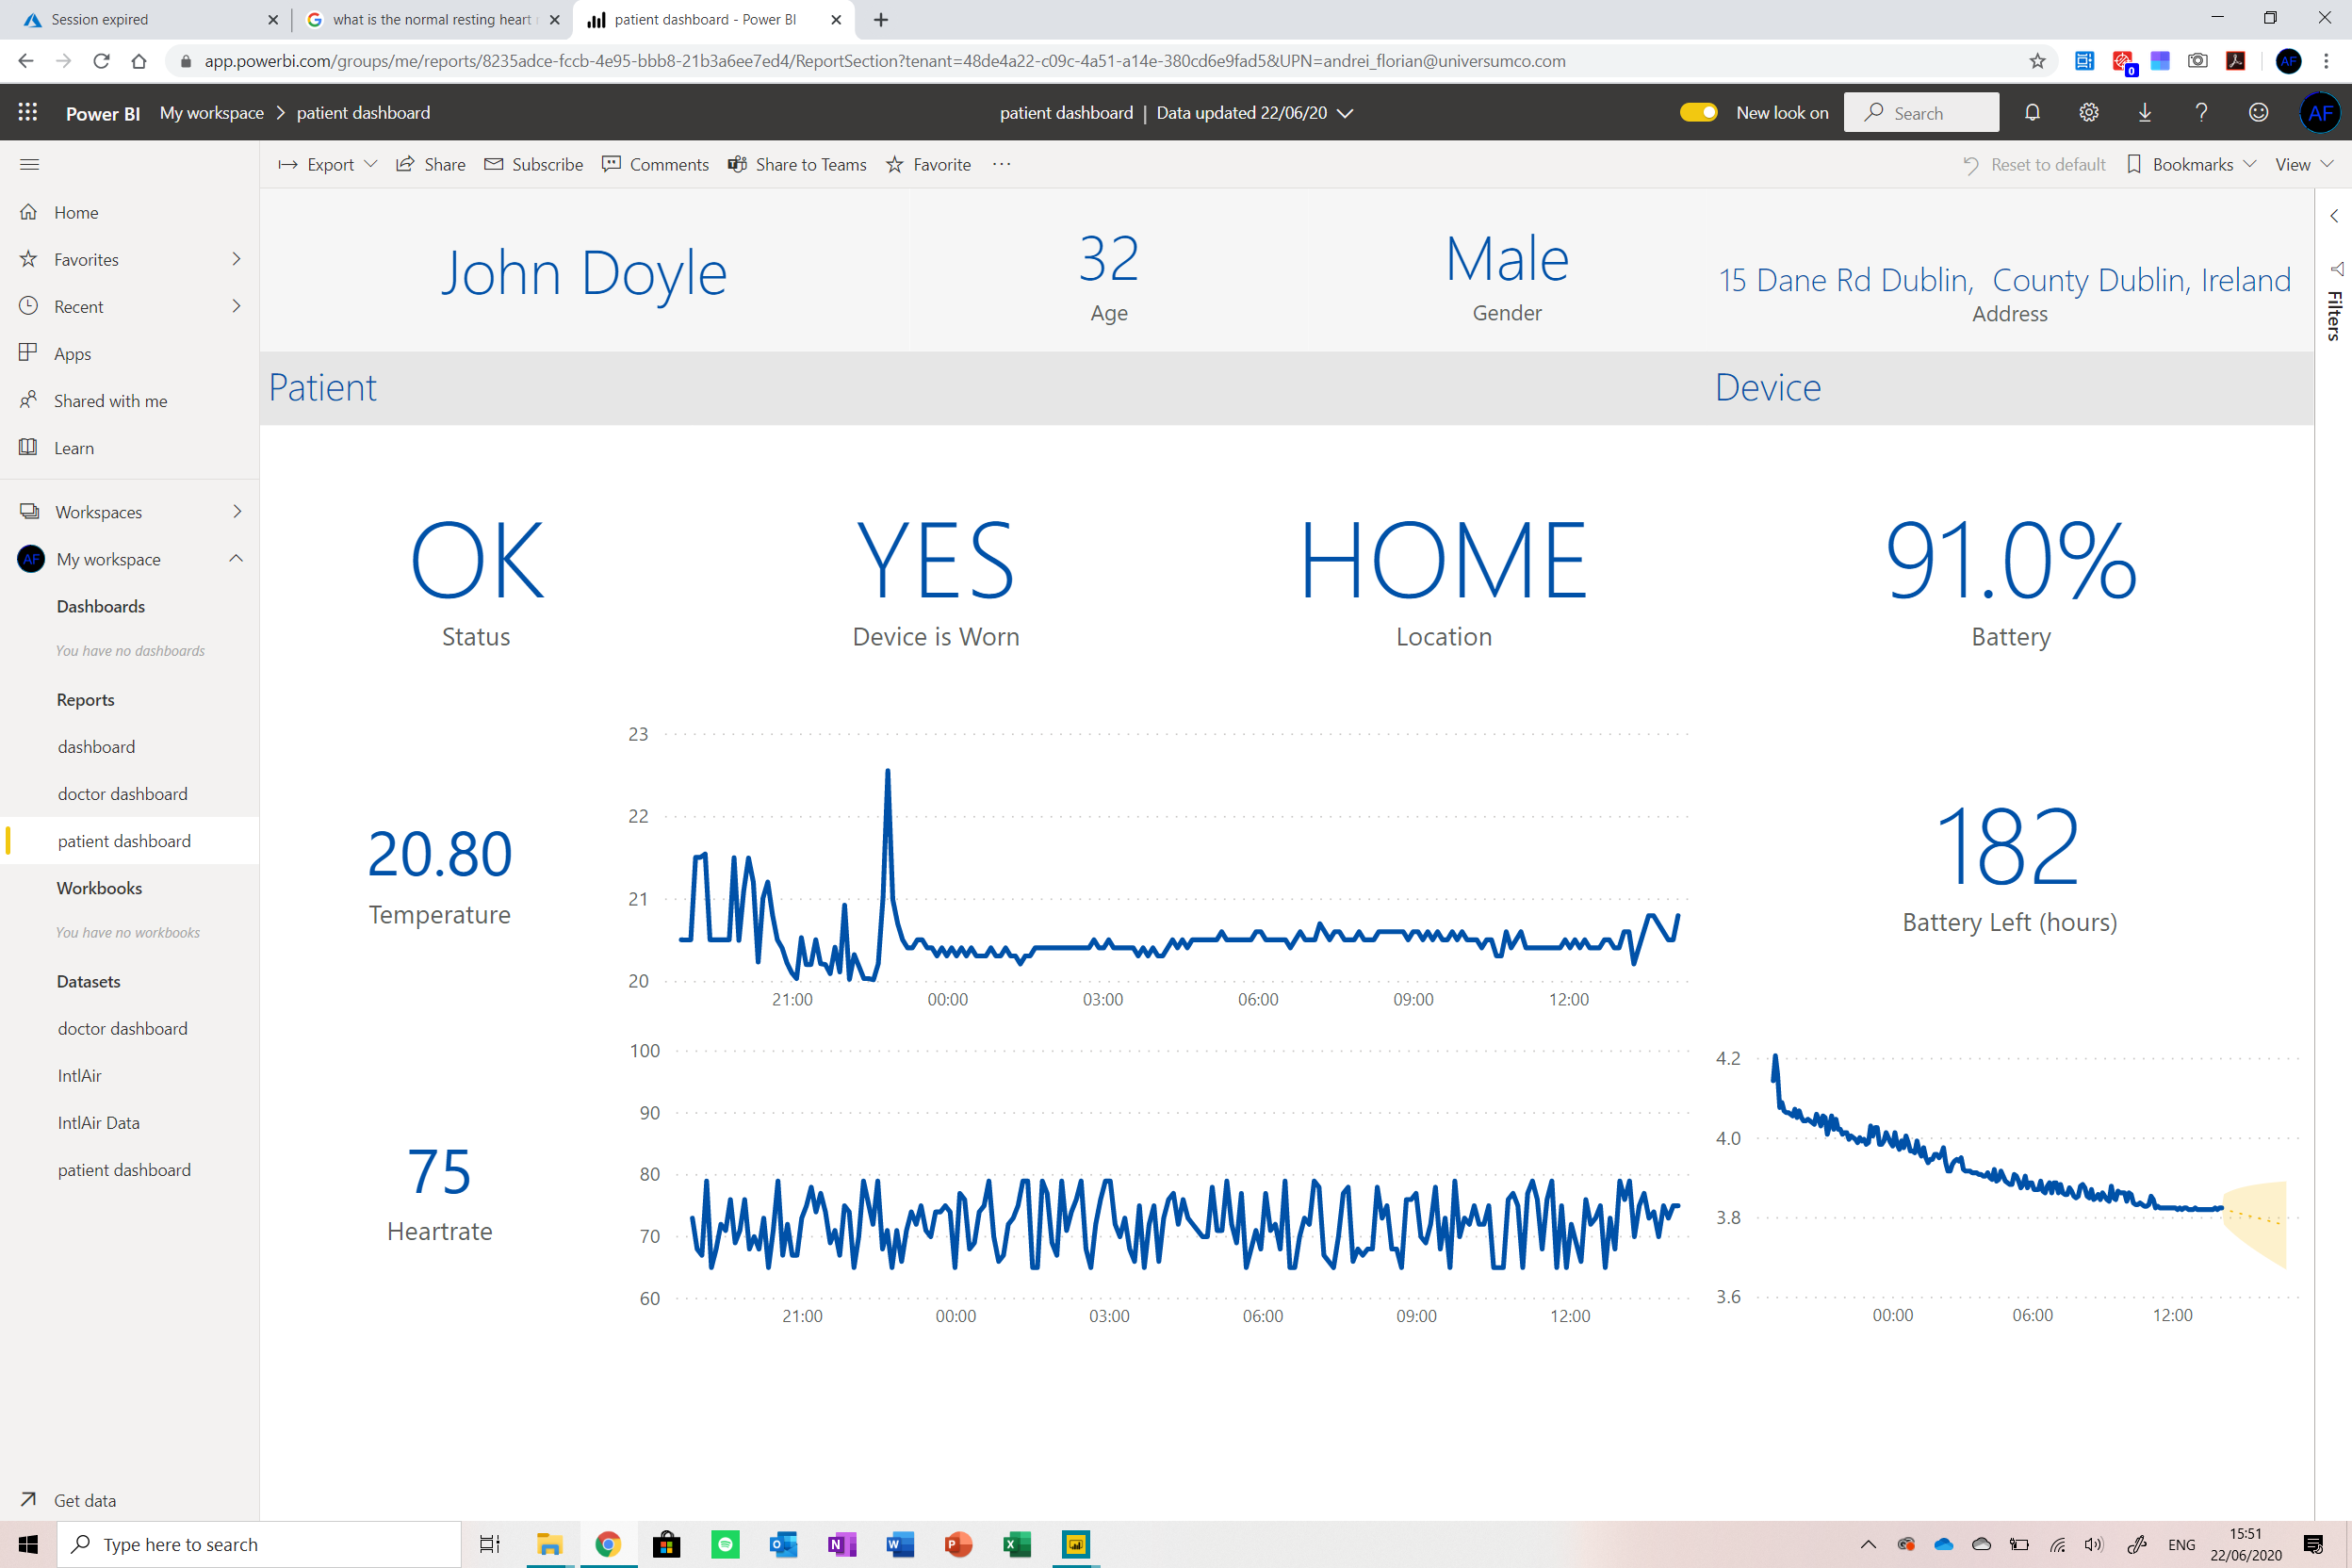
This is how my dashboard looked at the end:
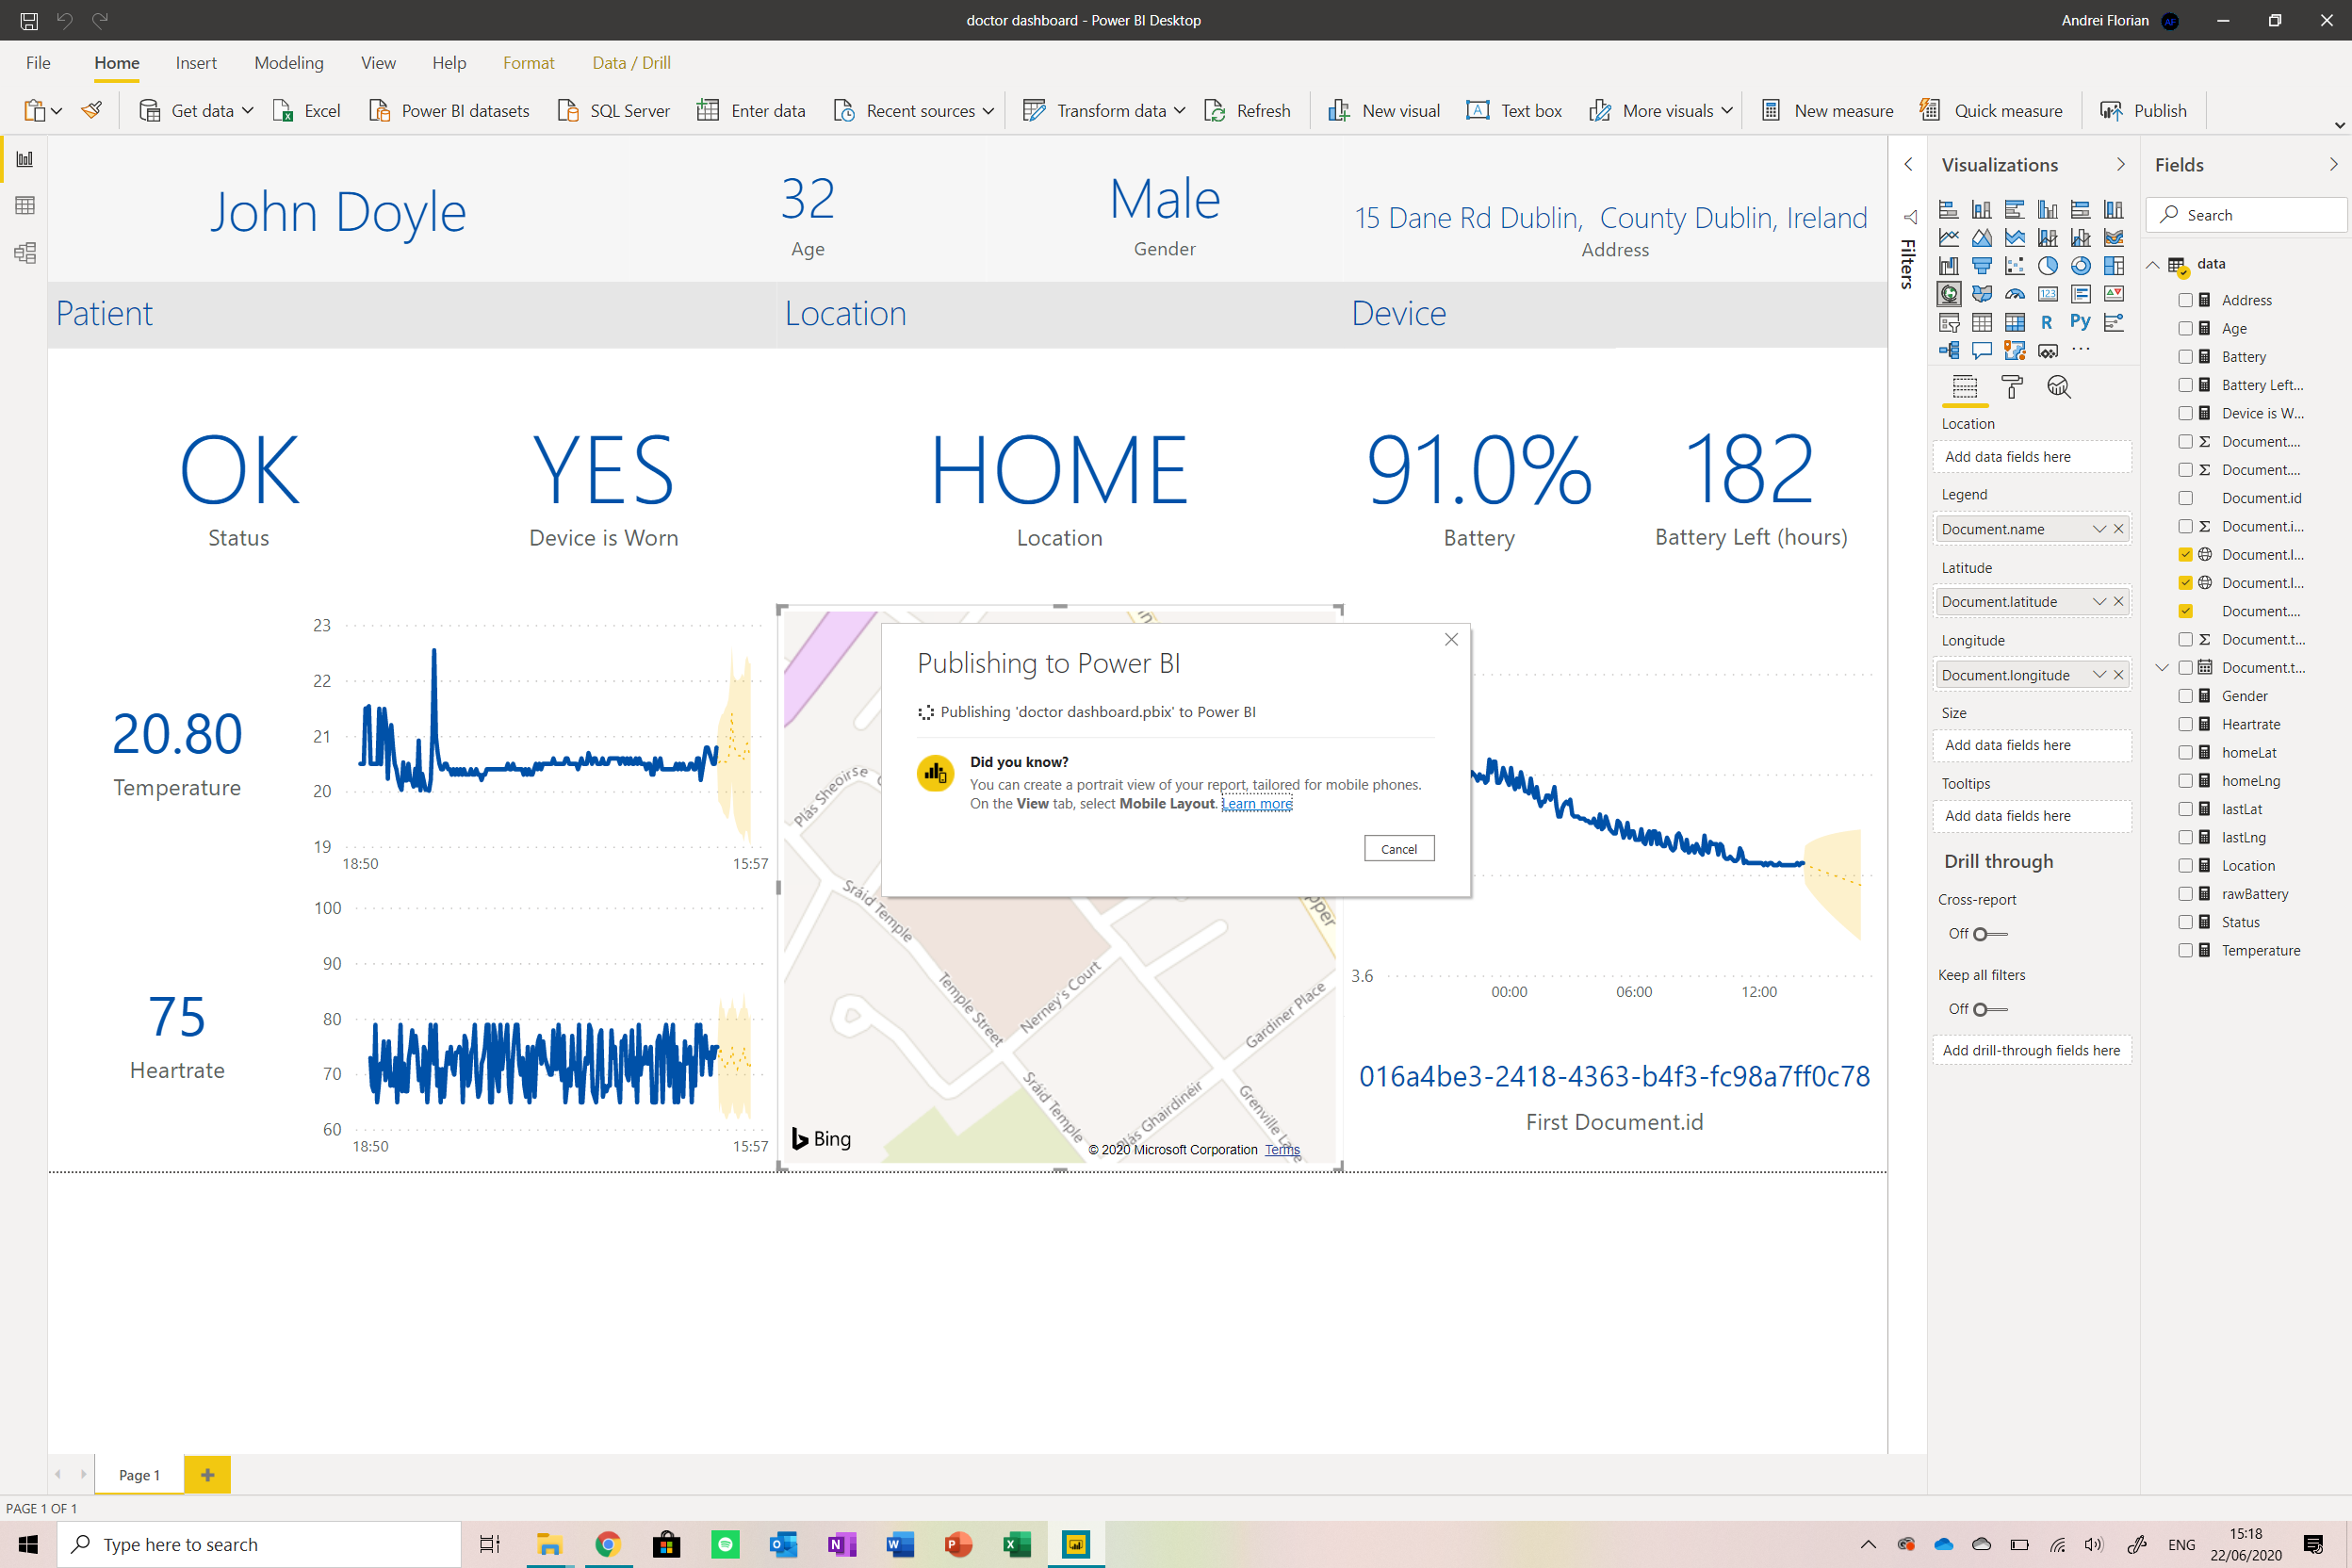
Now after the dashboard is designed, we need to publish it on the web so that we can access it from anywhere, on any device. Note that the data in the report is automatically refreshed when the user opens it (there is also a refresh button).
Click on the Publish button from the menu at the top of the screen and select My Workspace as the destination. Wait for the dashboard to upload.
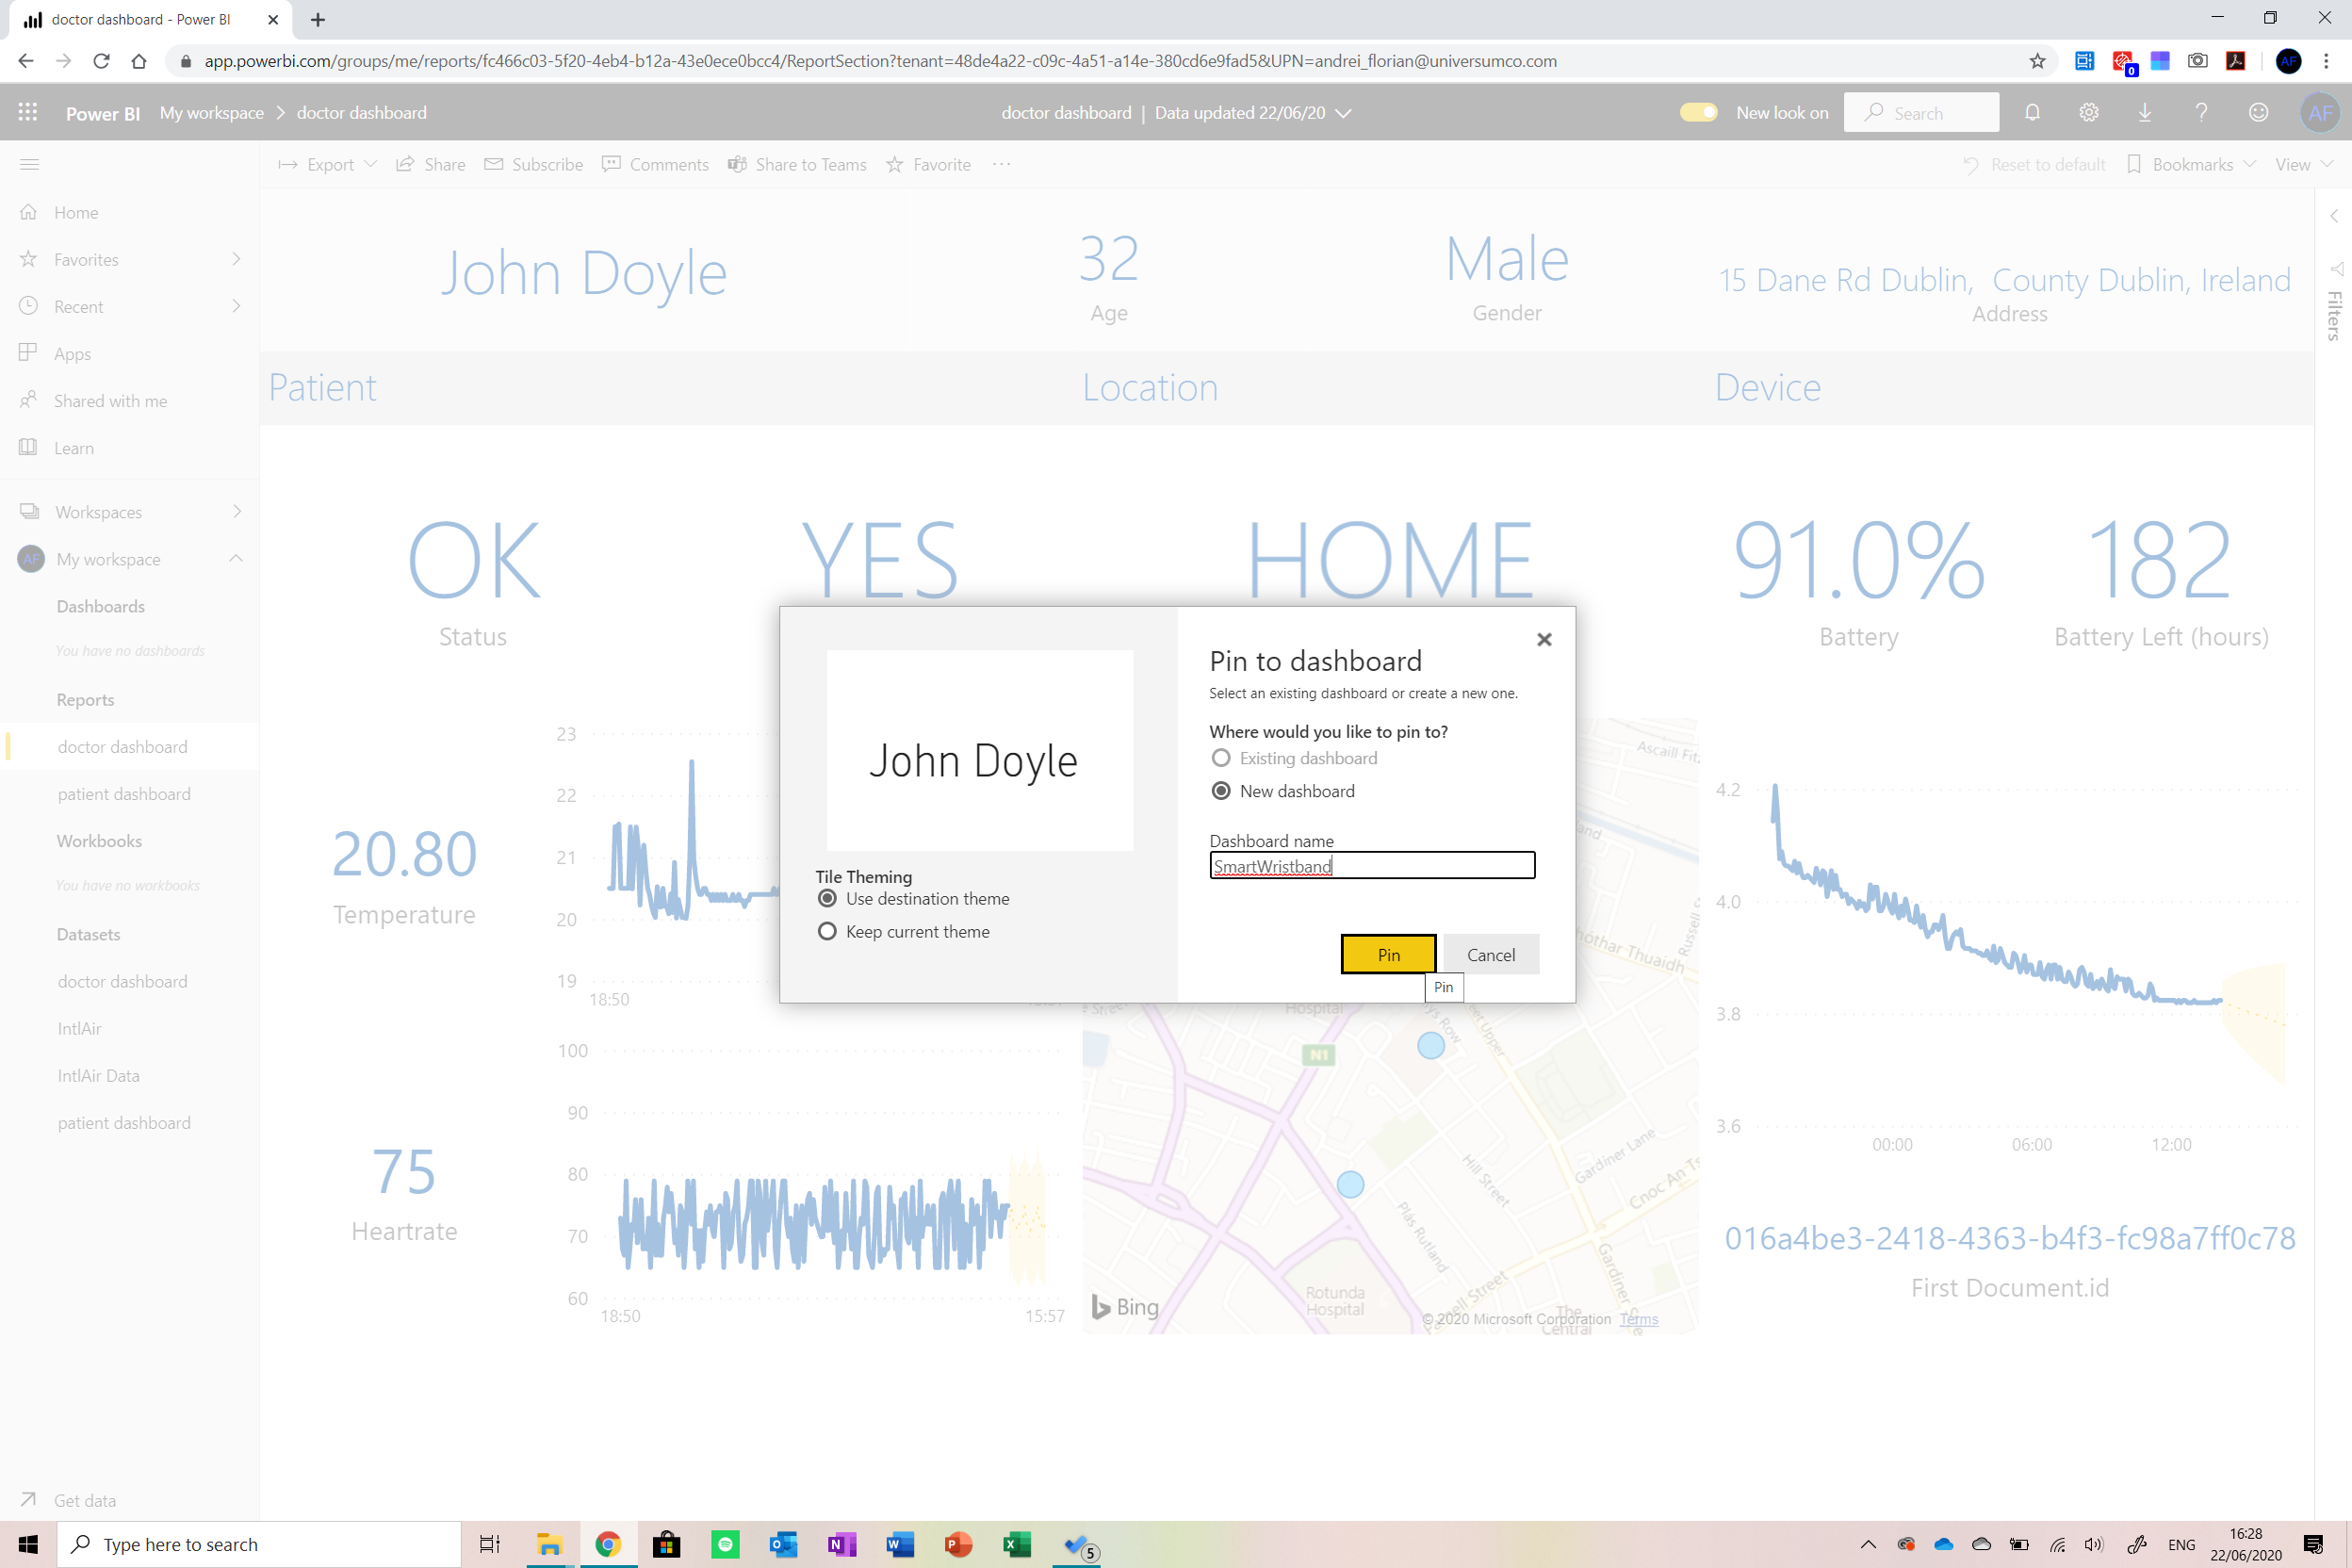
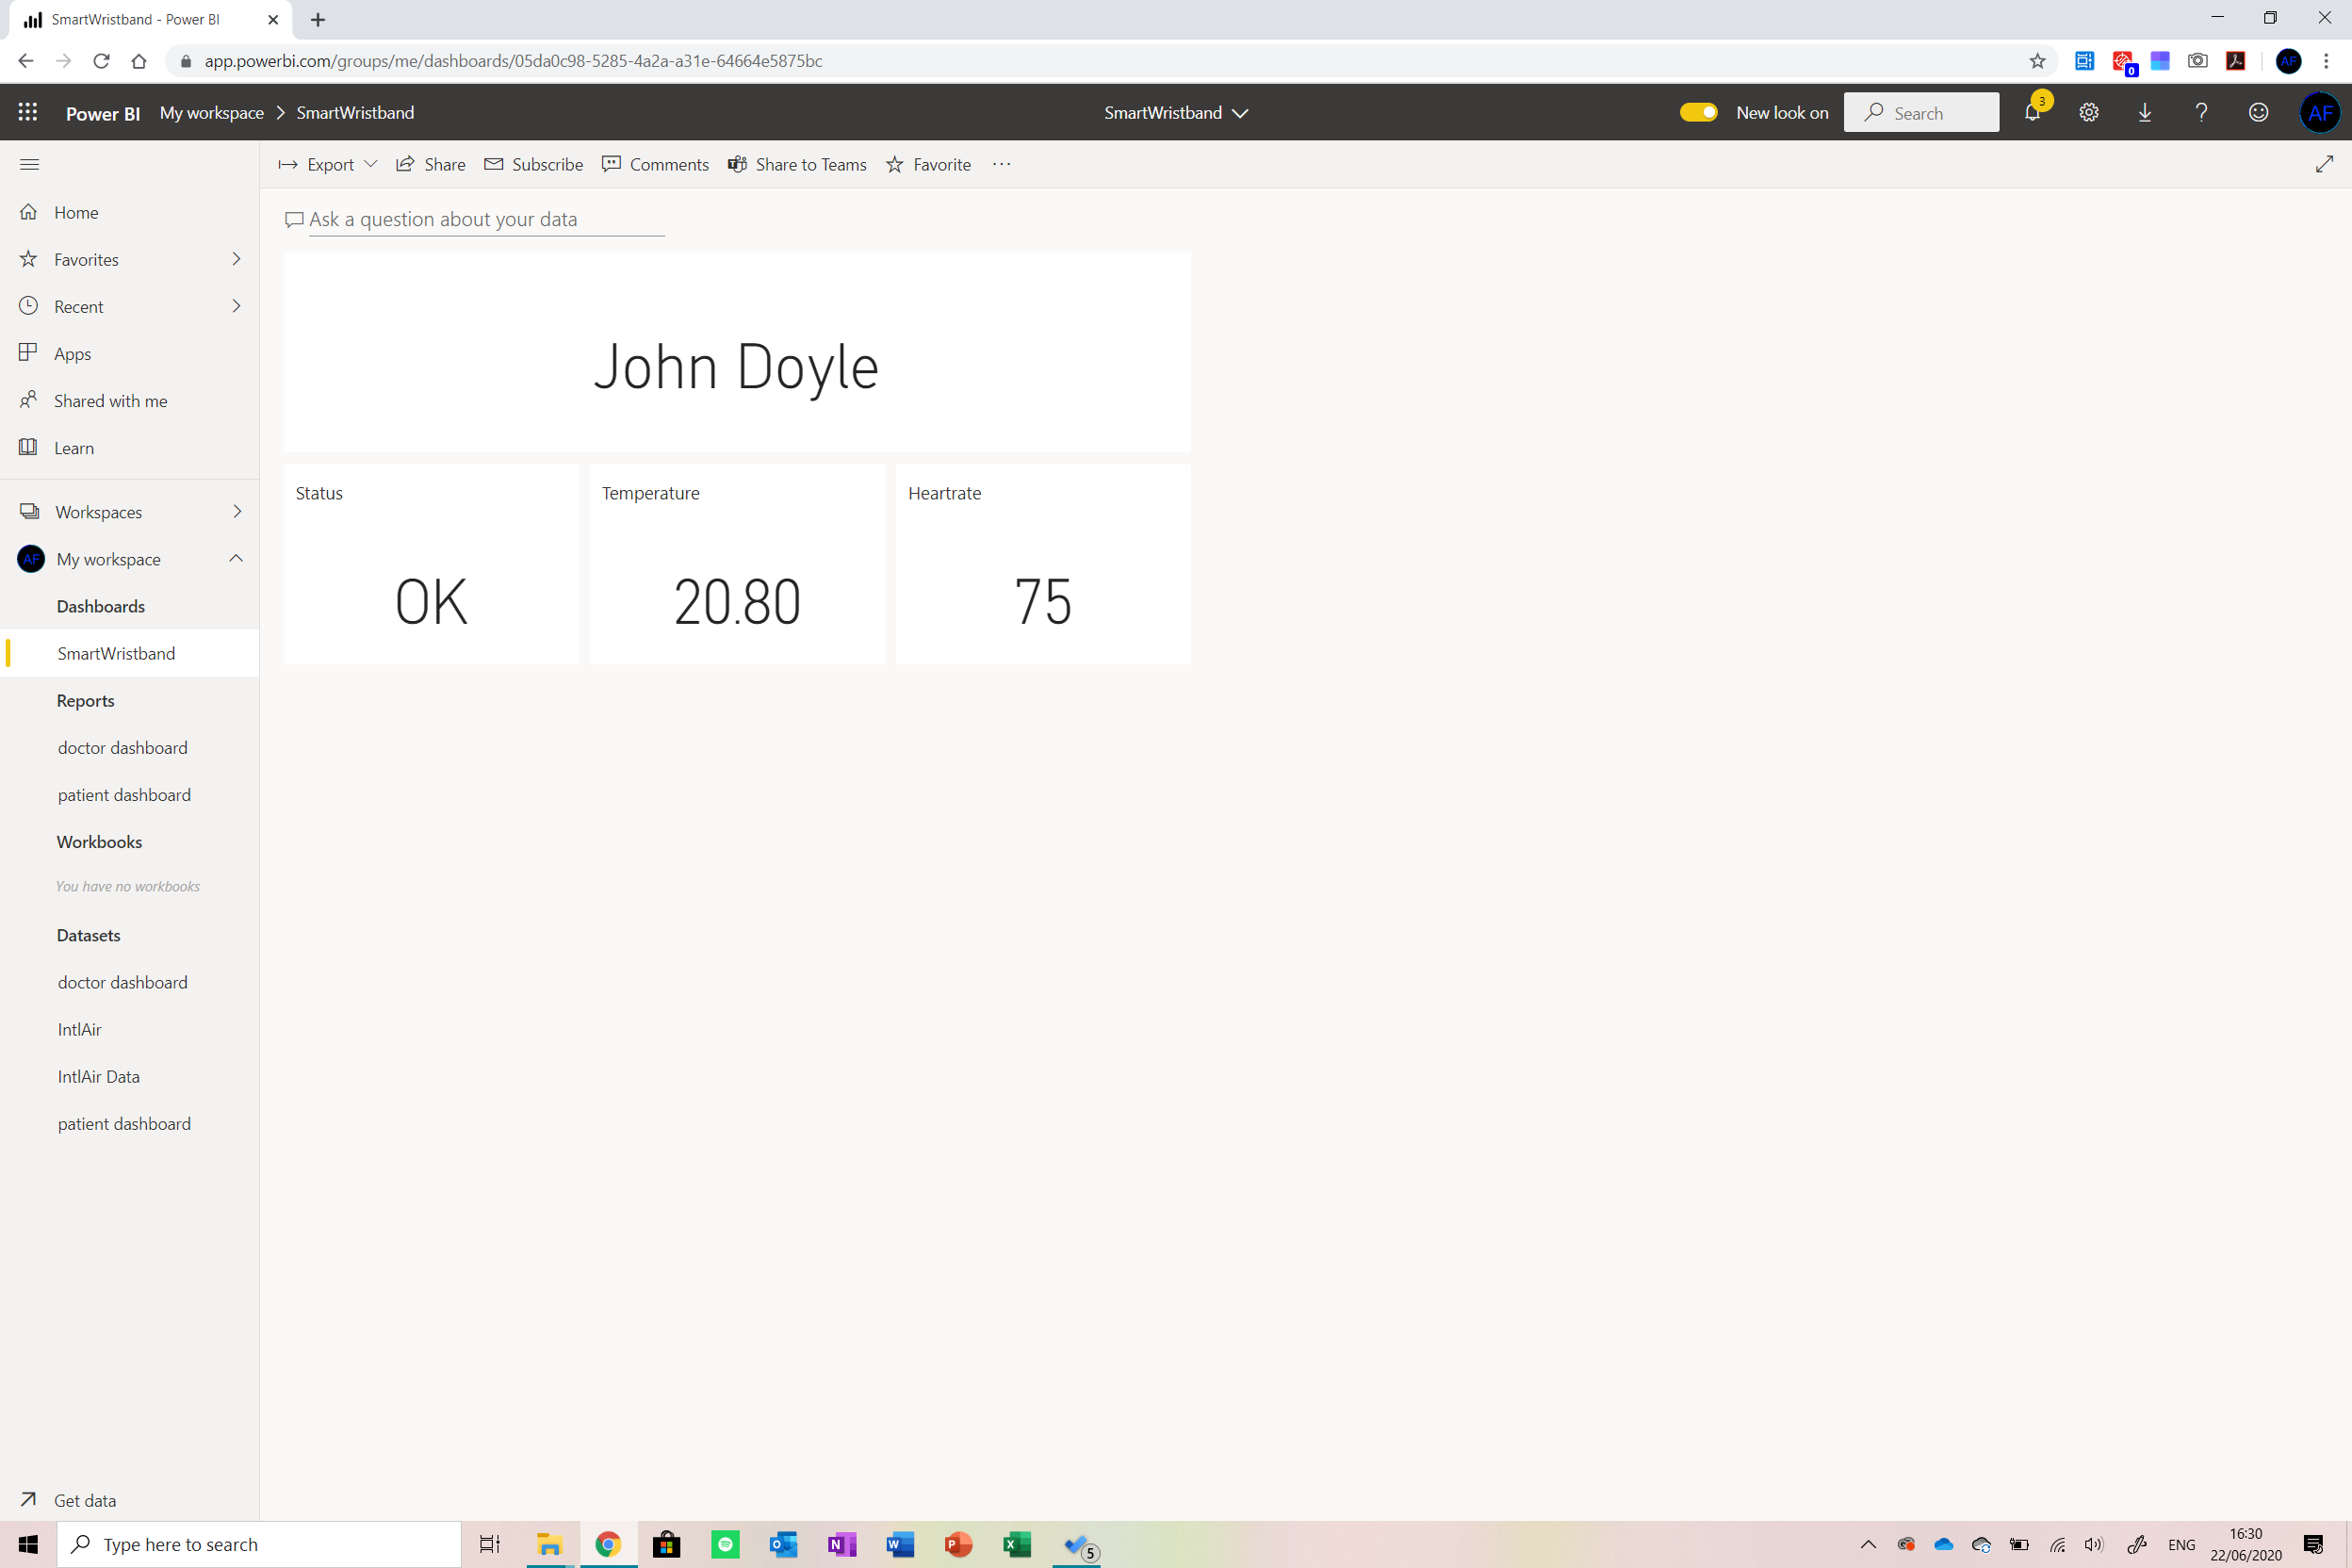
To continue working on this, open the Power Bi report in the browser . We will now be working on the dashboard that summarises all patients. To do this, click on the tile depicting the status of the patient to see a menu.
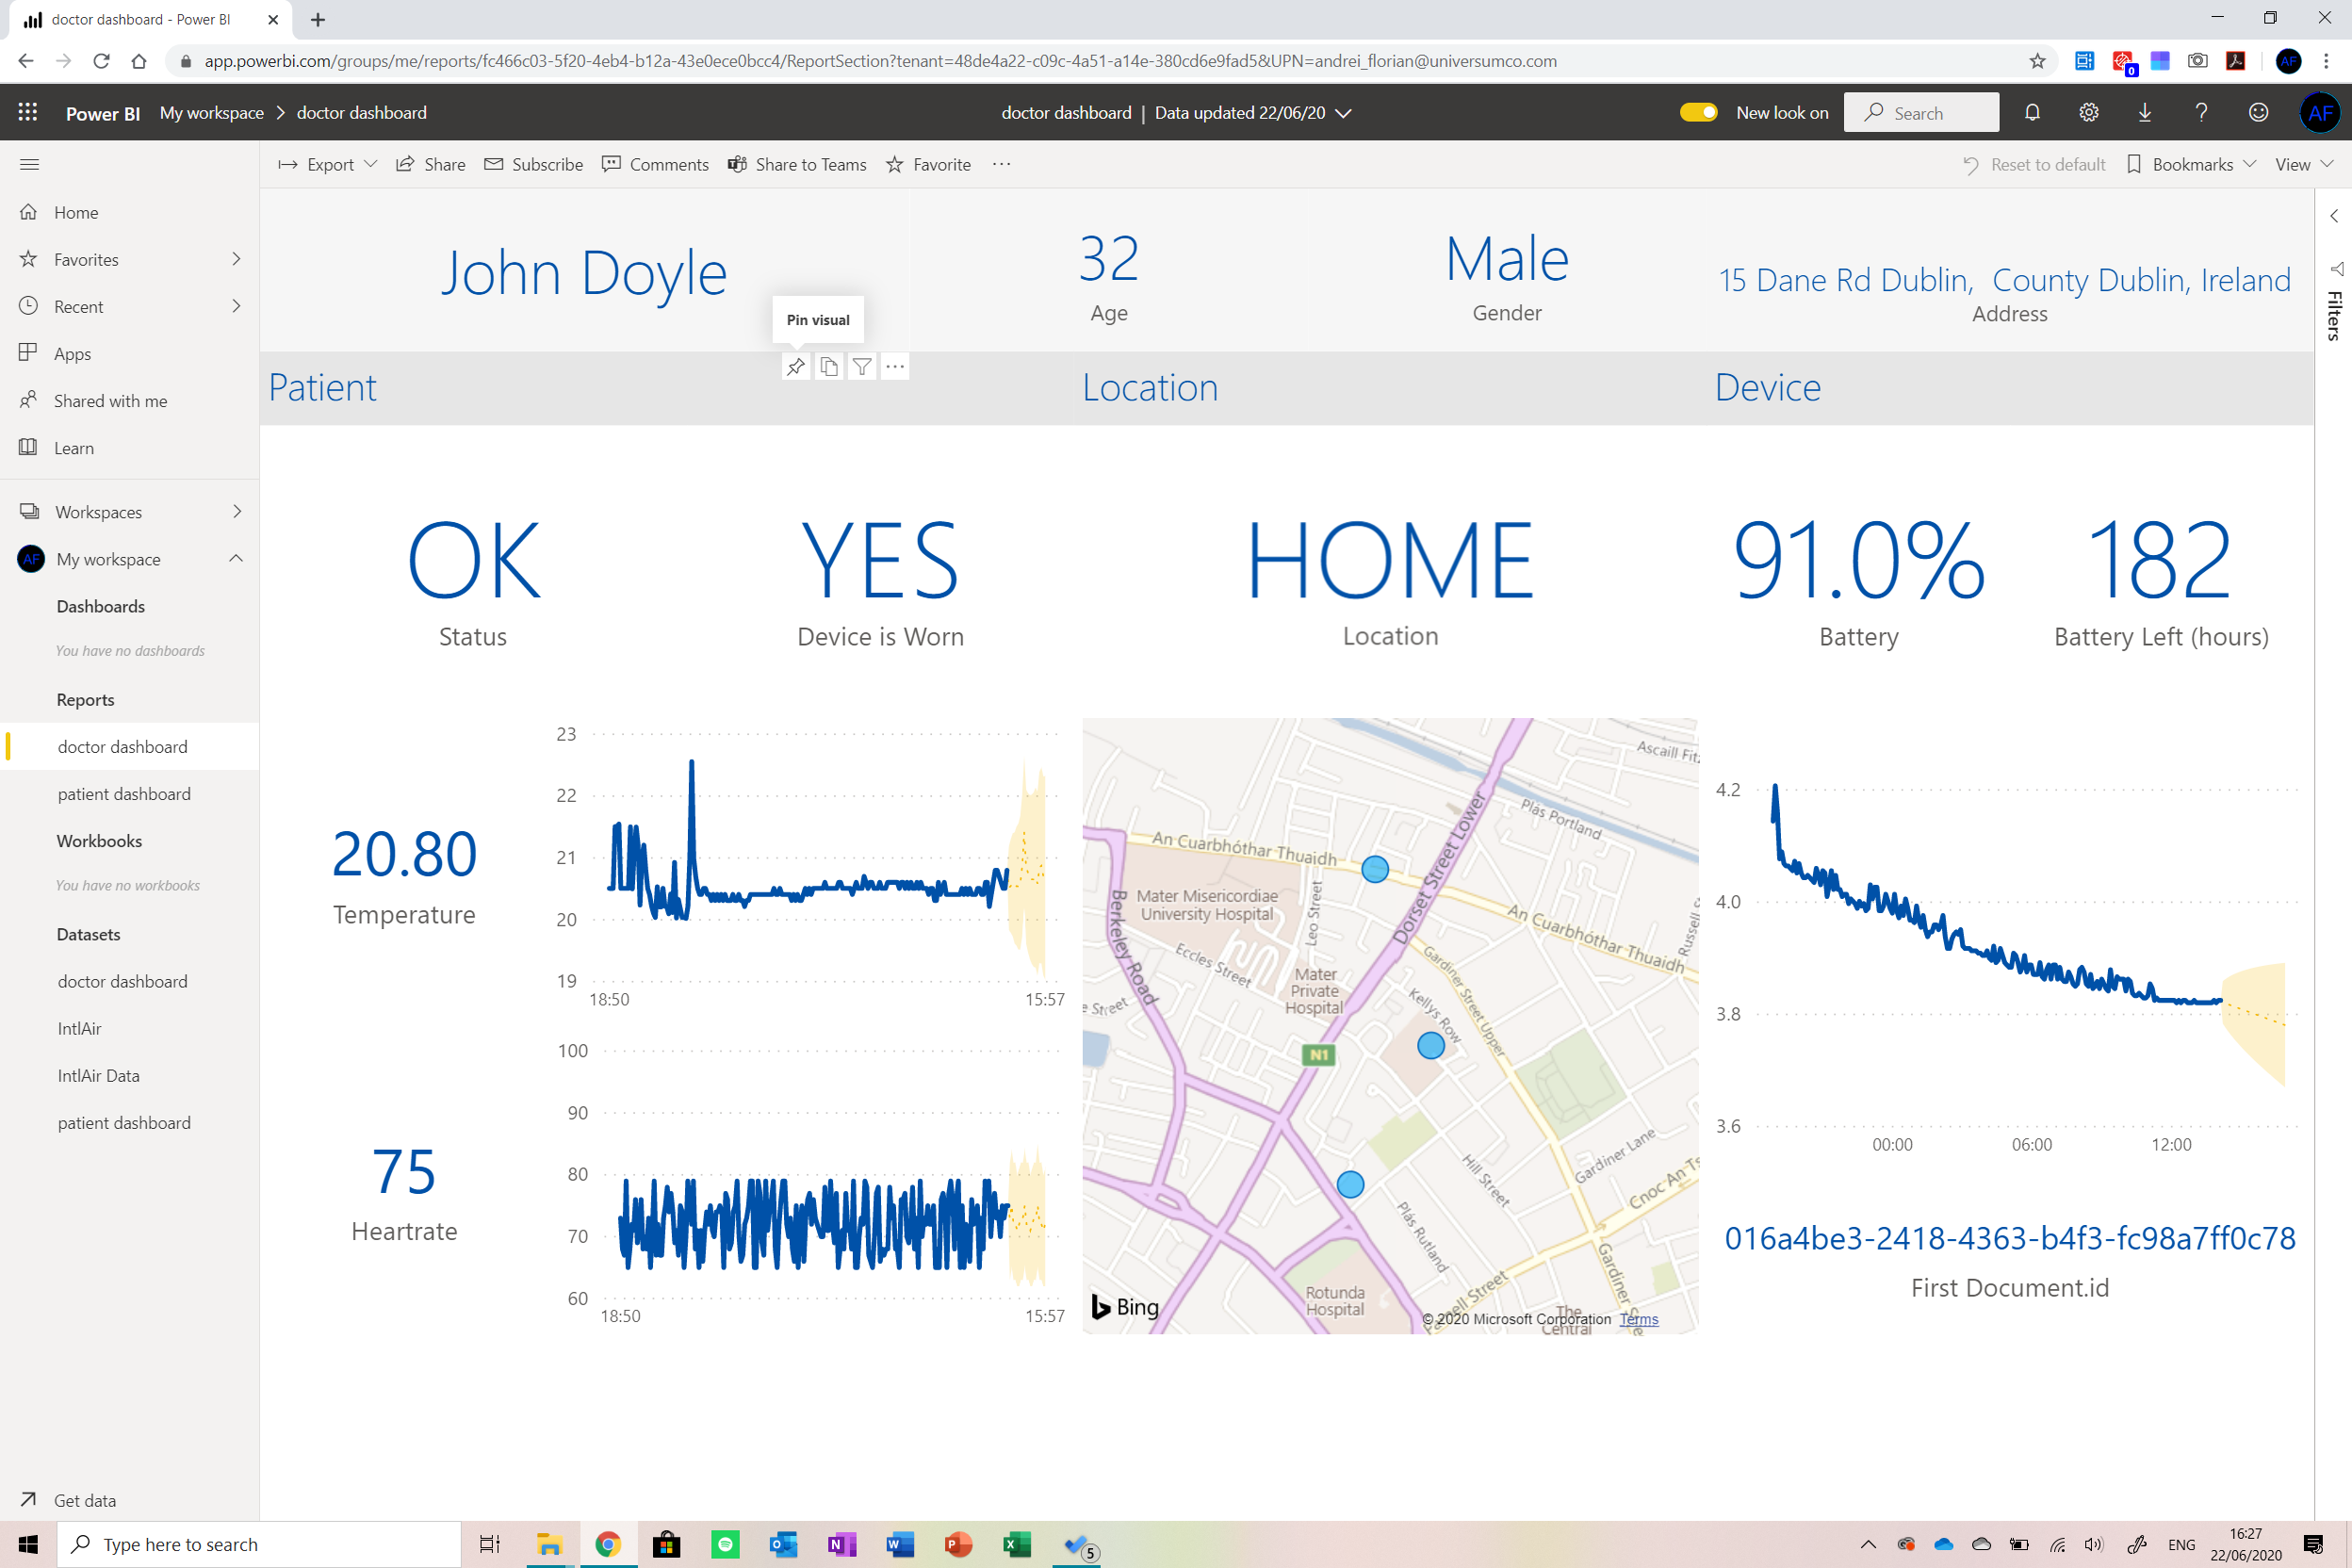
From the menu, select the pin visual button and create a new dashboard . This visual will pin to the dashboard. Repeat this for the following cards:
- Name
- Status
- 温度
- Heart rate
The doctor will be able to see a glimpse of all the patients being monitored on this dashboard.
Finally, click on the temperature card in the dashboard and the on the menu button, select the Manage Alerts button to open a menu where you can set alerts for the visual. Configure this as below and repeat the step with heart rate (set the threshold to 100).
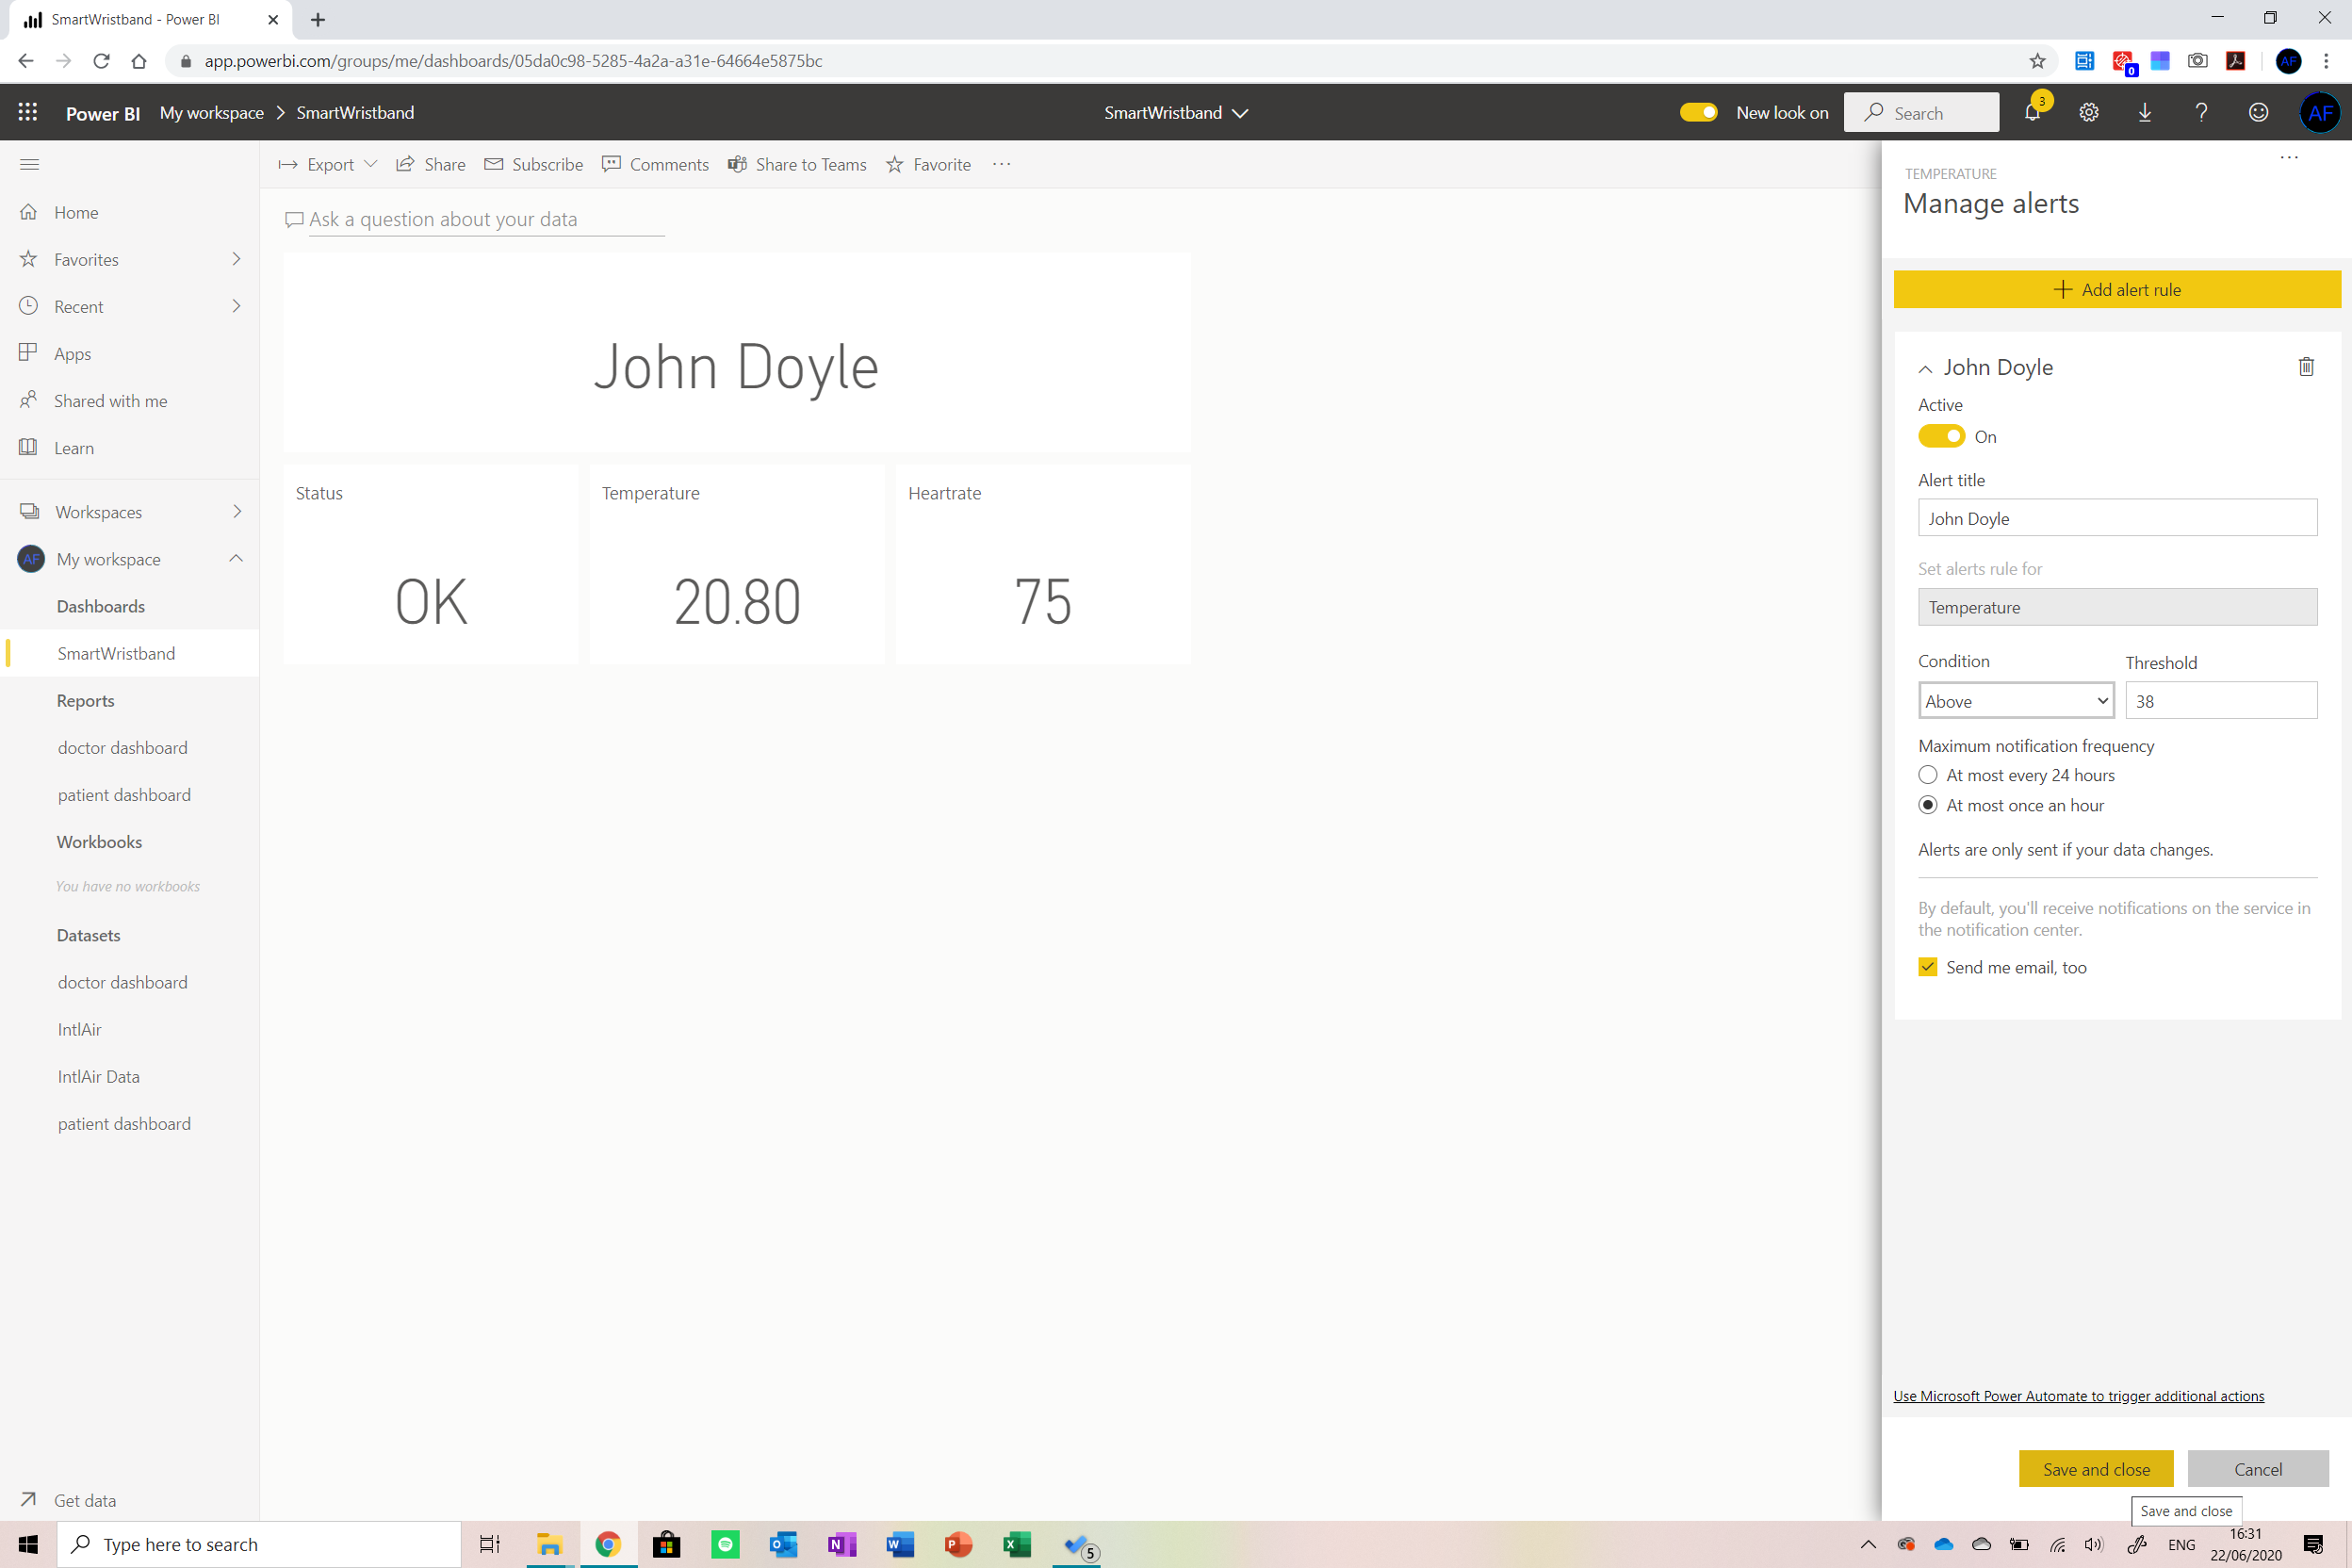
And that’s it, we now need to work on the patient dashboard.
Patient Dashboard
We will start this dashboard by copying the doctor dashboard as we will be using all the measures and data collected there but display it in a different way.
I kept all the data there but removed the forecasting for the temperature and heartrate sections (to prevent patients from worrying to much about it) and removed the location section (because the patient knows where they are).
I also developed a mobile version of this dashboard . To do so, navigate to the View menu and then select Mobile Layout . From there, we only need to drag and drop the existing tiles onto the mobile phone to create this layout.
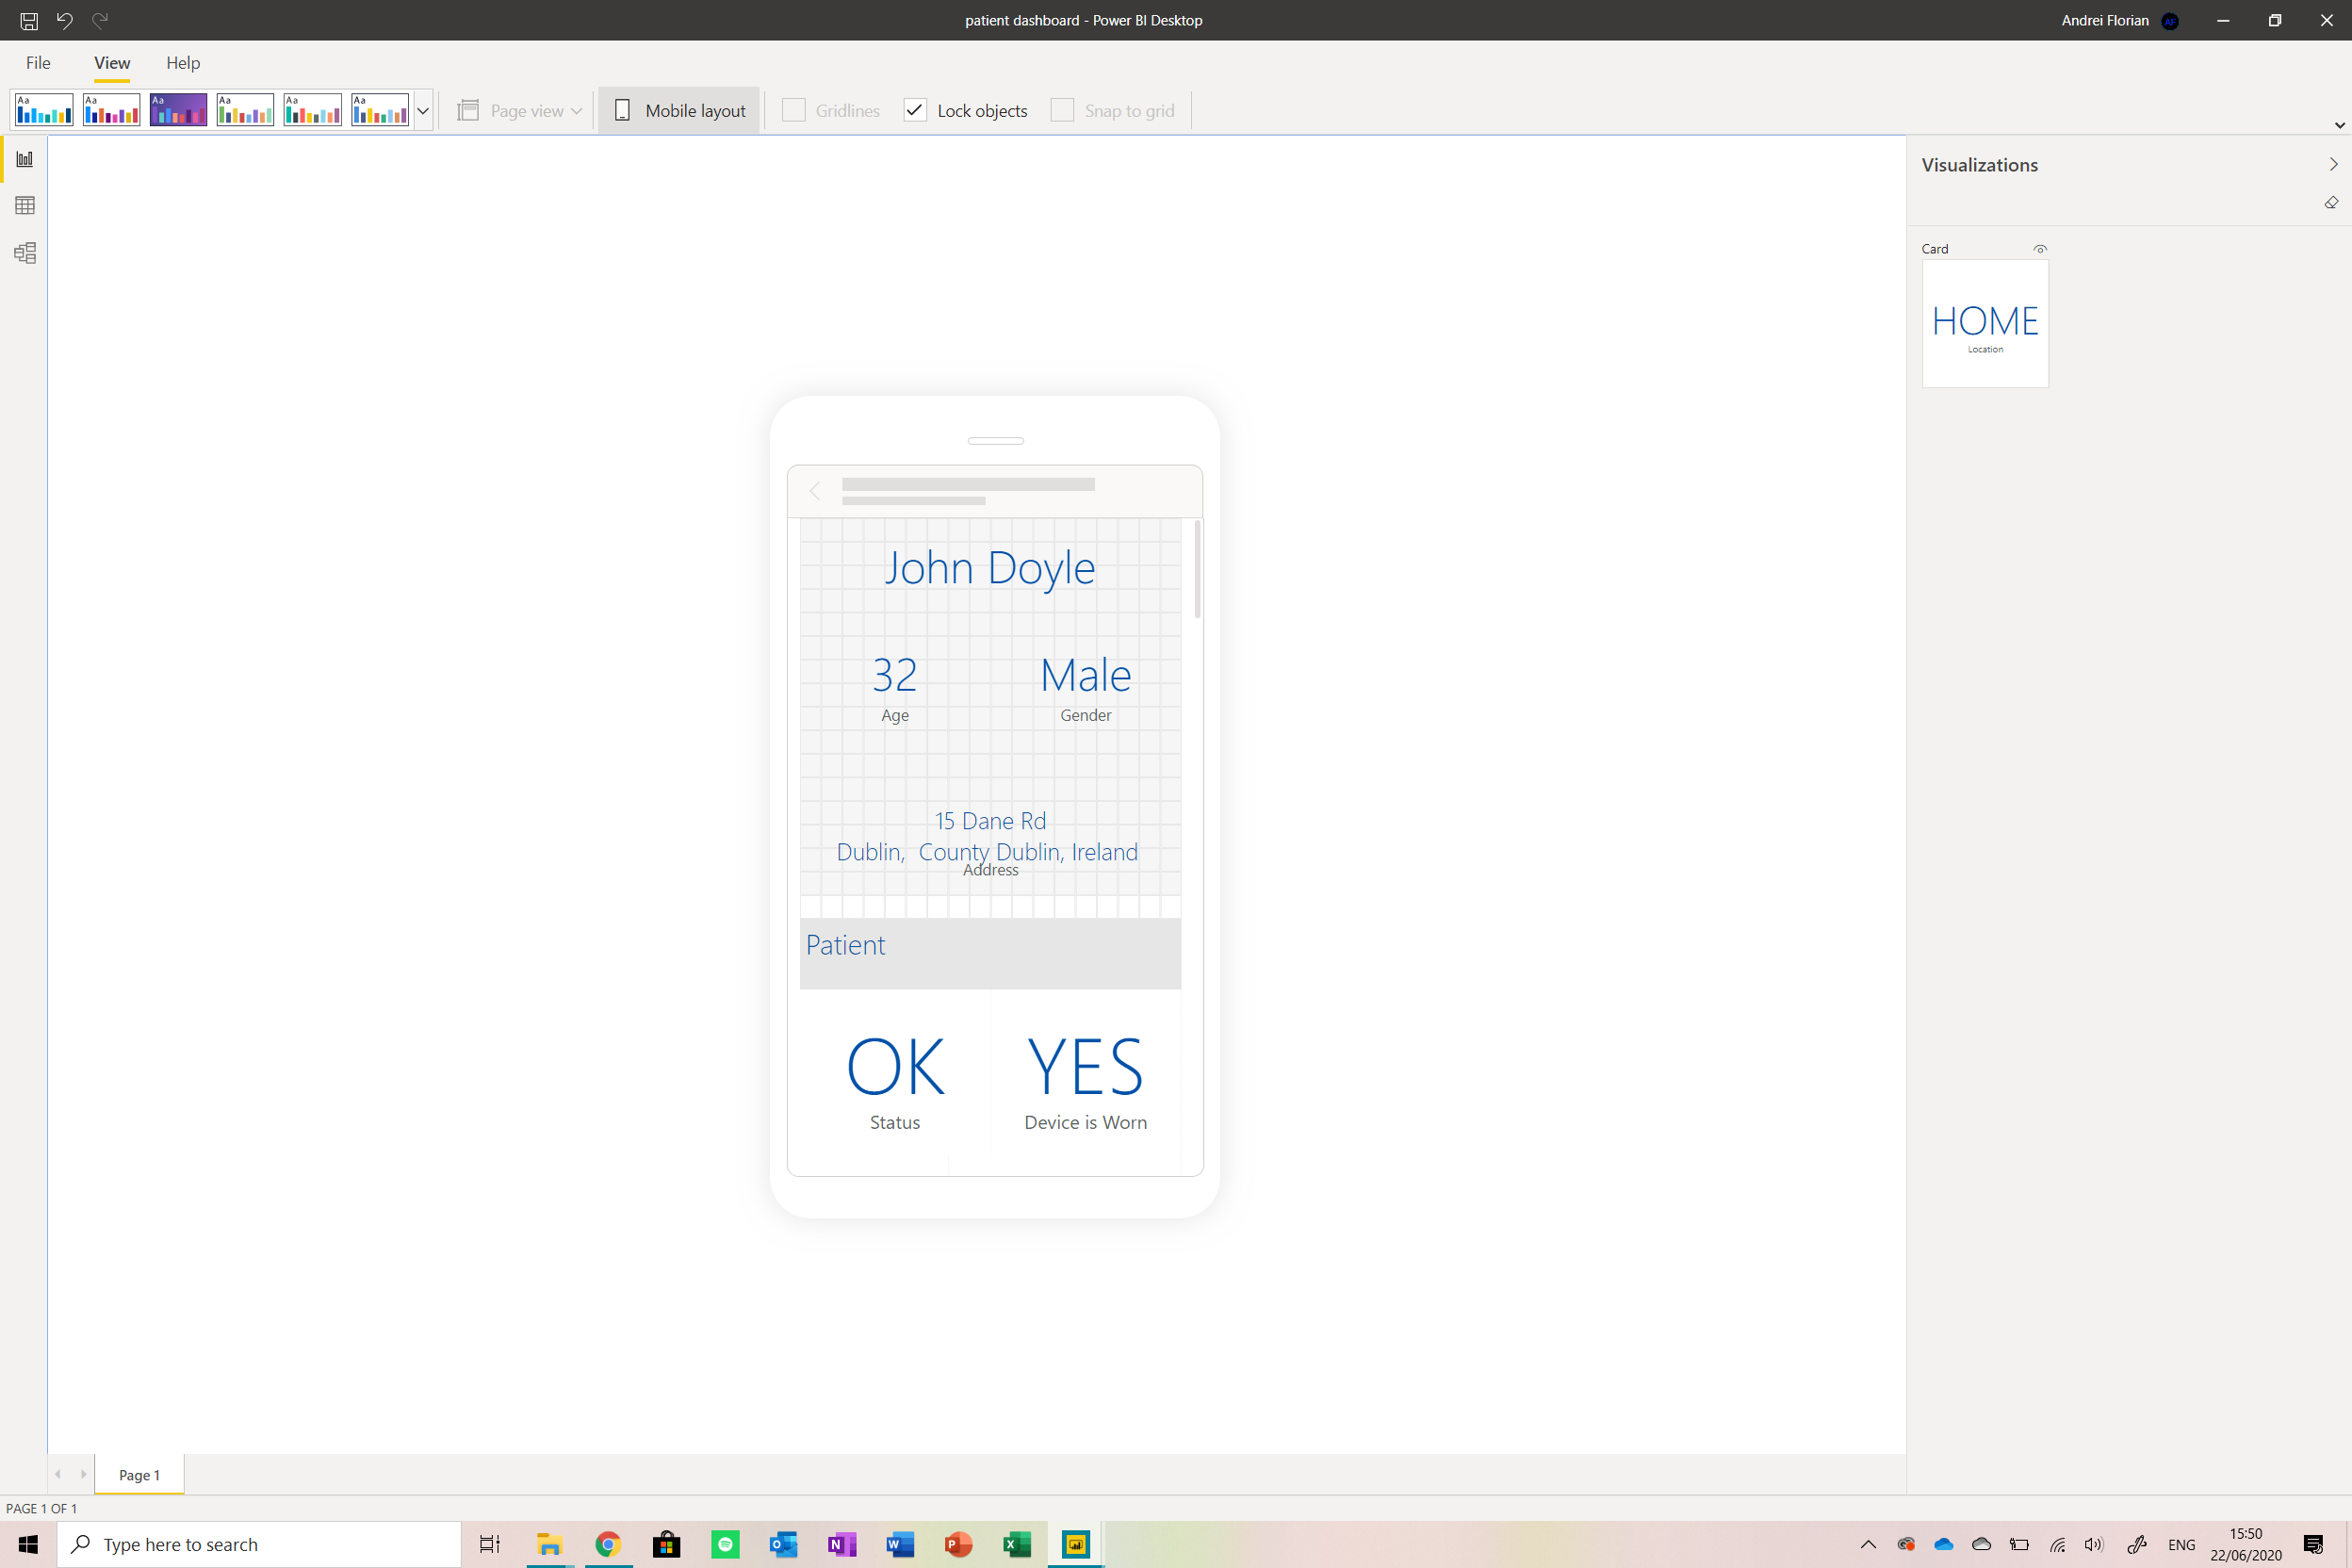
After this is done, we will upload the dashboard online again as done before. This dashboard can be shared with the patient through the Power Bi app where they can get a mobile version of the application showing them all the information they need as well as an online view.
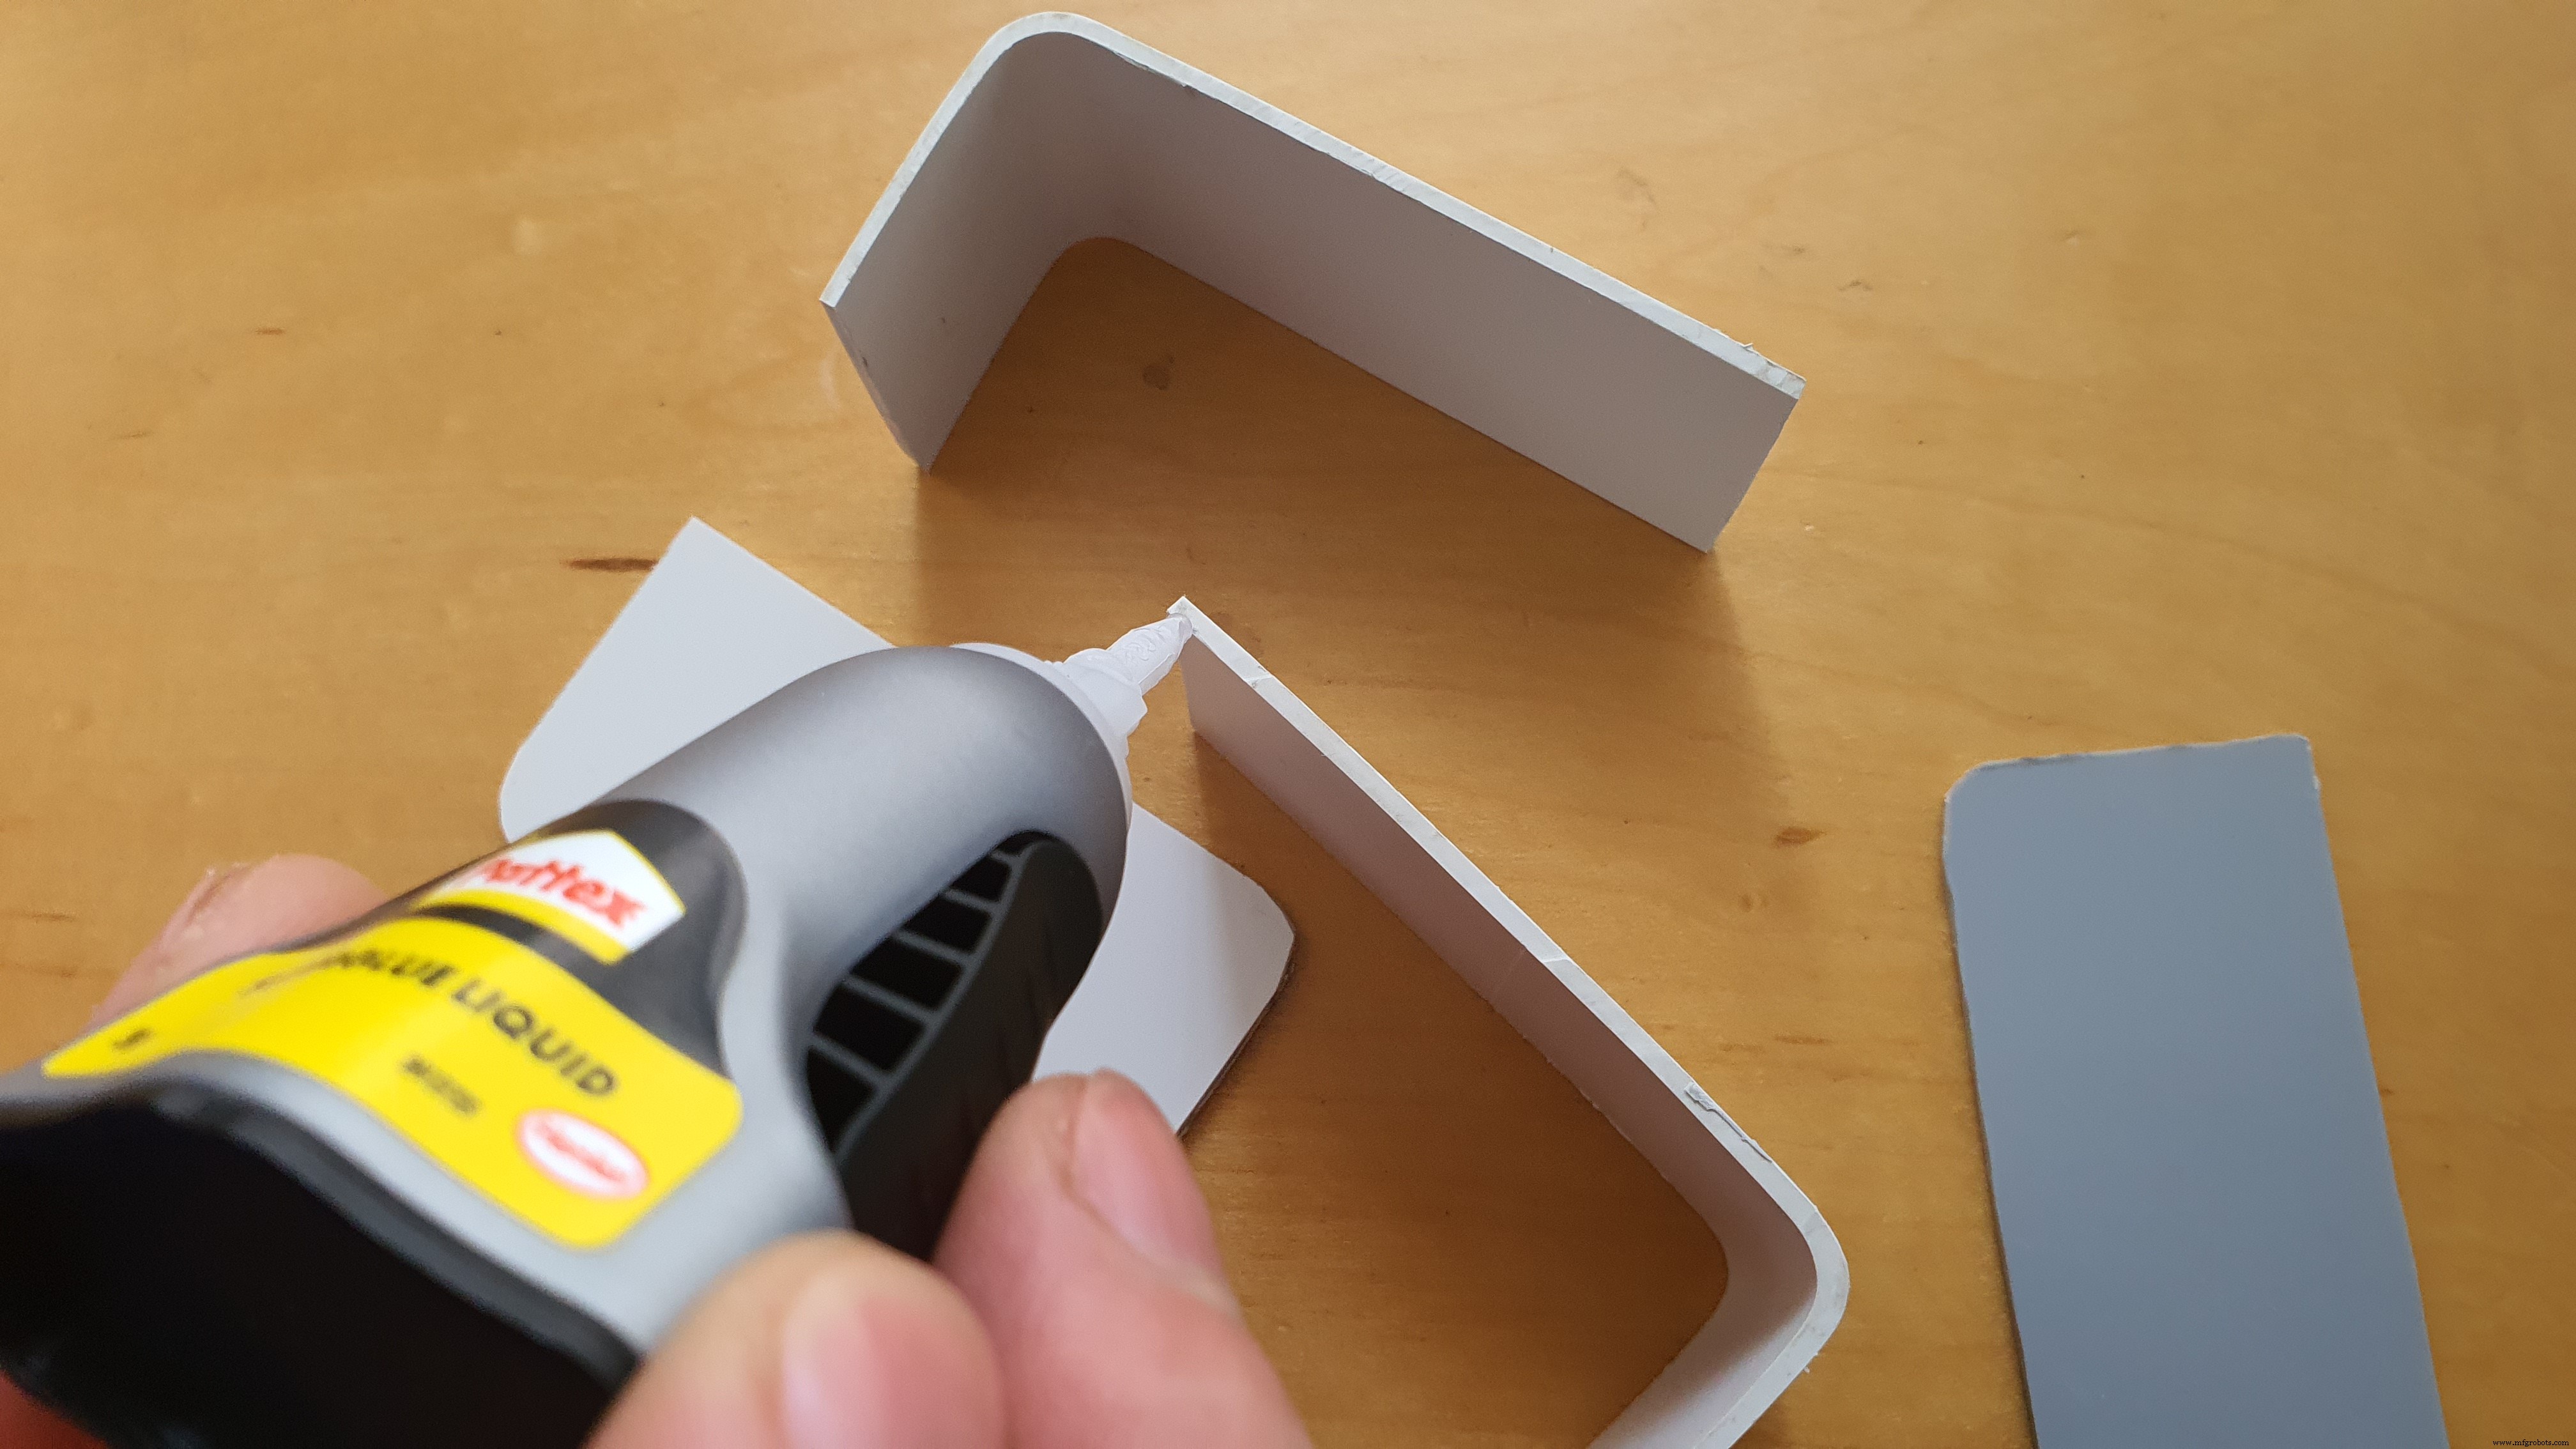
Step 12:Finally, the enclosure
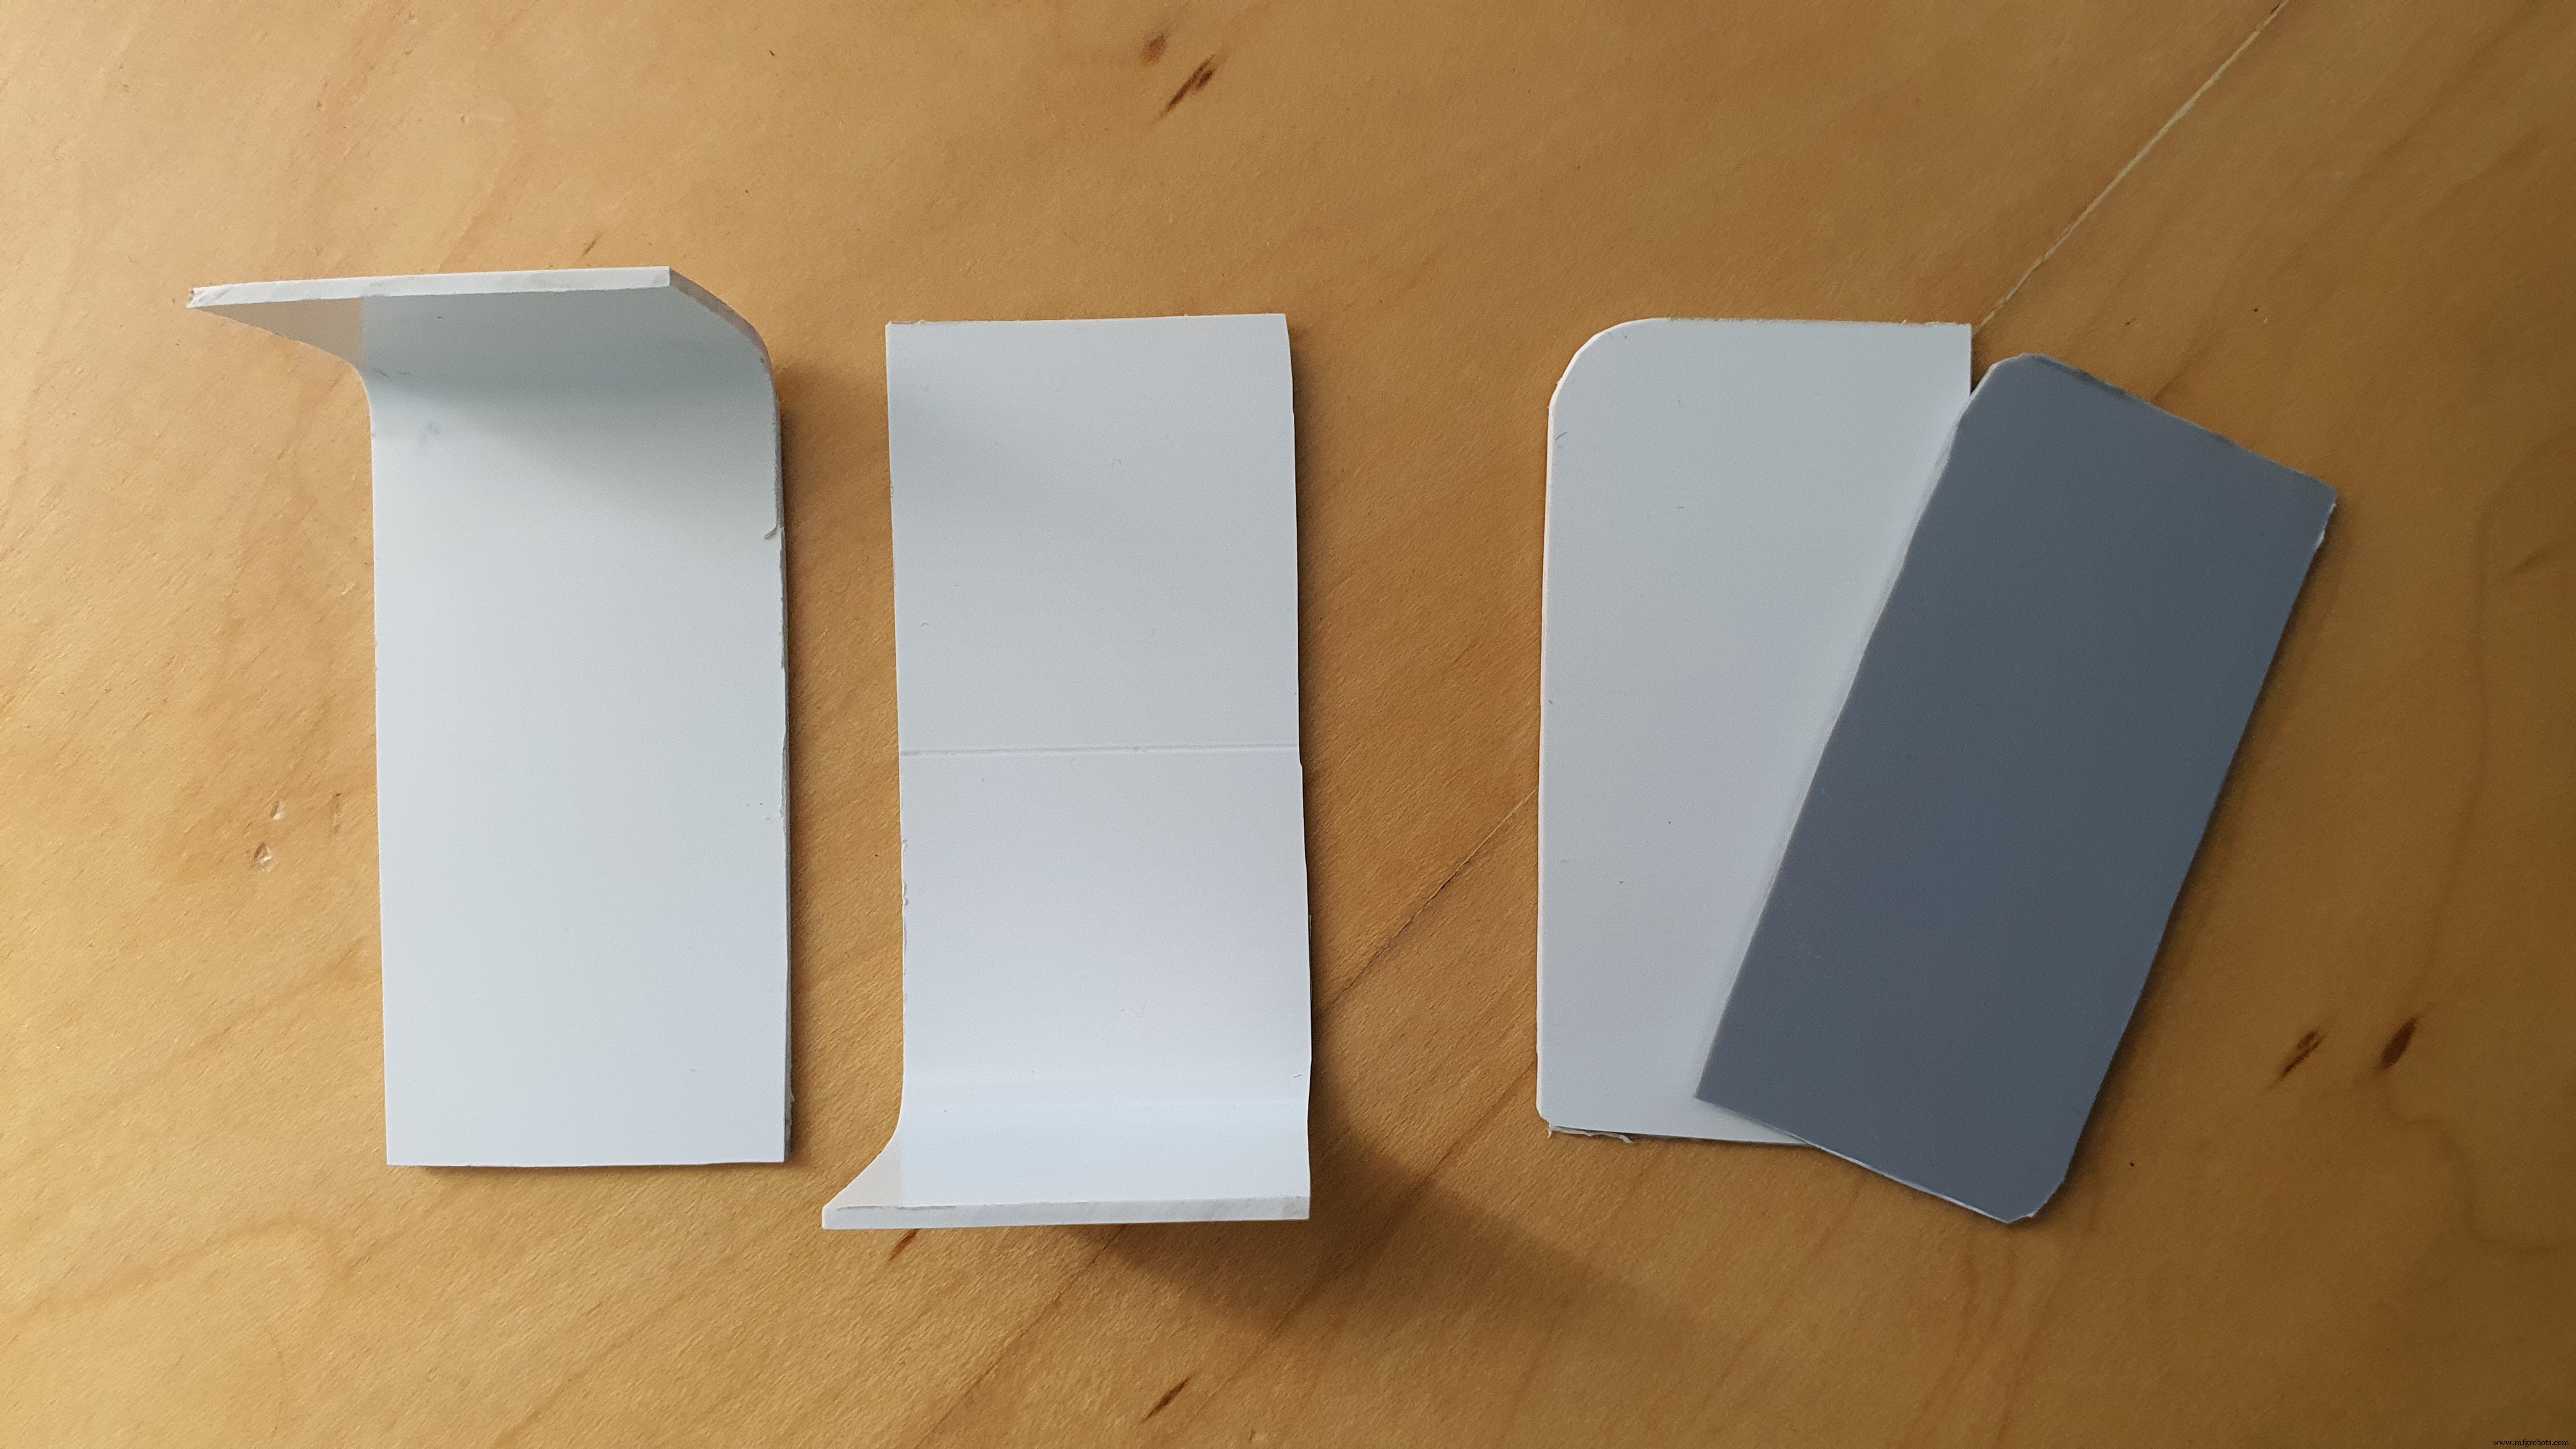
So now that everything is done, we need to create an enclosure for the project, now ideally it would be 3D printed, but because I don’t have a 3D printer (I really need to get one), I cut pieces of plastic out and assembled them that way. I do though have a 3D design made for the enclosure of the prototype.
The device is quite big in this instance and a future and industrial version will obviously be reduced in size (I just didn’t want to solder all the components onto a PCB so I could reuse them in future projects).
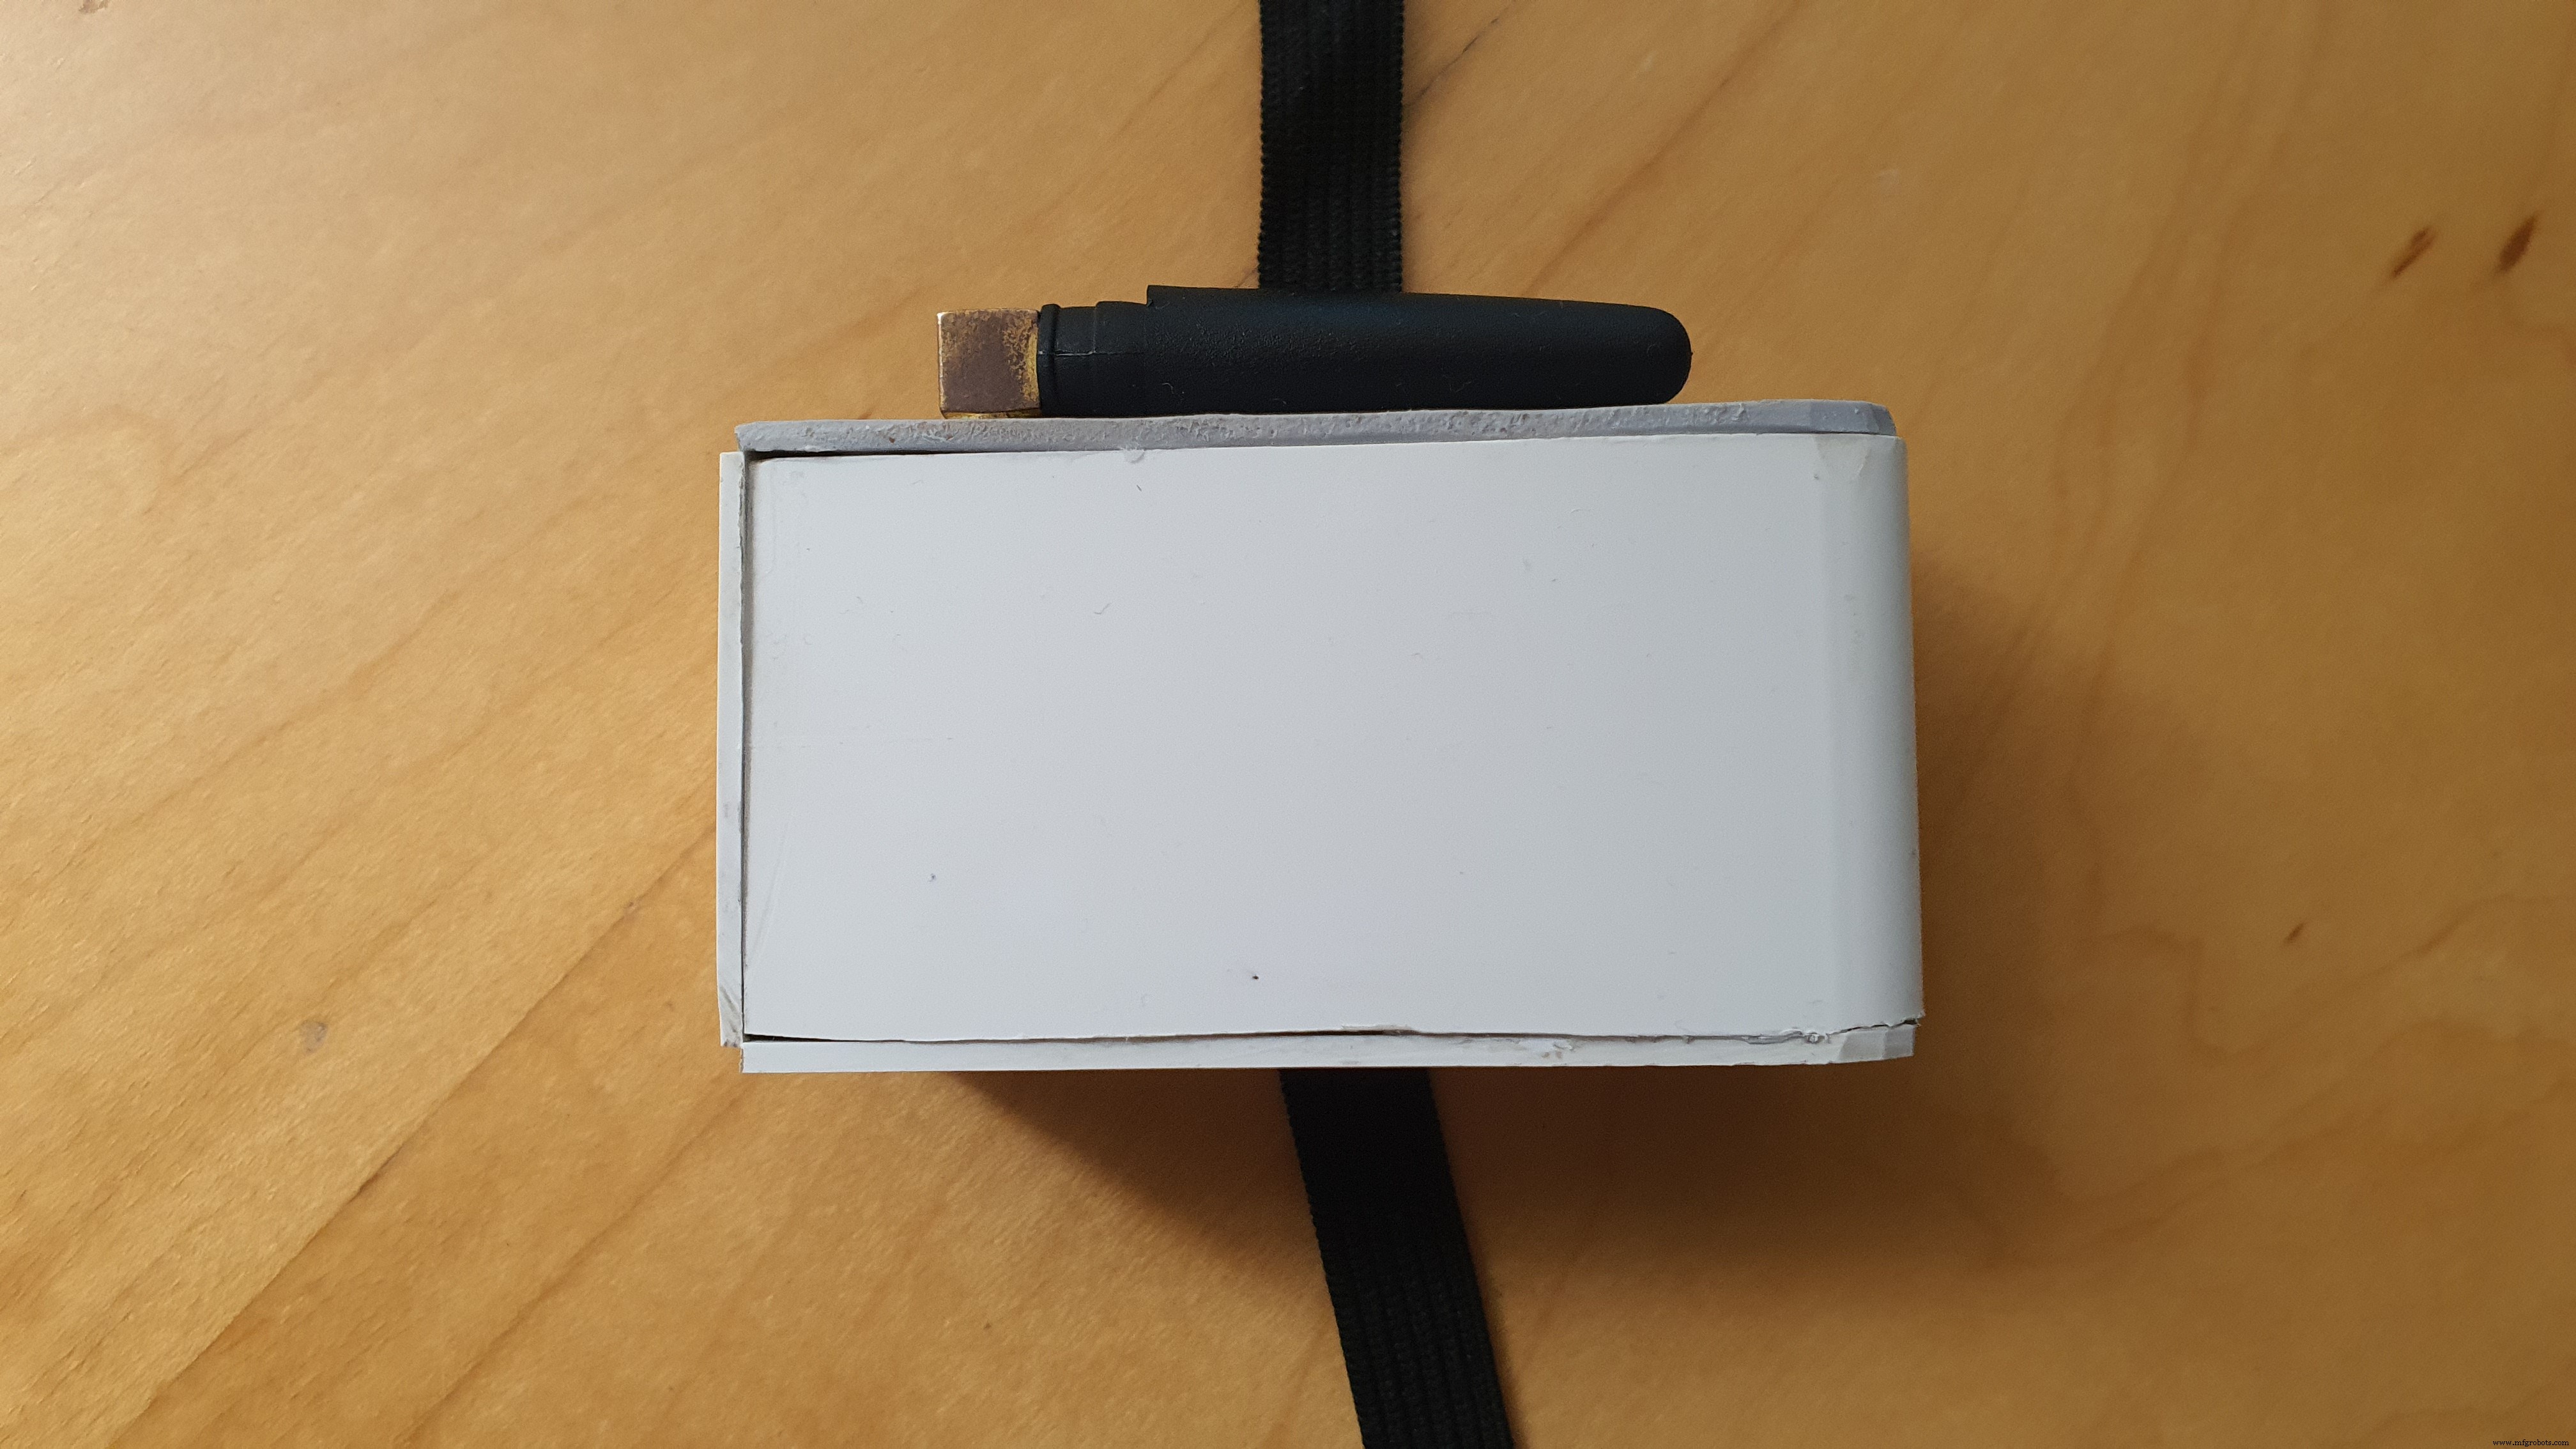
就是这样! The project is done!
Reflection
I really enjoyed making this project. I spent a couple of hours in March brainstorming ideas to tackle the coronavirus and when this contest was announced, I started working on one of the best ideas that I believed would truly have an impact on the community – SmartWristband.
I am very proud to take part in this international effort to provide the world with low-cost scalable solutions that would help combat the virus. I was inspired by the Taiwanese government because of their smart tracking devices that ensure that people confirmed with the virus stay at home and abide by the rules of the quarantine. I felt like this system could be improved to further enhance the safety of the patient by also monitoring their heart rate and temperature while at home.
Coronavirus is a tricky problem to tackle and truly needs a lot of cooperation and devotion to overcome. I believe that this application is implementable at global level to help monitor the health of patients confirmed with weak forms of the virus allowing them to stay at home and liberate space in hospitals that can be assigned to more urgent cases.
The thing I enjoyed the most out of the making of this project was the dashboard, I really enjoyed designing it (I am a visual person). I encountered some problems connecting the Arduino MKR GSM to Azure IoT. This was because I set the expiry date of the device’s certificate to something like 2 minutes (took me a while to realise).
I really hope you enjoyed the read and thanks for taking the time and interest. Have a great day and take care.
代码
代码
The GitHub Repohttps://github.com/Andrei-Florian/SmartWristband定制零件和外壳
示意图
schematics_HcrW1SiwfW.fzz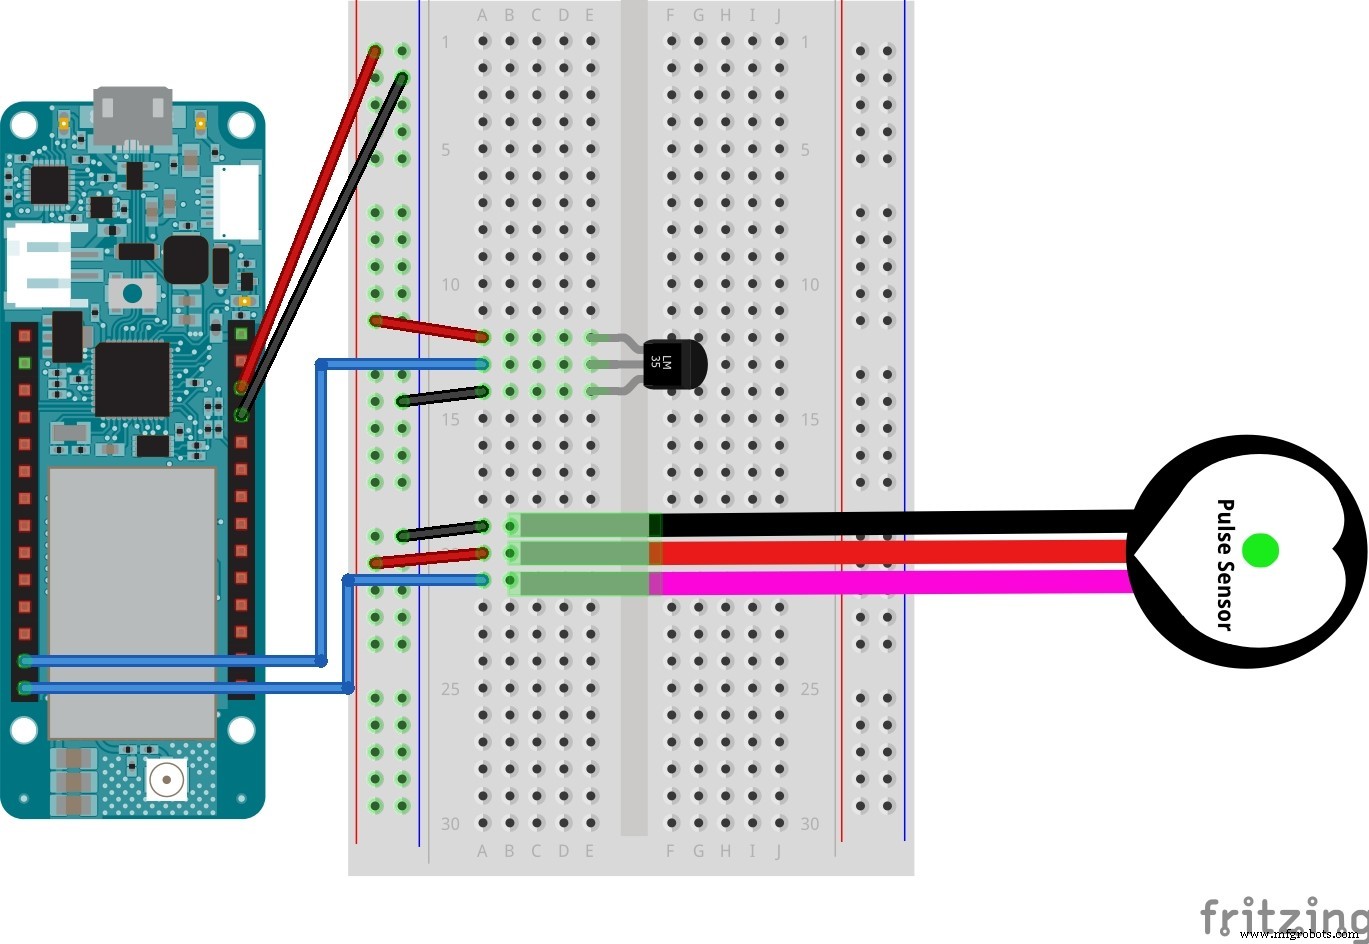
制造工艺