

UnifiedWater v1
组件和用品
 |
| × | 1 | |||
 |
| × | 1 | |||
| × | 1 | ||||
 |
| × | 1 | |||
 |
| × | 1 | |||
 |
| × | 1 | |||
 |
| × | 1 | |||
 |
| × | 1 | |||
 |
| × | 1 |
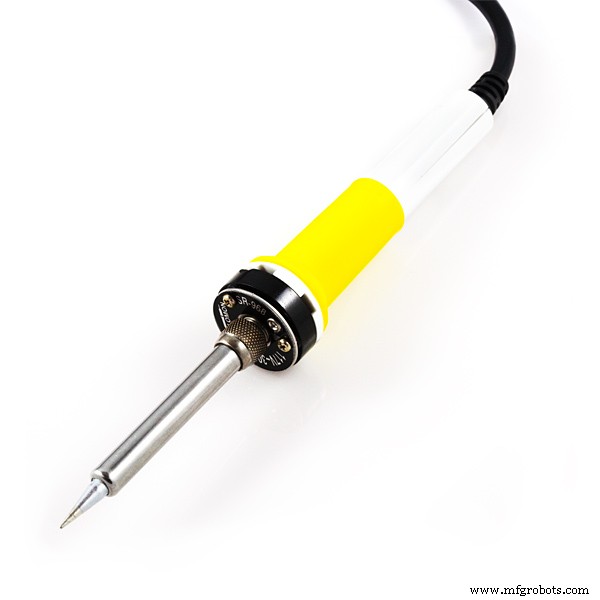
必要的工具和机器
 |
|
应用和在线服务
 |
| |||
 |
| |||
 |
| |||
 |
|
关于这个项目
概览
河流。对我们的生存、贸易等至关重要。在过去十年中,为减少我们对世界水体的污染做出了巨大努力。河流是污染的源头,因为人们不会去海边倾倒垃圾。他们把它倾倒在河里。
然后这些河流流入大海,海洋,因此曾经被扔进河流的牙刷会穿越世界并降落在它的另一边。
在一个努力对抗污染的世界中,数据至关重要。公司和企业在减少水污染的全球项目上进行合作应该很容易。这就是 UnifiedWater 的用武之地。
一种足够便宜且可扩展的设备,可以轻松收集和分析这些数据,因此了解河流的污染程度非常必要。 WaterAid 有两种模式,一种适合企业,另一种适合个人。
多个设备可以一起工作,放置在河流的不同点或不同的水体中。这些设备每隔一段时间收集数据,将其发送到同一个数据库。这使企业可以通过单击按钮来检查正在监控的河流或湖泊的状态。
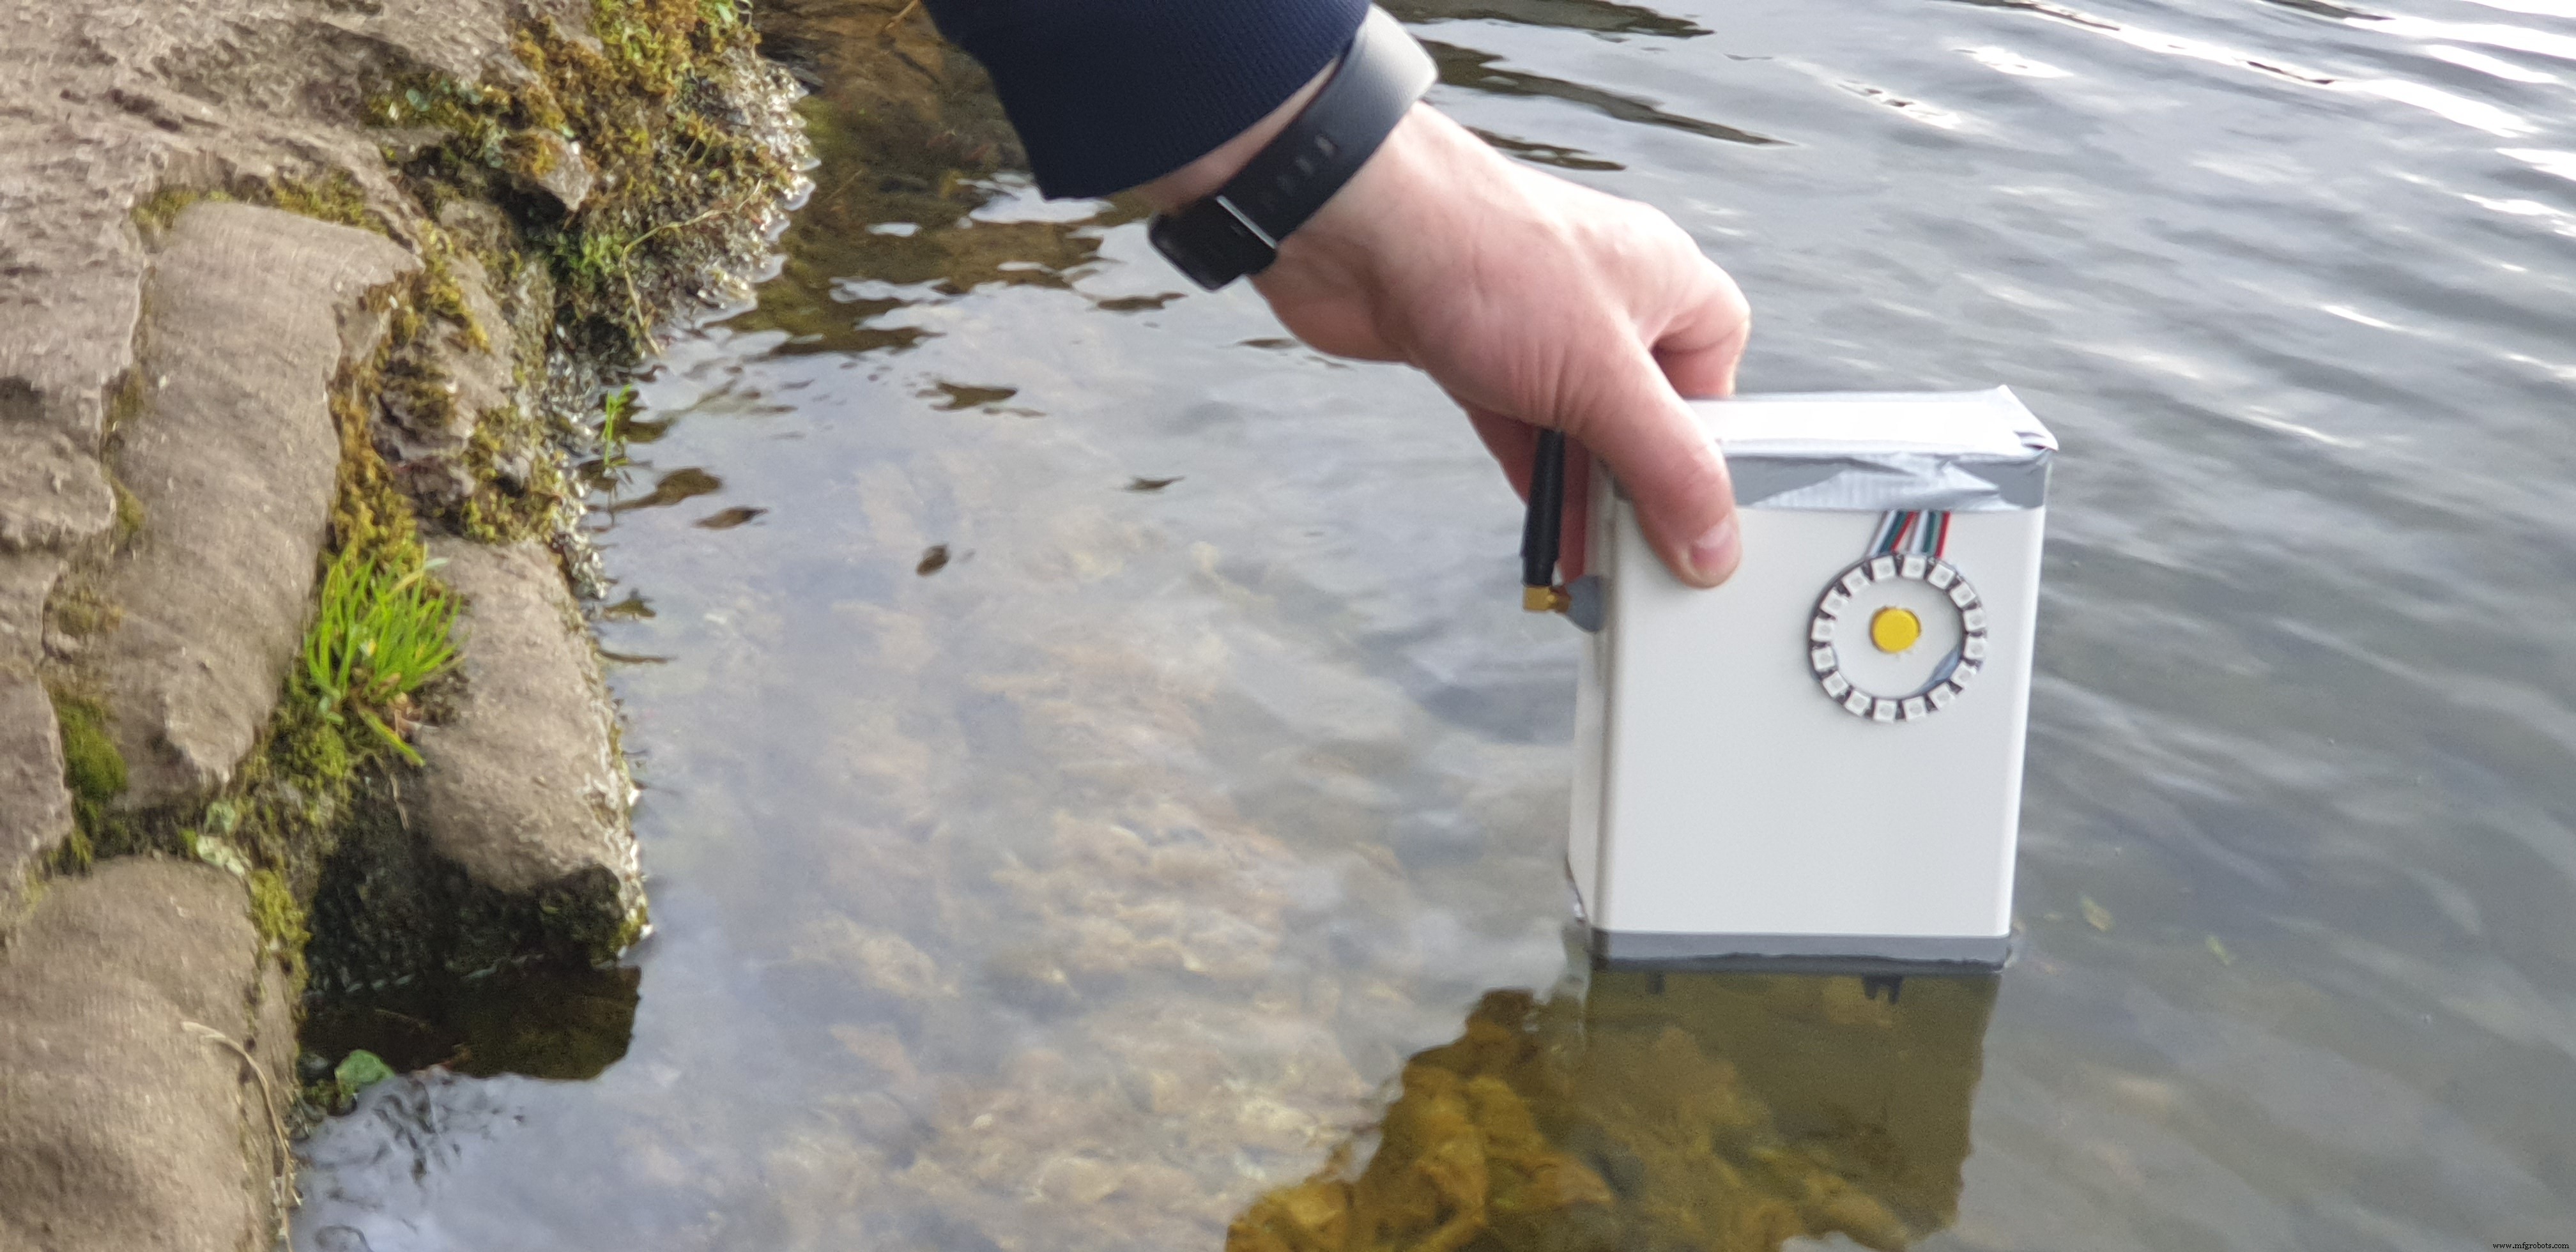
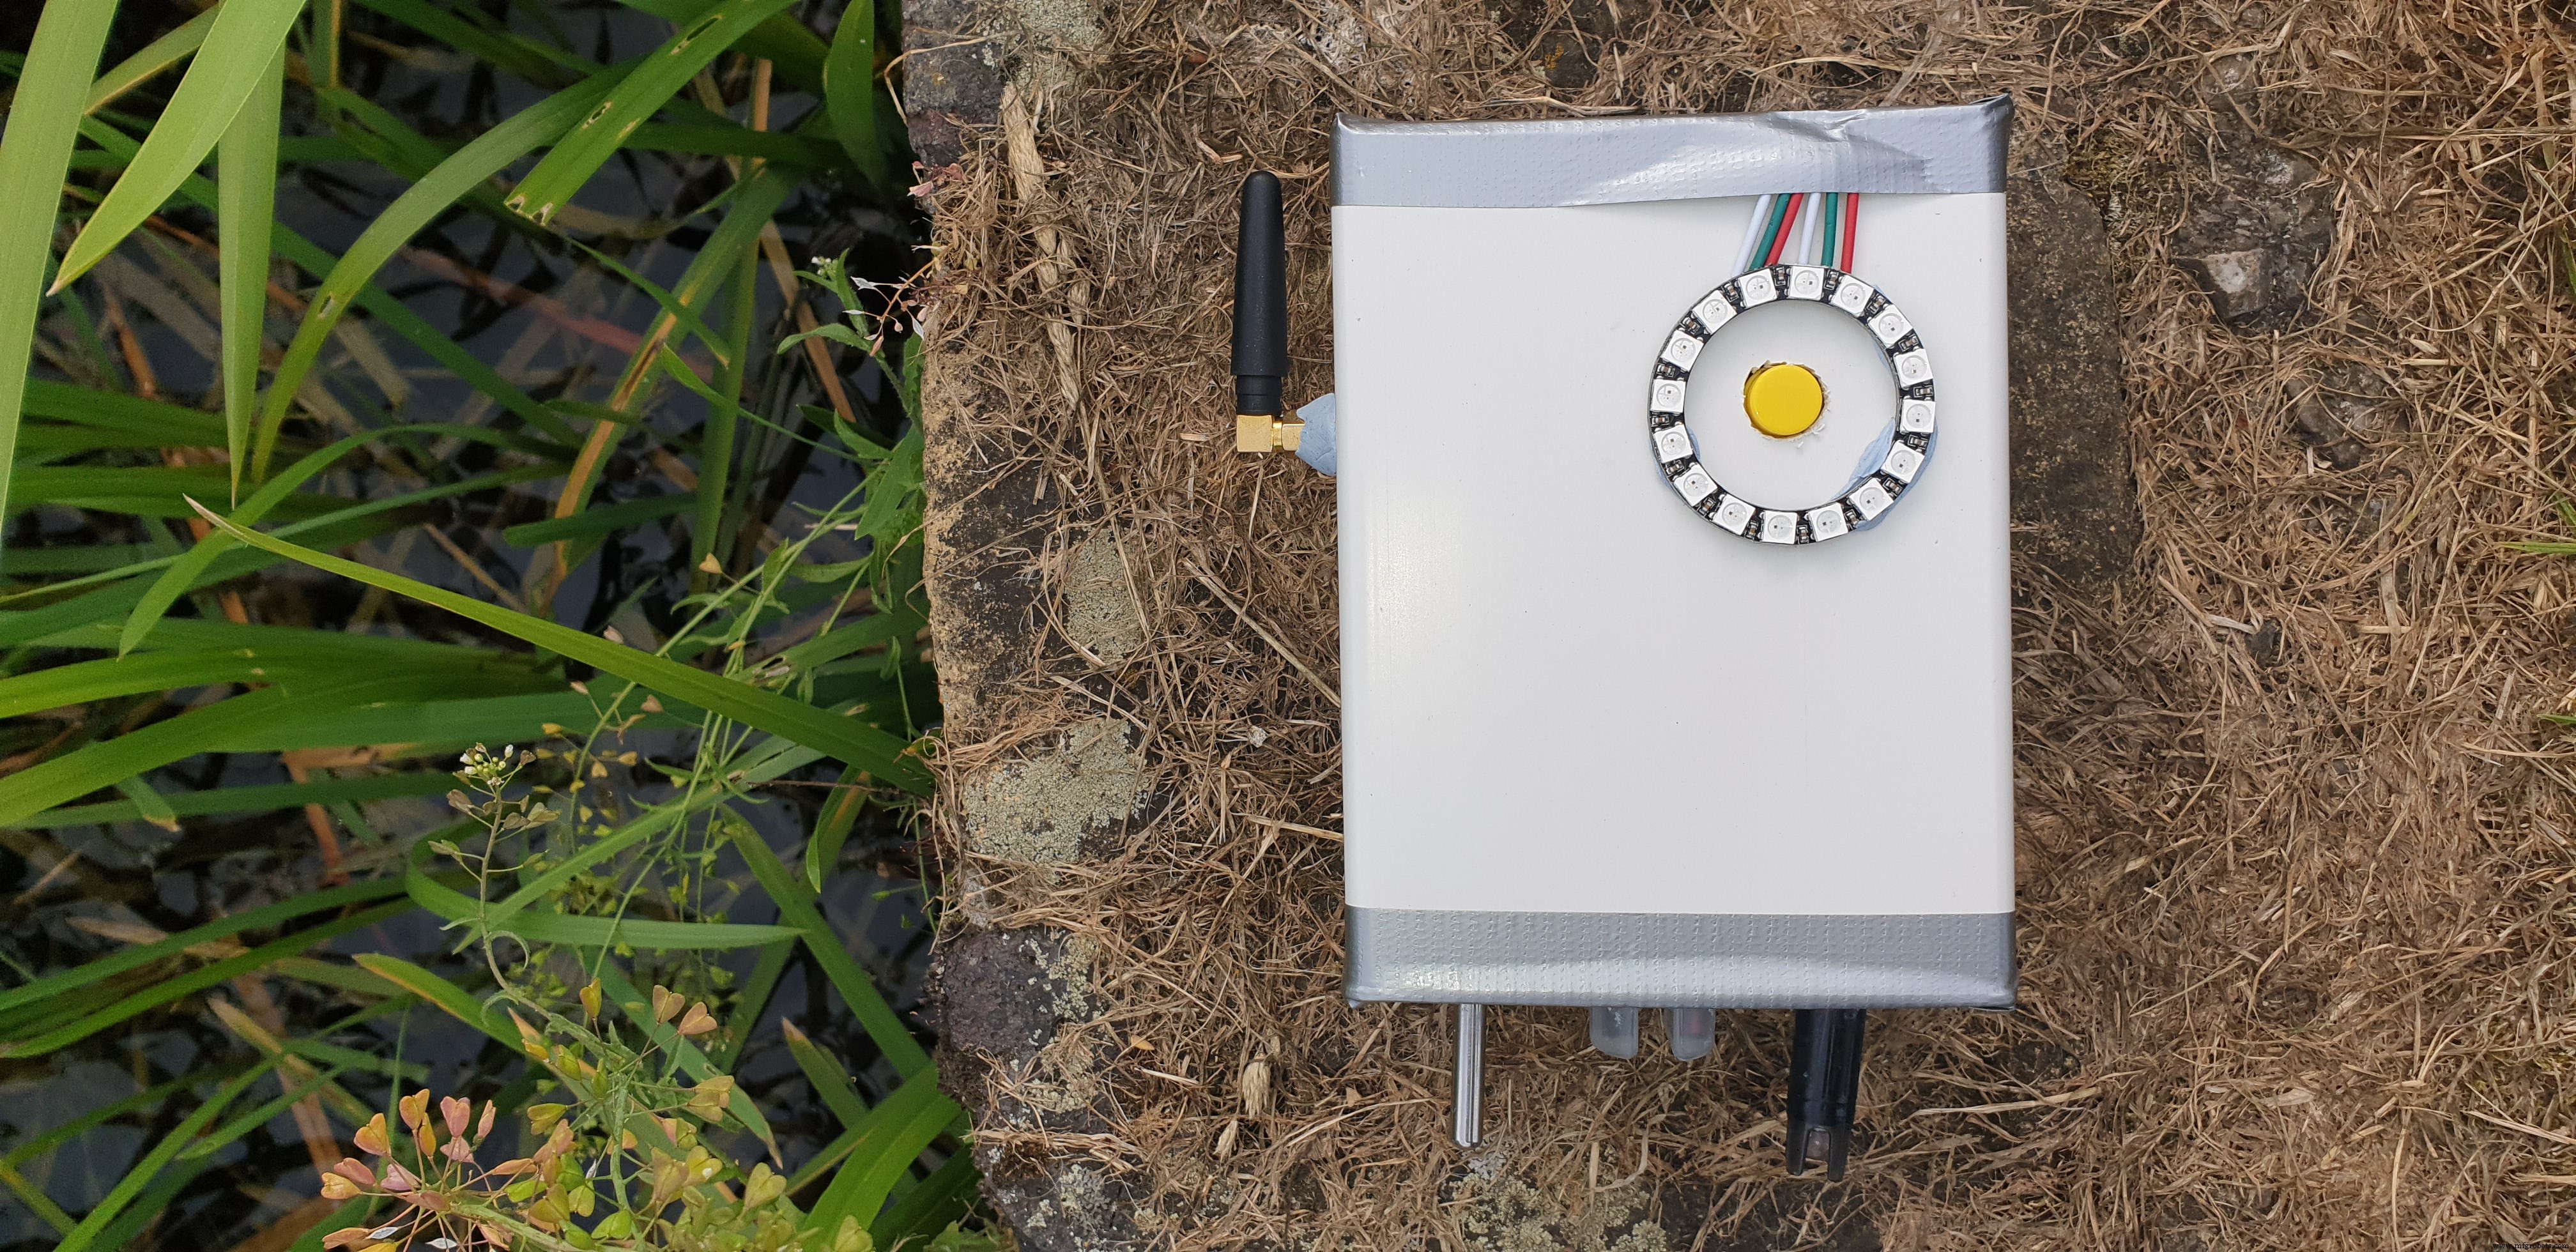
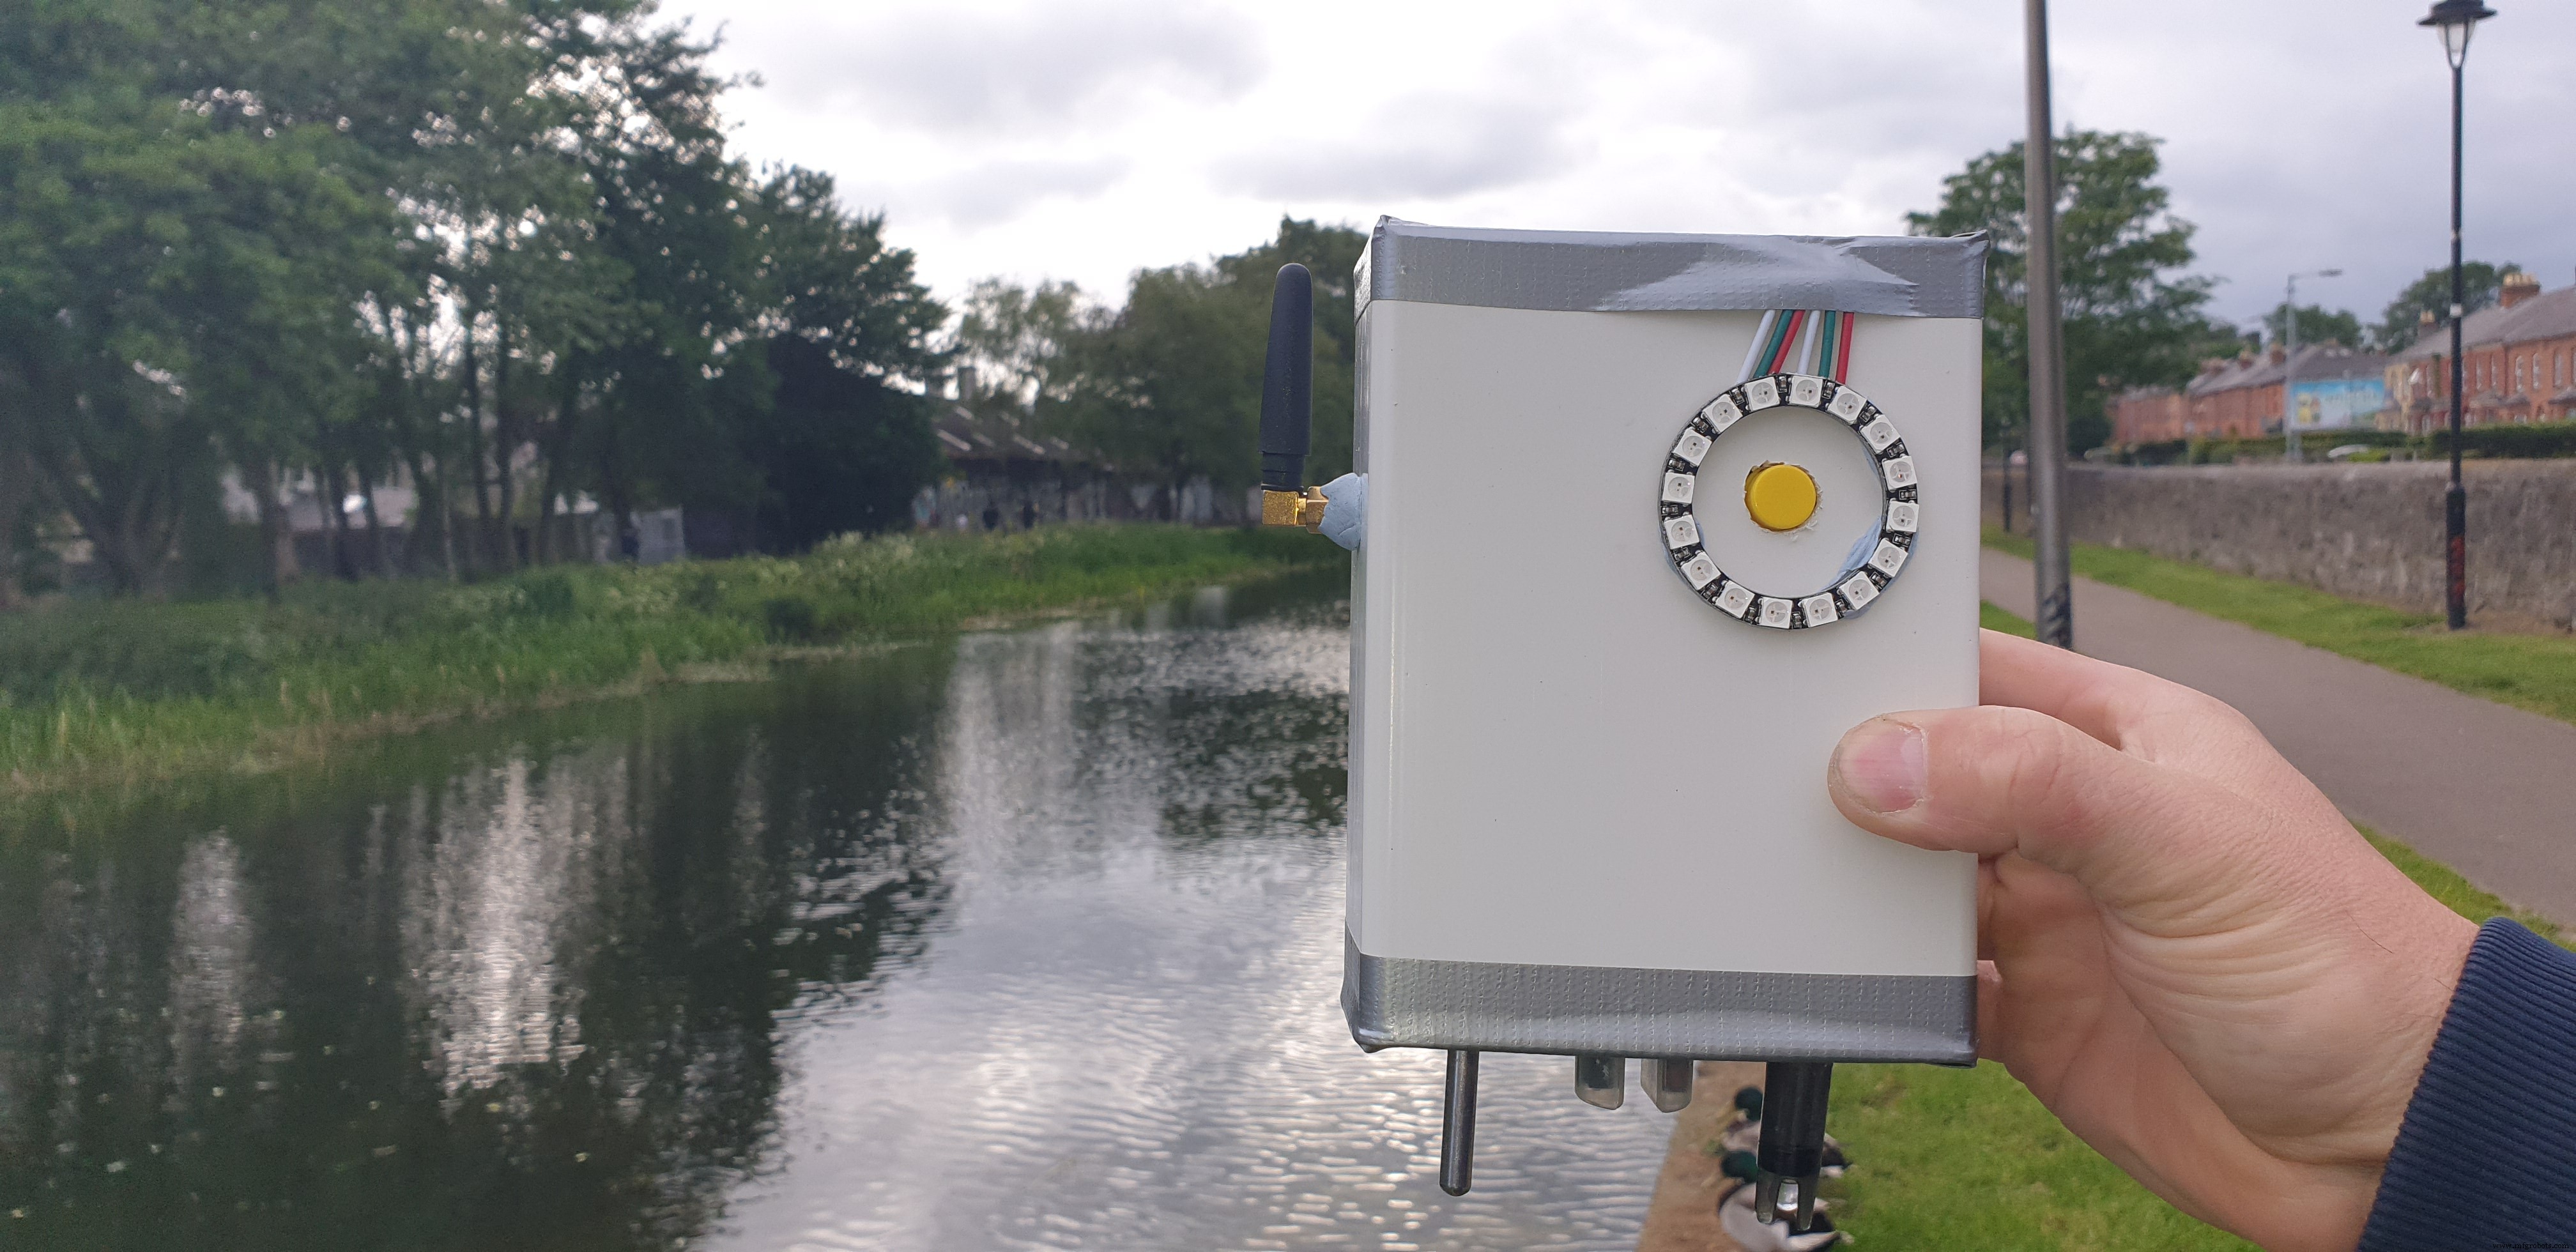
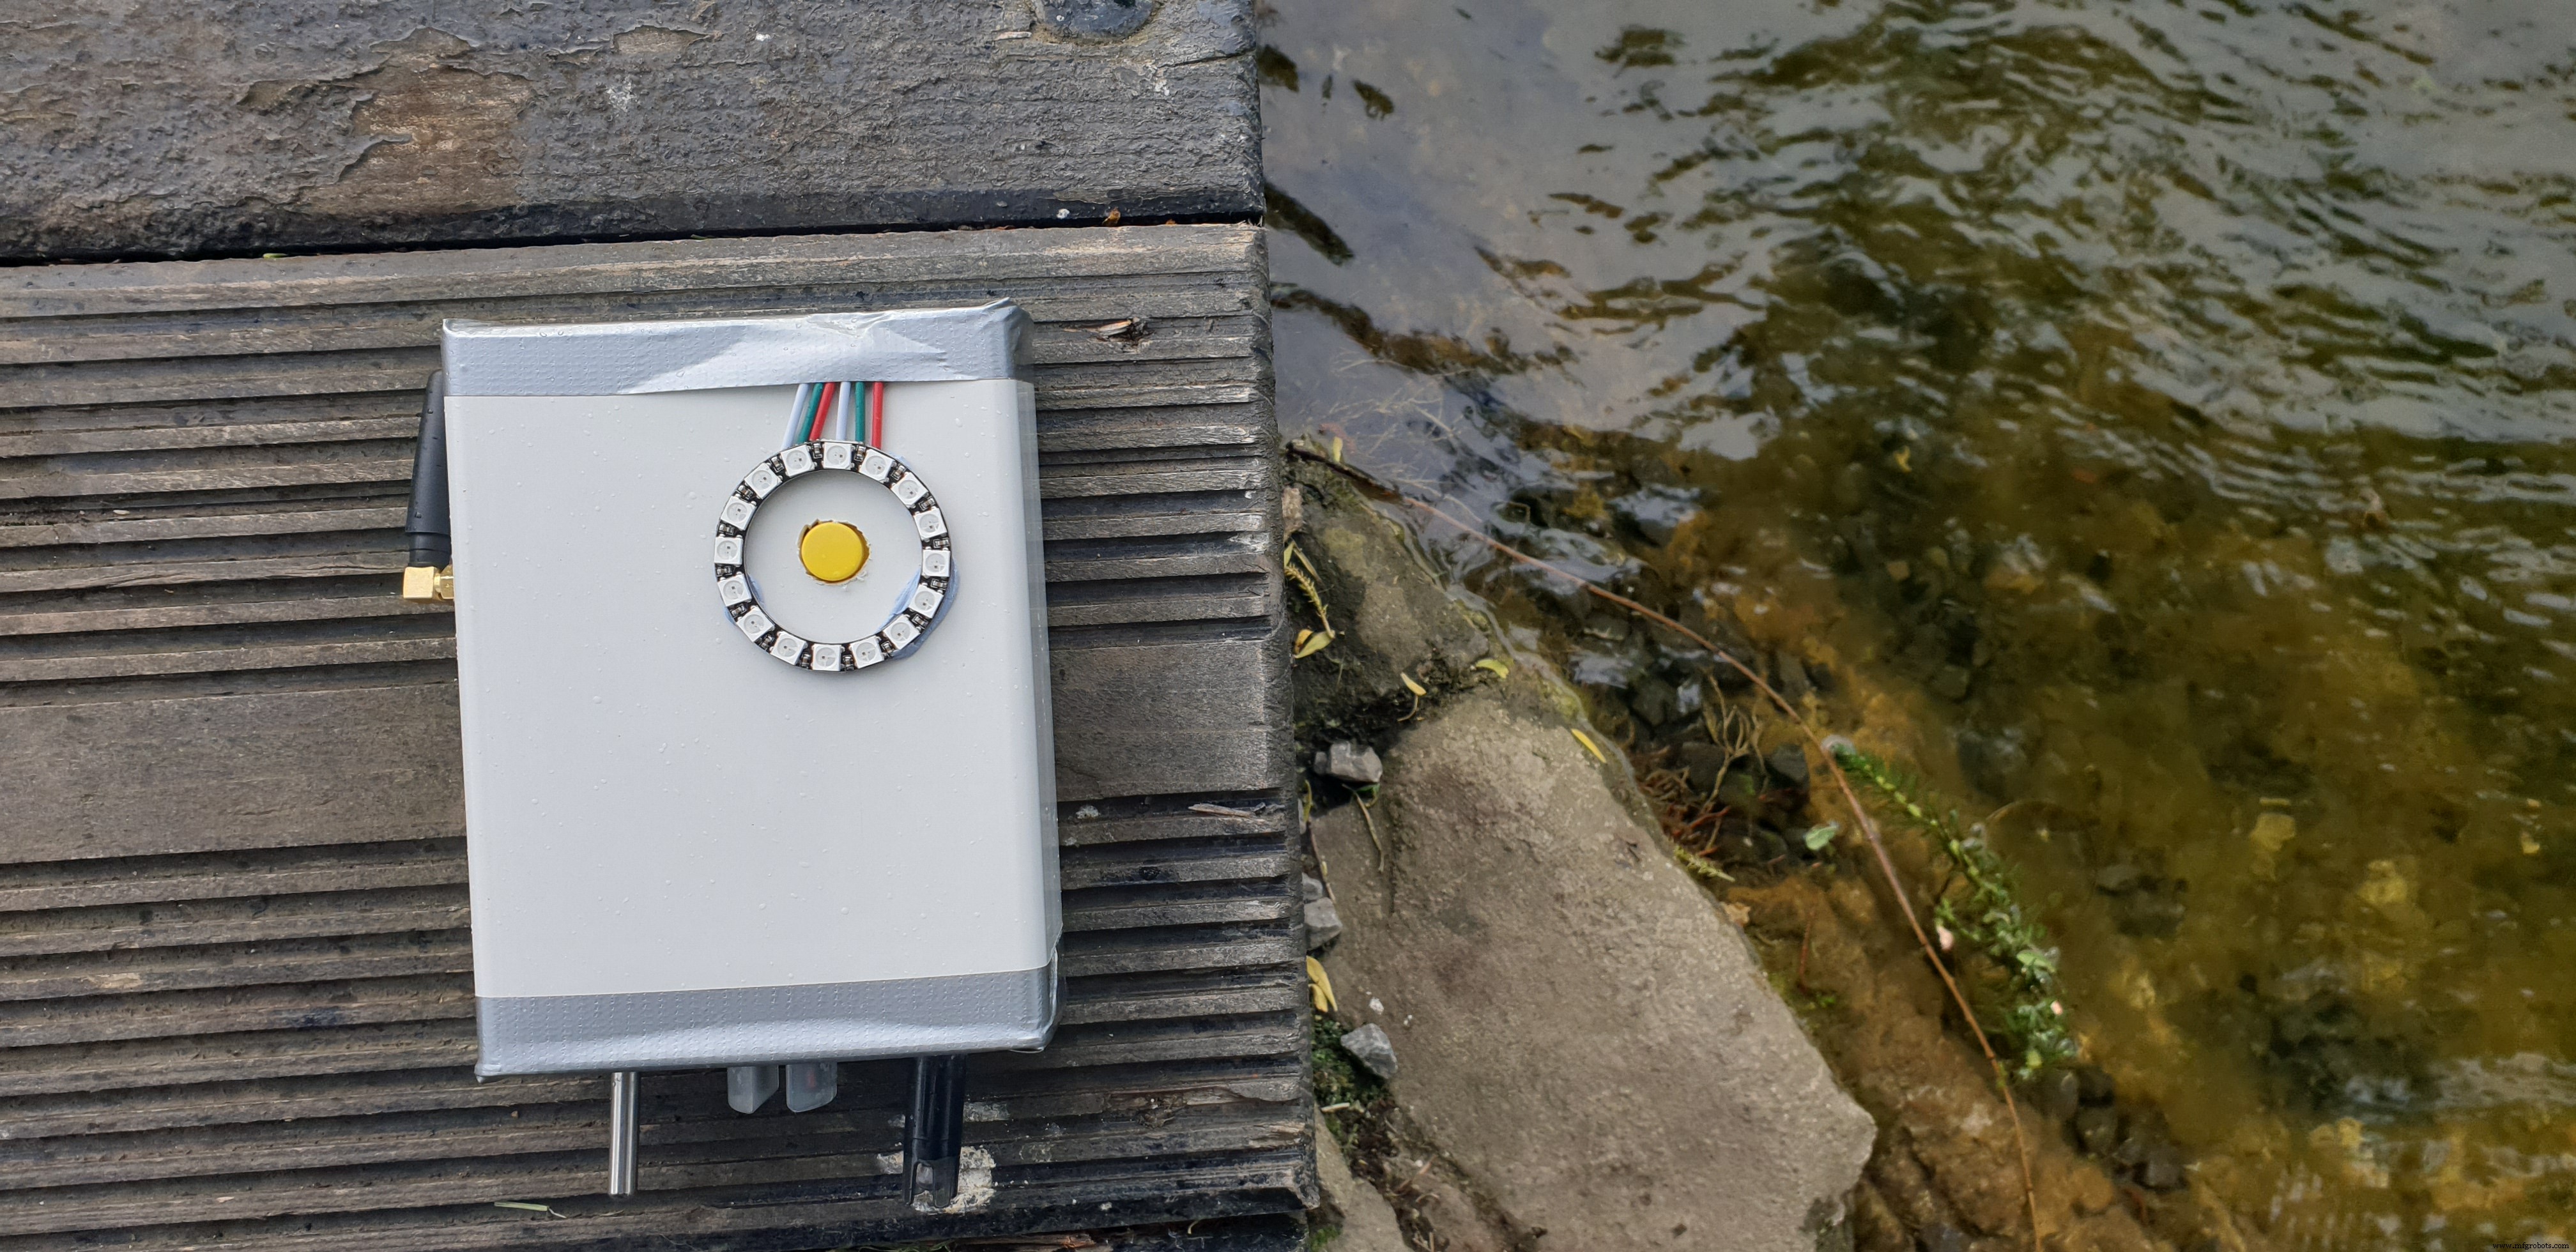
该设备还提供便携式版本。在这个版本中,个人可以随身携带设备,当他们想要采集水样时,他们按下设备上的按钮并将其放入水中 30 秒。然后,这些数据将显示在在线仪表板上。
通过收集水温、pH 值和湿度以及大气温度和湿度,WaterAid 配备了监测河流污染所需的所有传感器。
视频
图片


功能
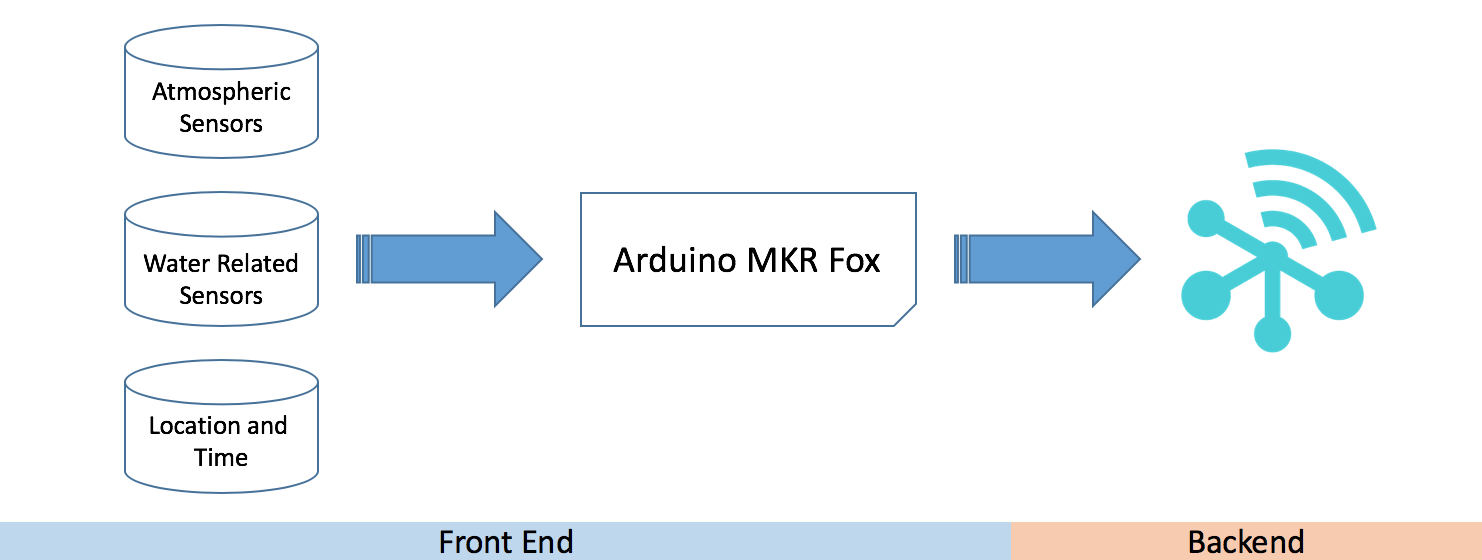
借助 Soracom 的云,WaterAid 允许用户、公司或个人安全、准确地收集数据并将所有这些数据集中在一个地方。项目由前端和后端组成。
正面 结束
该项目的前端是用于收集数据并将其发送到云端的物理设备。该设备可以设置为模式 1 或 2。在模式 1 中,设备只需按一下按钮即可记录一组数据,这对于偶尔监测水体非常有用。模式 2 设置设备以定义的时间间隔读取读数并将此数据推送到云端。
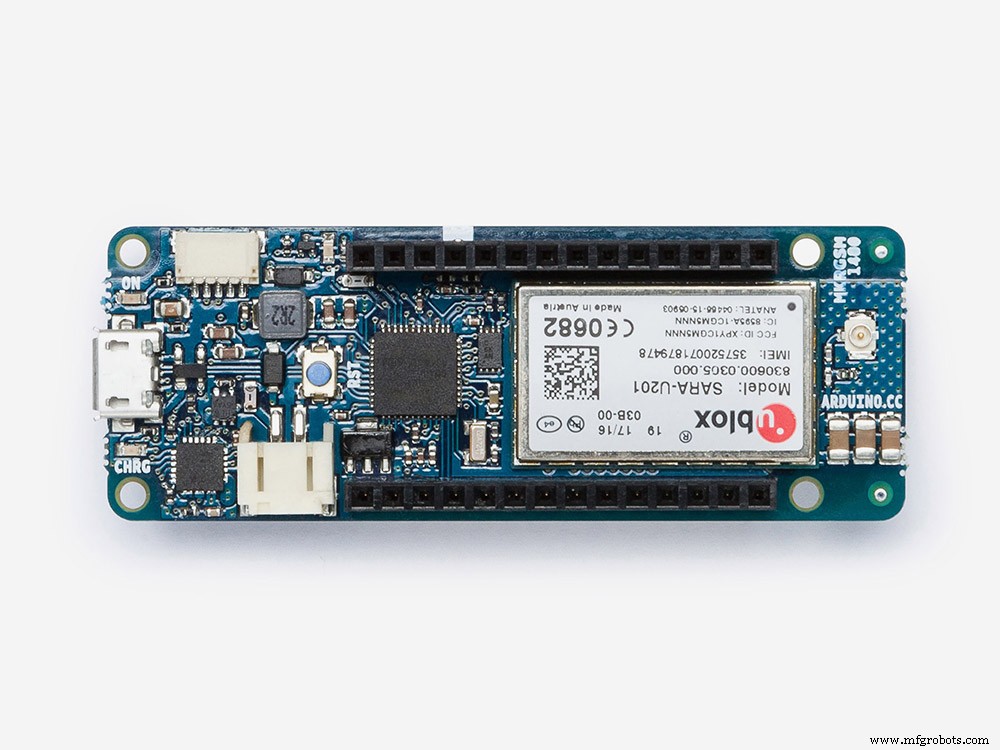
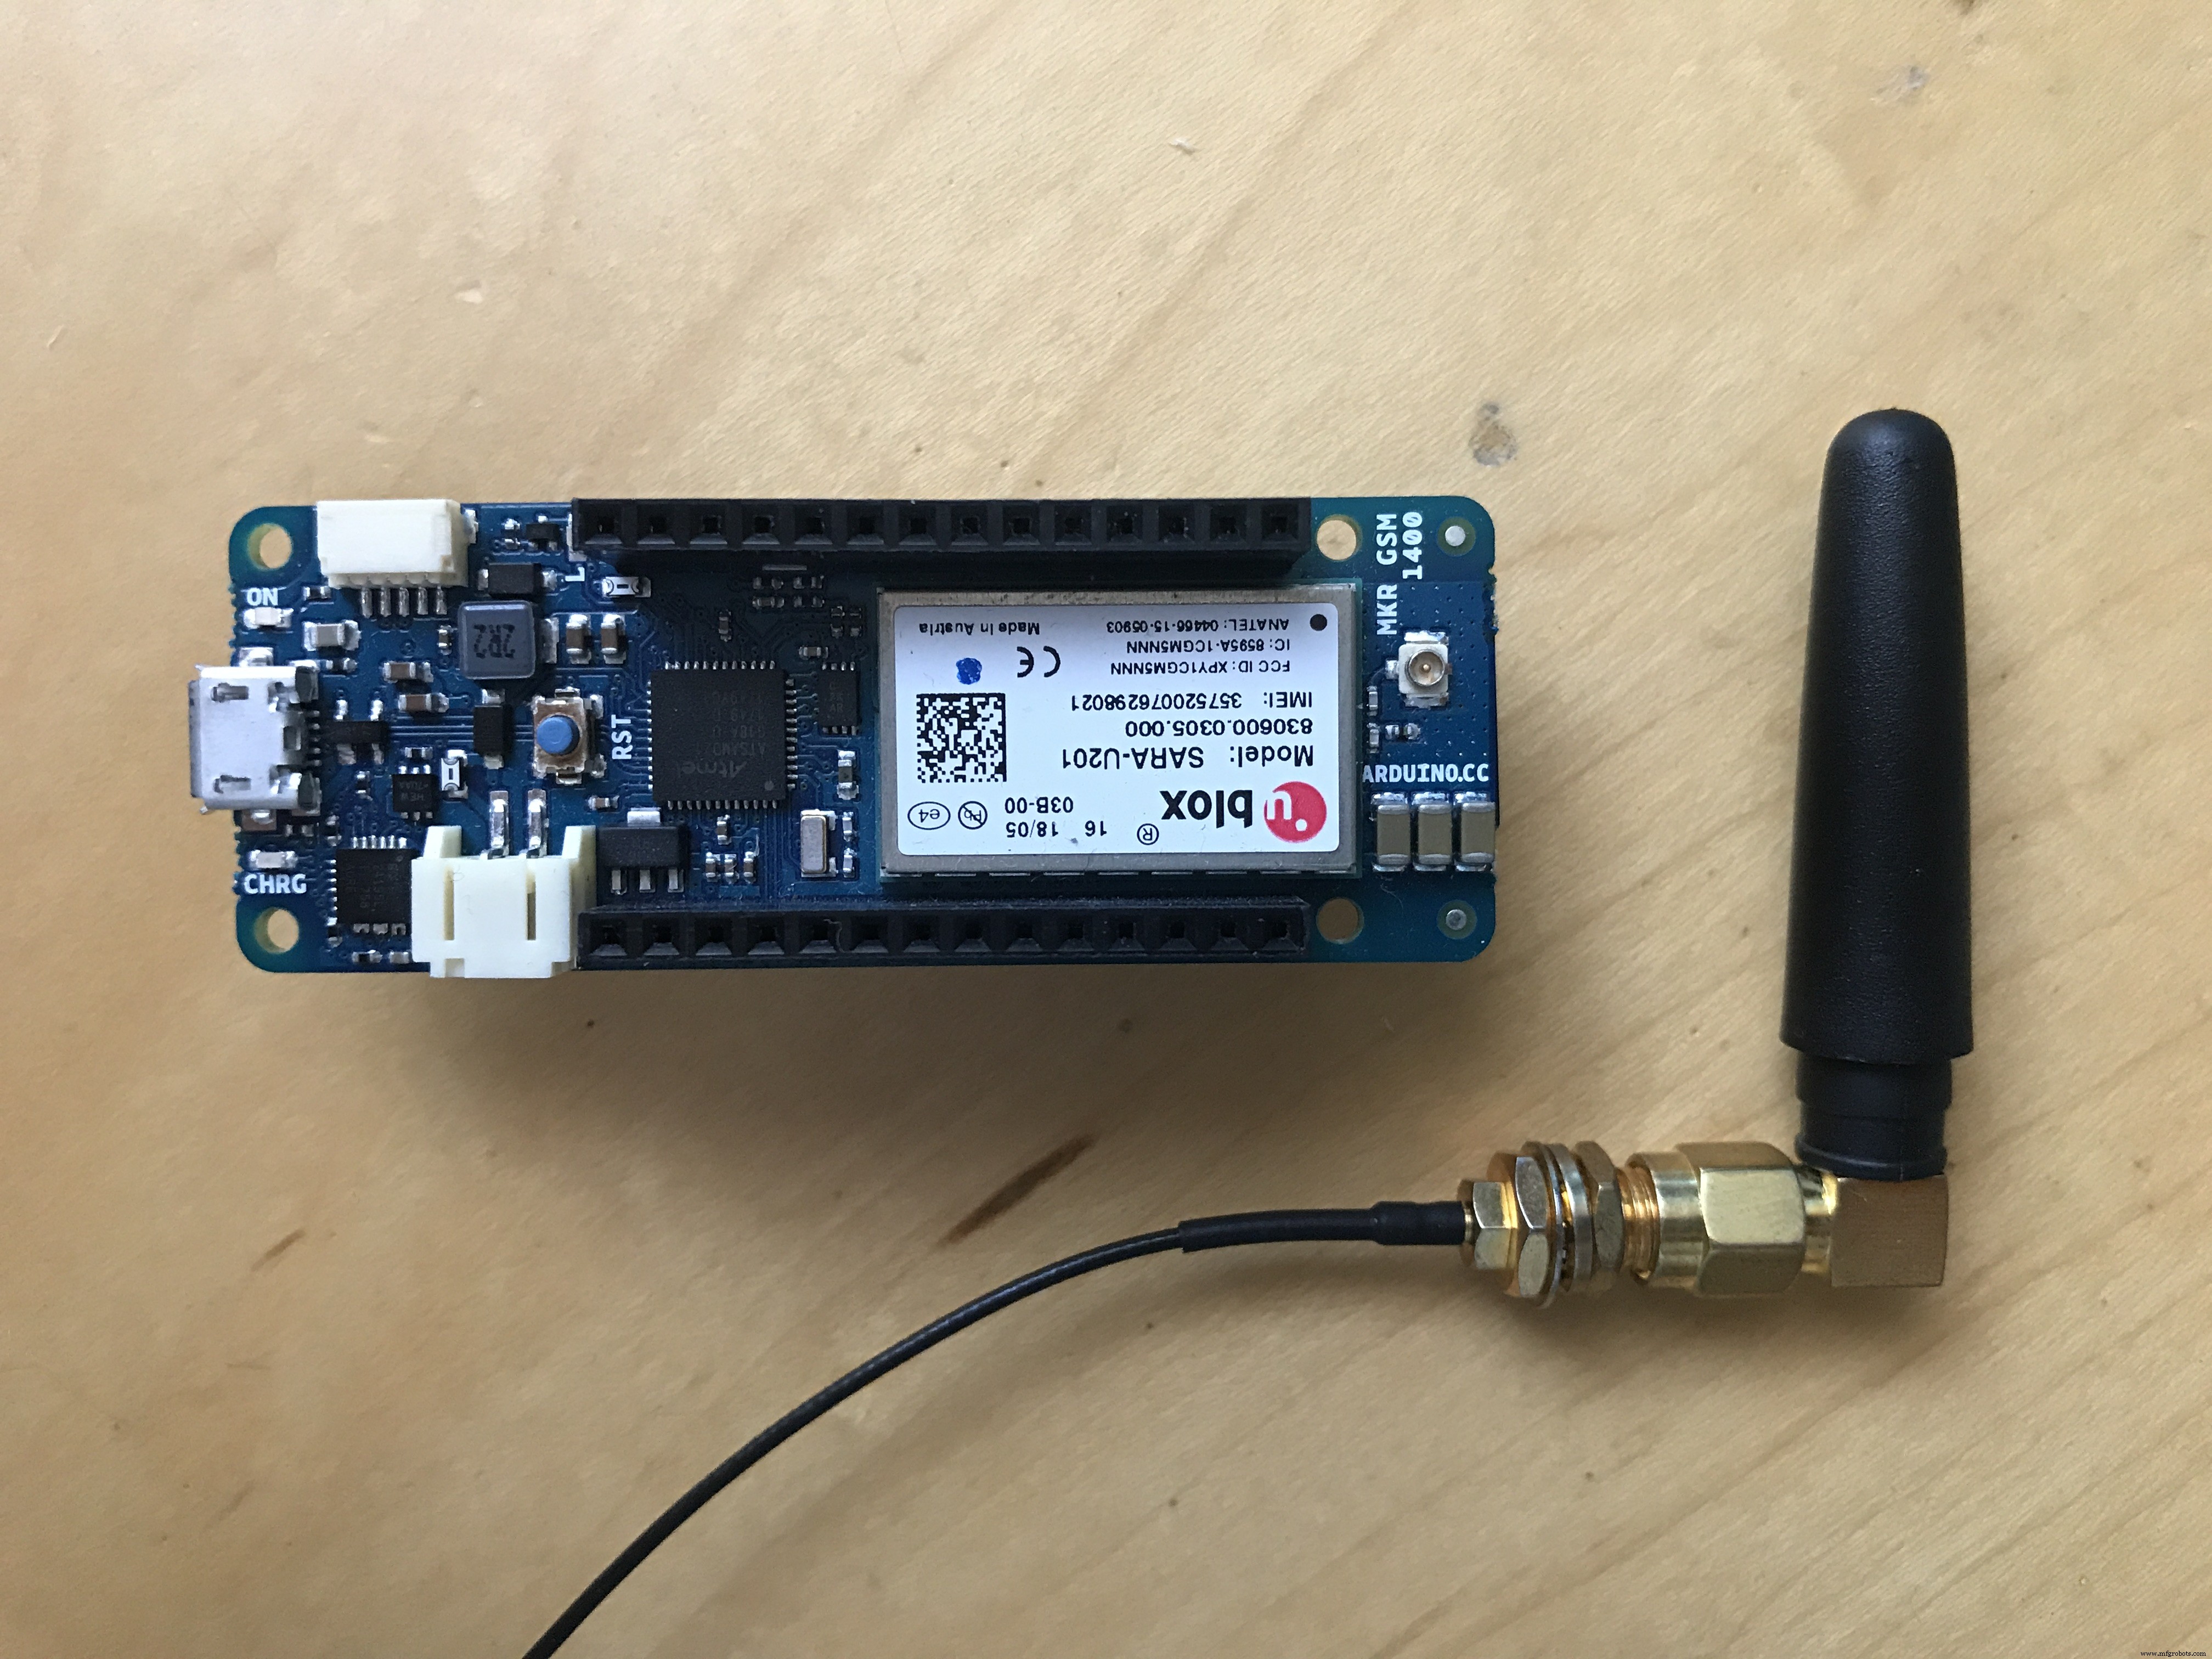
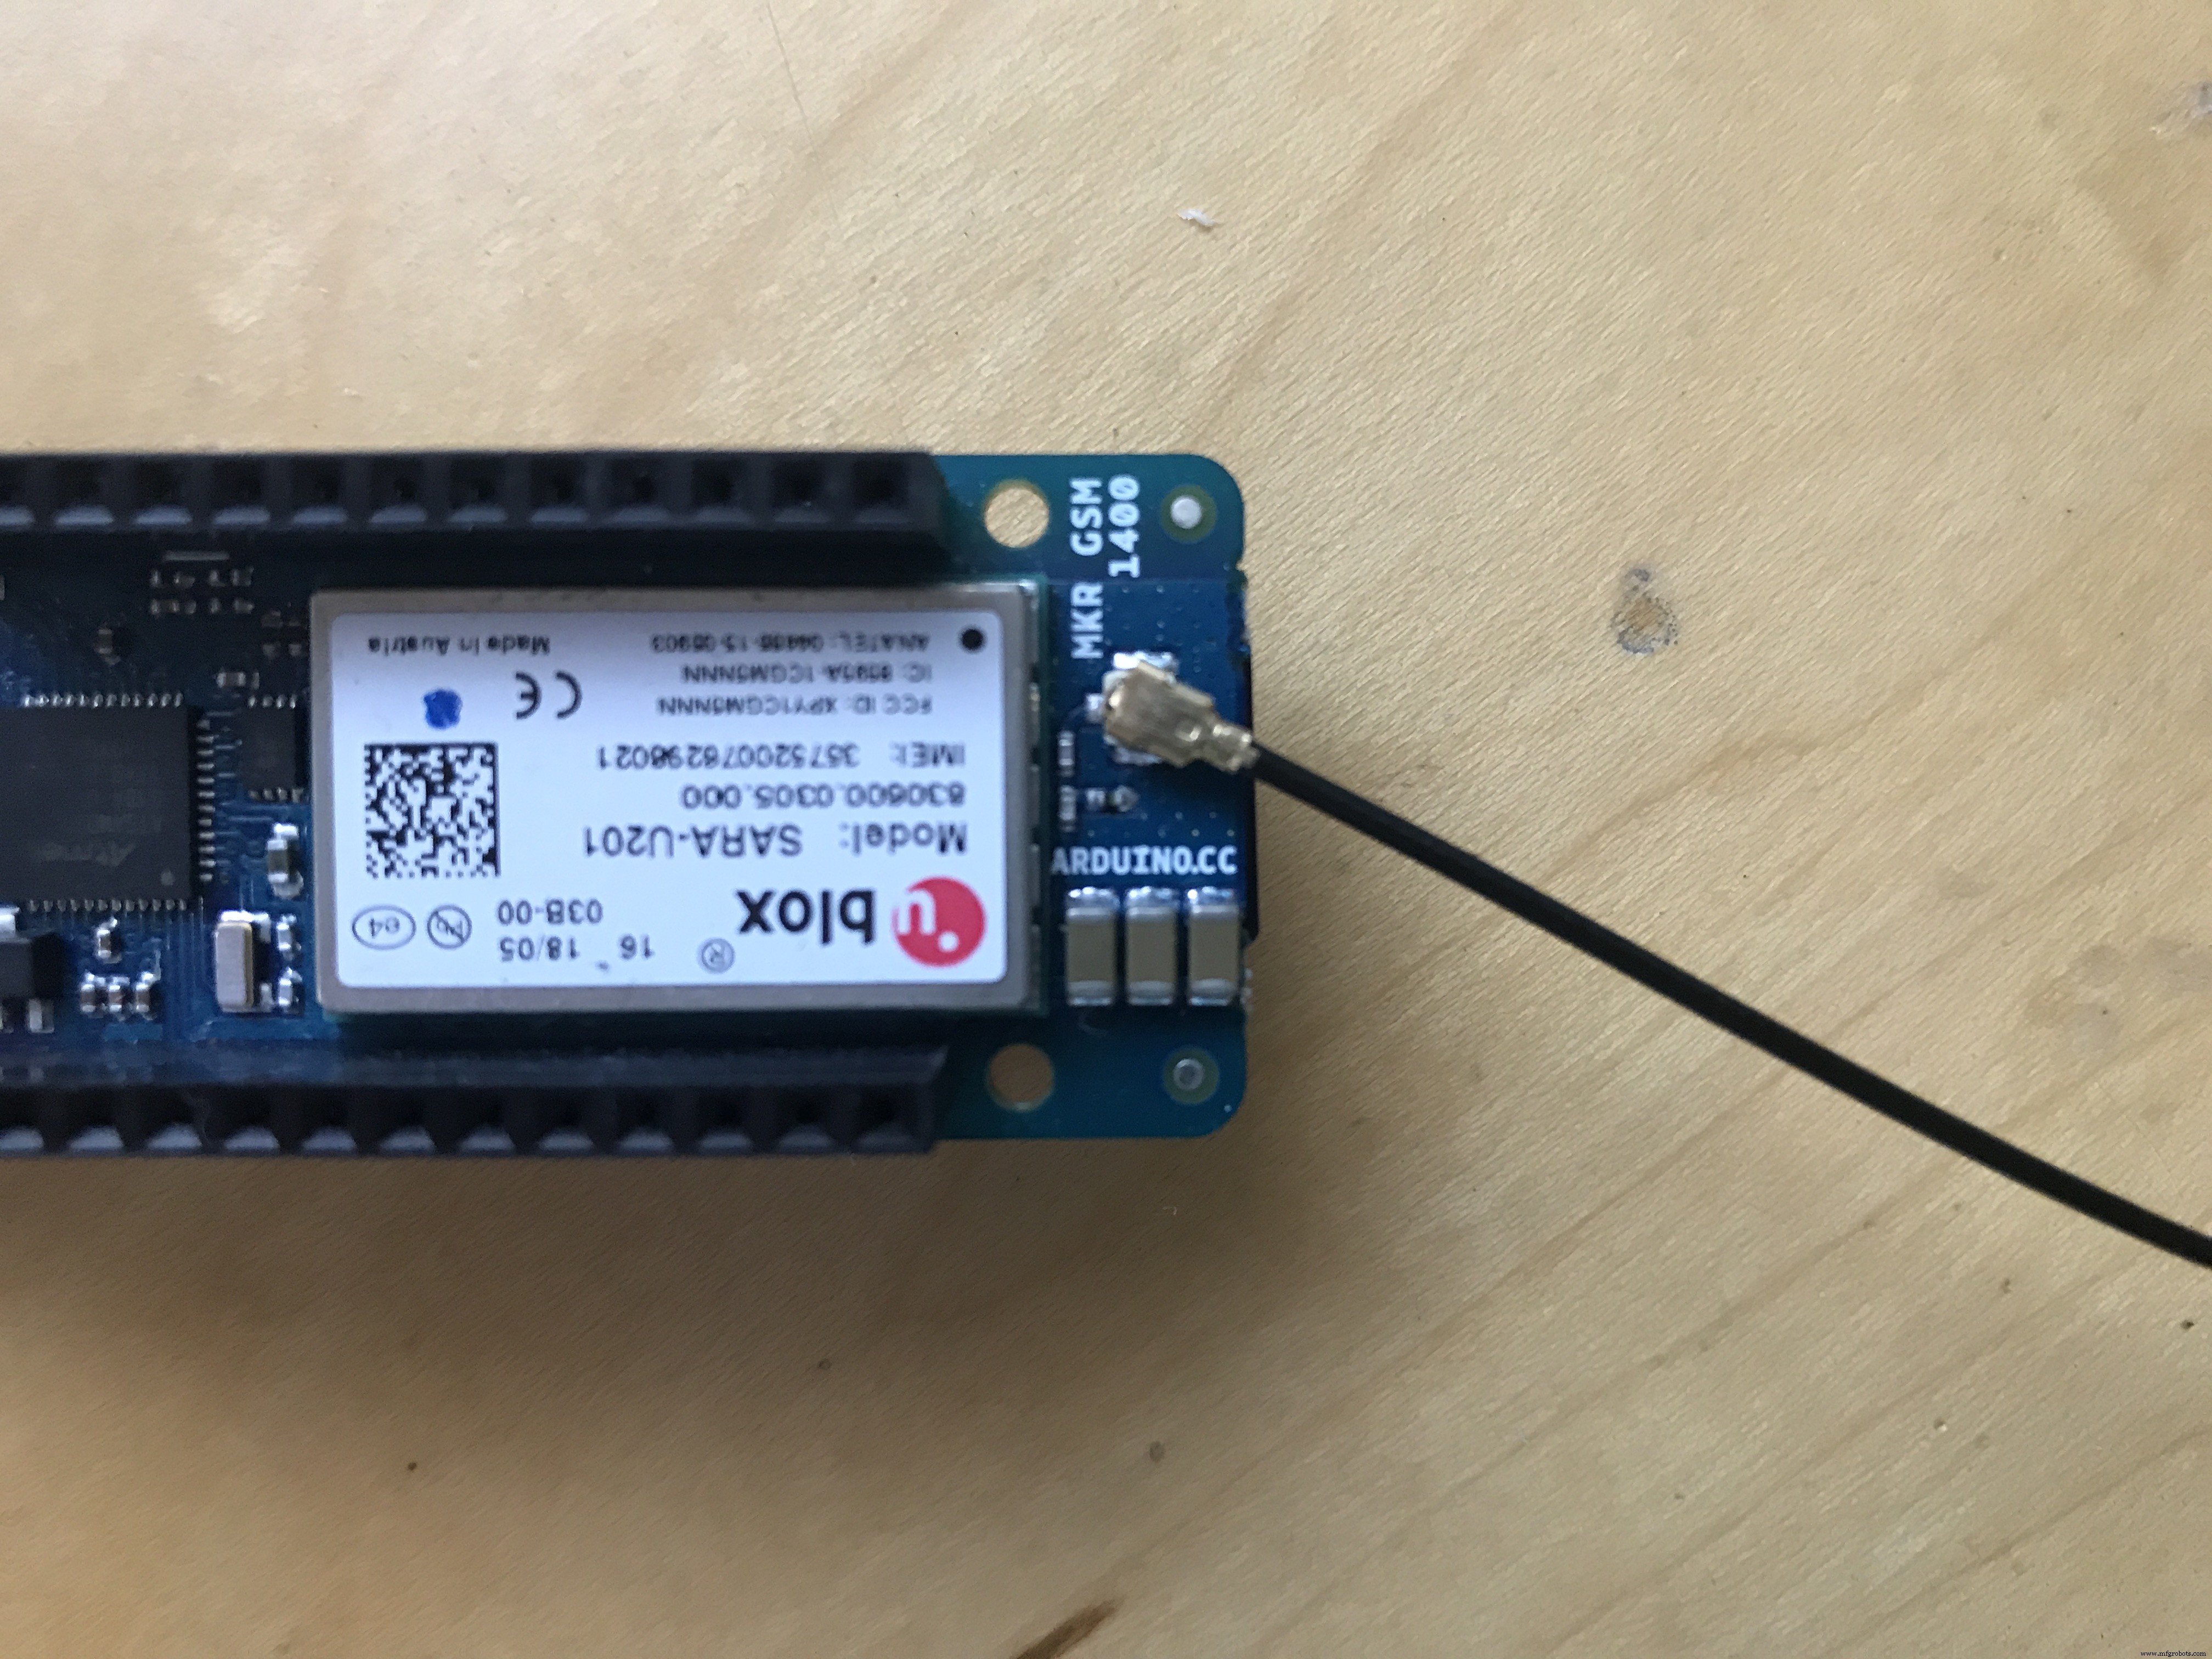
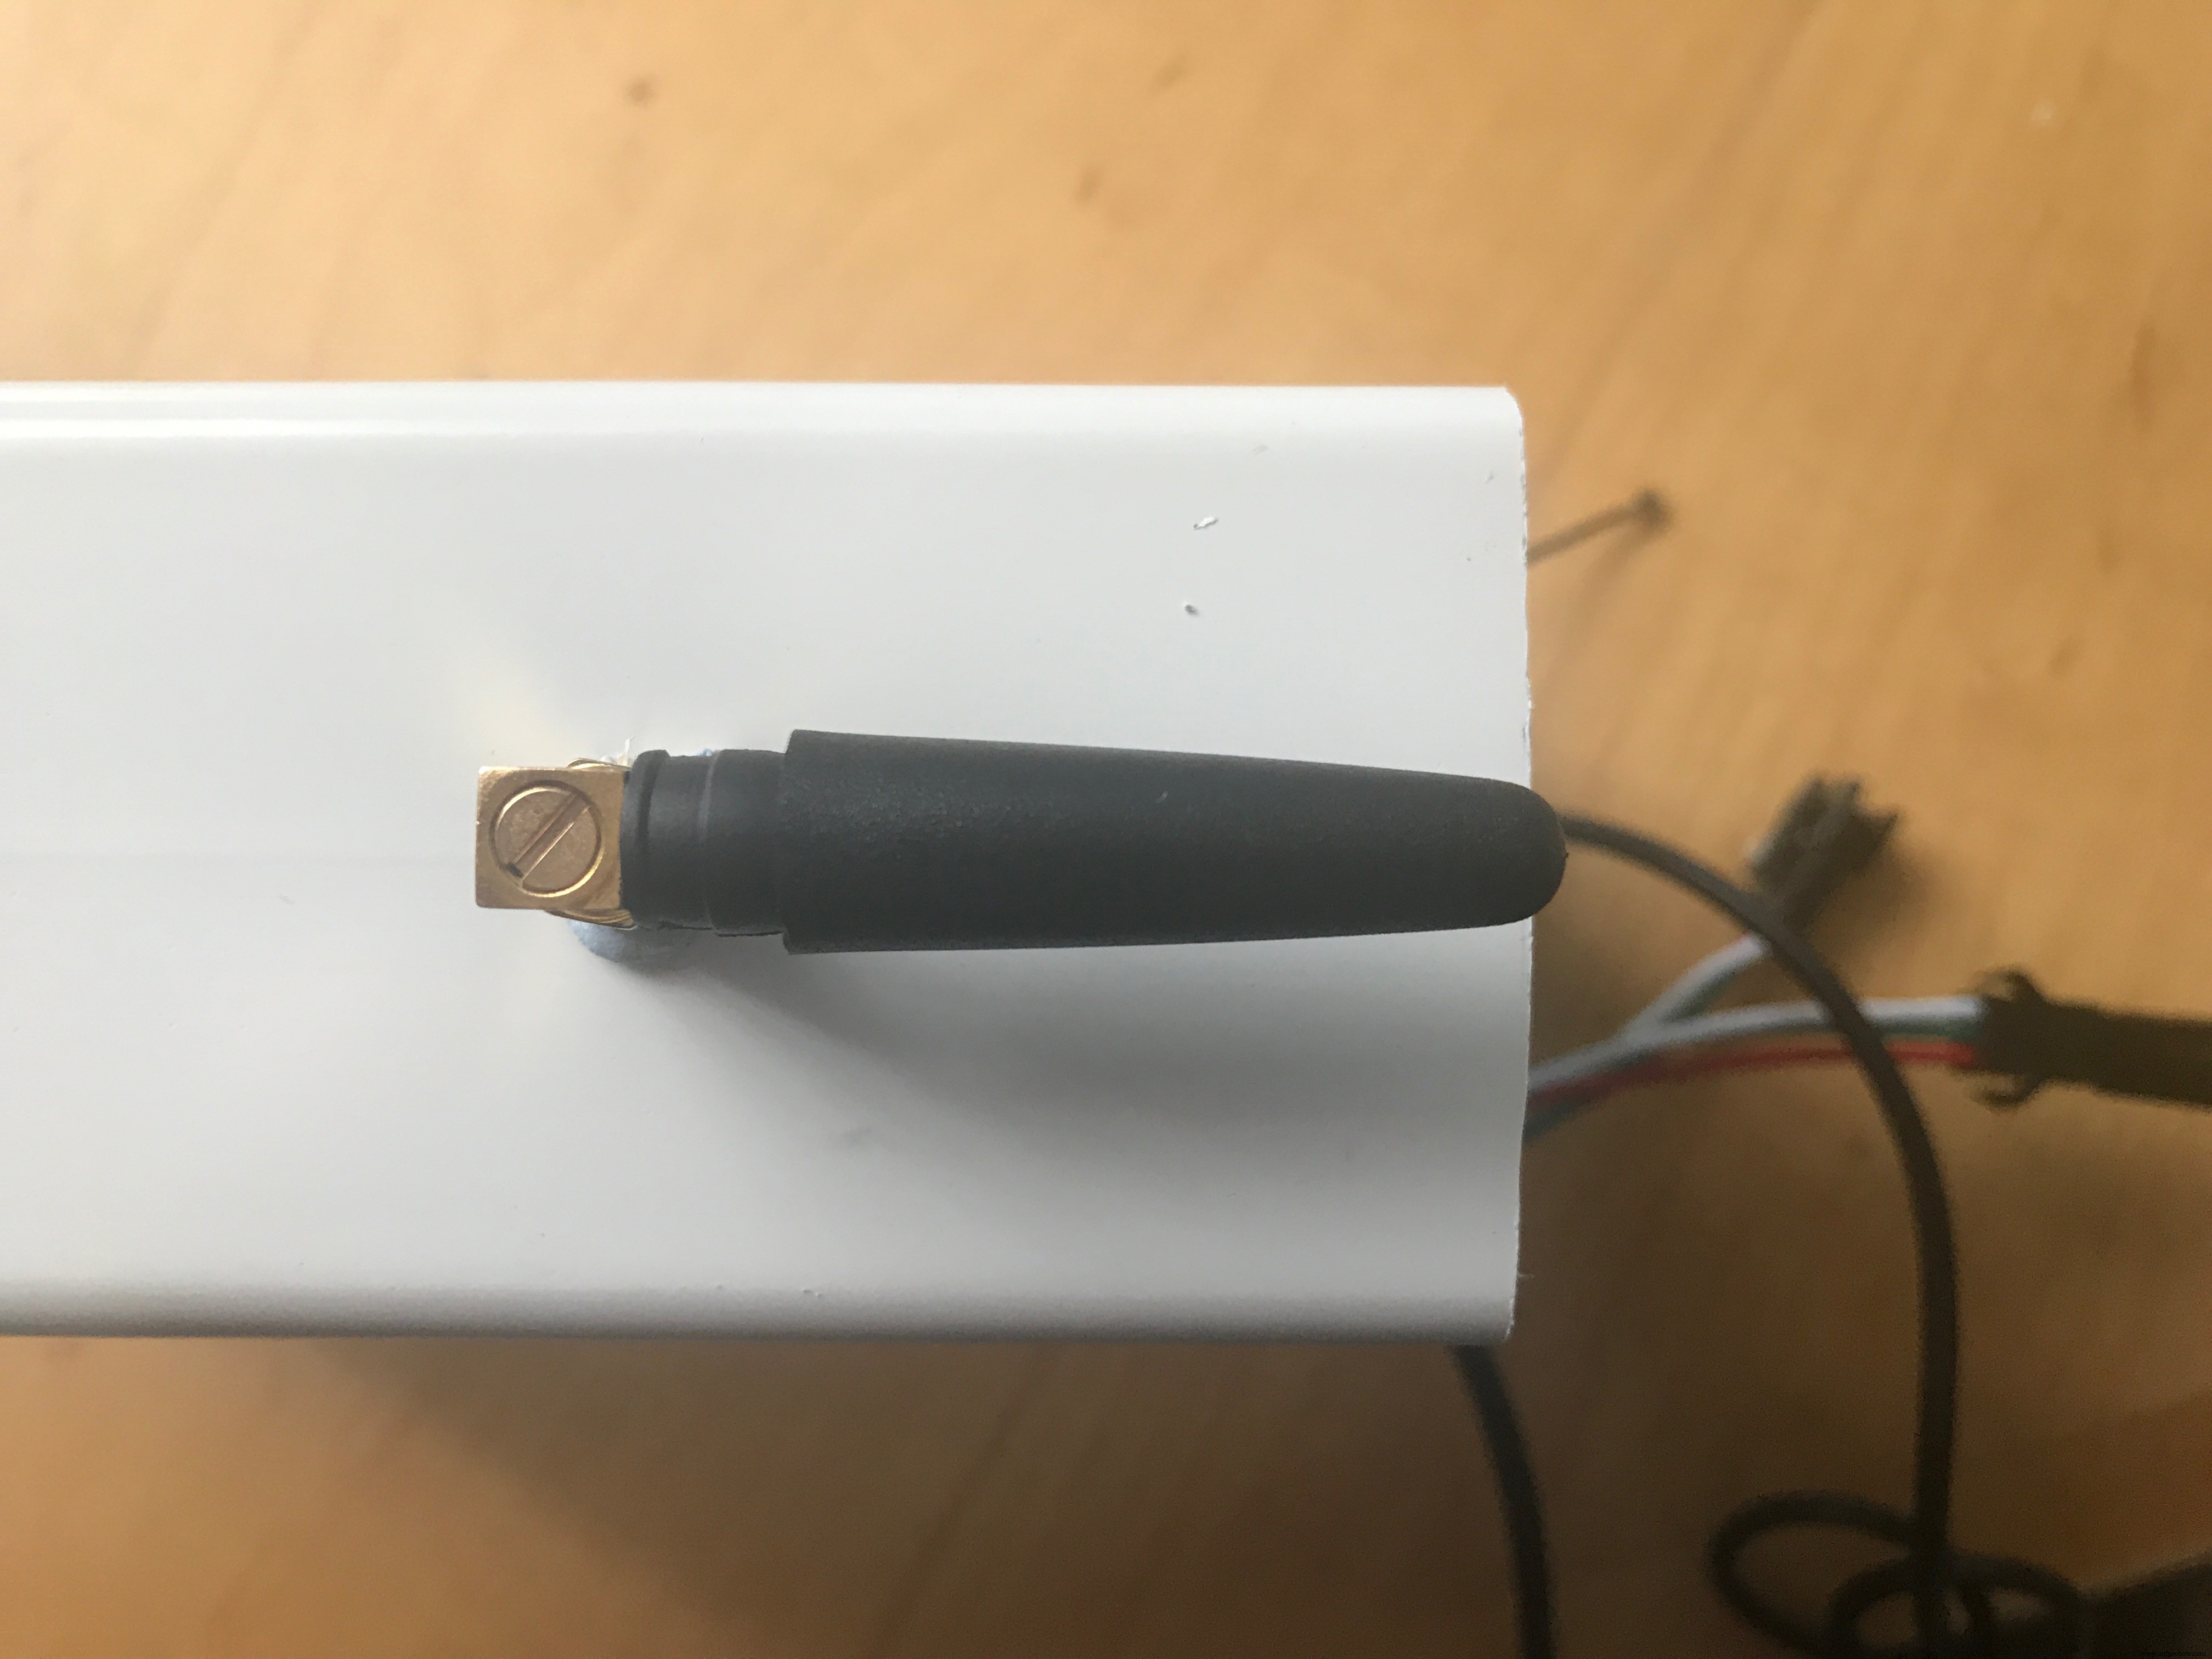
MKR GSM 用于前端,因为它易于使用且可靠。它还可以通过 GSM 访问 Soracom。以下是设备在收集数据时采取的步骤。
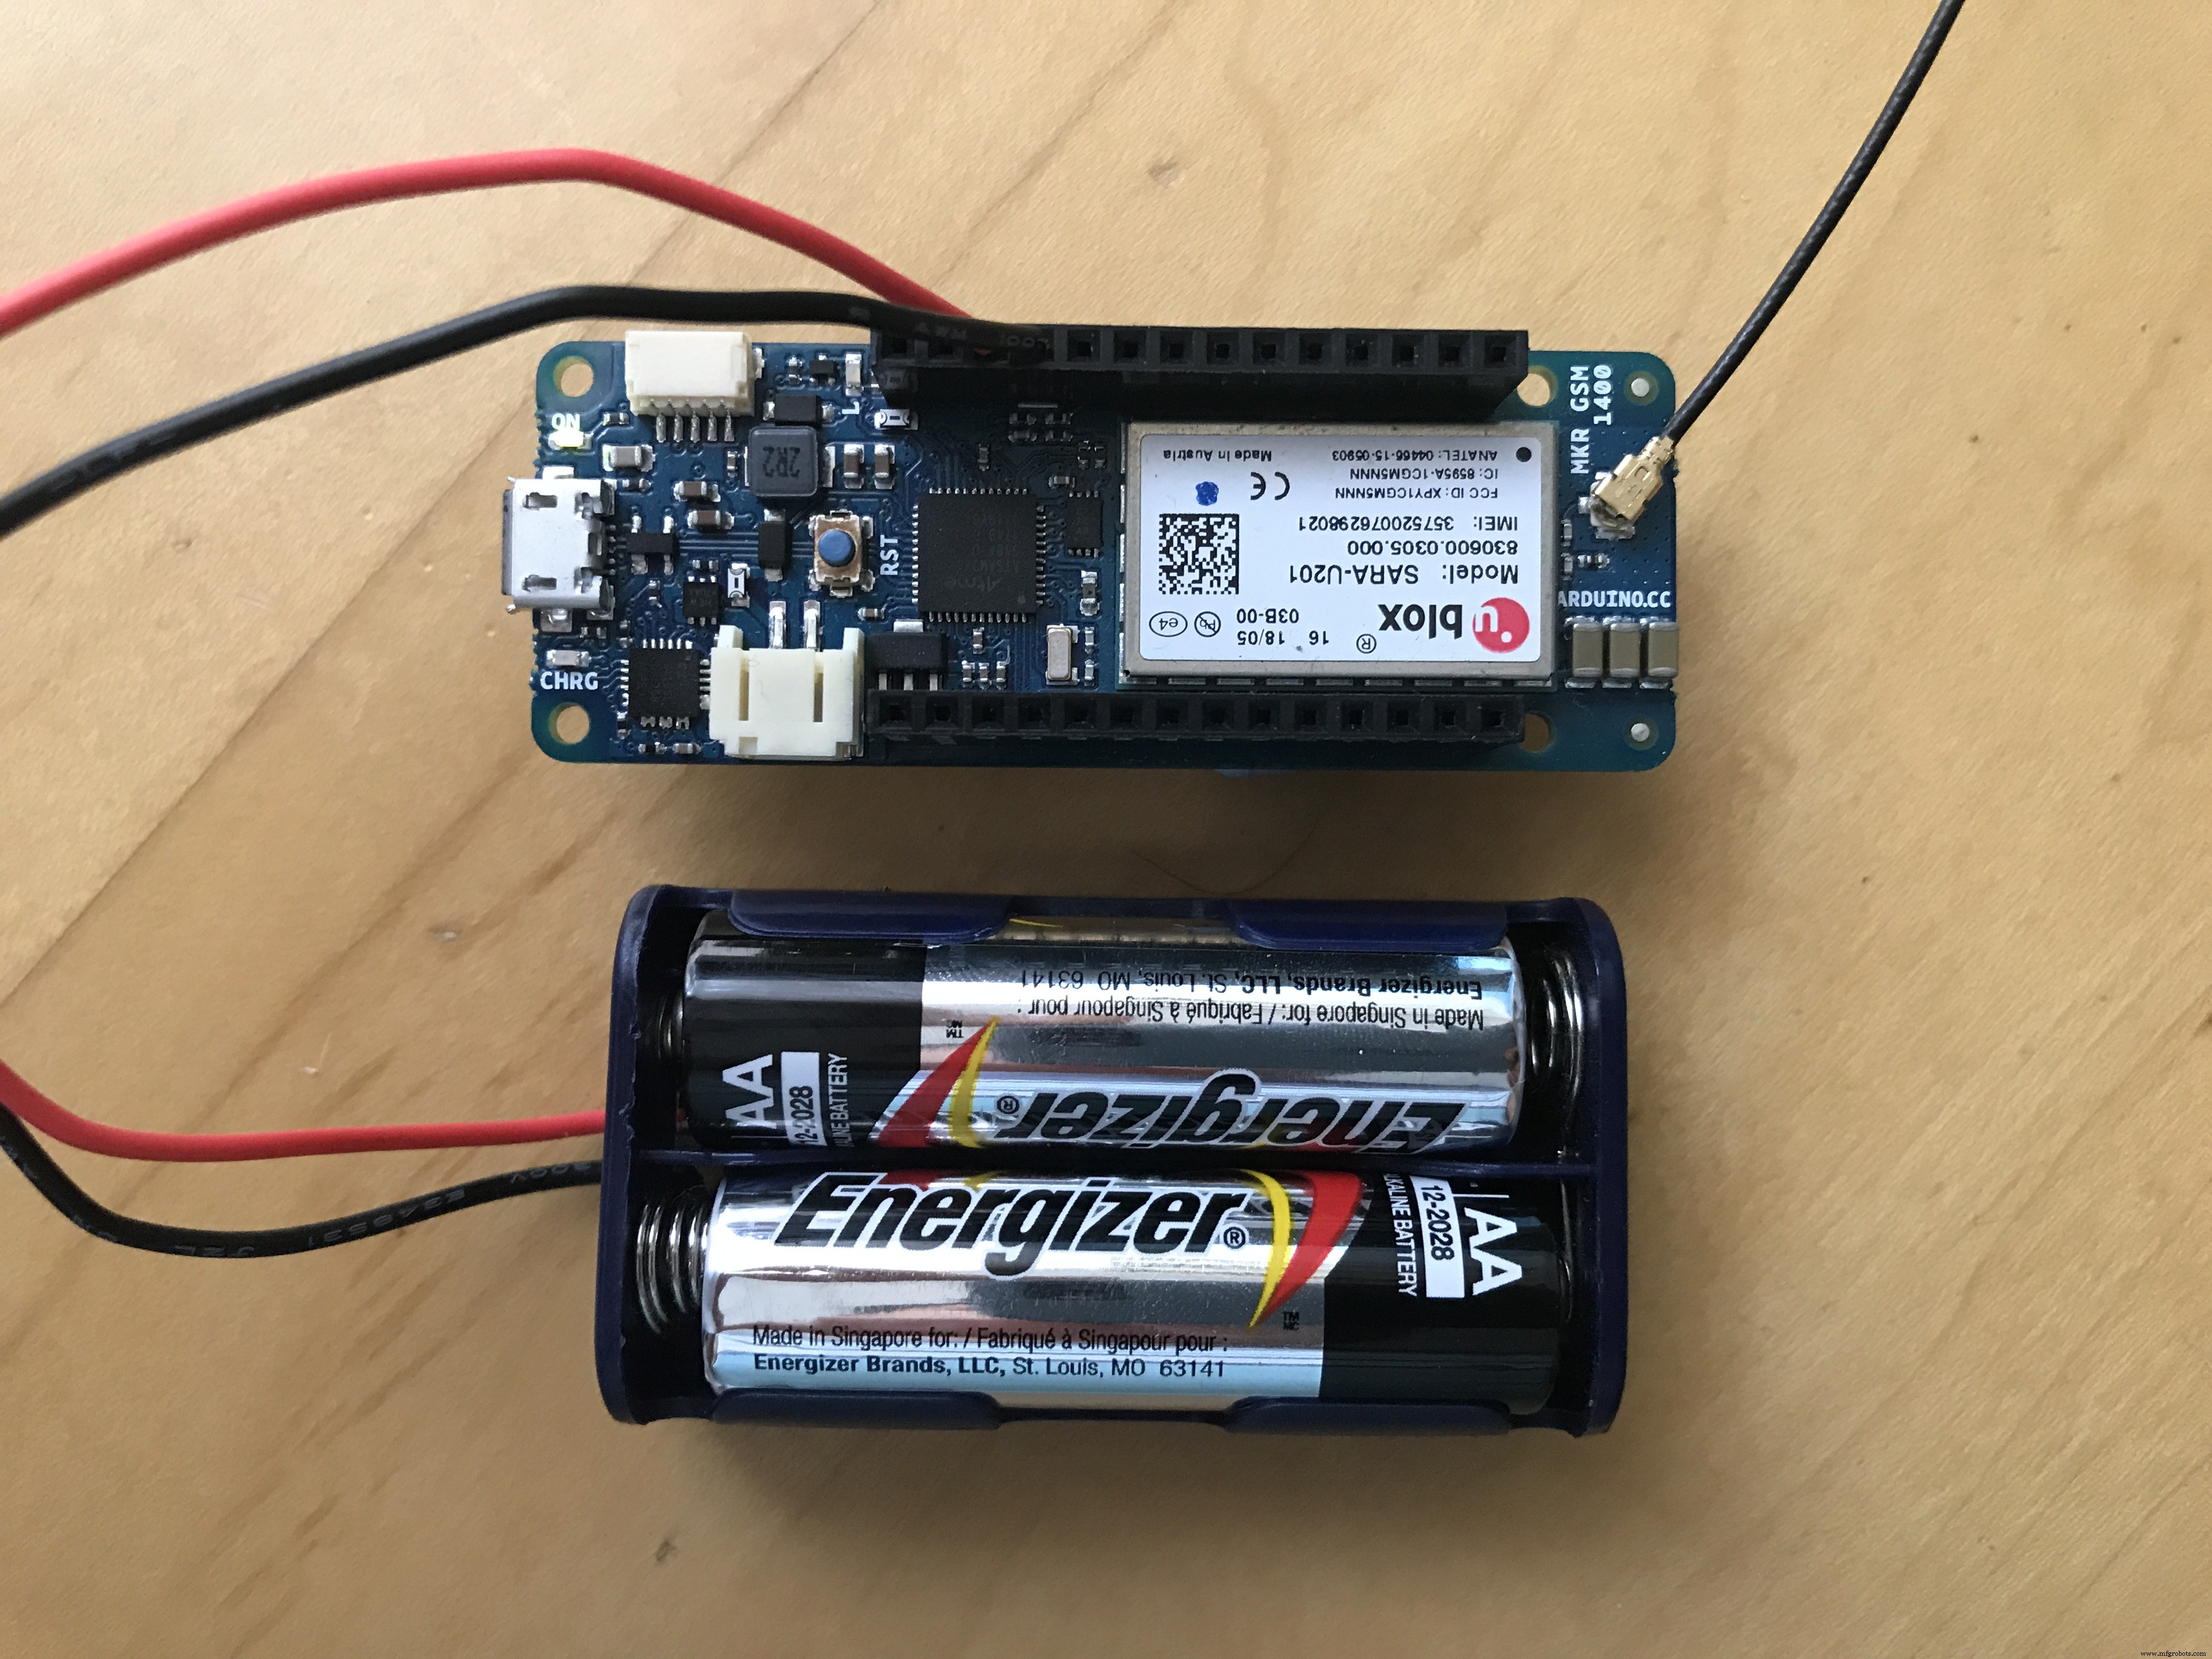
电池
该设备可以通过多种方式供电。它可以通过设备上提供的端口由锂聚合物电池供电,也可以通过移动电源或通过设备上的 VIN 端口连接电池供电。
设备的寿命在很大程度上取决于电池的电量。设备在读取之间进入睡眠模式以尽可能节省能源。
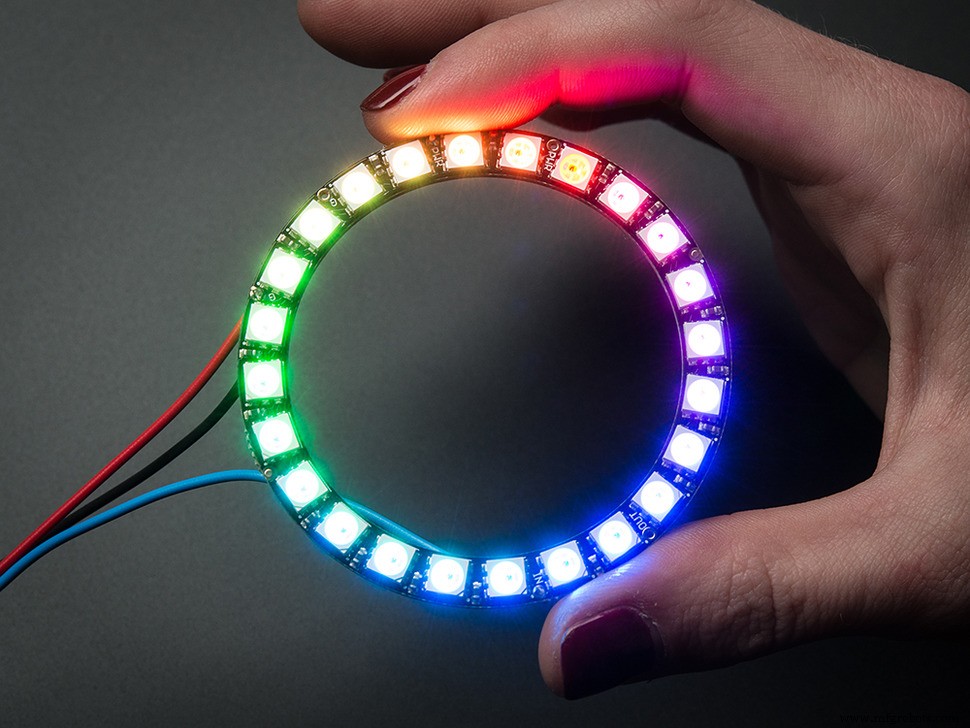
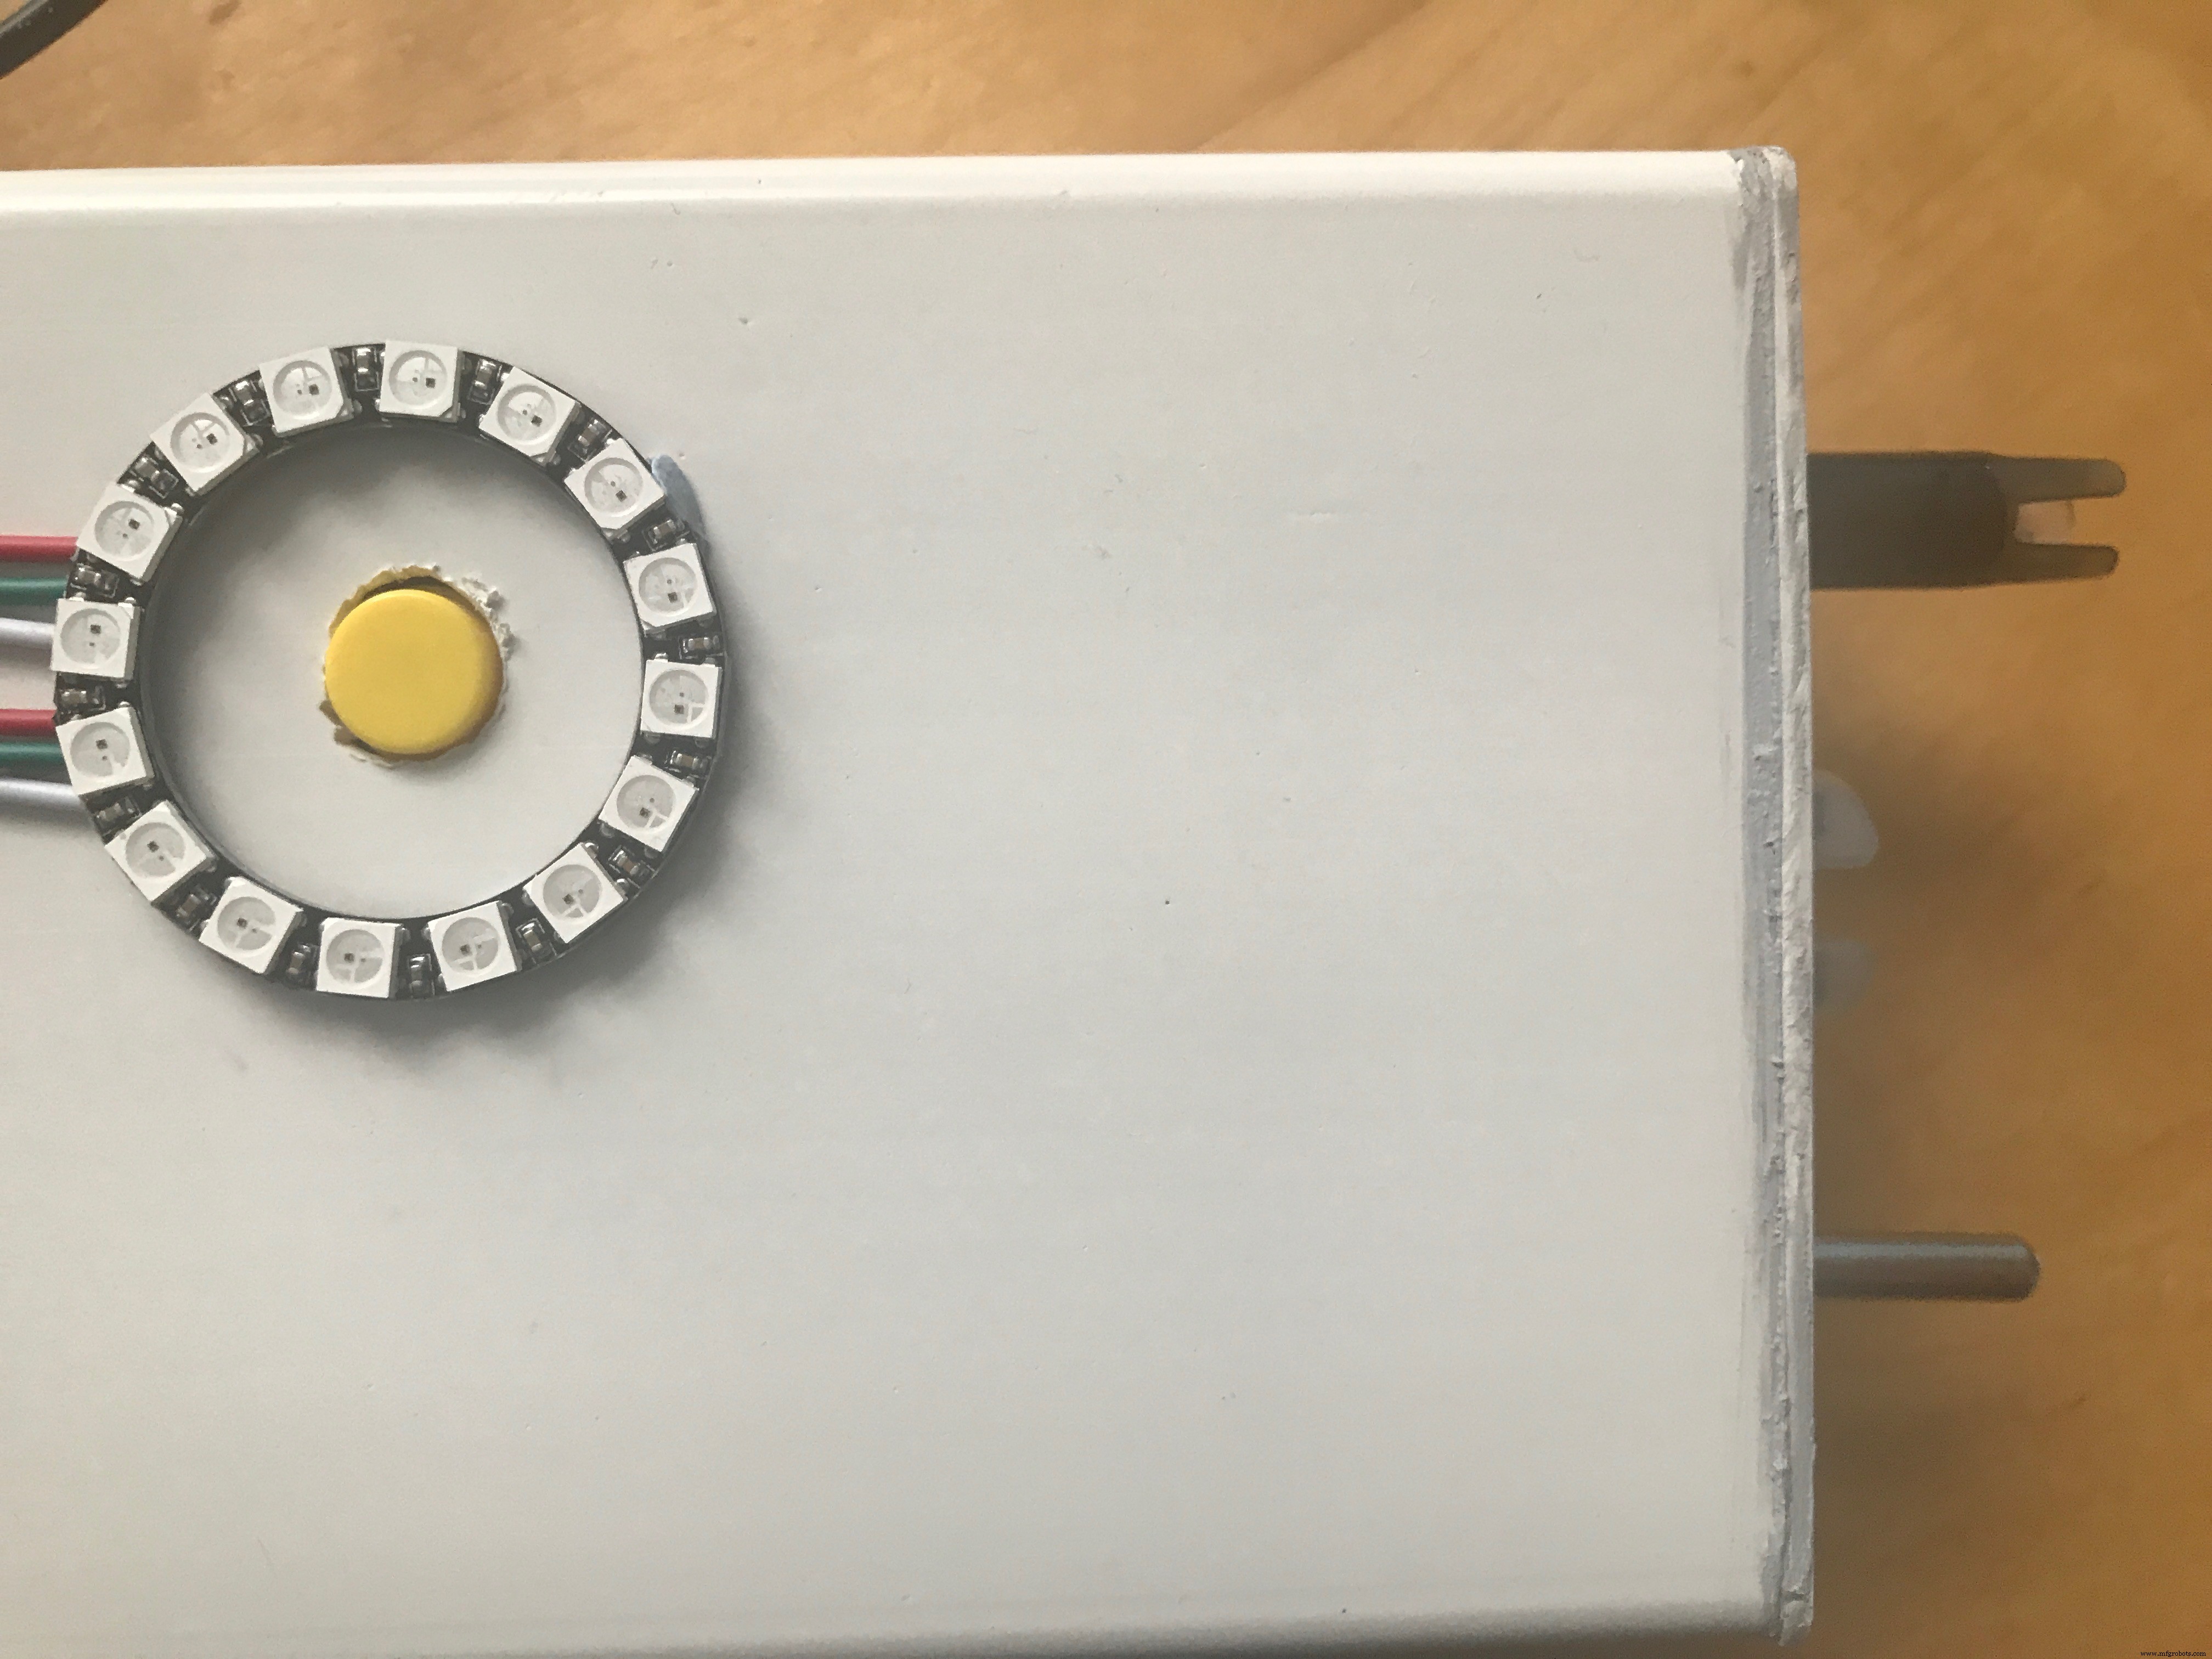
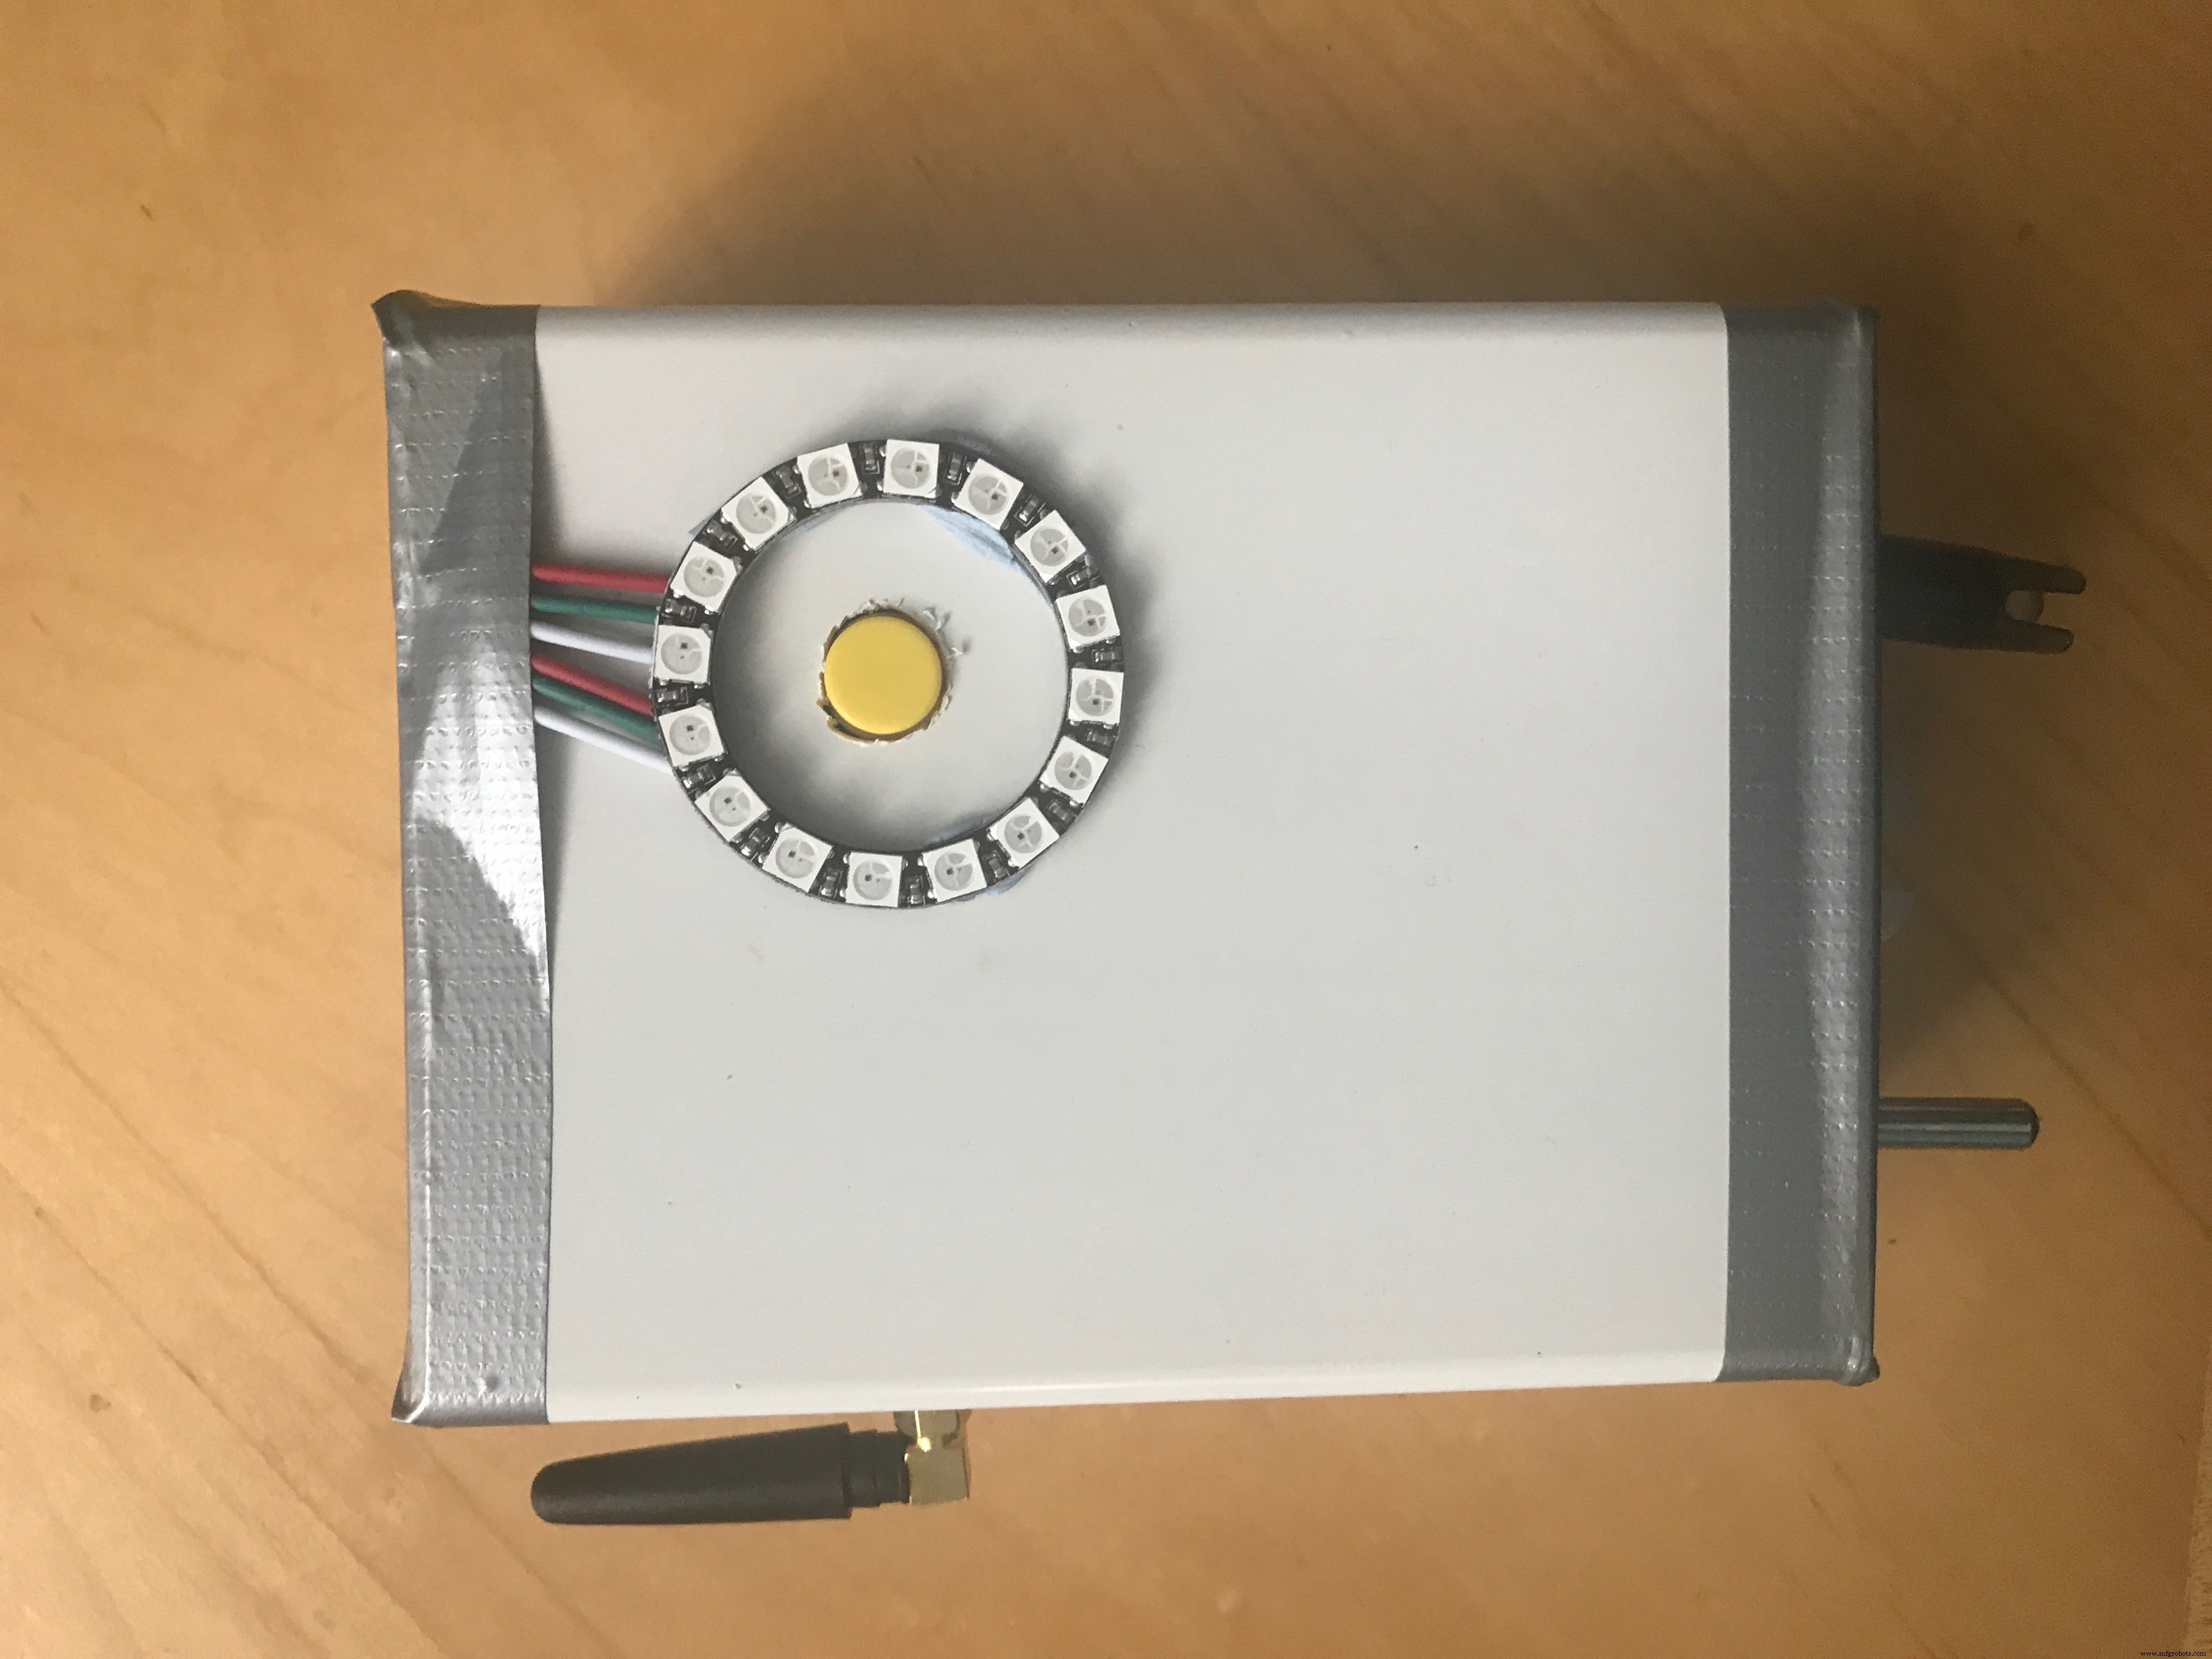
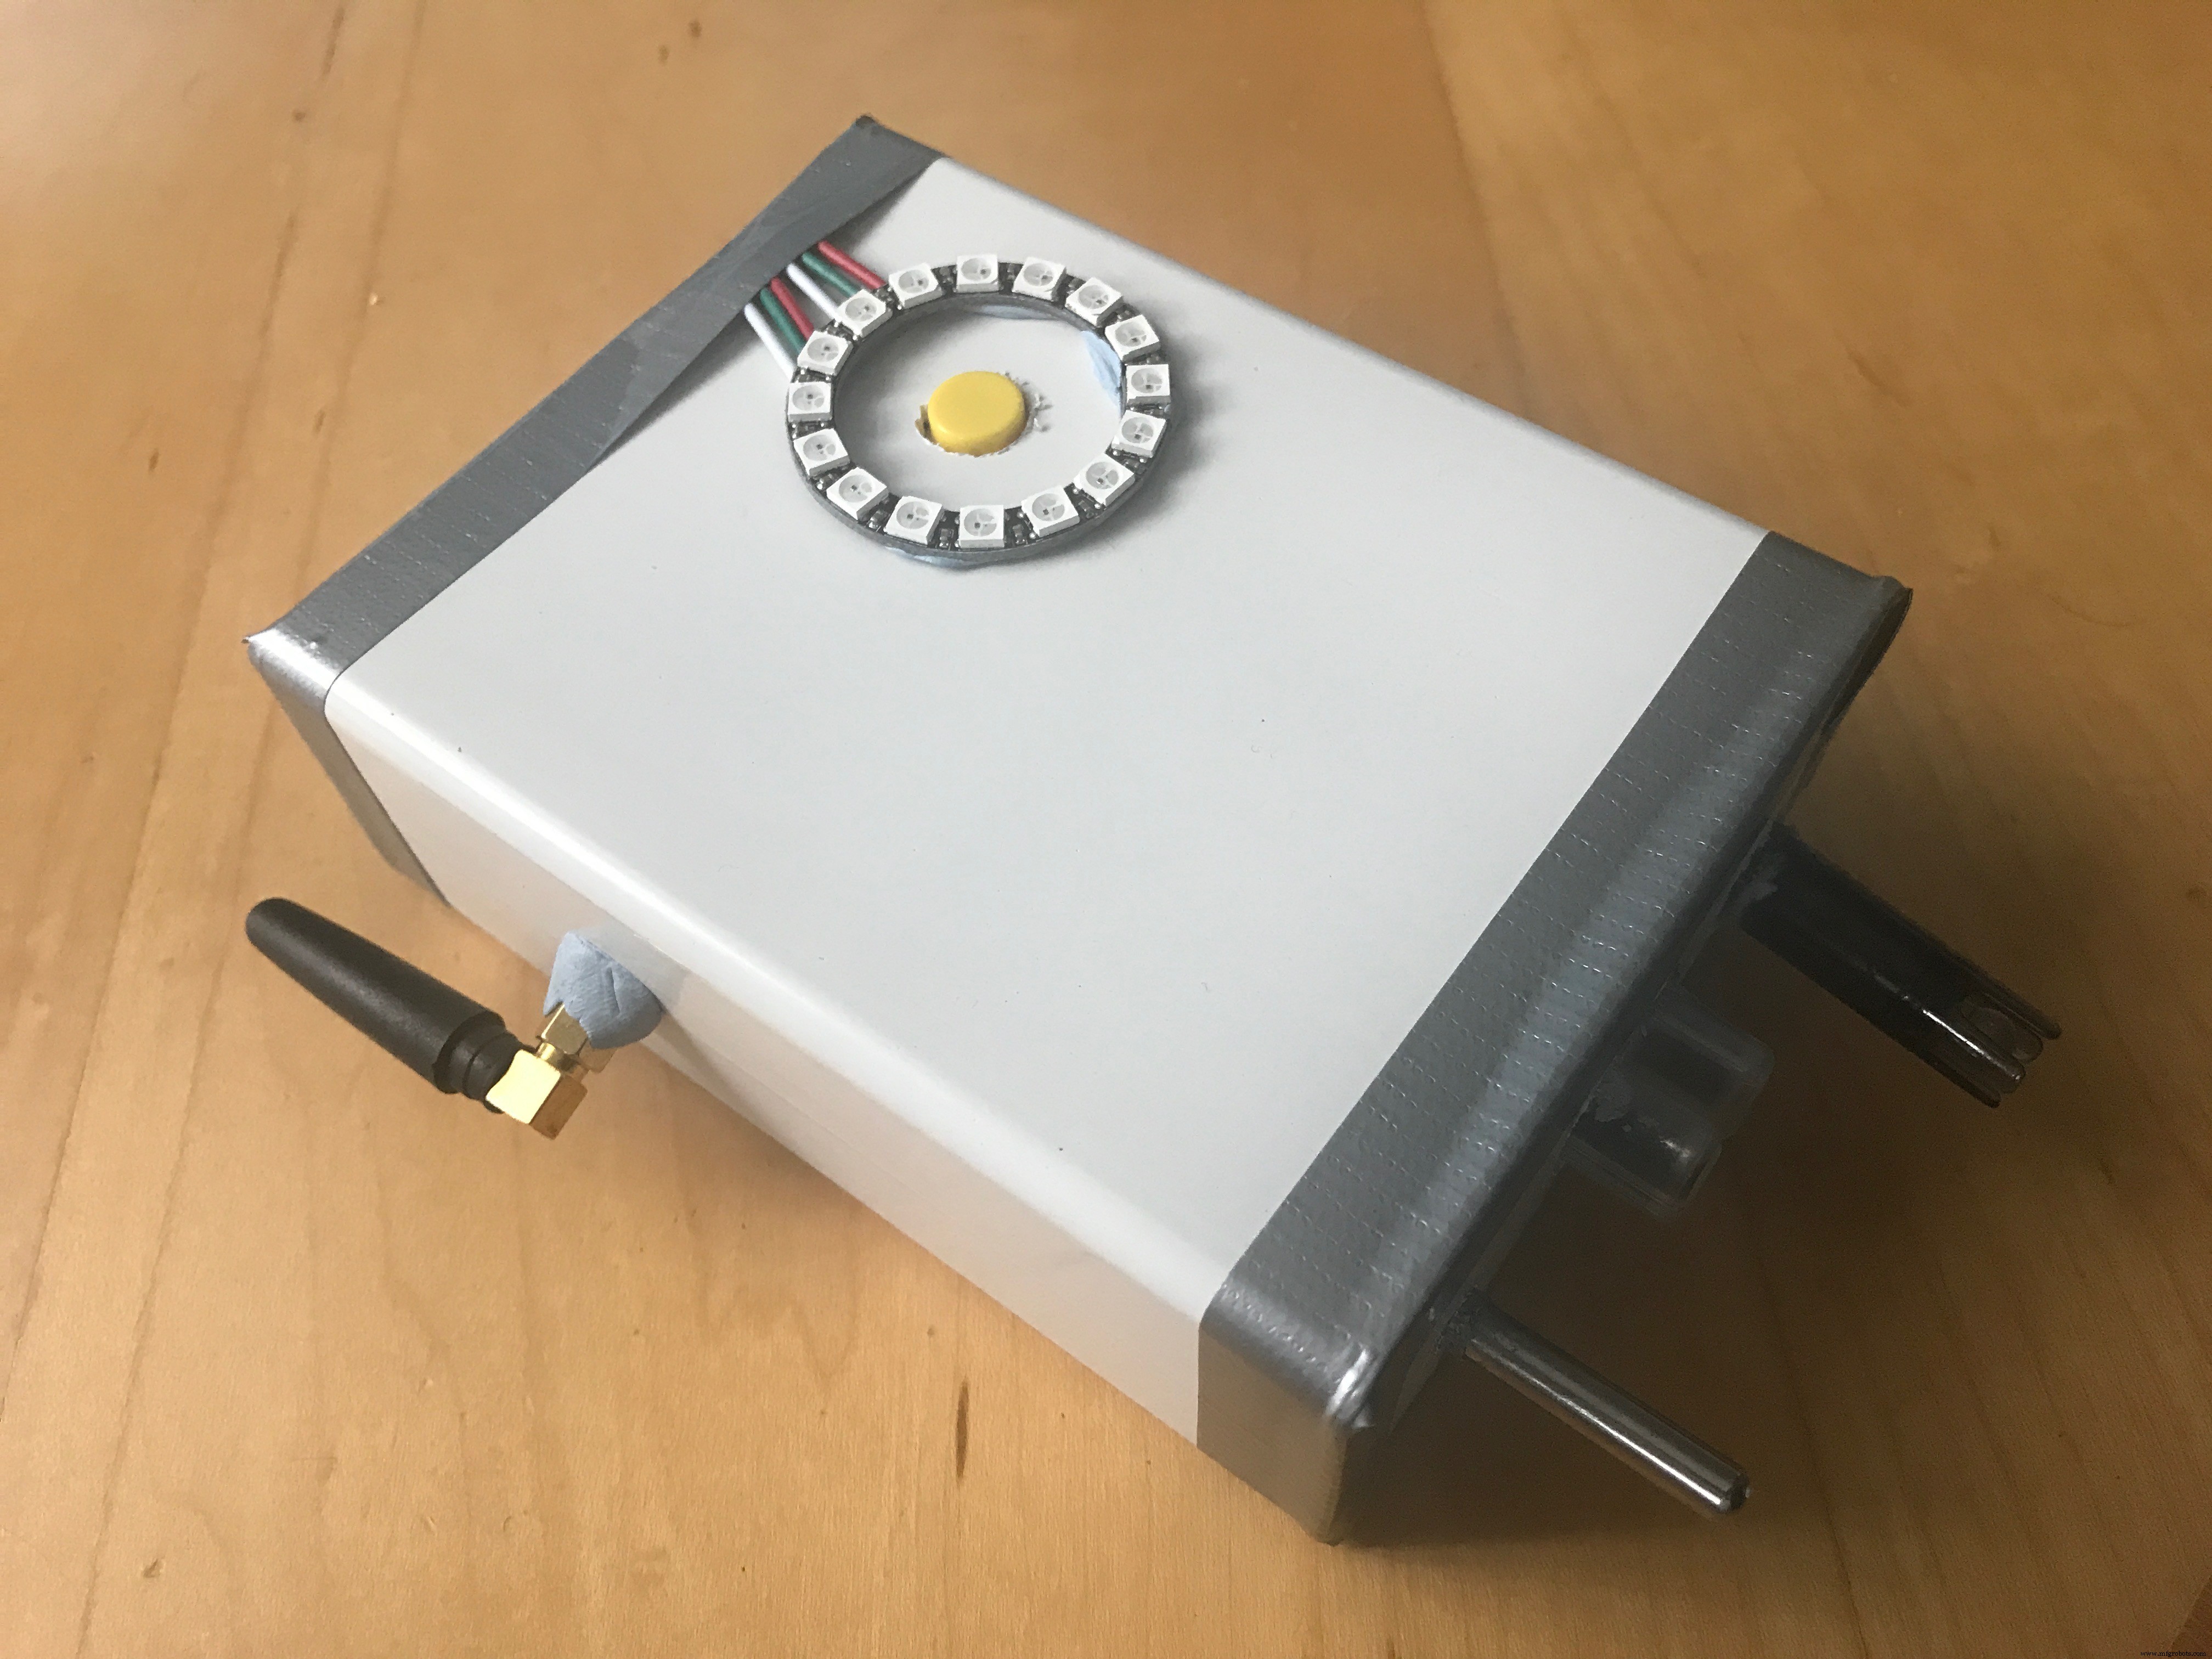
LED 戒指
该设备还配备了一个 LED 环。这为用户提供了关于设备当前正在做什么的反馈。戒指有3种模式。
- 多色 表示设备正在设置或正在处理数据
- 闪烁的红色 警告,通常意味着设备必须放入水中,但也可能表示错误
- 进展为蓝色或绿色 表示该设备当前正在取样,应置于水中。
采样
设备采样时,设备的传感器应全部置于水中。在采集样品以预热传感器之前放置了 6 秒的延迟。为获得最佳效果,应在进行预热时将传感器浸入水中。
解析数据
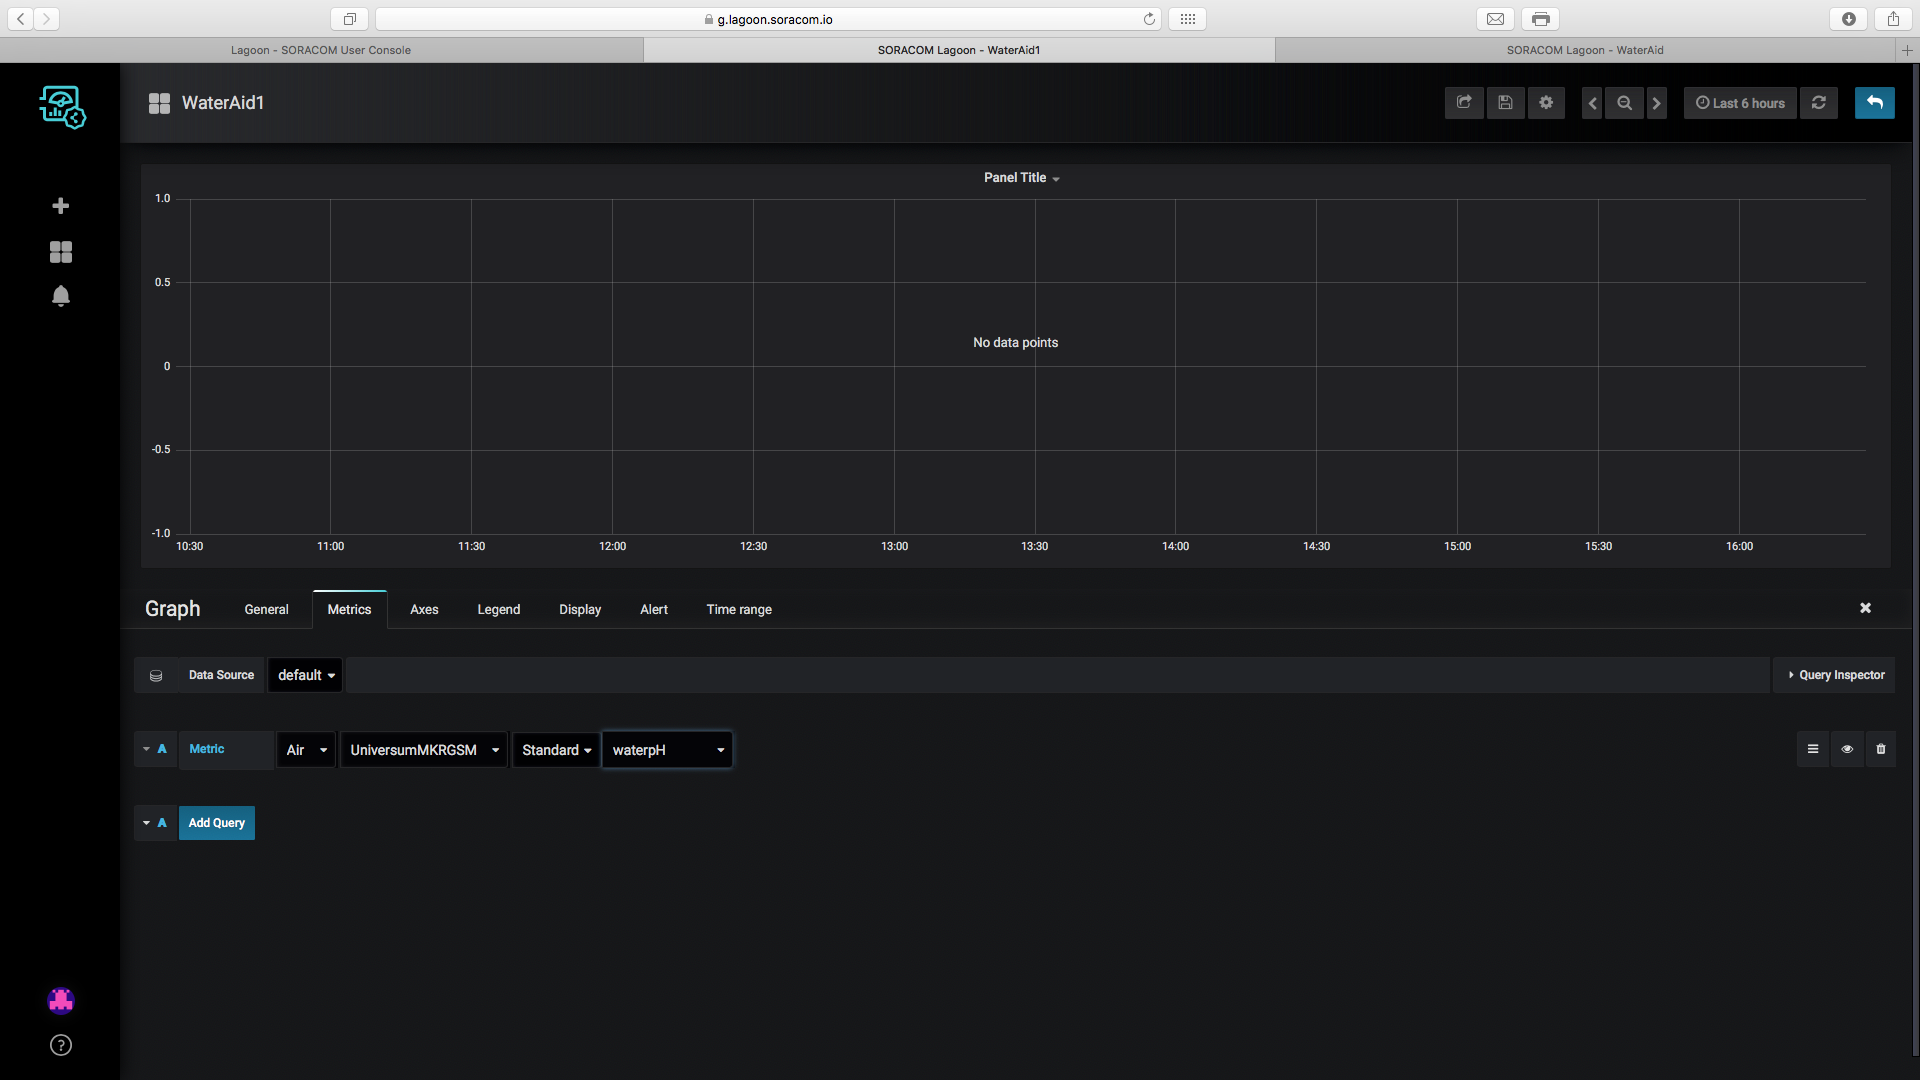
数据必须以 JSON 字符串的形式发送到 Soracom。这为所有使用的键提供了一个值。然后数据将很容易被后端解释。以下是将发送的有效载荷示例。
{
 "Latitude":53.3474617,
 "Longitude":-6.2514529,
 "waterpH":7.30,
 "waterTurbidity":94,
 "waterTemp":12.10,
 "atmoTemp":14.50,
 "atmoHum":82,
 "deviceID":1,
 "deviceName":"device1",
 "epoch":1559392636,
 "mode":2
}
后端
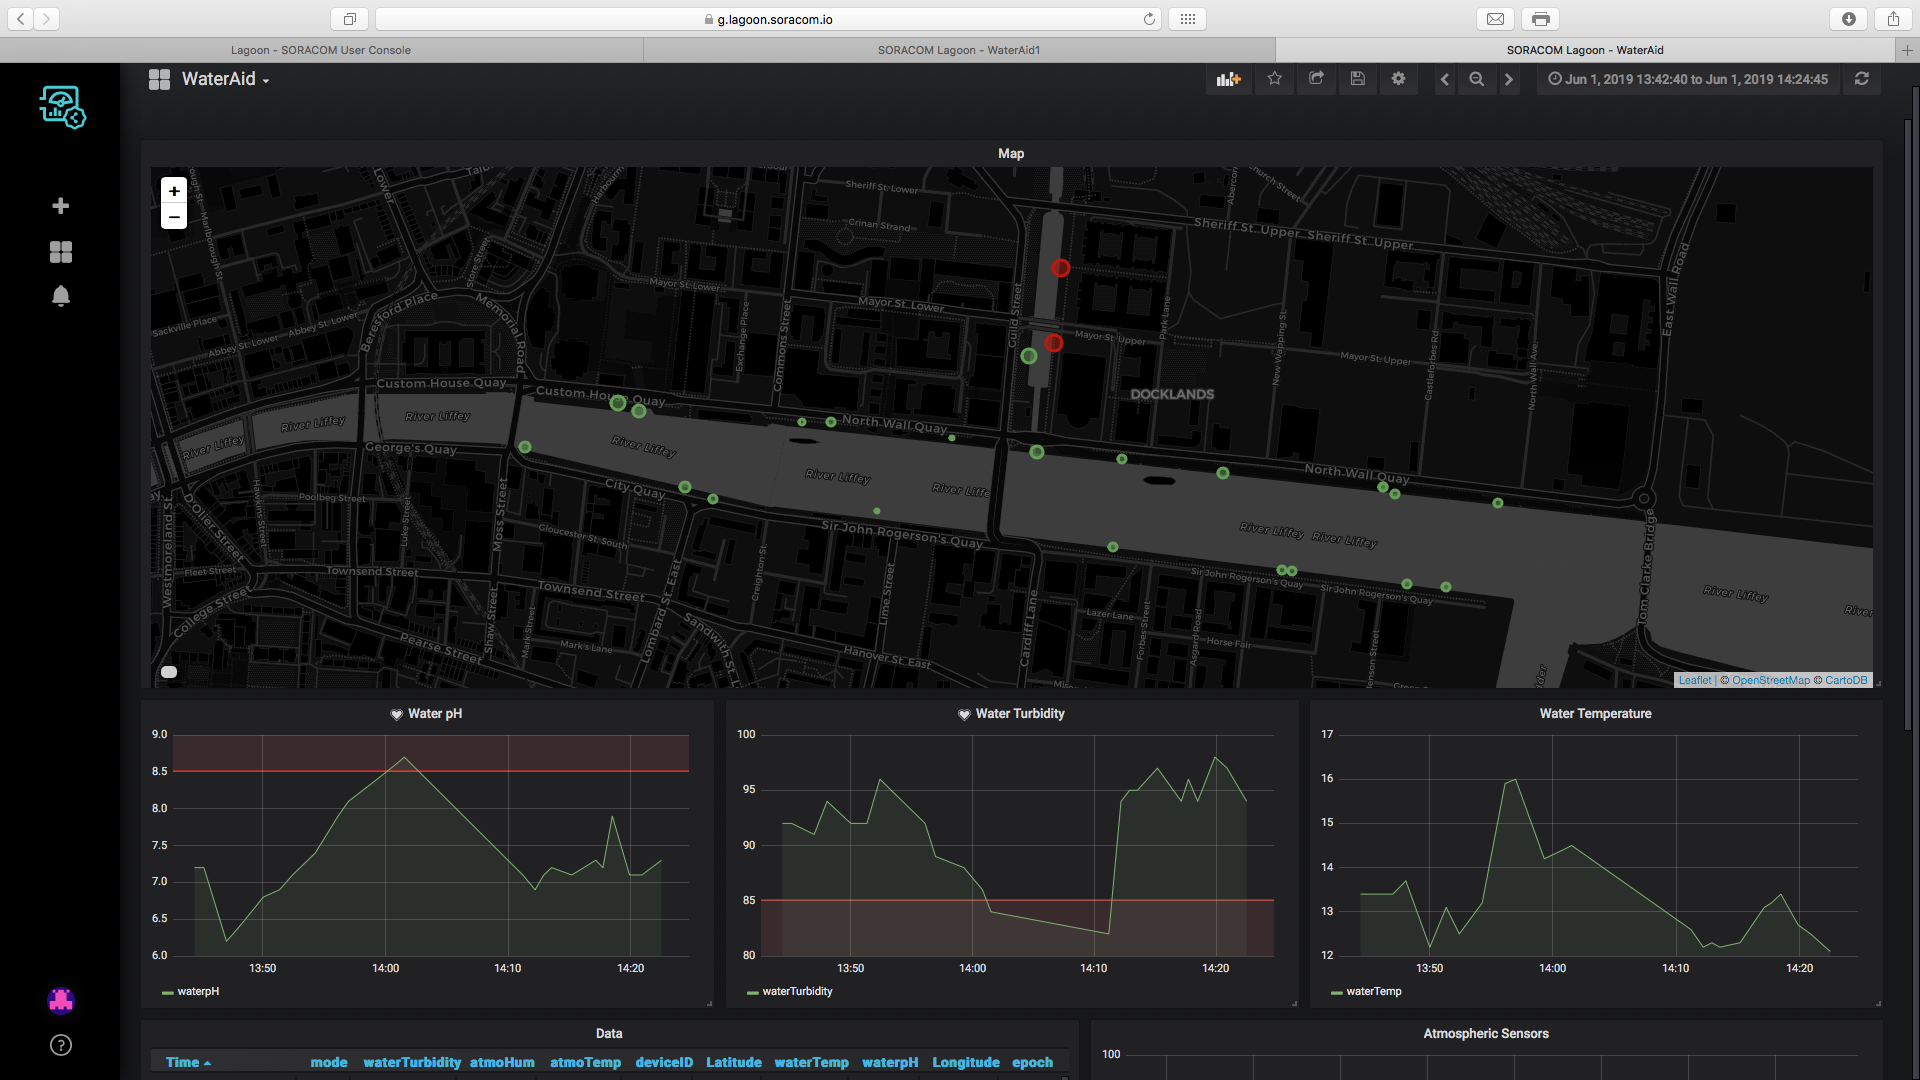
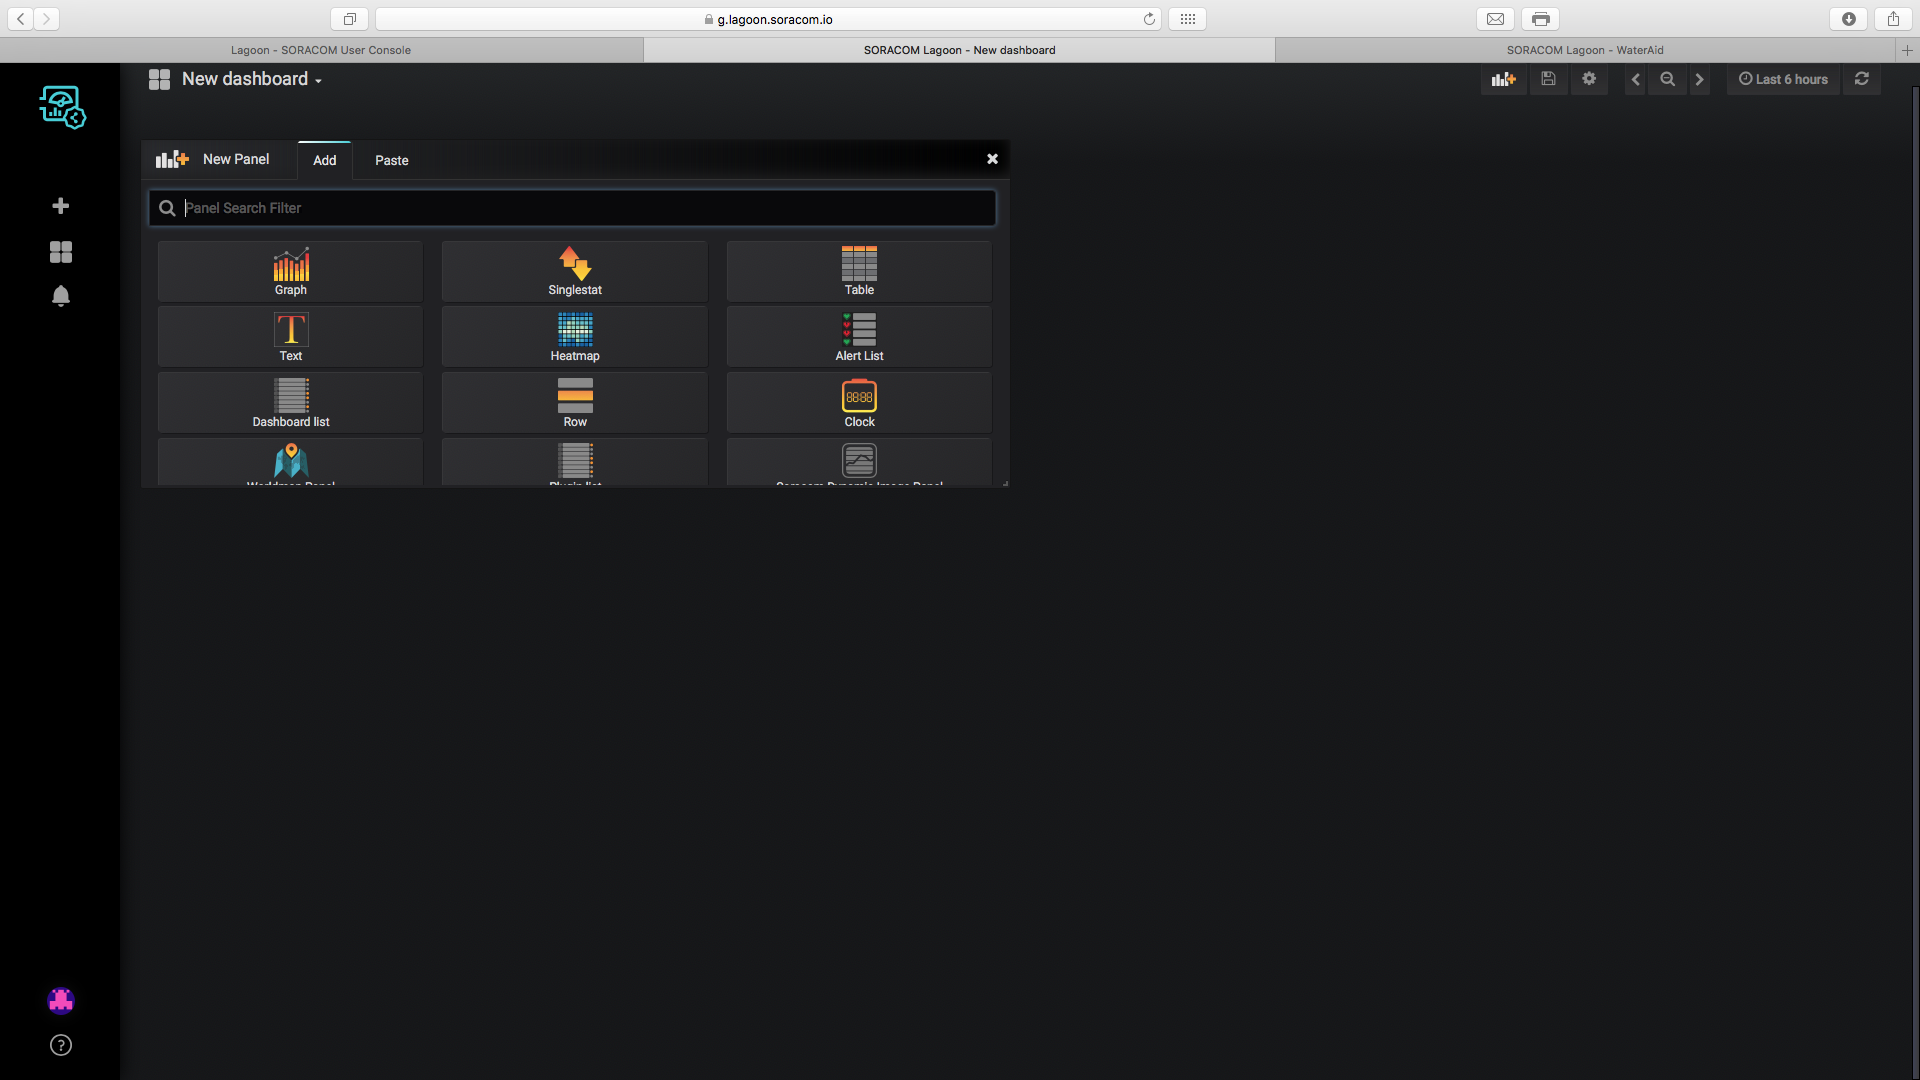
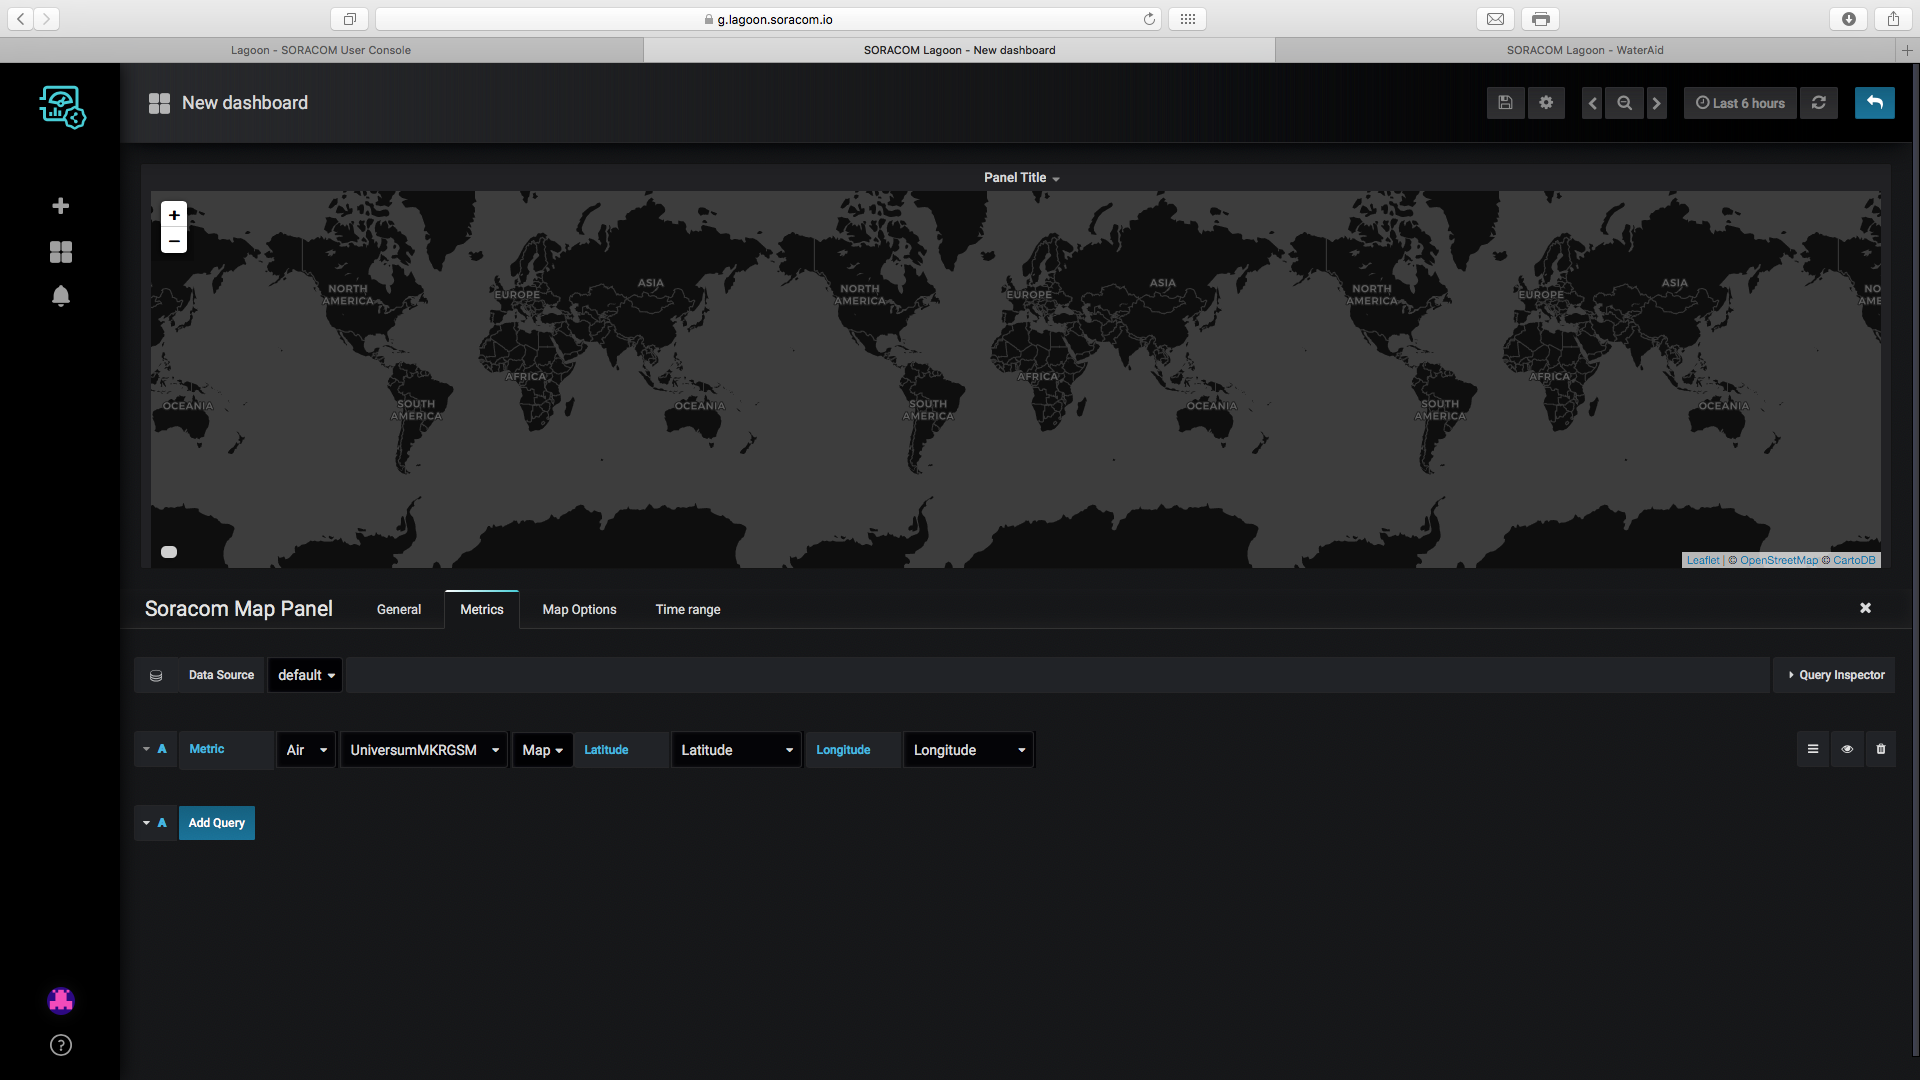
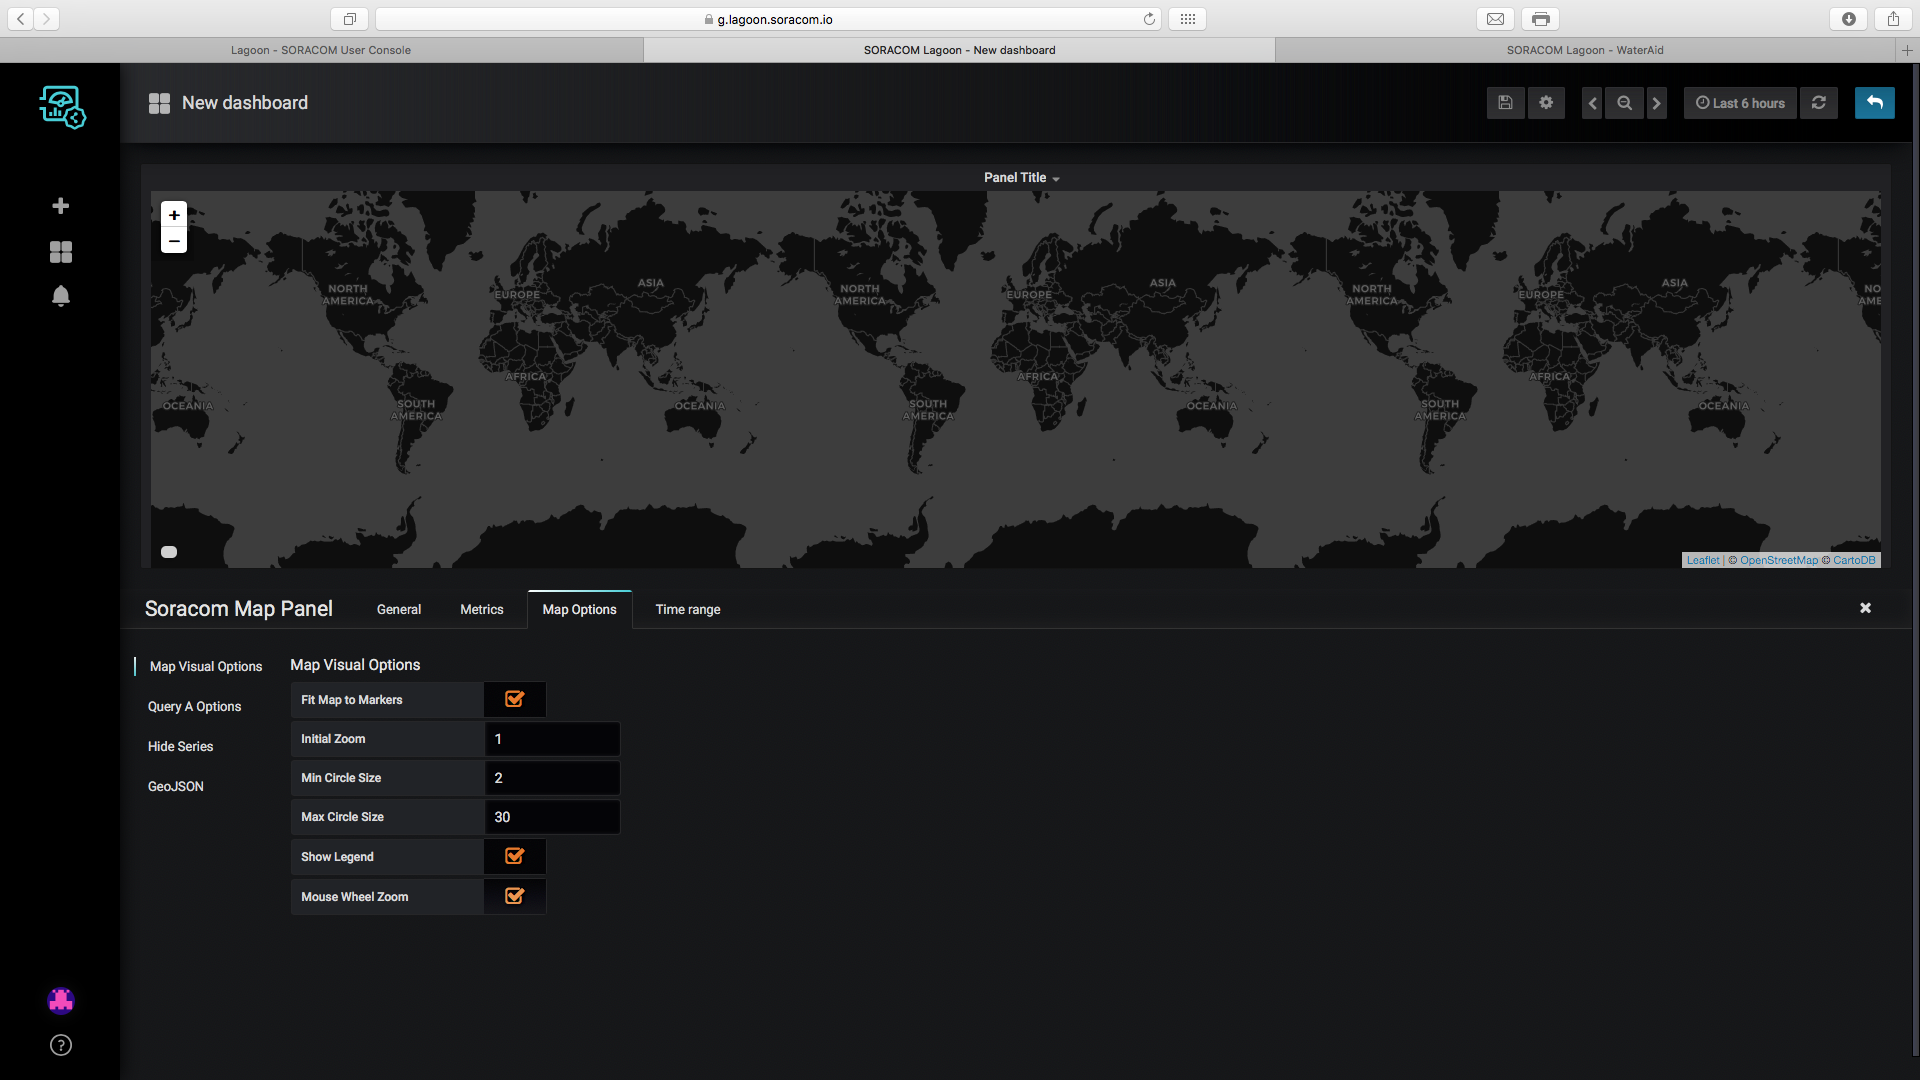
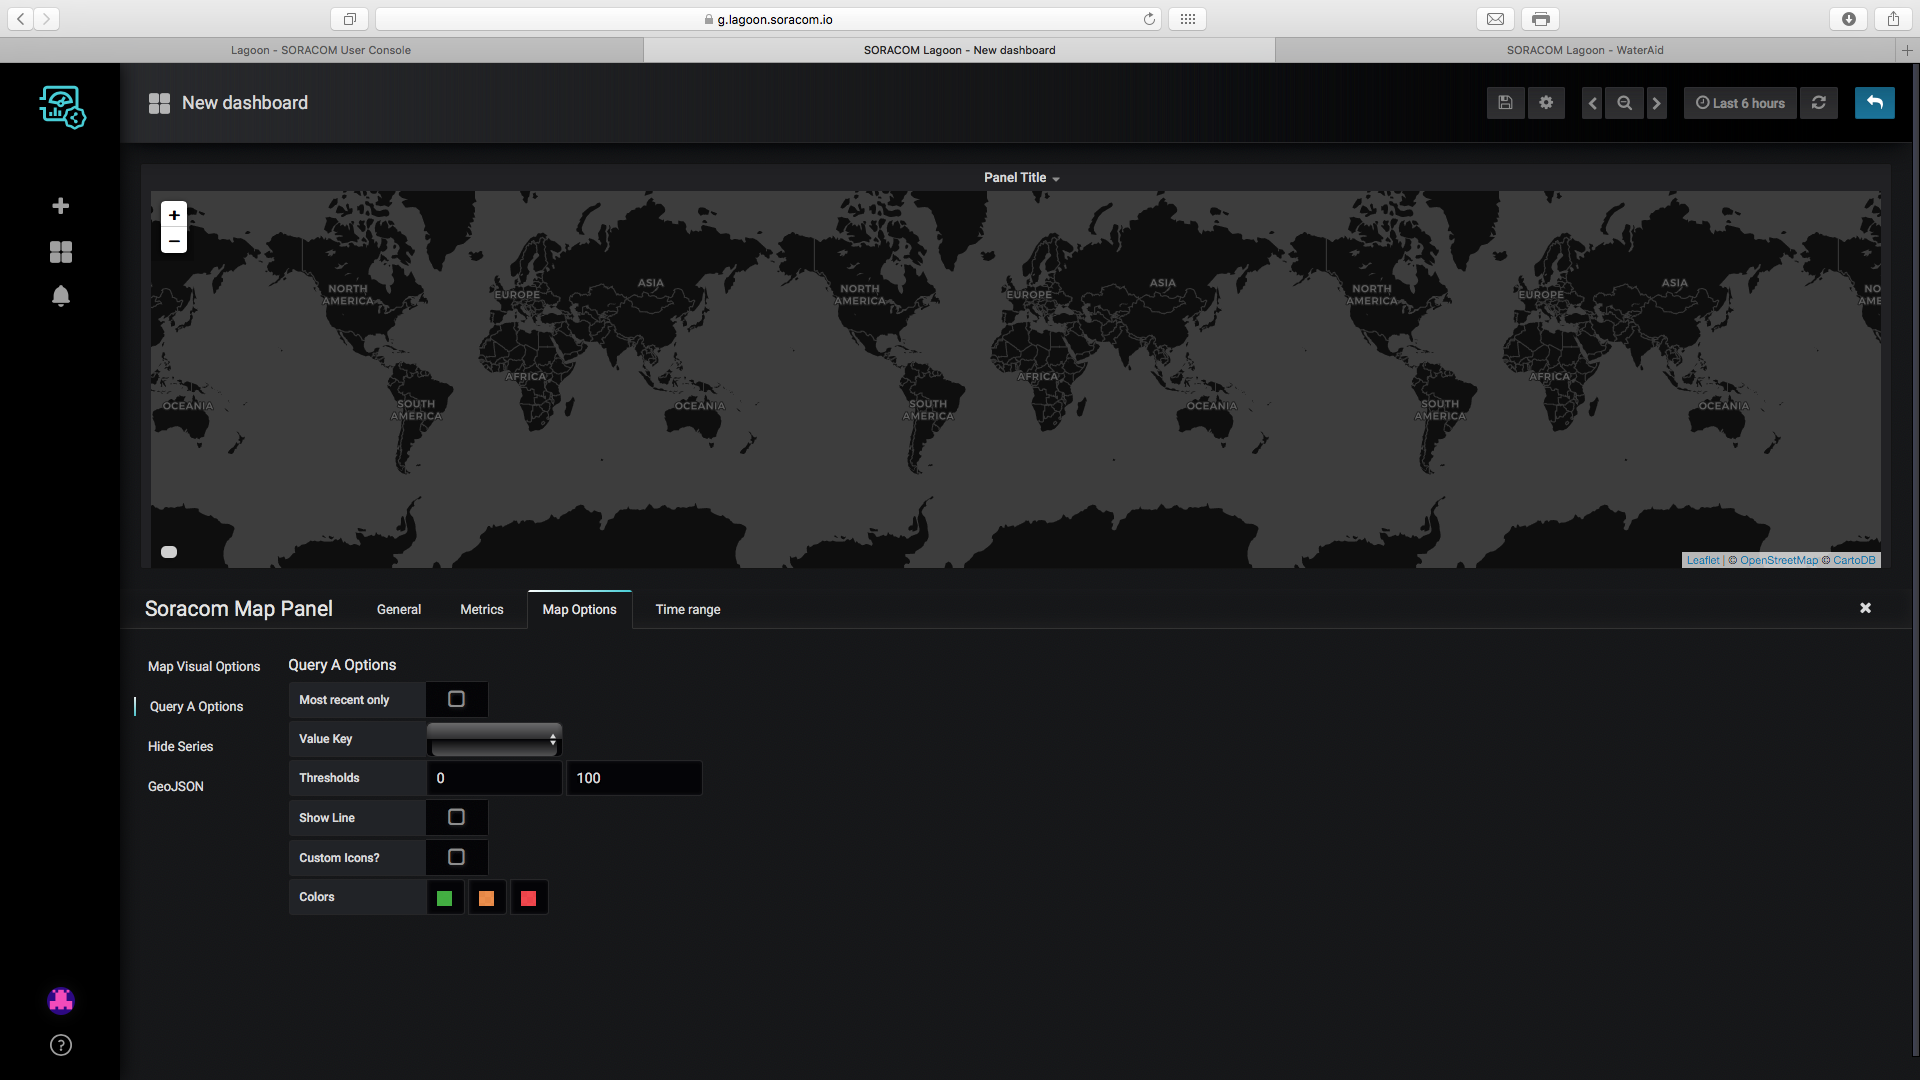
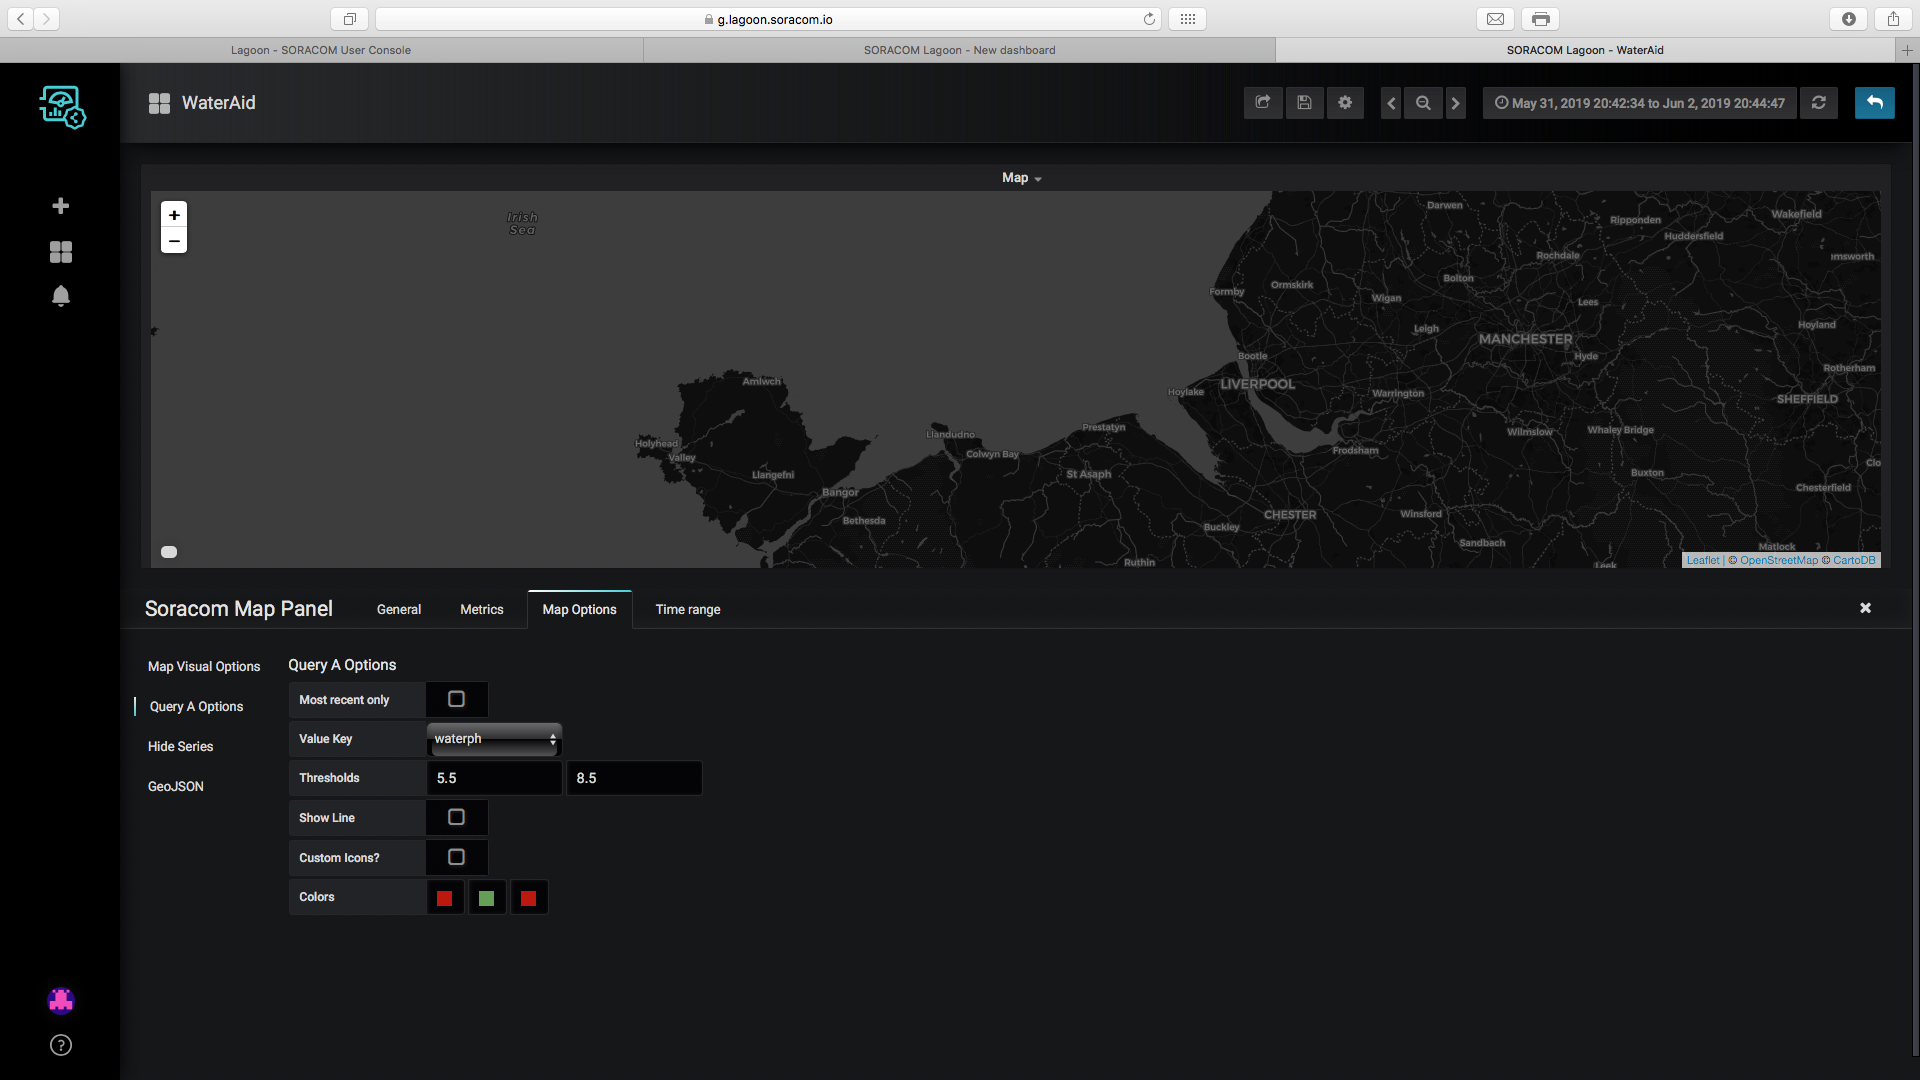
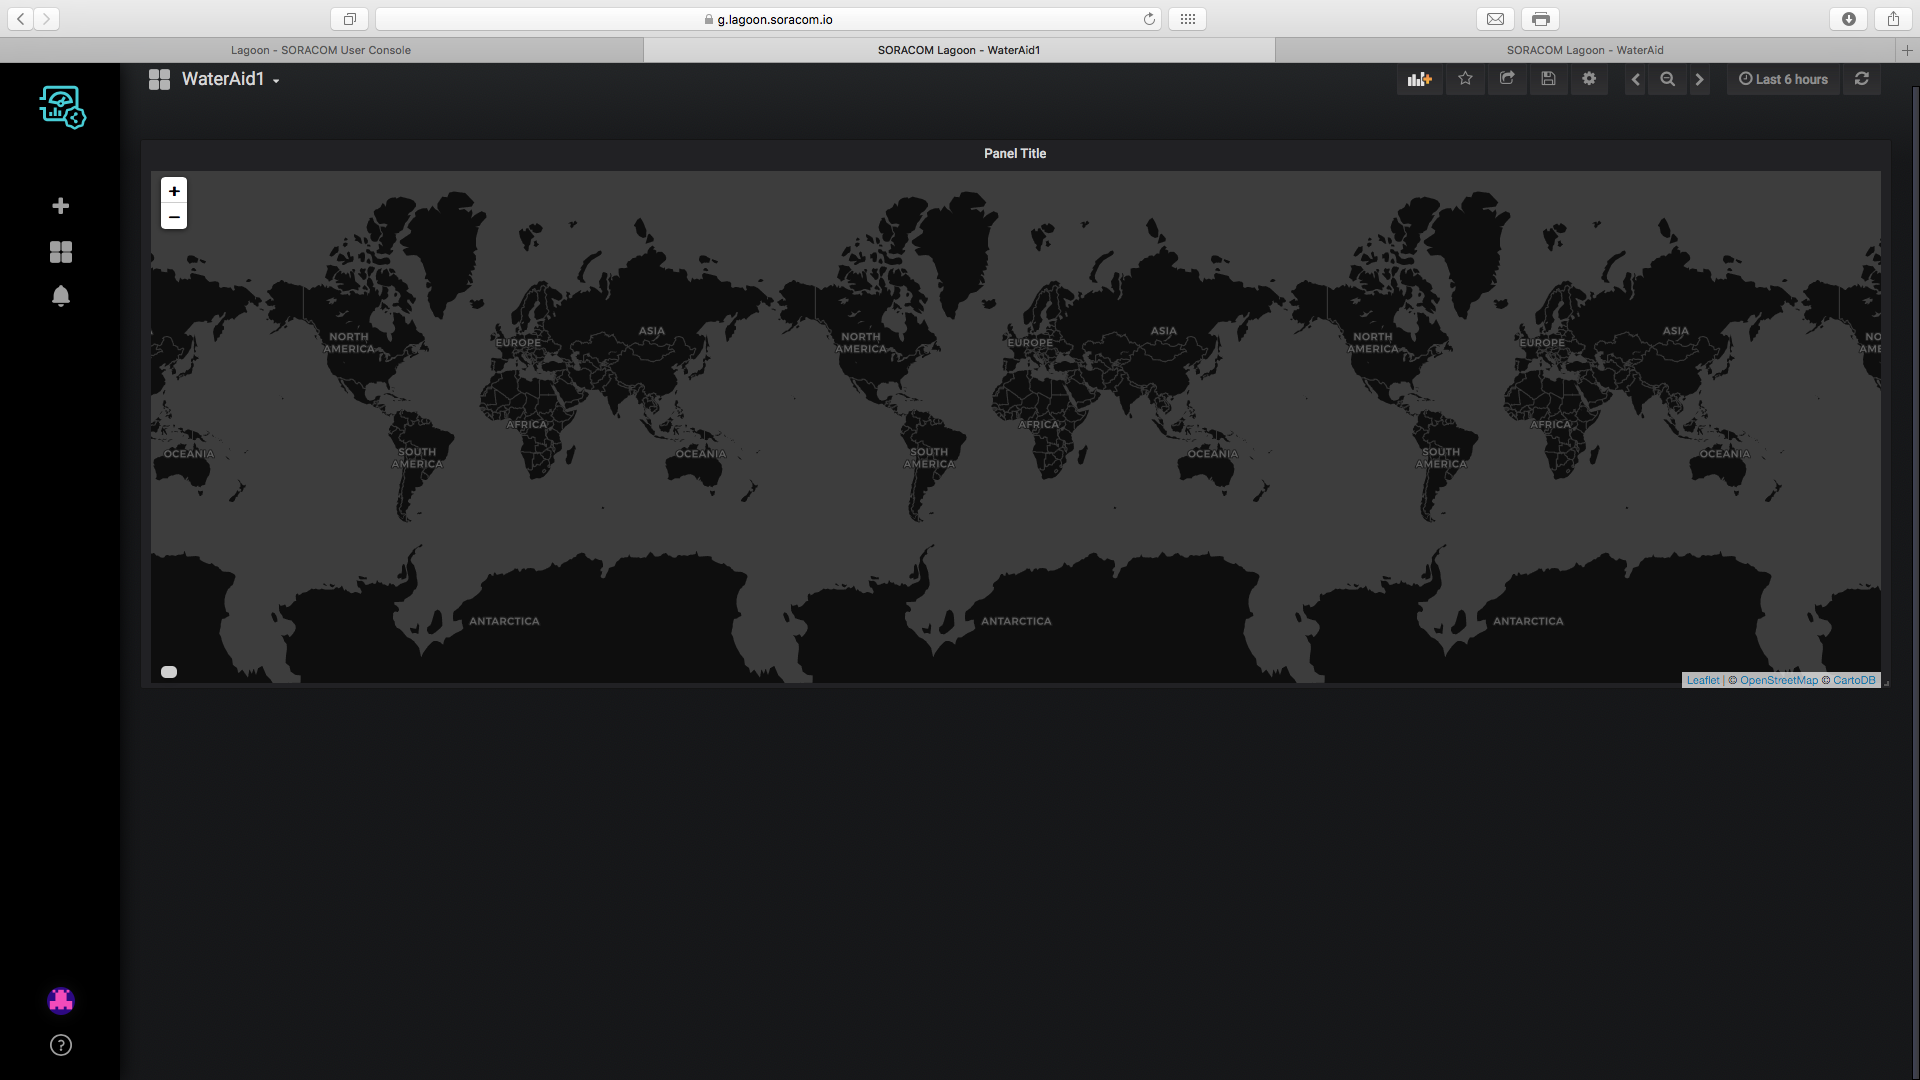
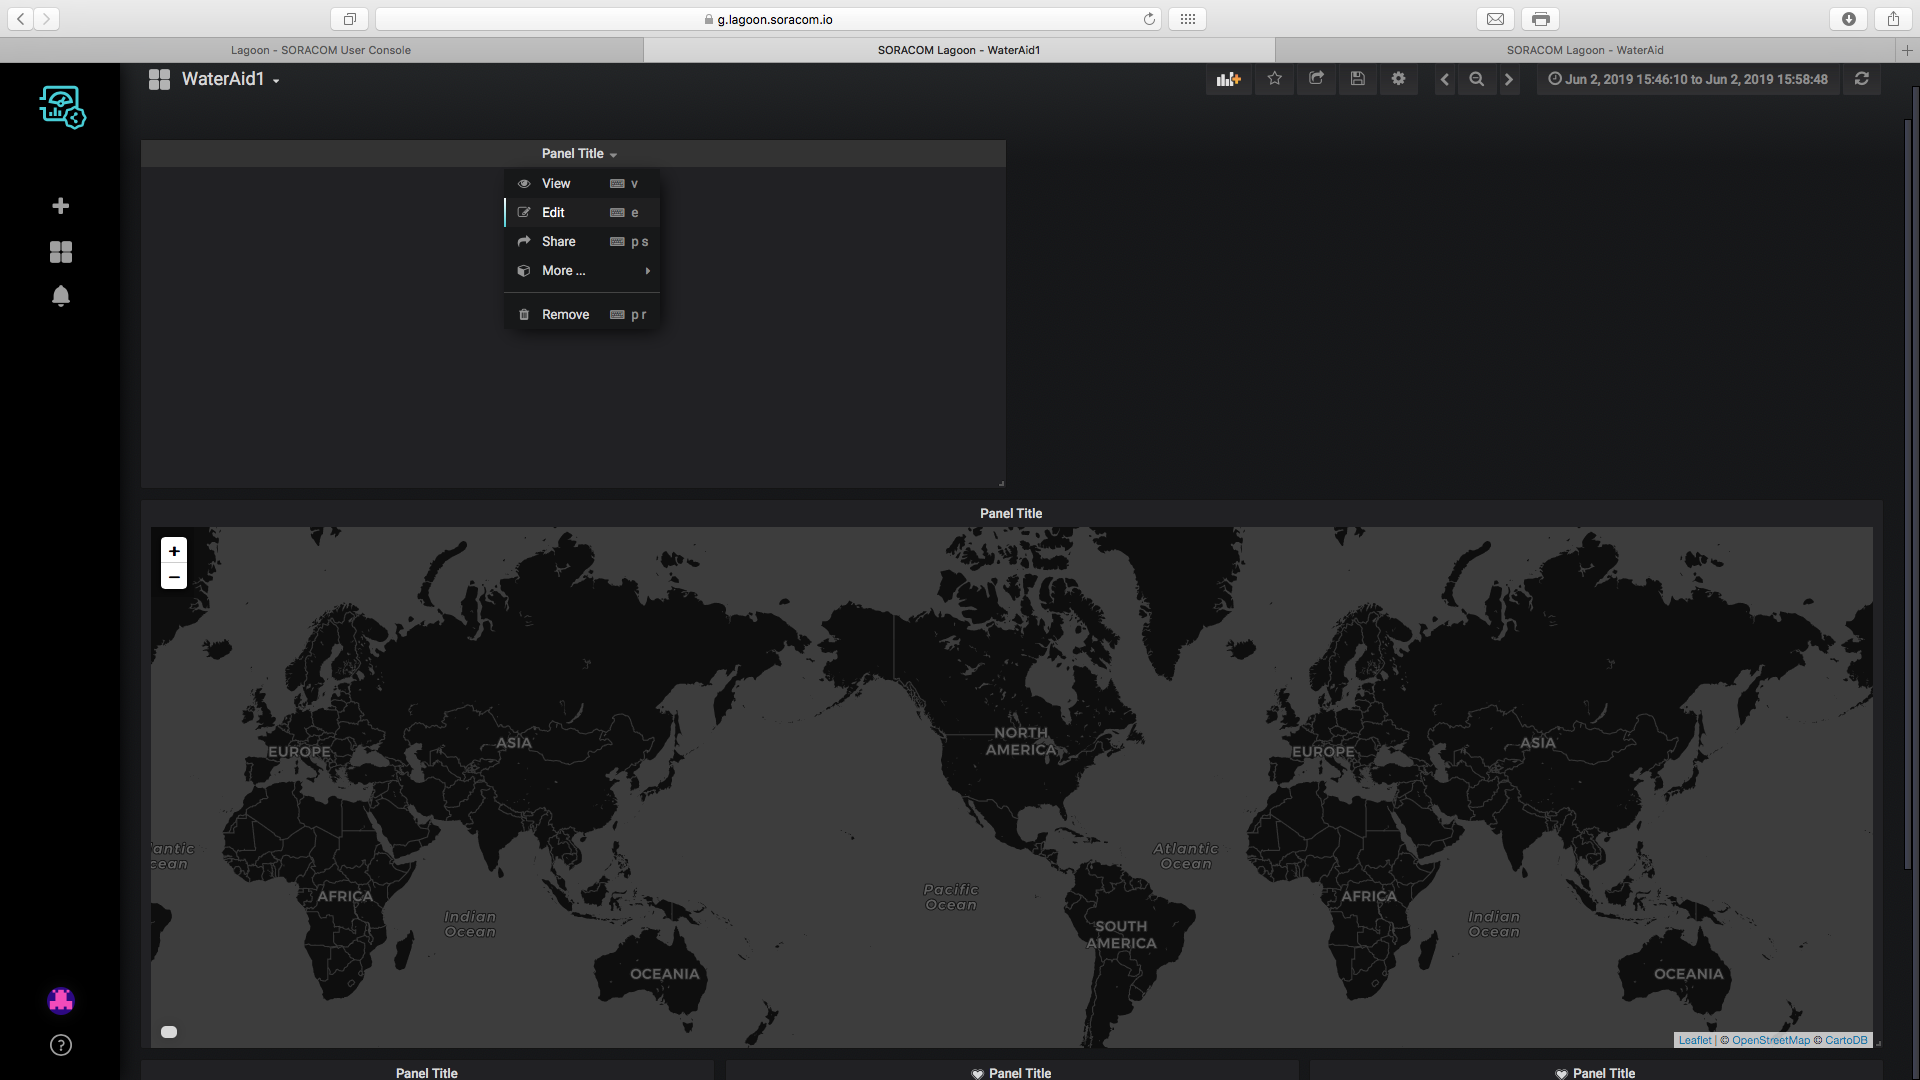
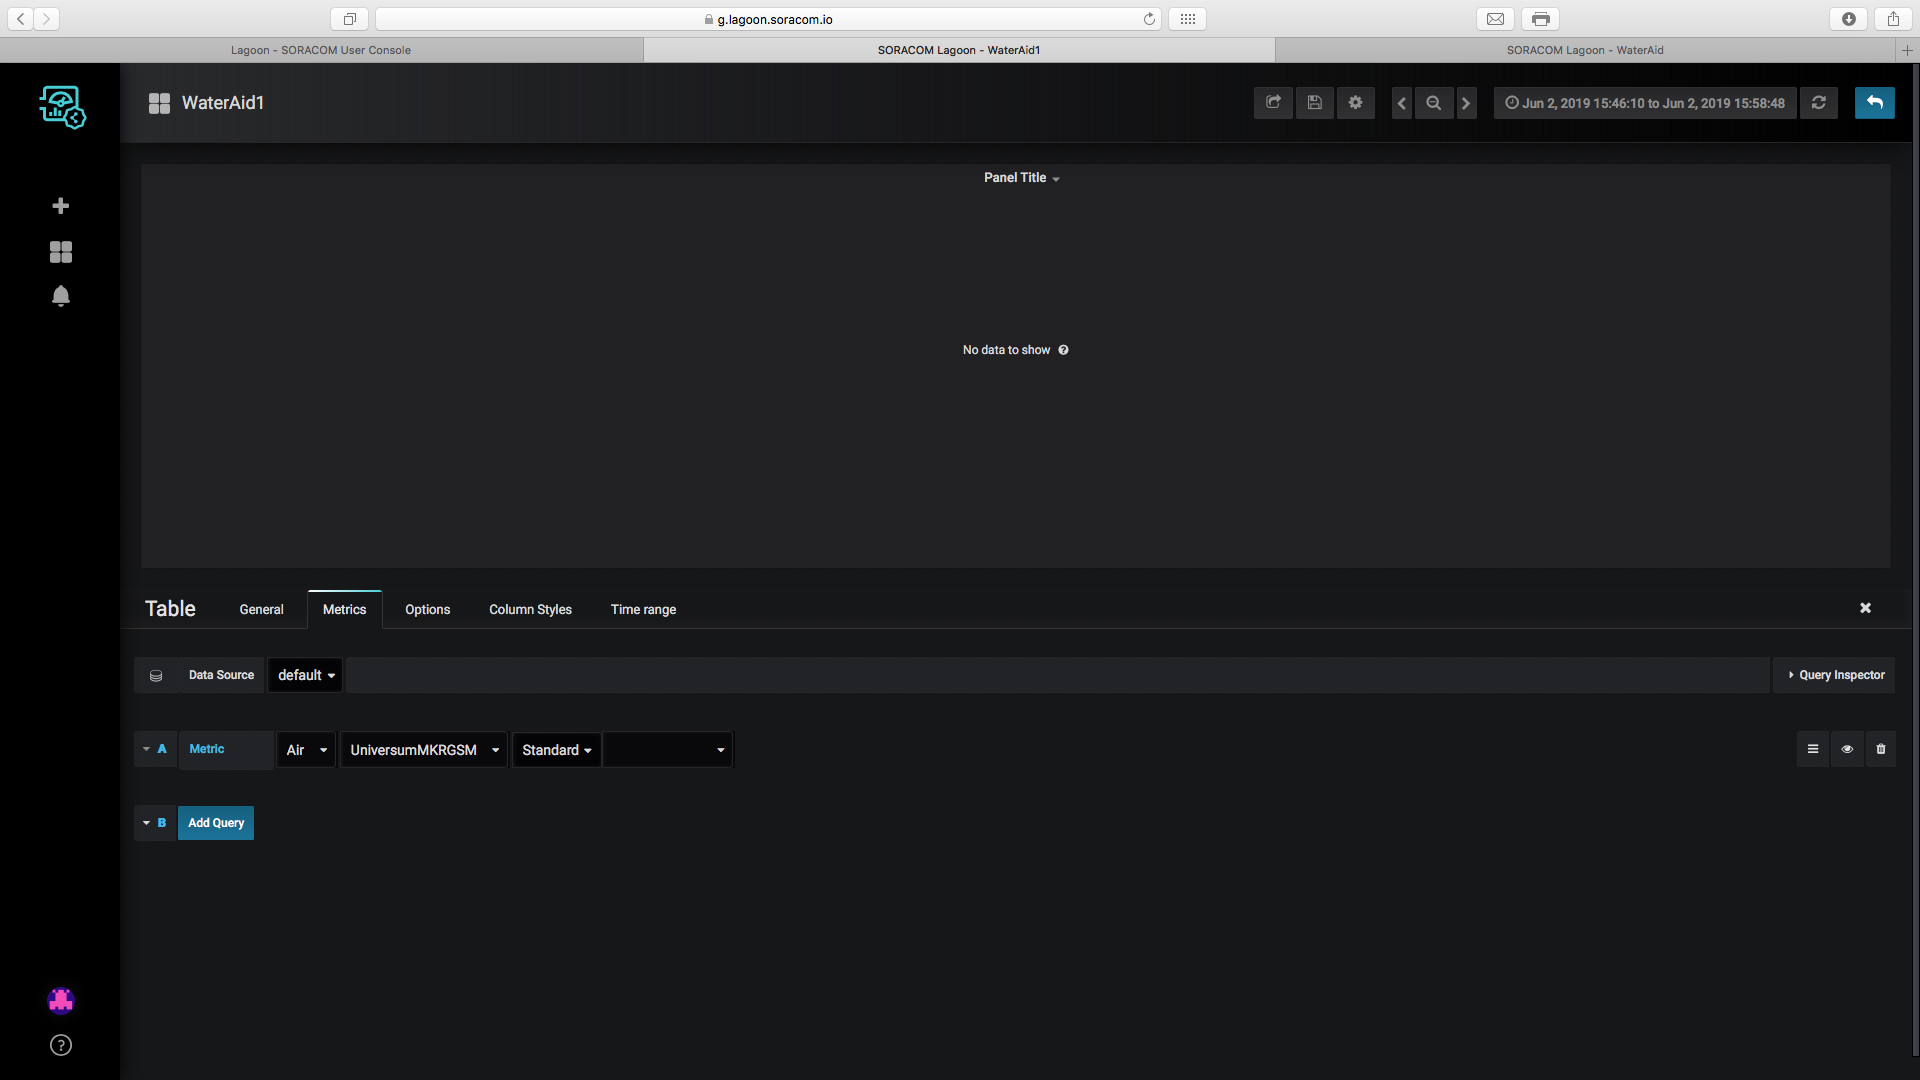
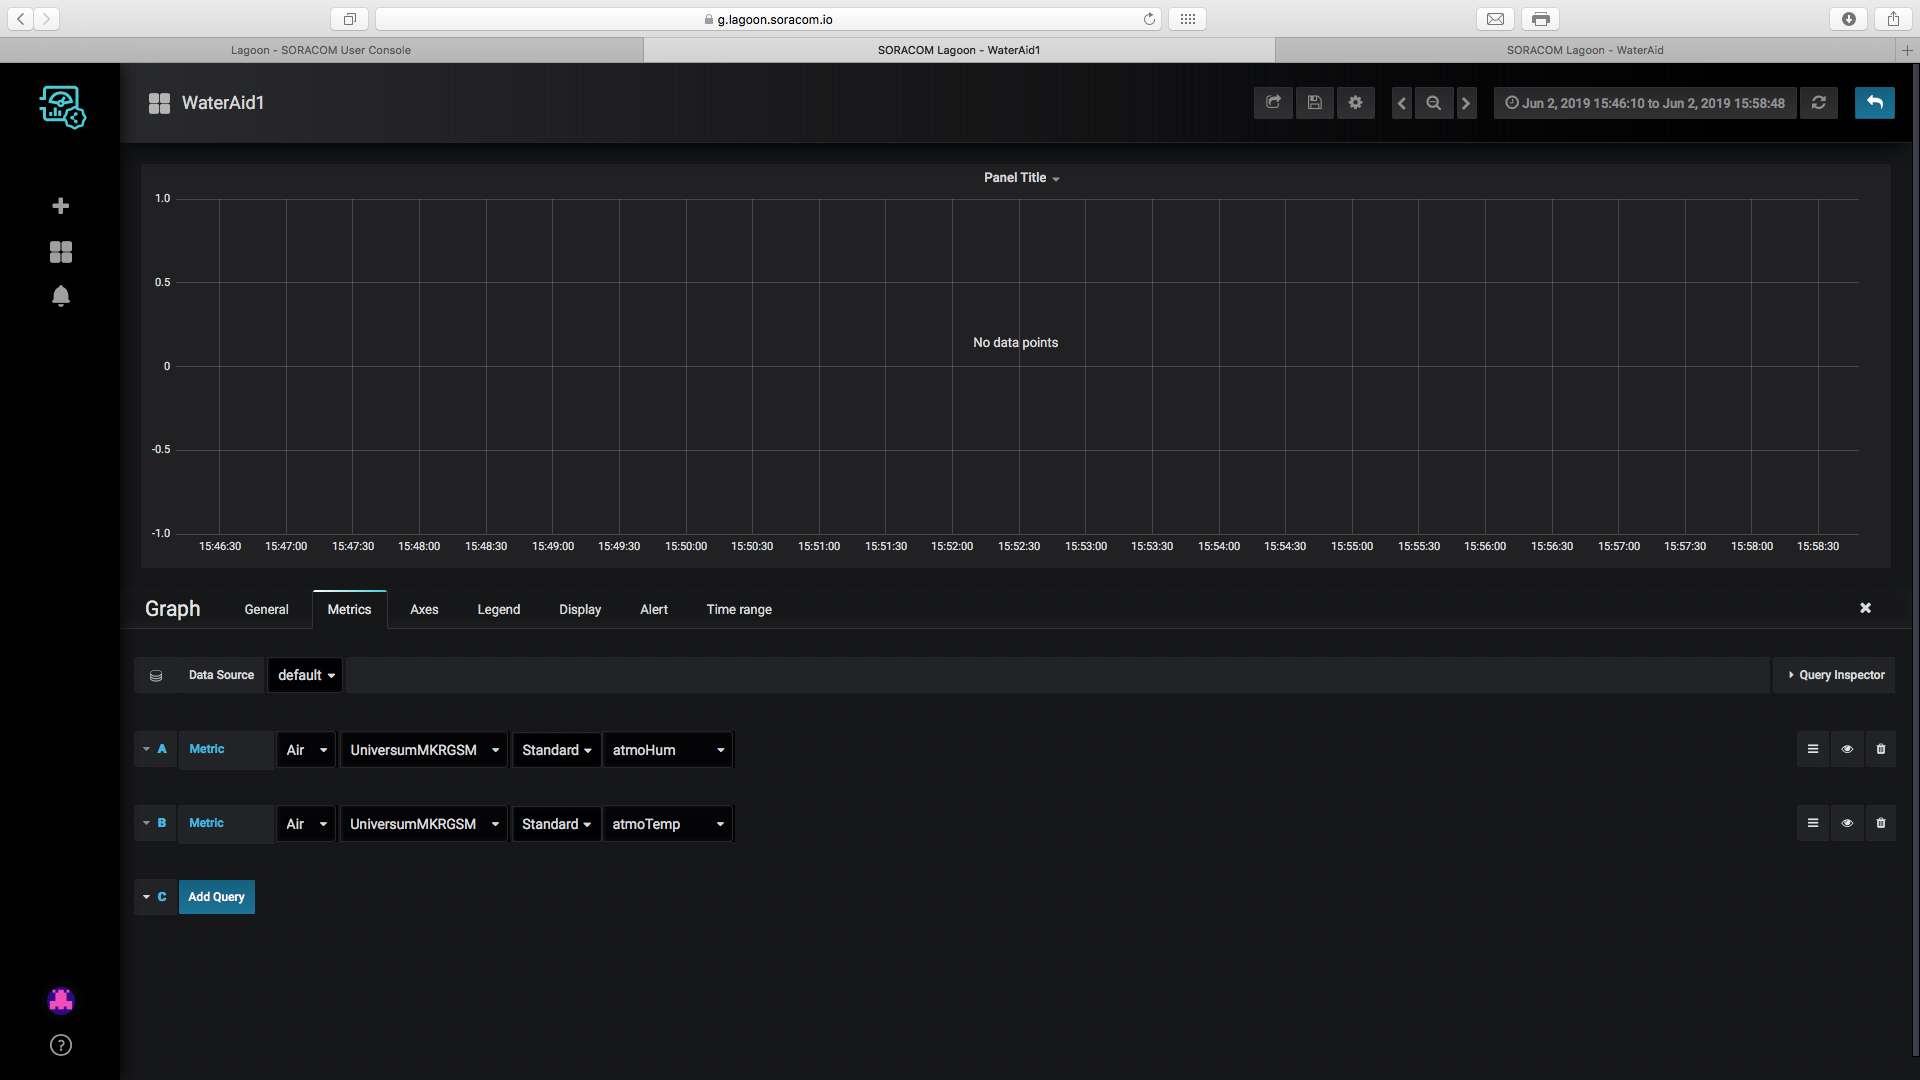
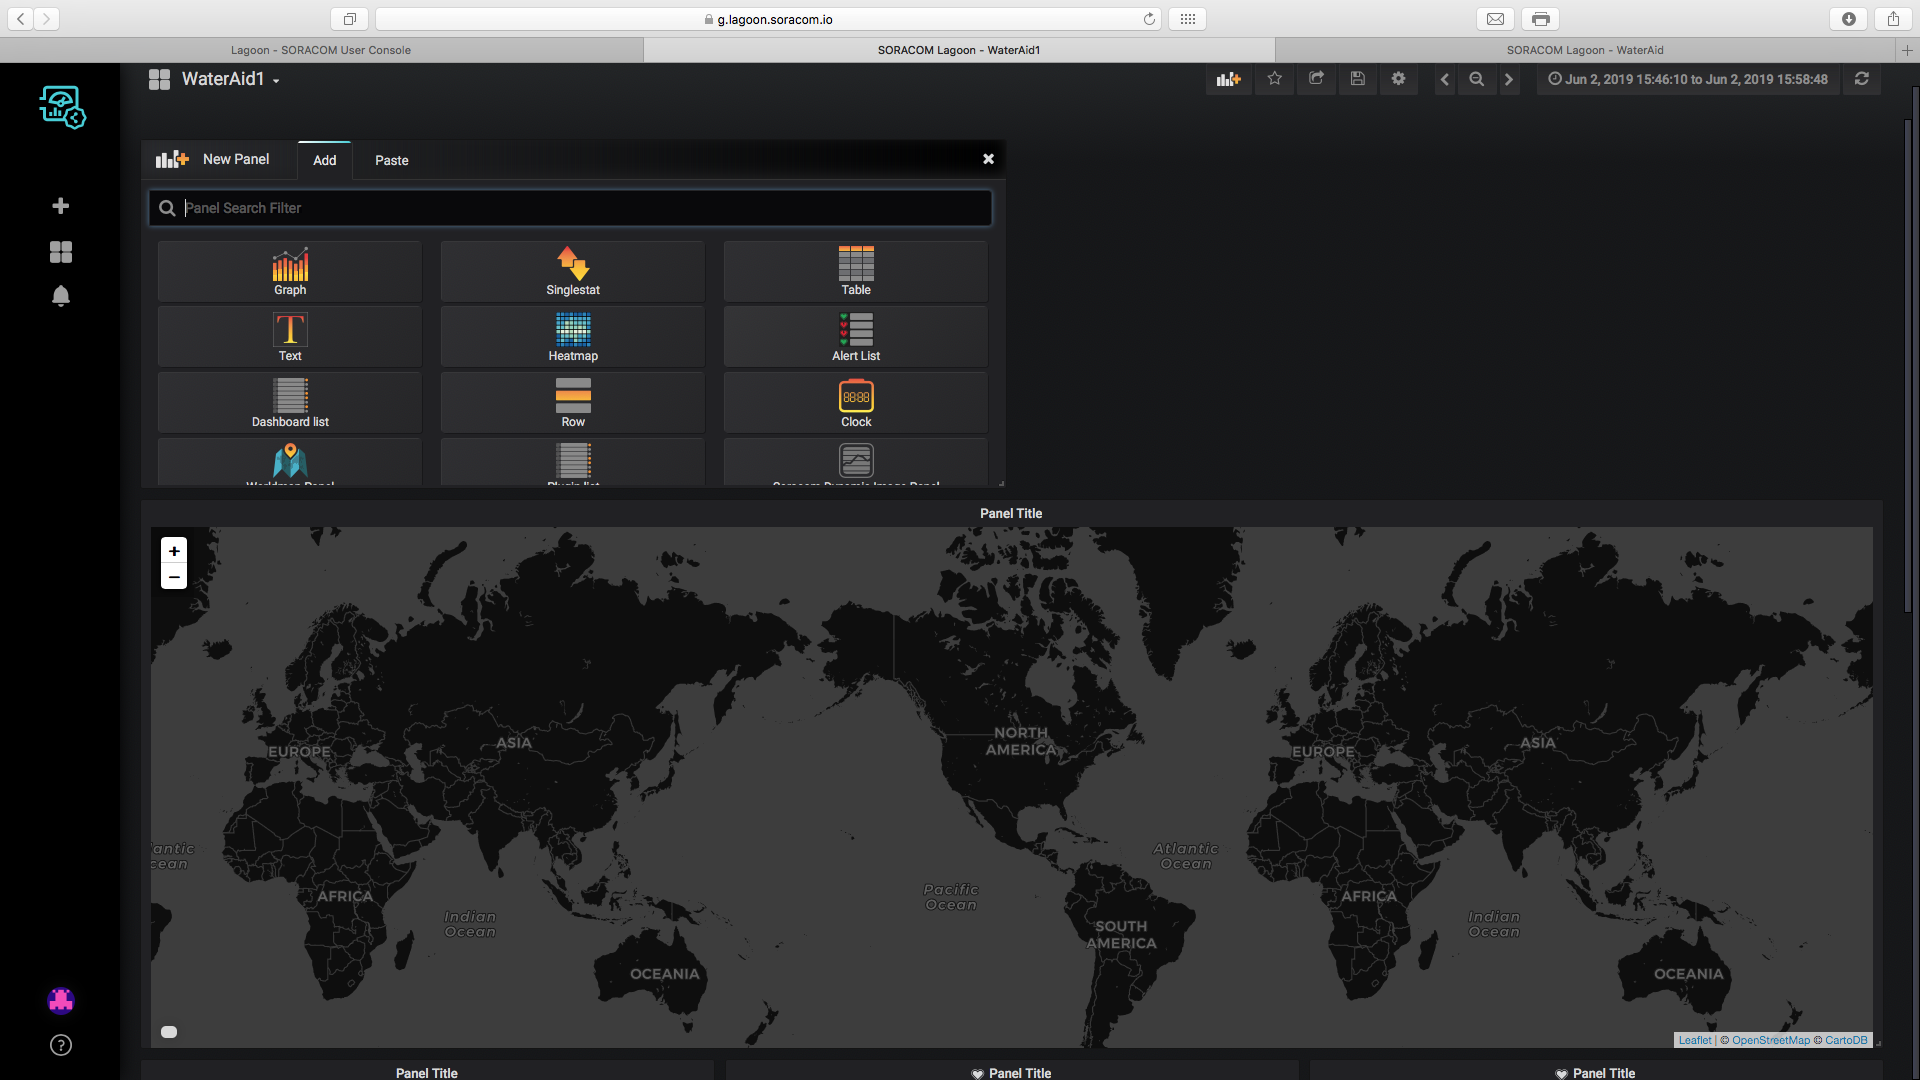
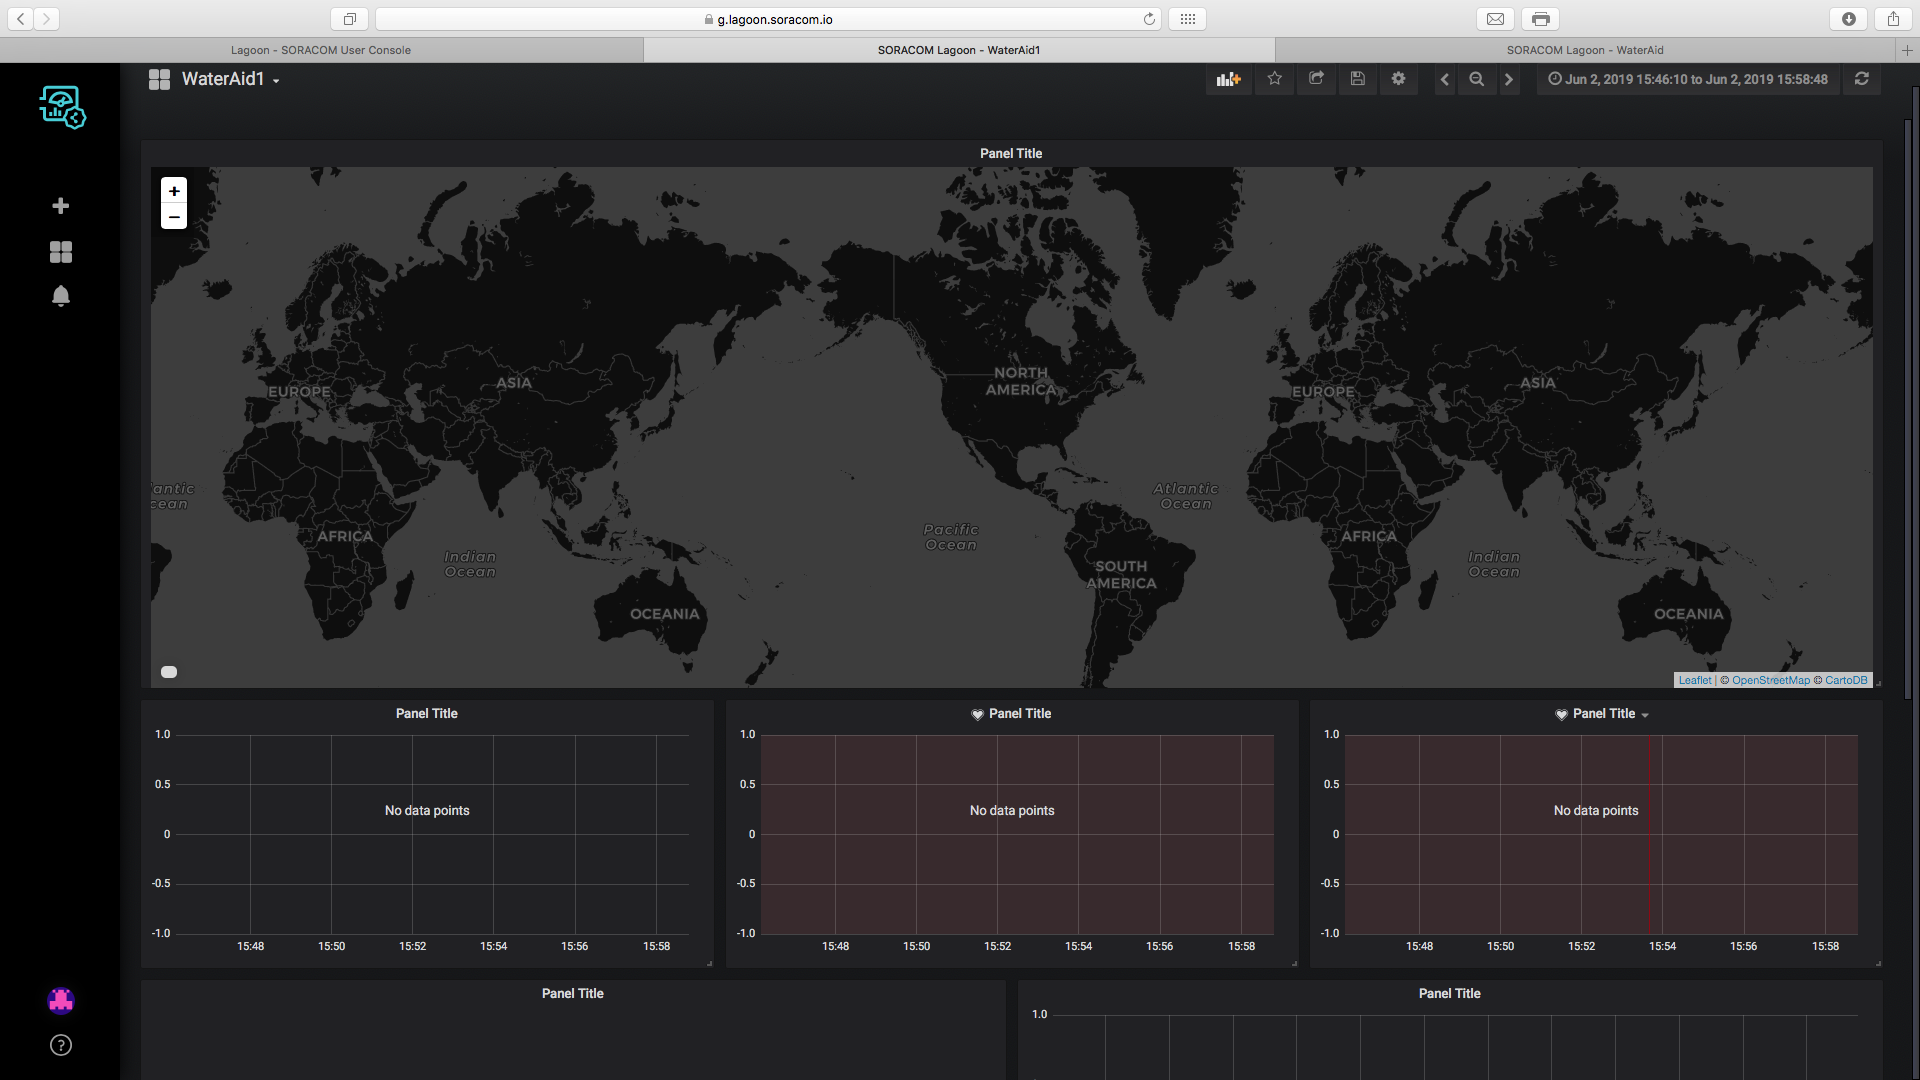
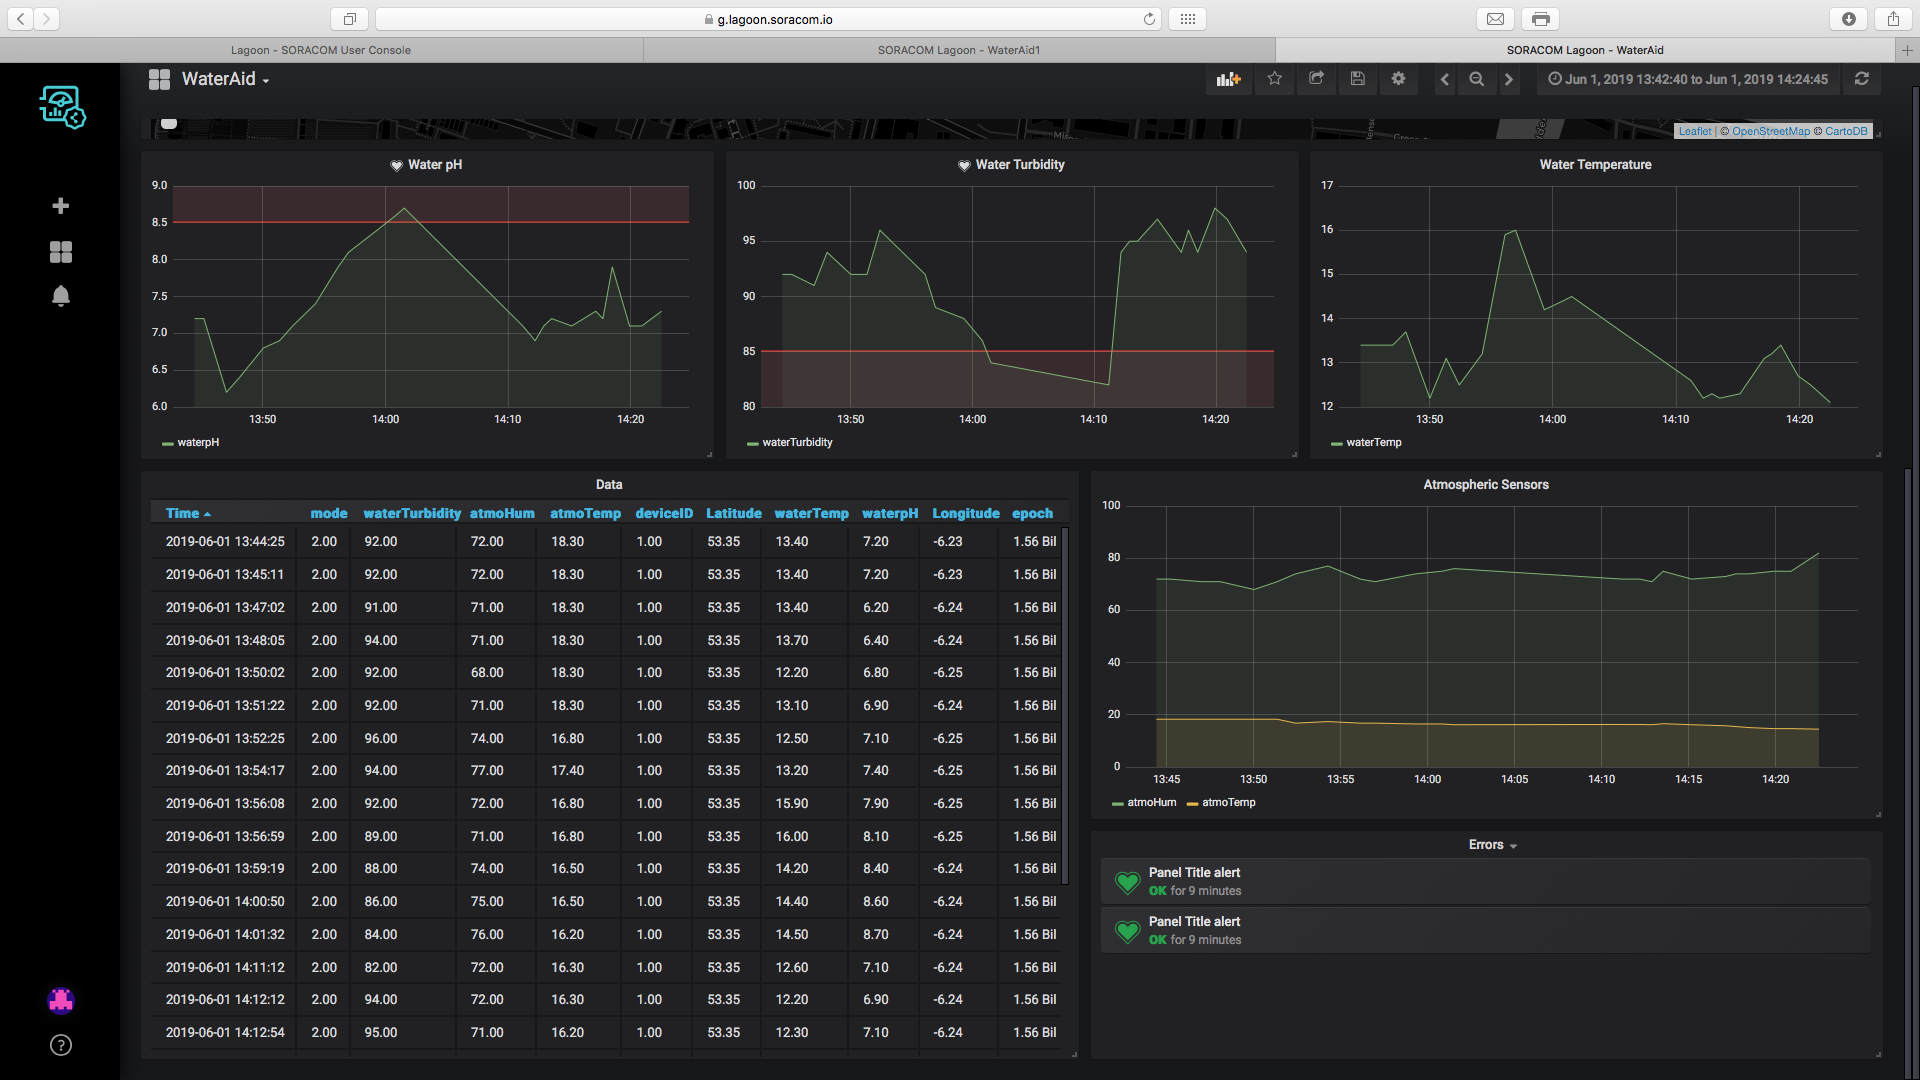
该项目的后端是指Soracom。数据在仪表板的后端收集和可视化。这些仪表板是使用 Soracom Lagoon 创建的。
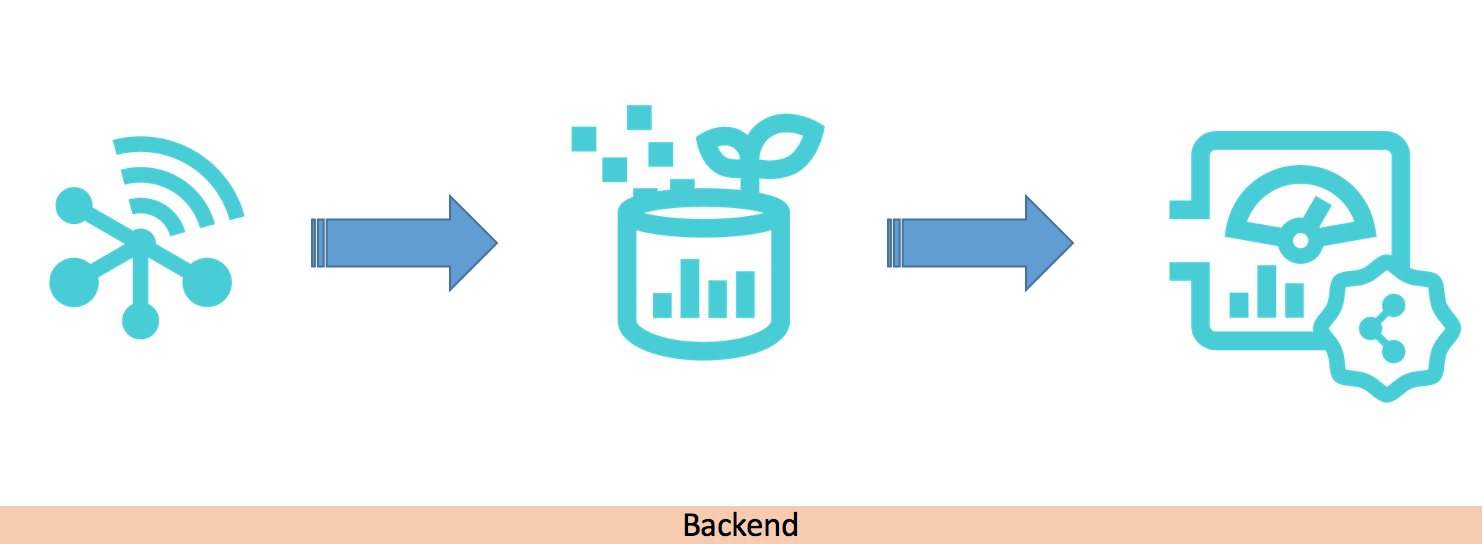
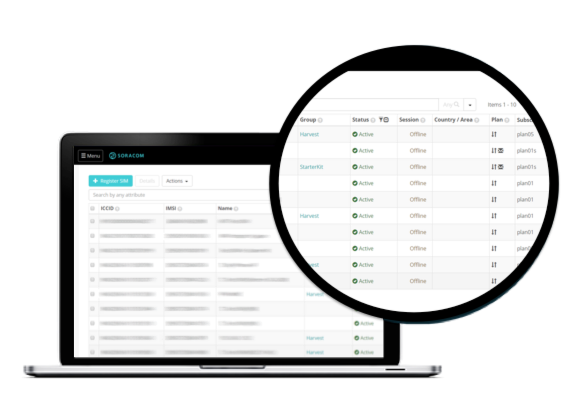
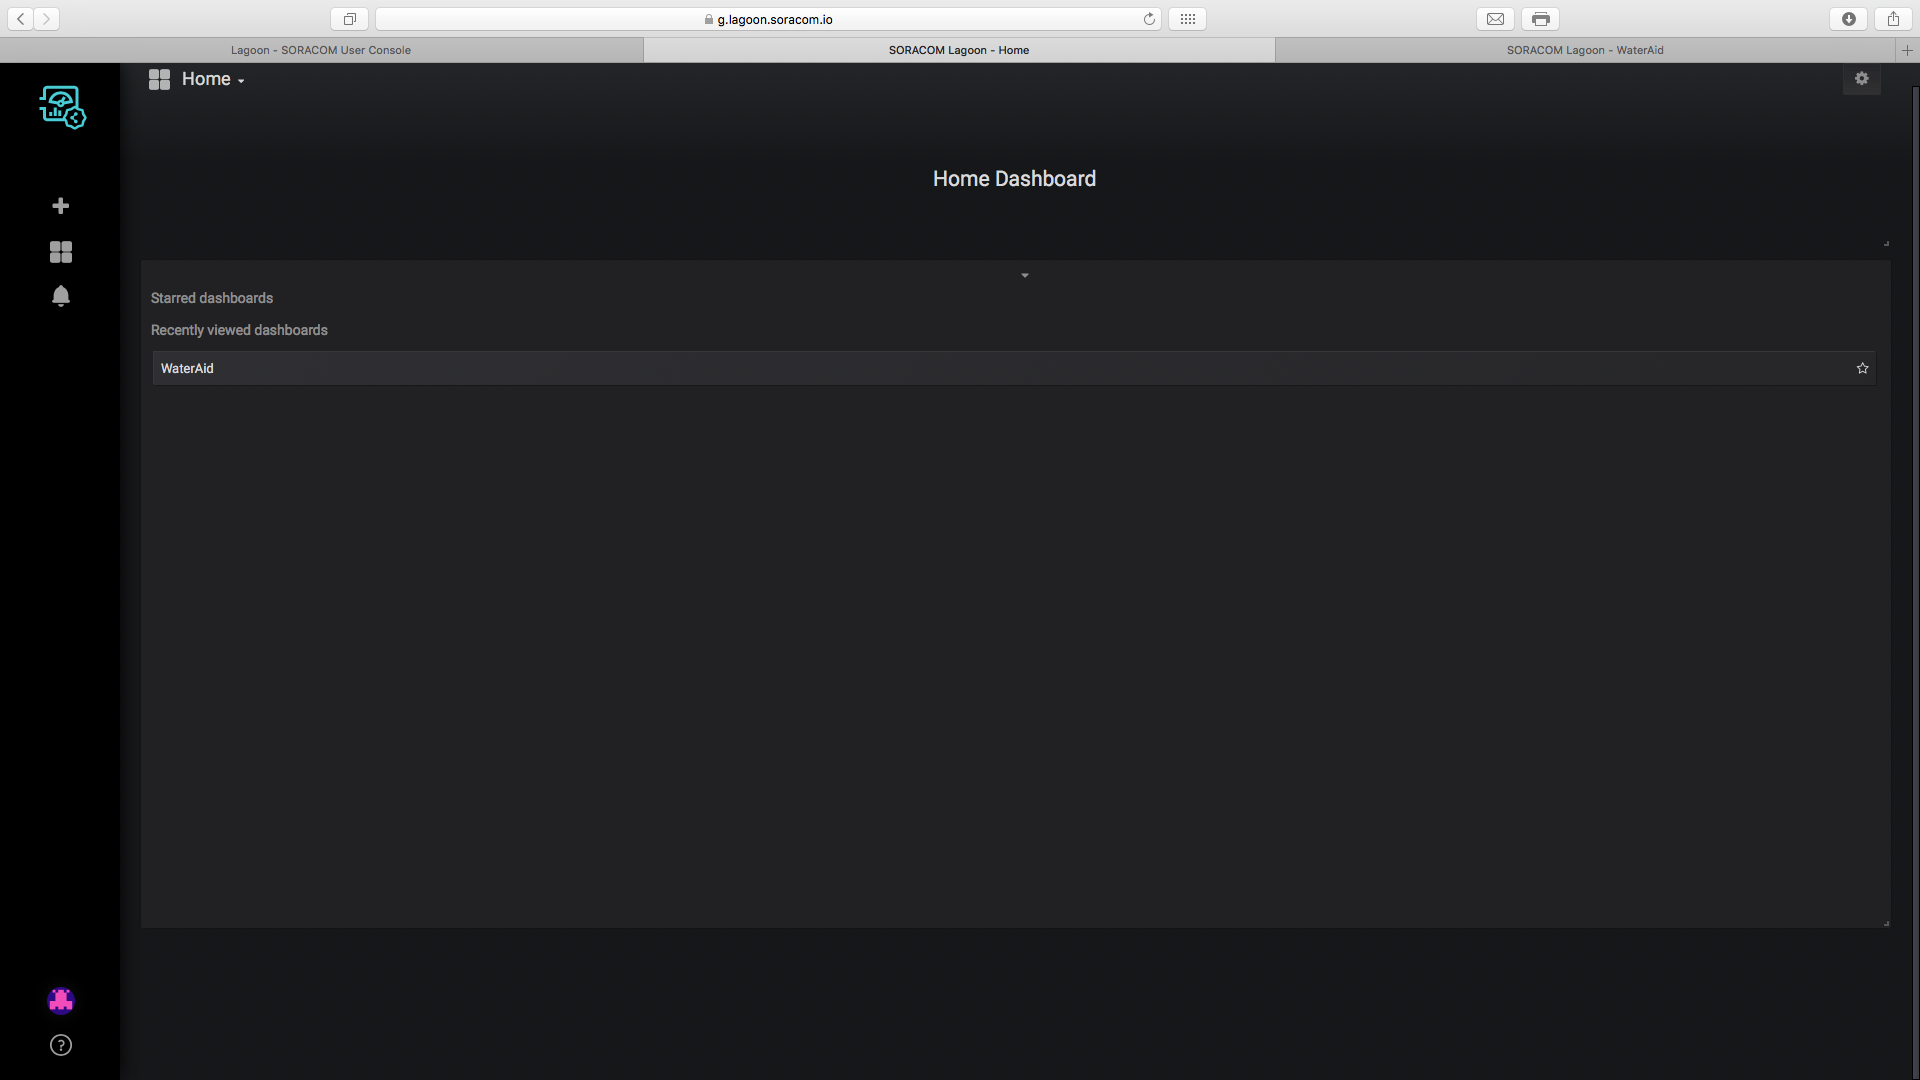
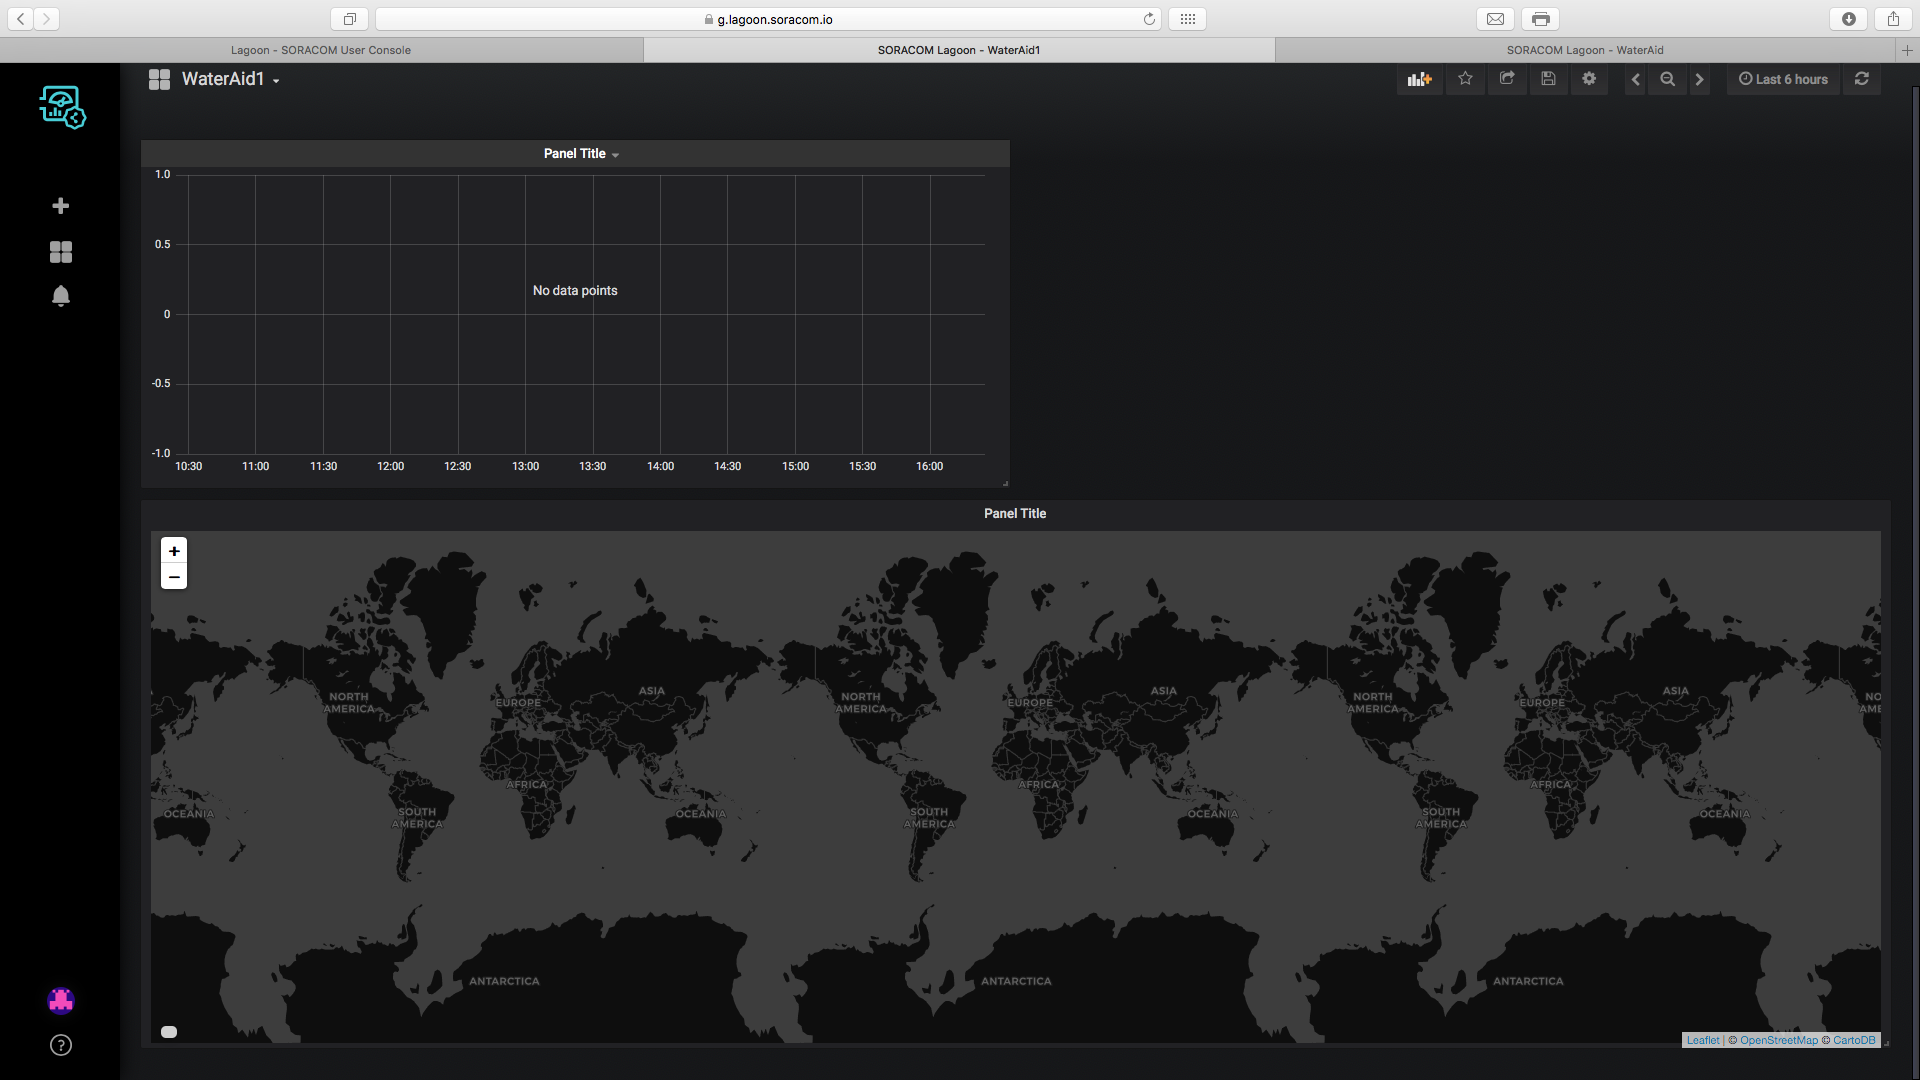
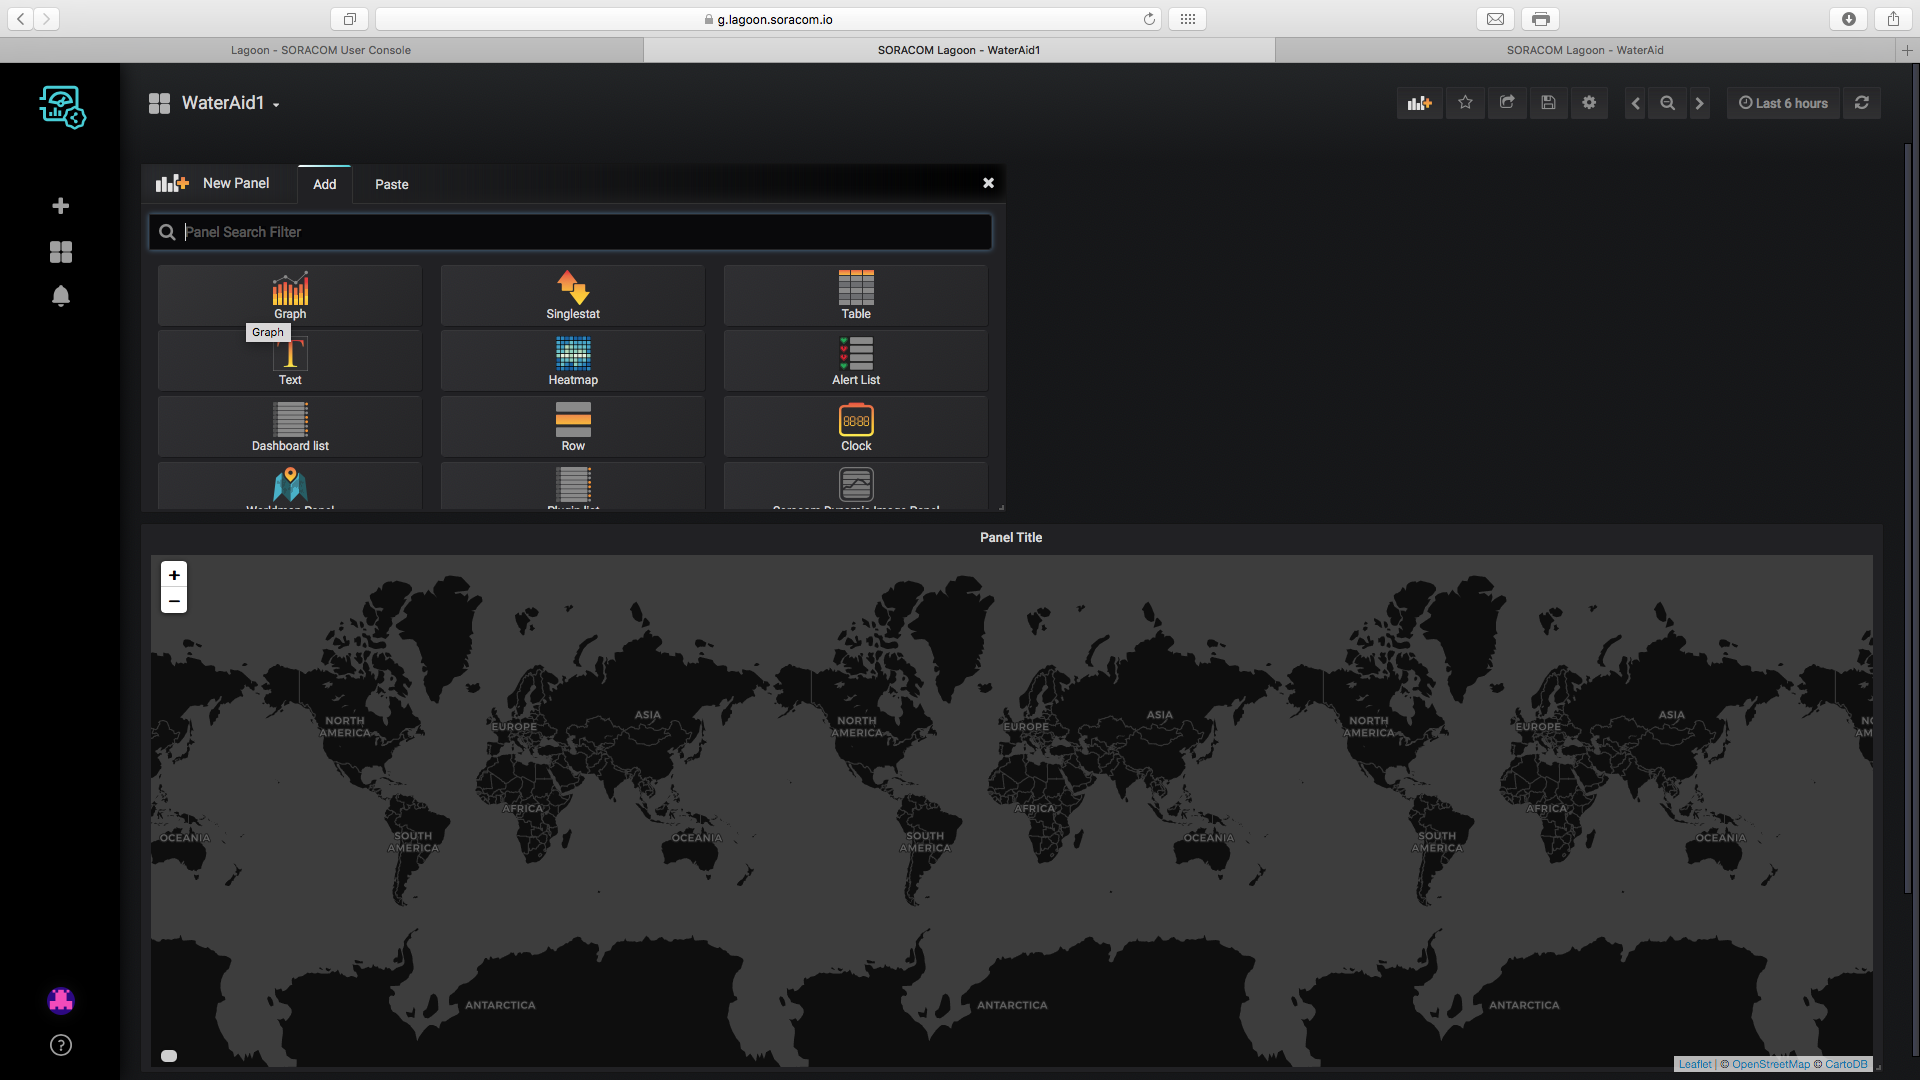
仪表板
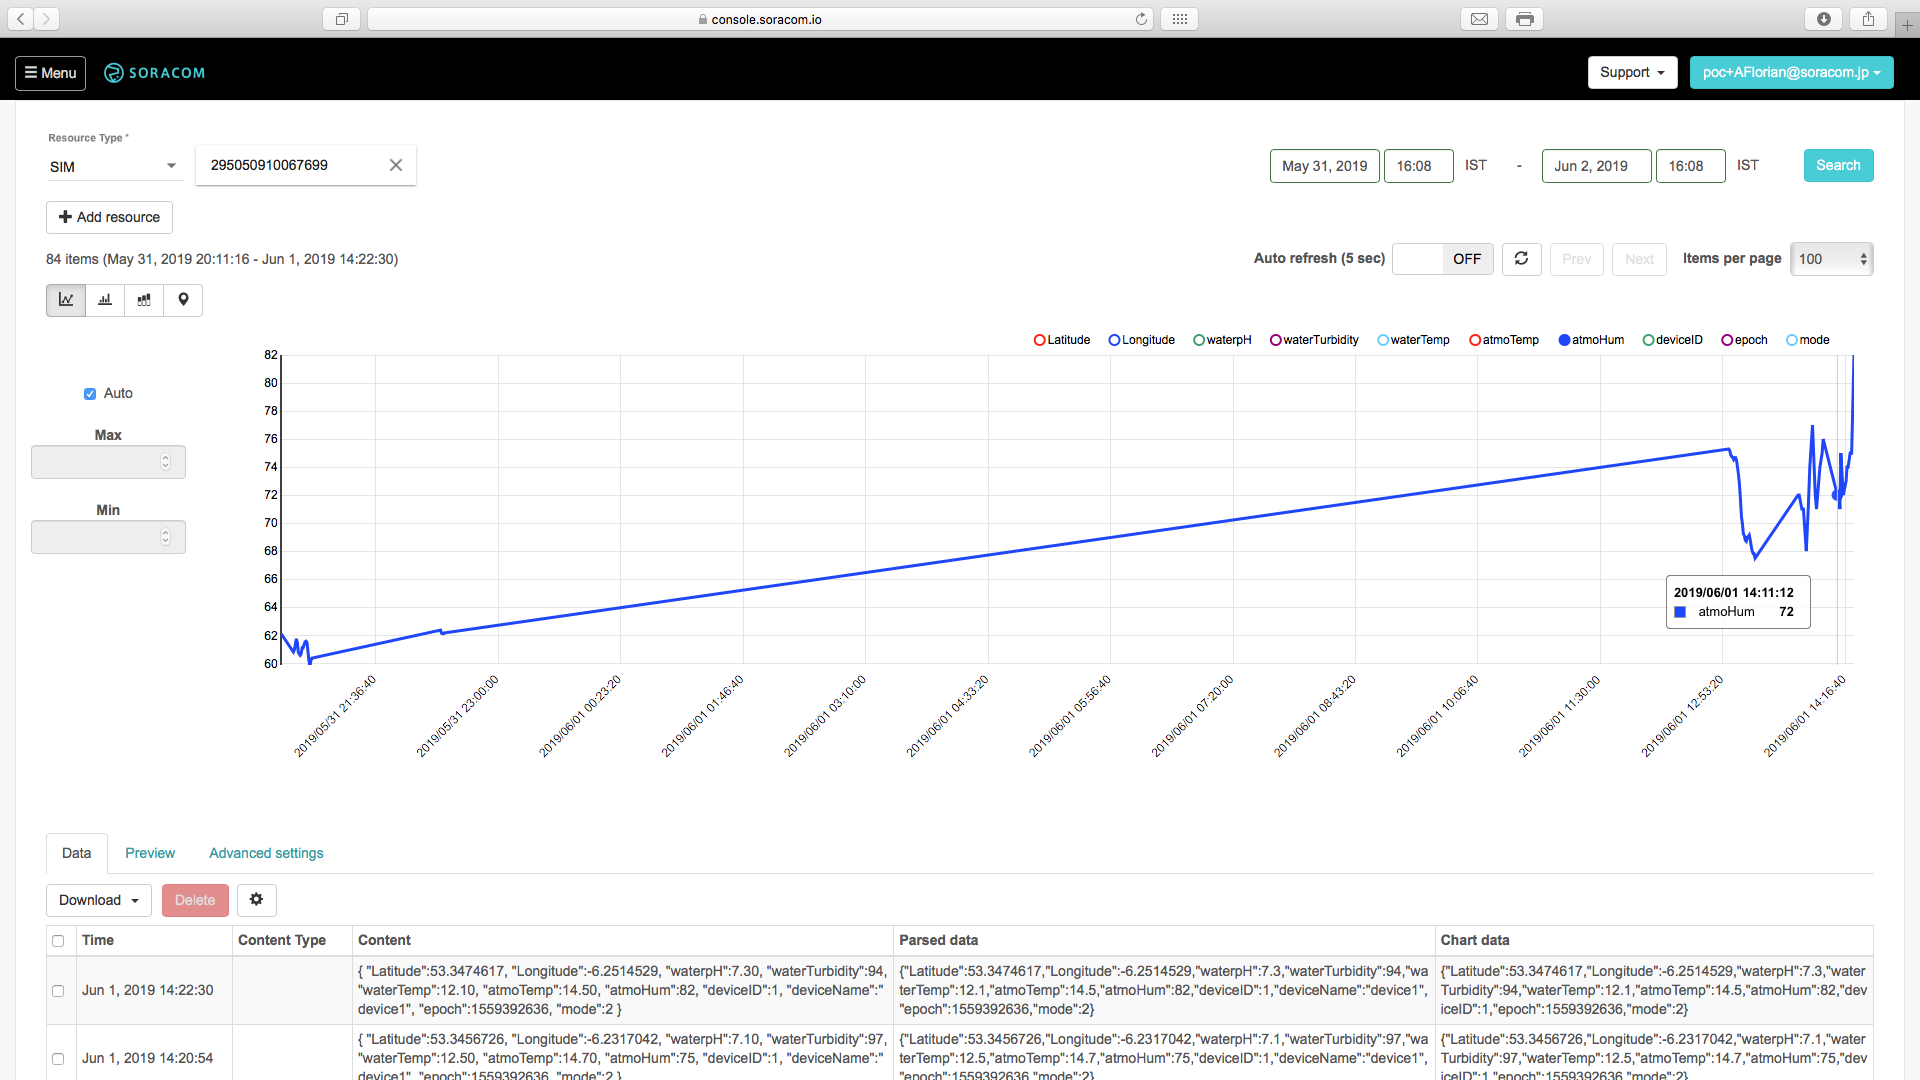
仪表板汇总了从设备收集的所有数据。它在地图上绘制了收集数据的地点,颜色根据水的污染程度而变化。然后将数据绘制在其下方的折线图上,然后在表格中完全汇总。
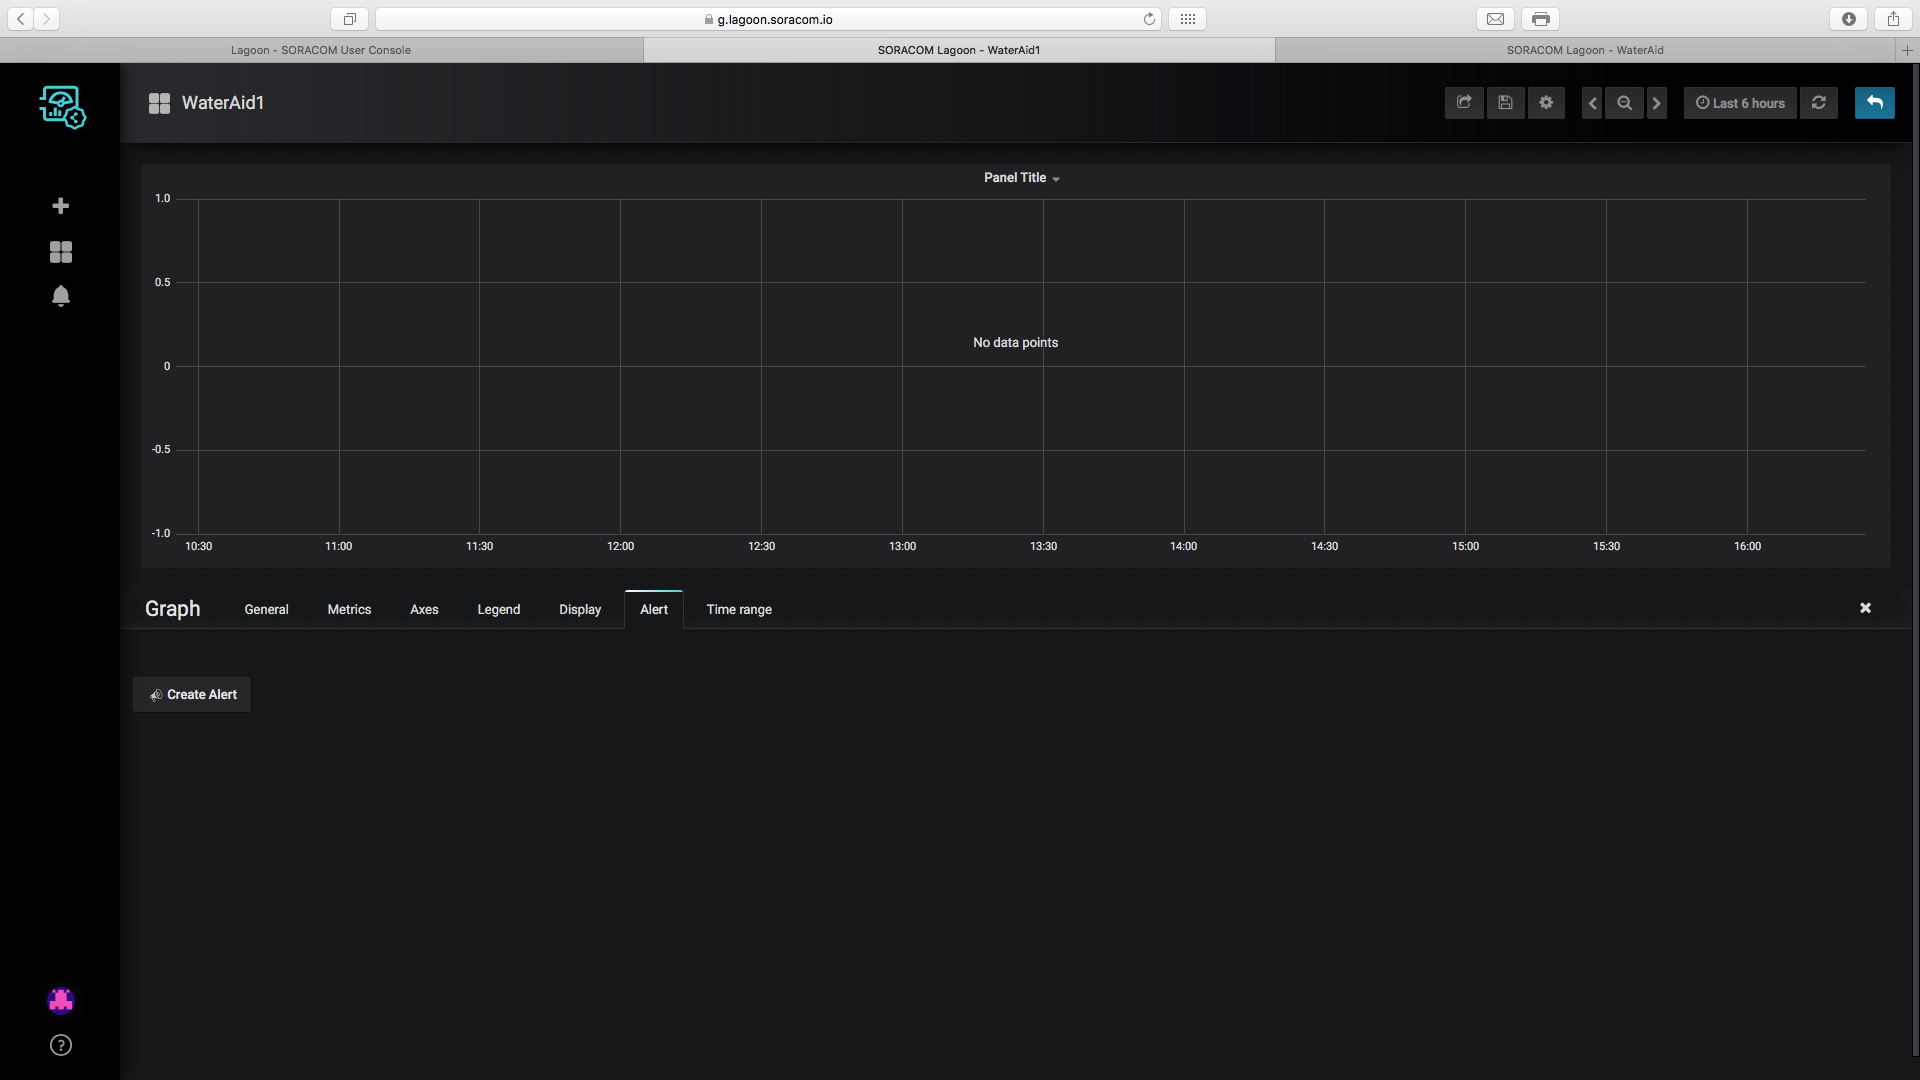
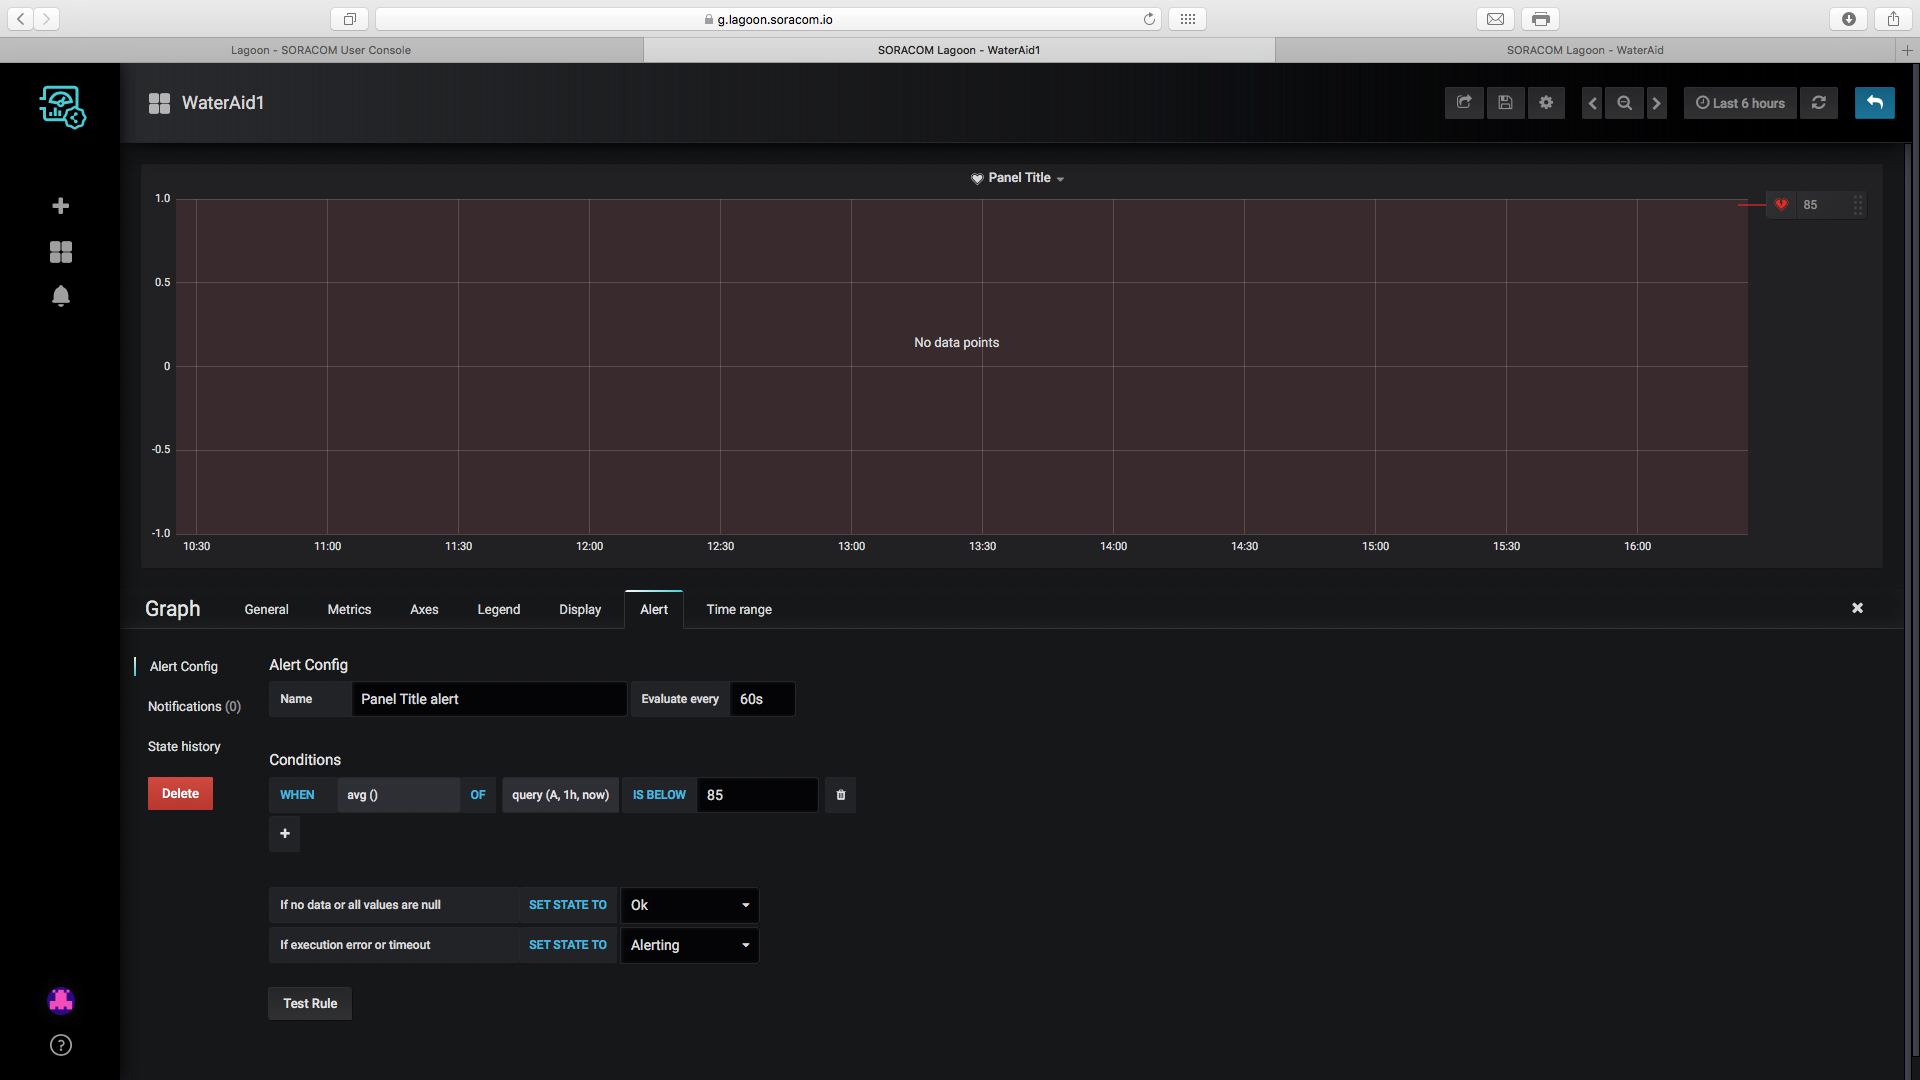
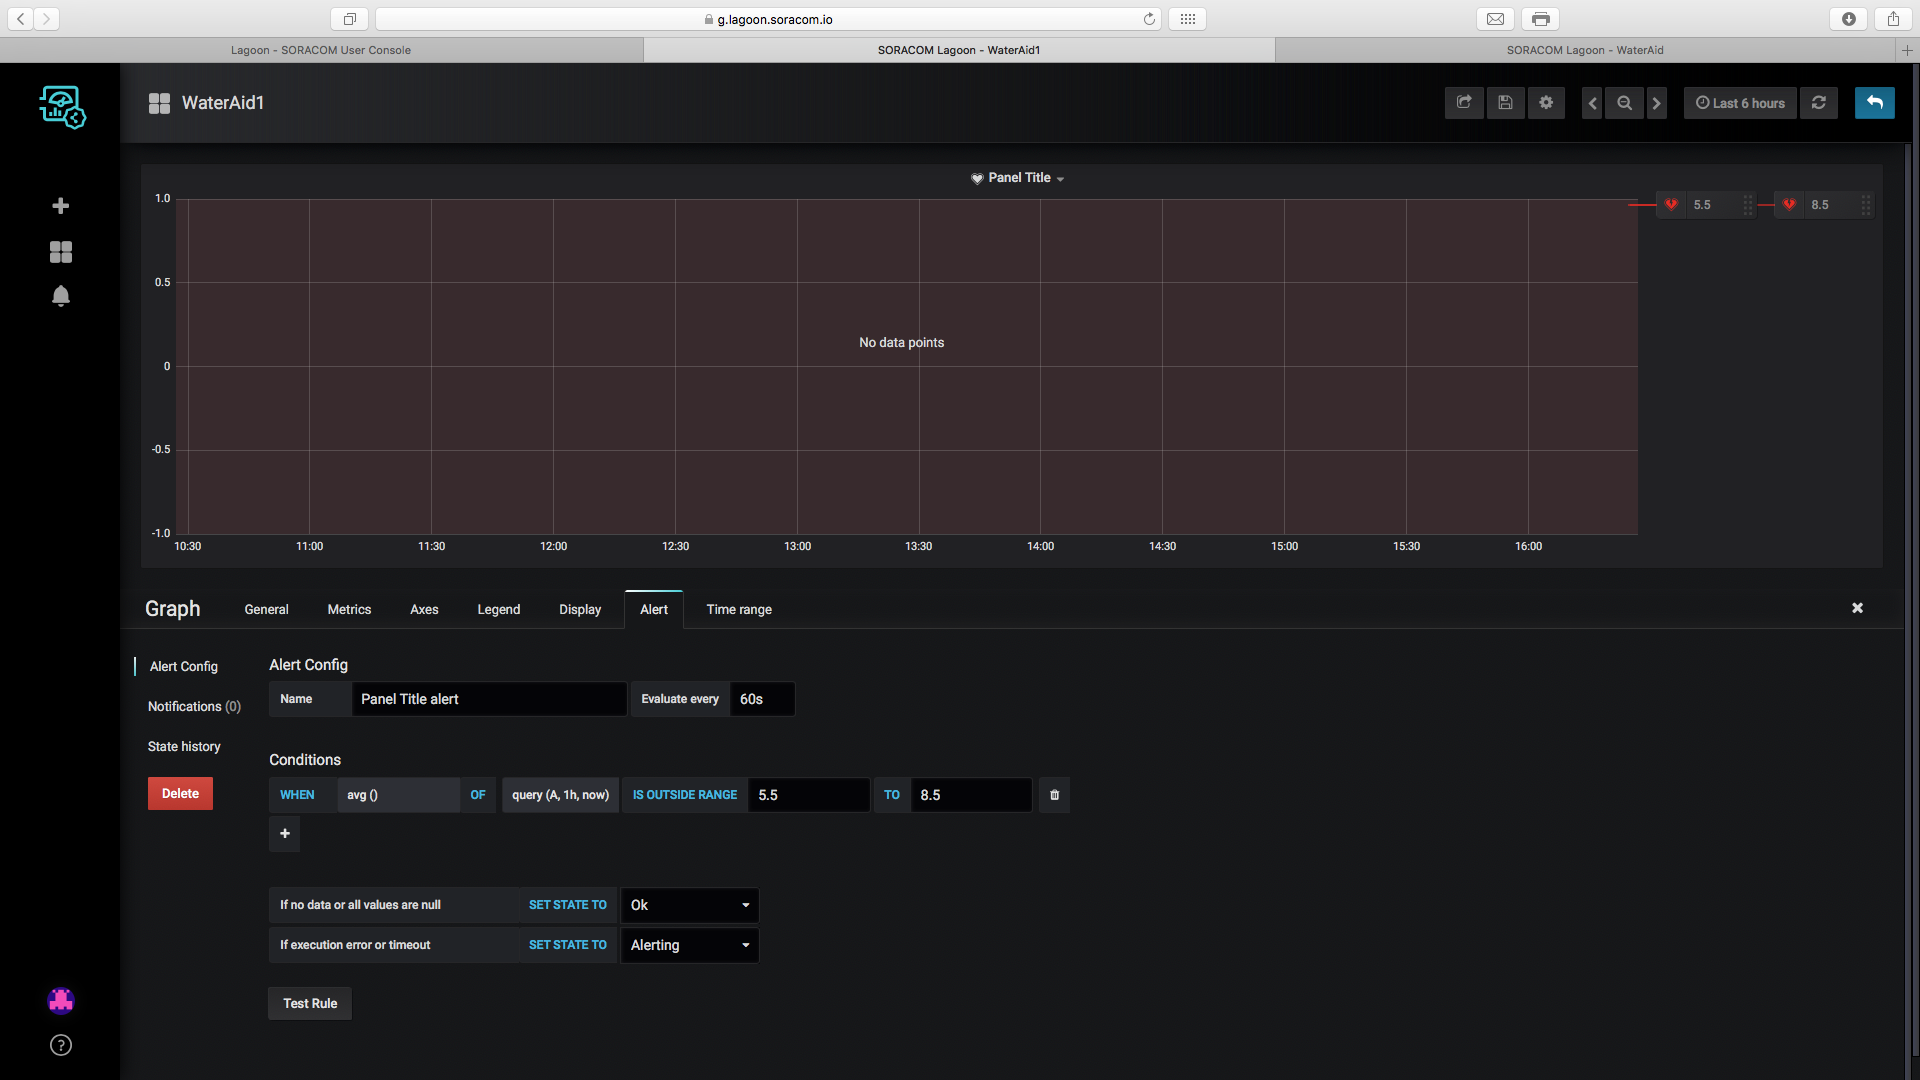
如果水的 pH 值或浊度值异常,用户也会通过电子邮件收到警报。以下是仪表板的一些屏幕截图。

可扩展性
该设备可以轻松扩展,所有数据都可以在同一个仪表板上收集和说明。多个设备可以将数据流式传输到 Soracom 并在仪表板上可视化数据。
该设备的价格以及极其易于构建和编程,使得使用一系列设备变得容易。这些设备也可以使用 Soracom Krypton 等工具轻松注册到 Soracom。
每个企业或个人都将拥有自己的个性化仪表板,其中将可视化其设备收集的数据。希望在不久的将来,人们能够在同一个仪表板上进行协作并相互共享他们的数据。
好处
使用此产品的个人或公司将受益于:
- 降低了运行成本,因为该设备非常自给自足。
- 易于扩展,该设备可以轻松单独工作或与其他数十人一起工作。
- 快速数据收集,允许将数据推送到云端并实时可视化。
- 易于可视化,可以使用在线仪表板随时随地可视化数据。
建设项目
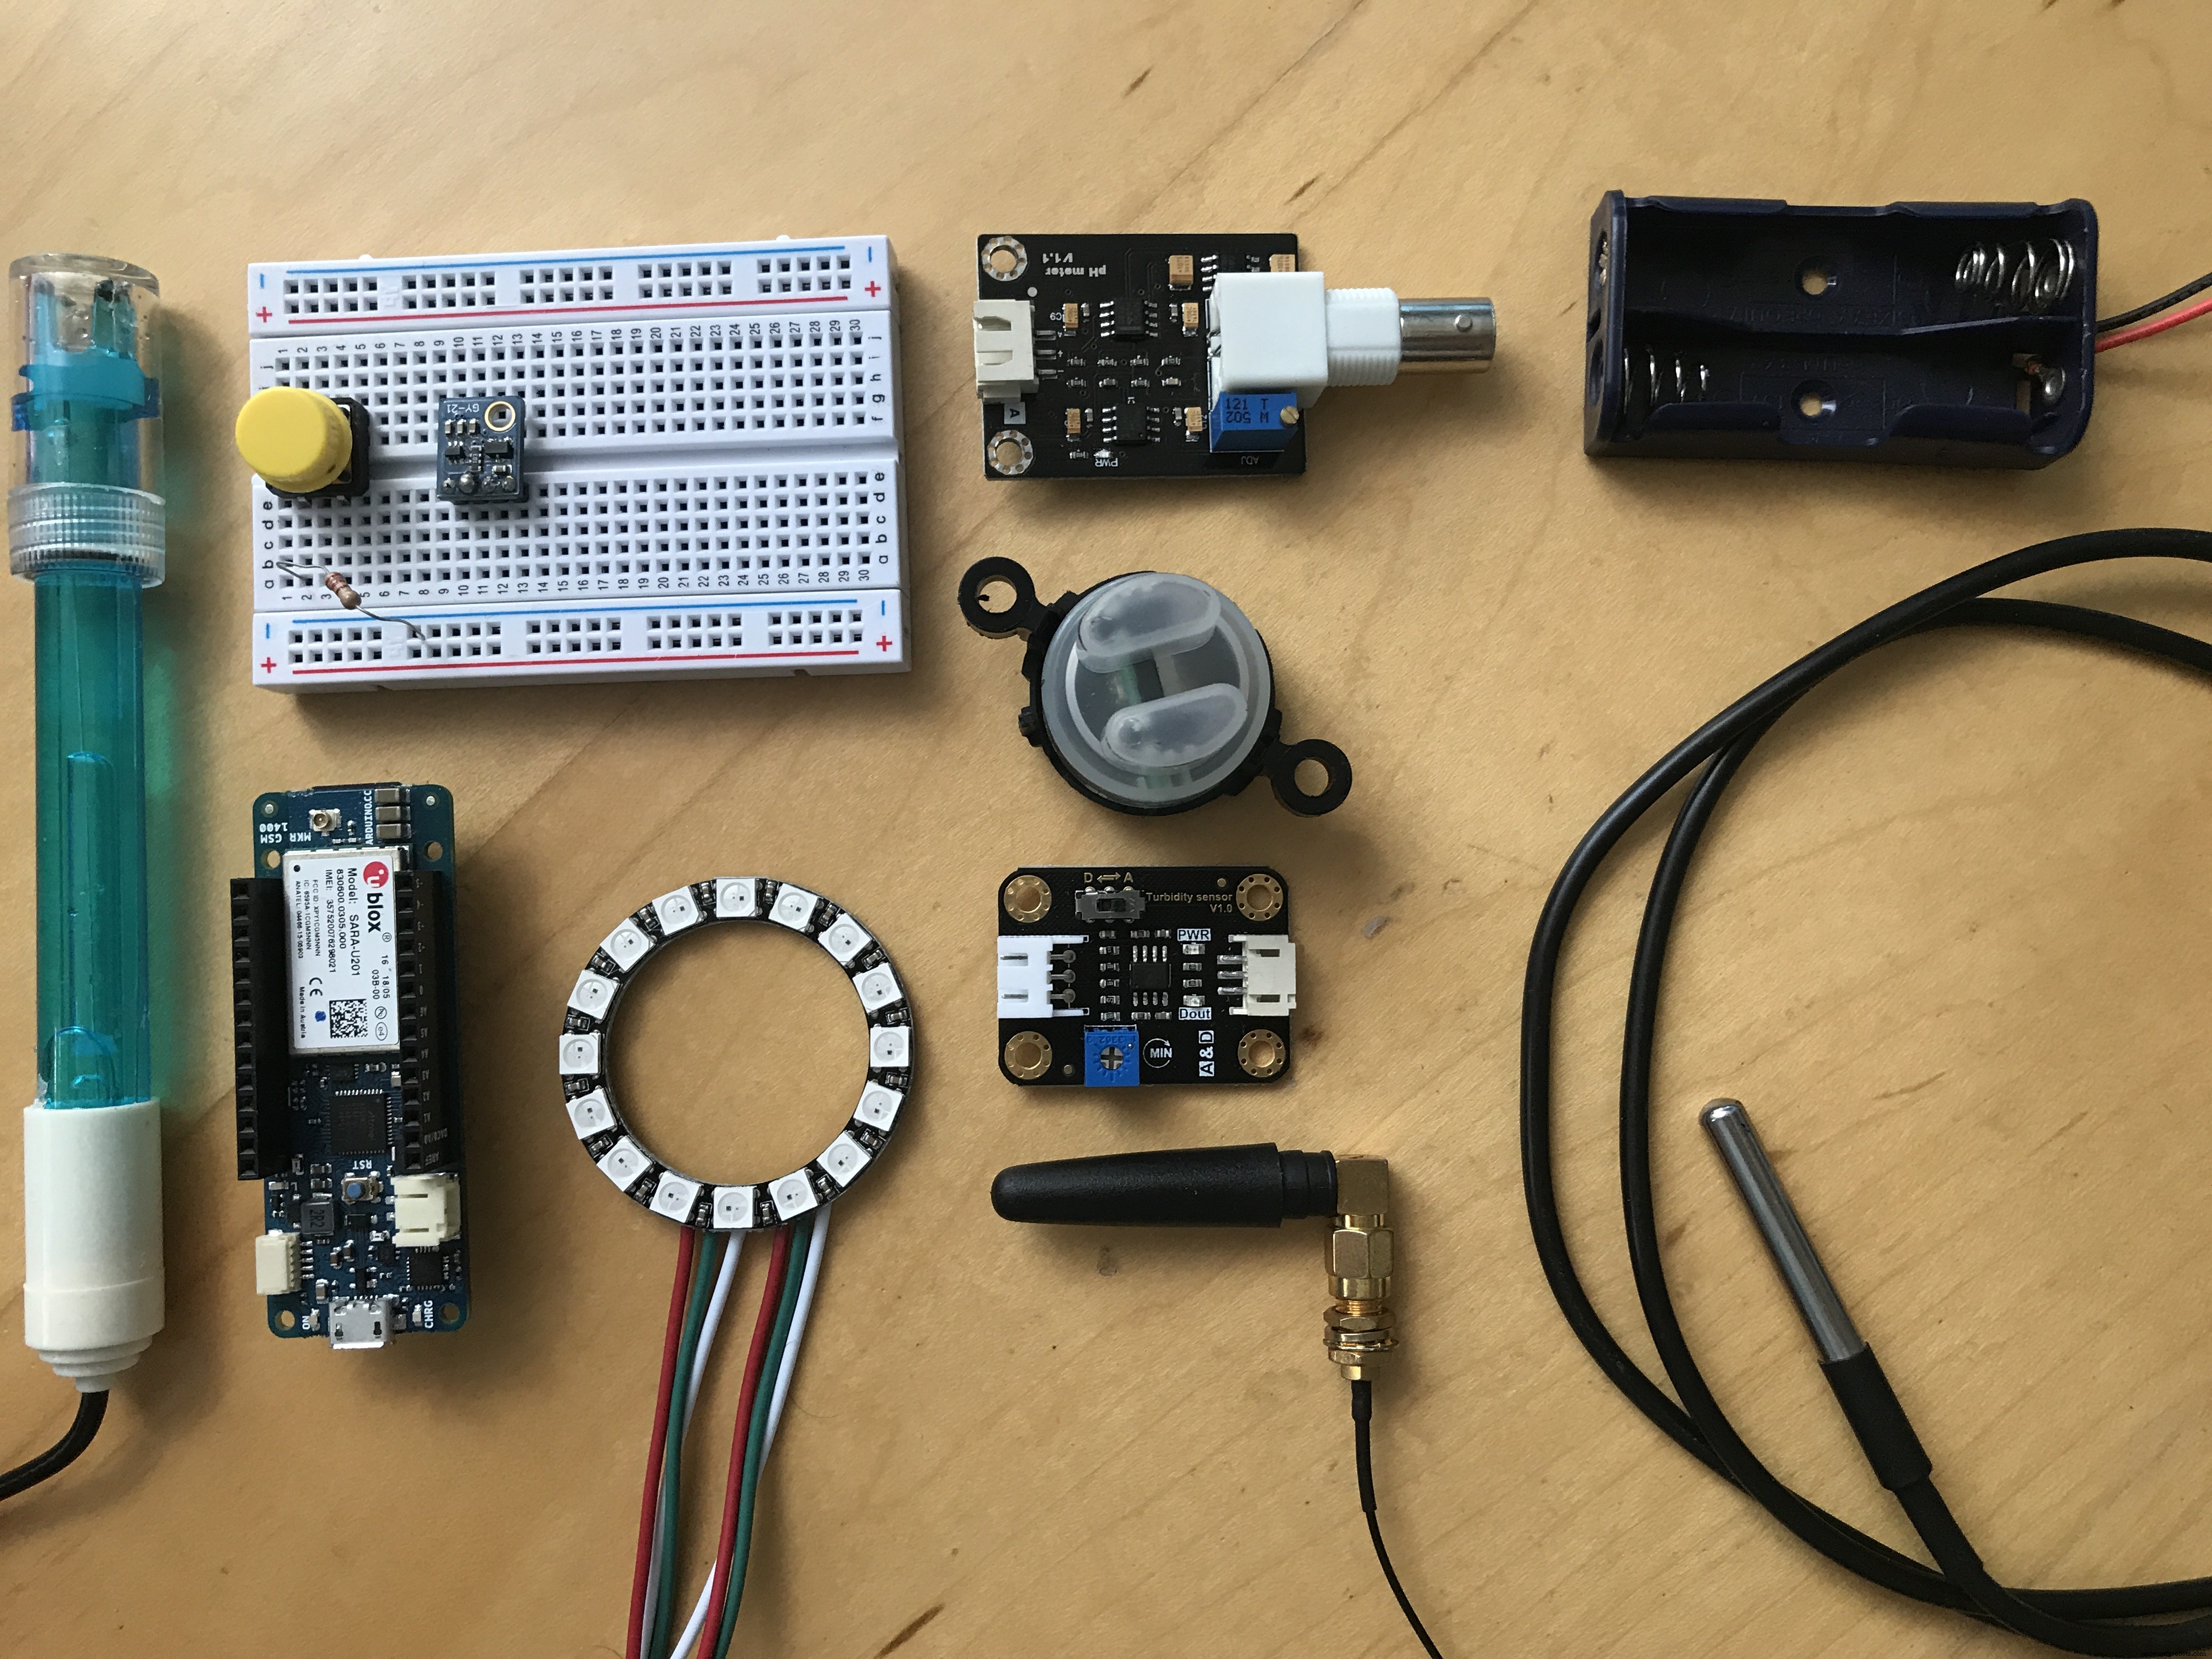
第 1 步:所需设备
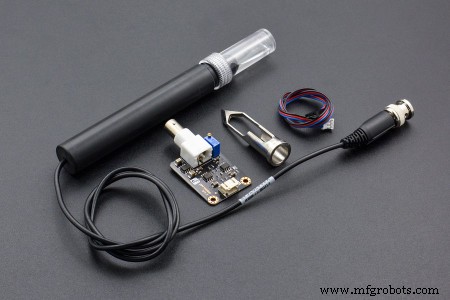
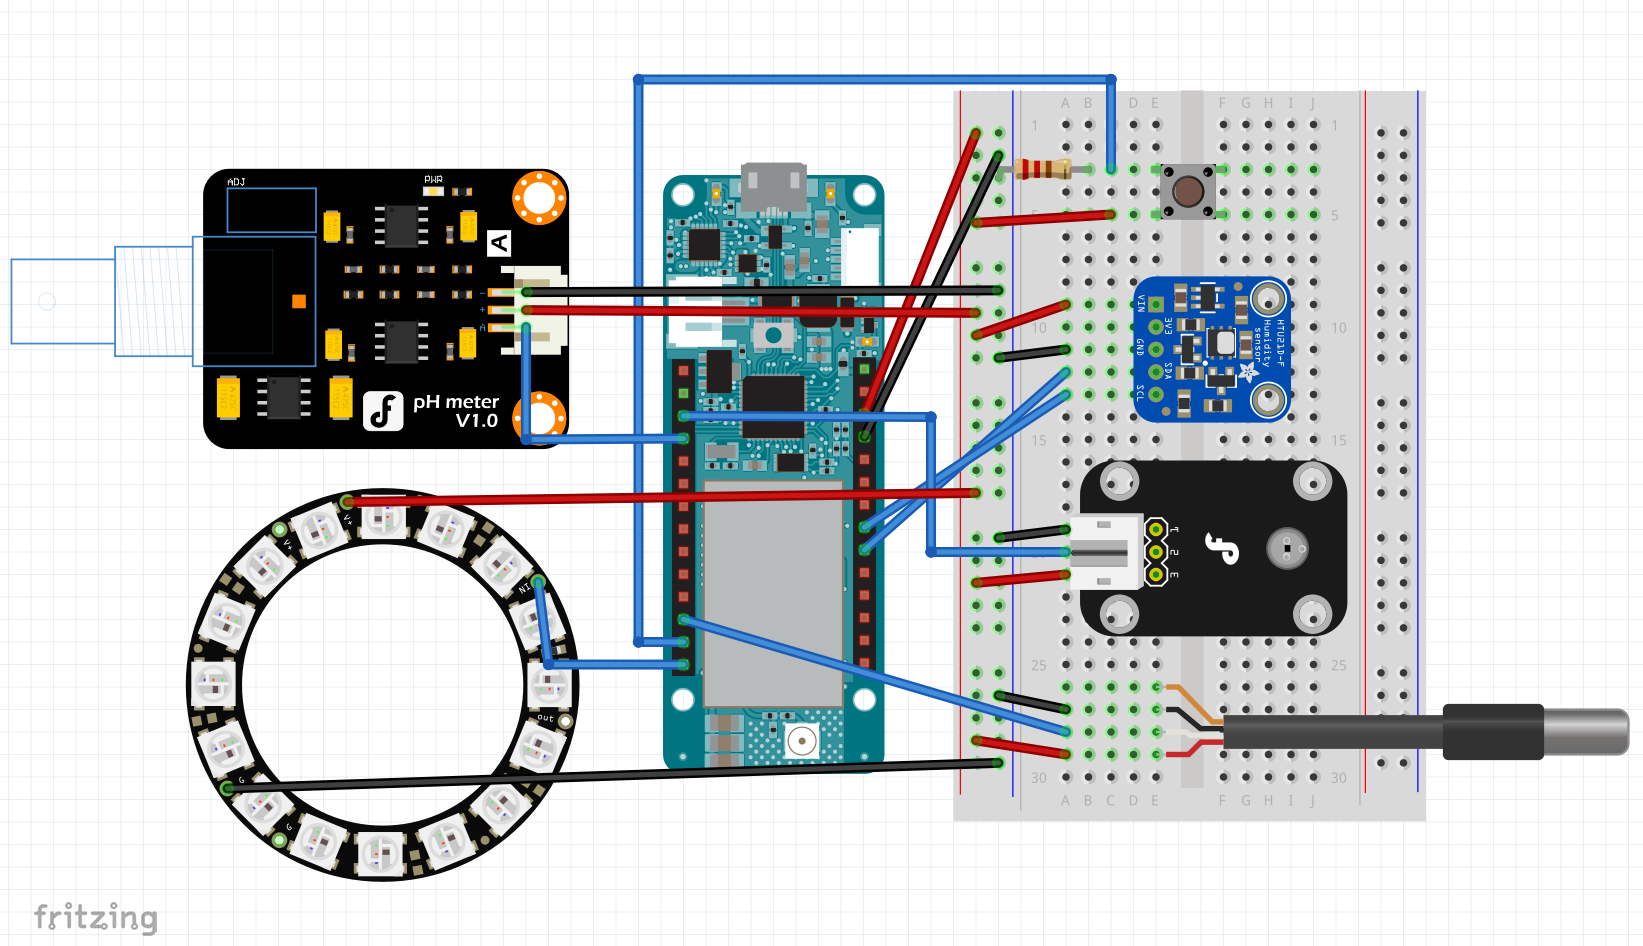
这个项目需要很多传感器来监测很多与水和大气相关的参数。下面是所有需要的材料清单。
- 1、Arduino MKR GSM
- 1, 16 个 LED RGB LED 环
- 1、GY-21温湿度模块
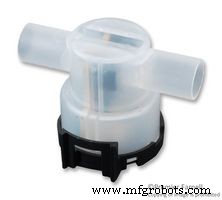
- 1、浊度传感器
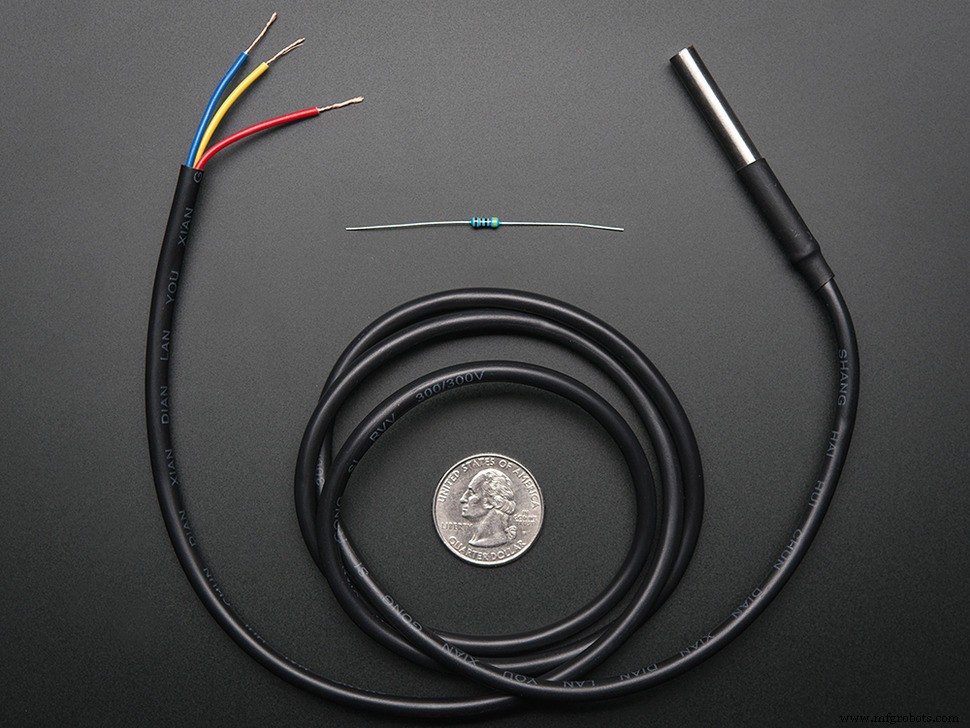
- 1、防水温度传感器
- 1、pH 传感器和模块
- 1,按钮
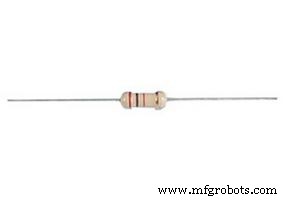
- 1、电阻(220Ω)
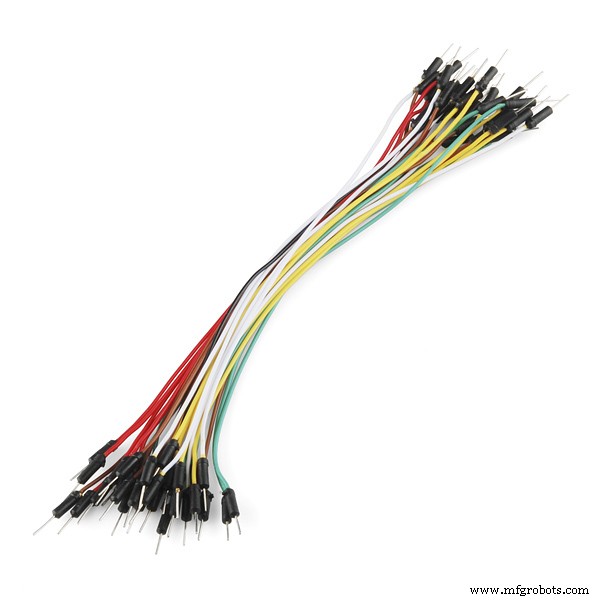
- 跳线
第 2 步:连接电路
组件应焊接在一起。为了便于理解原理图,使用了面包板。原理图如下。

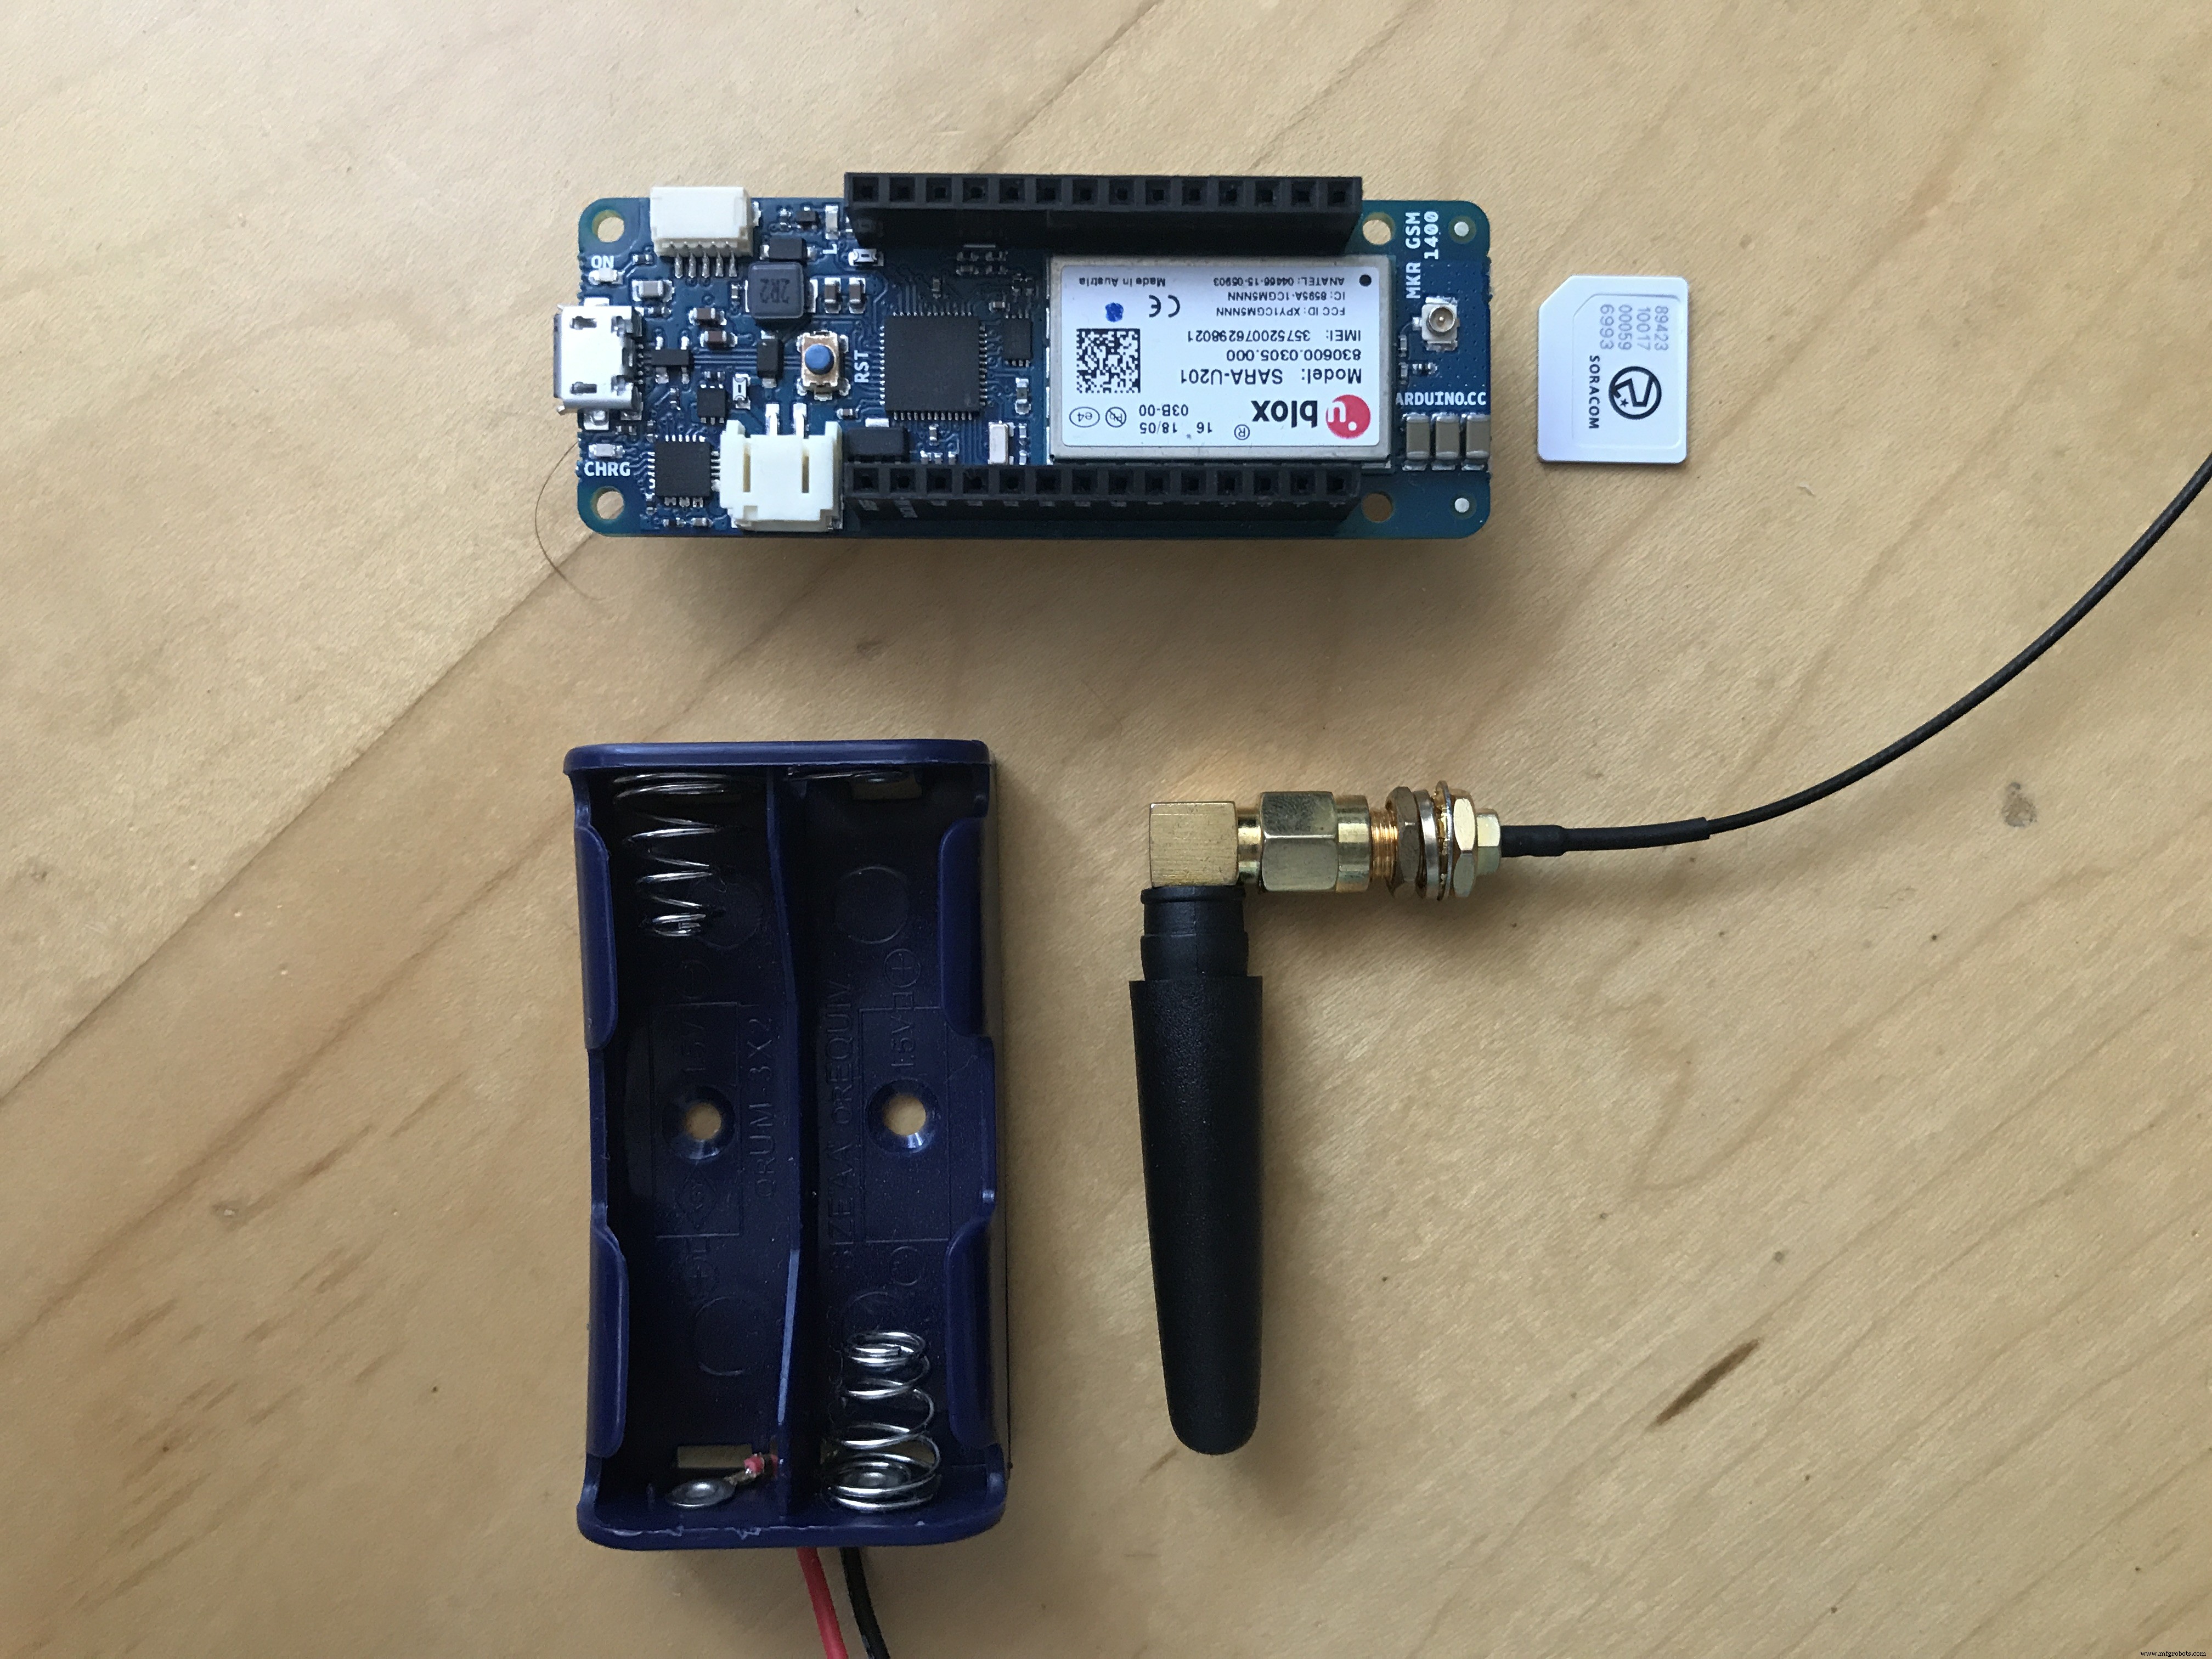
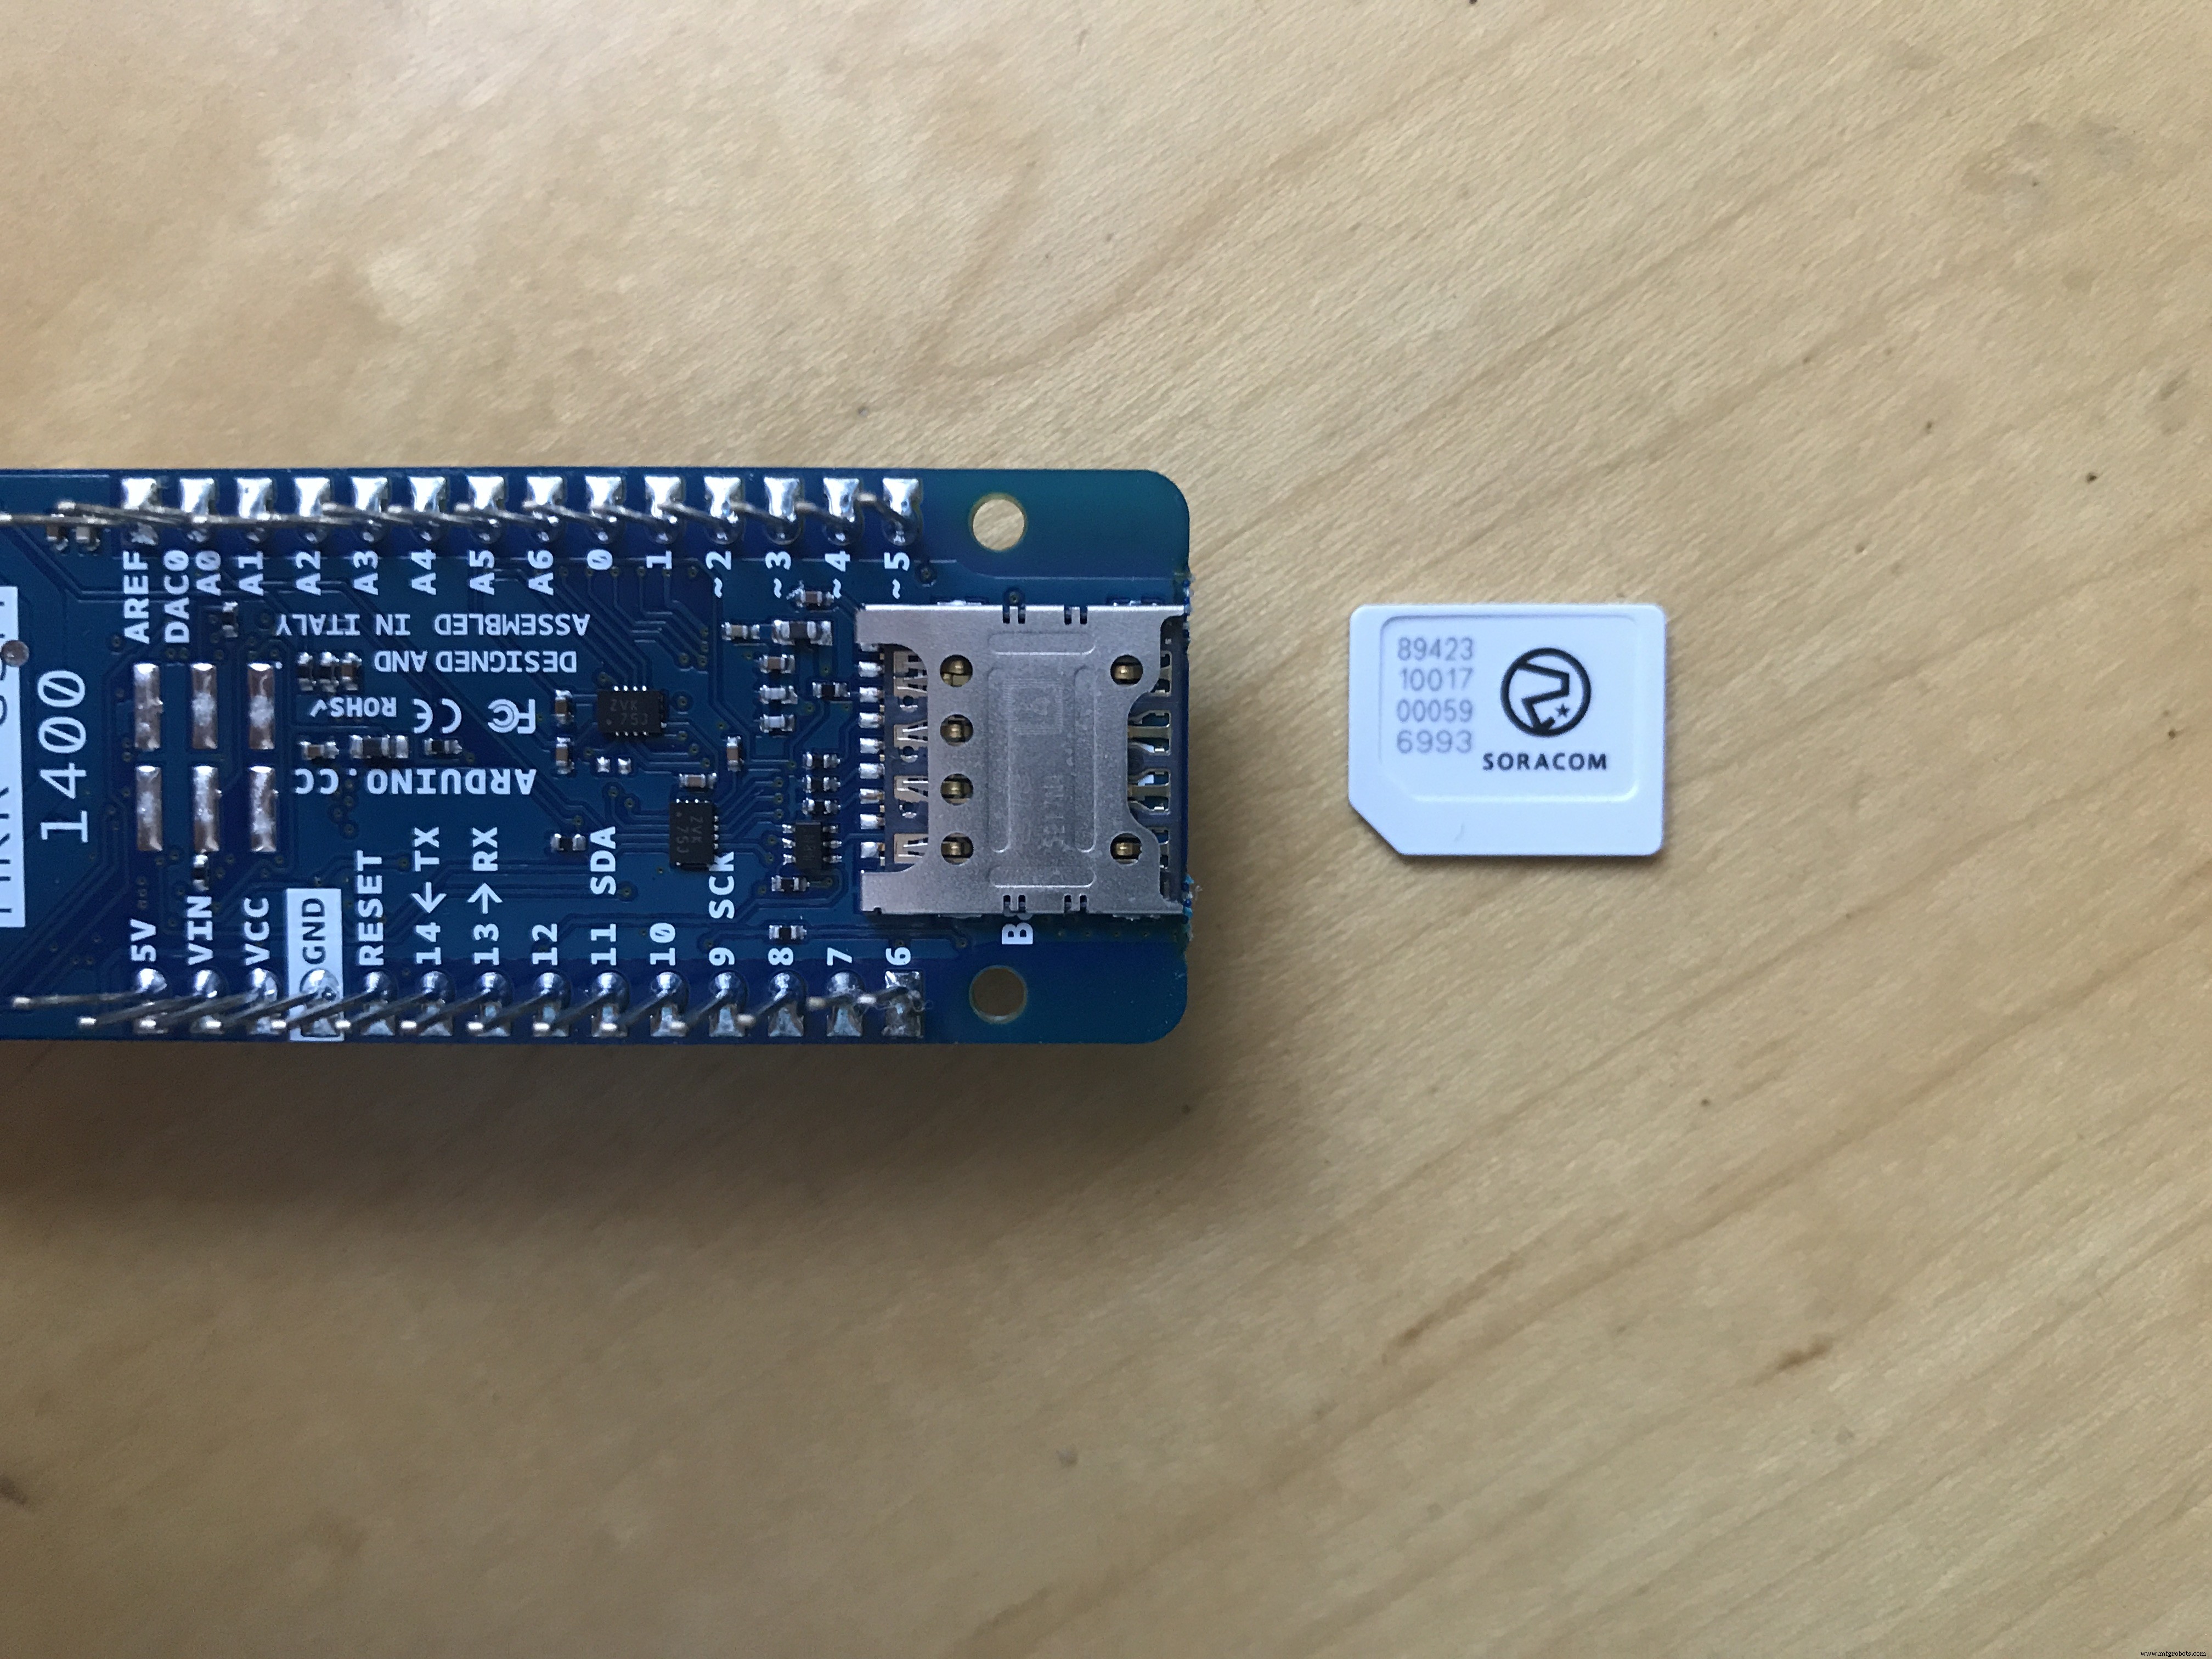
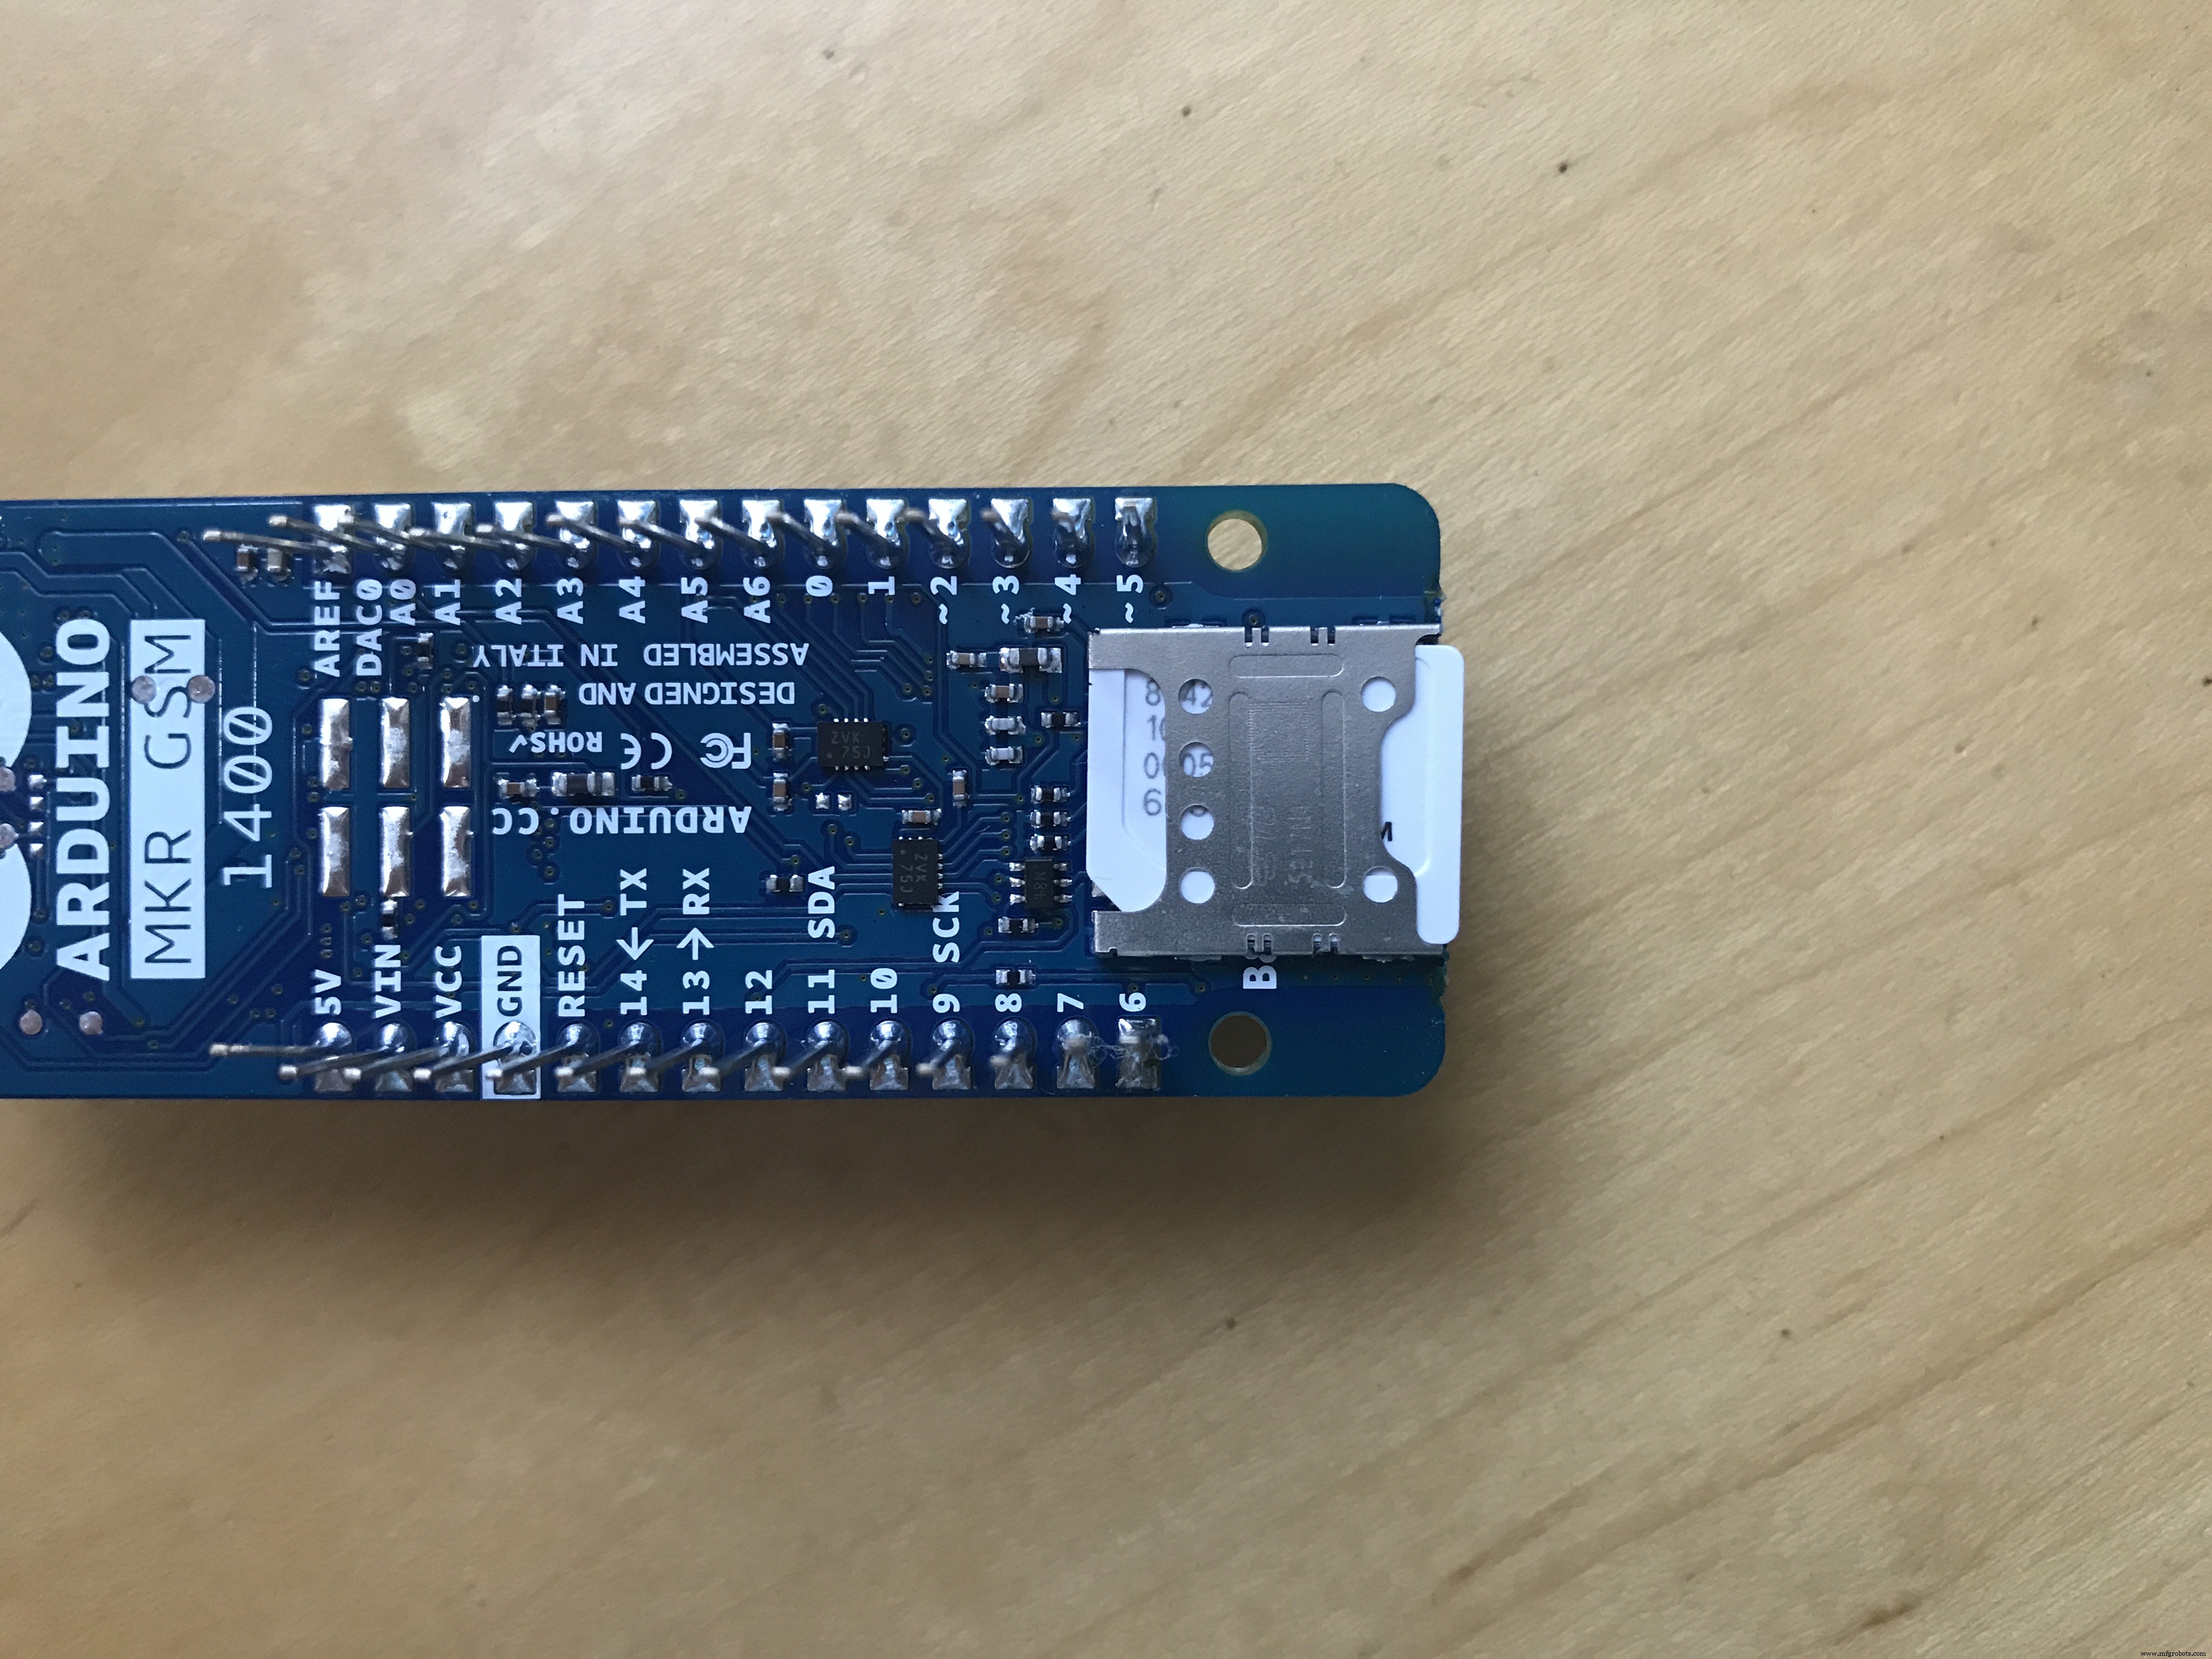
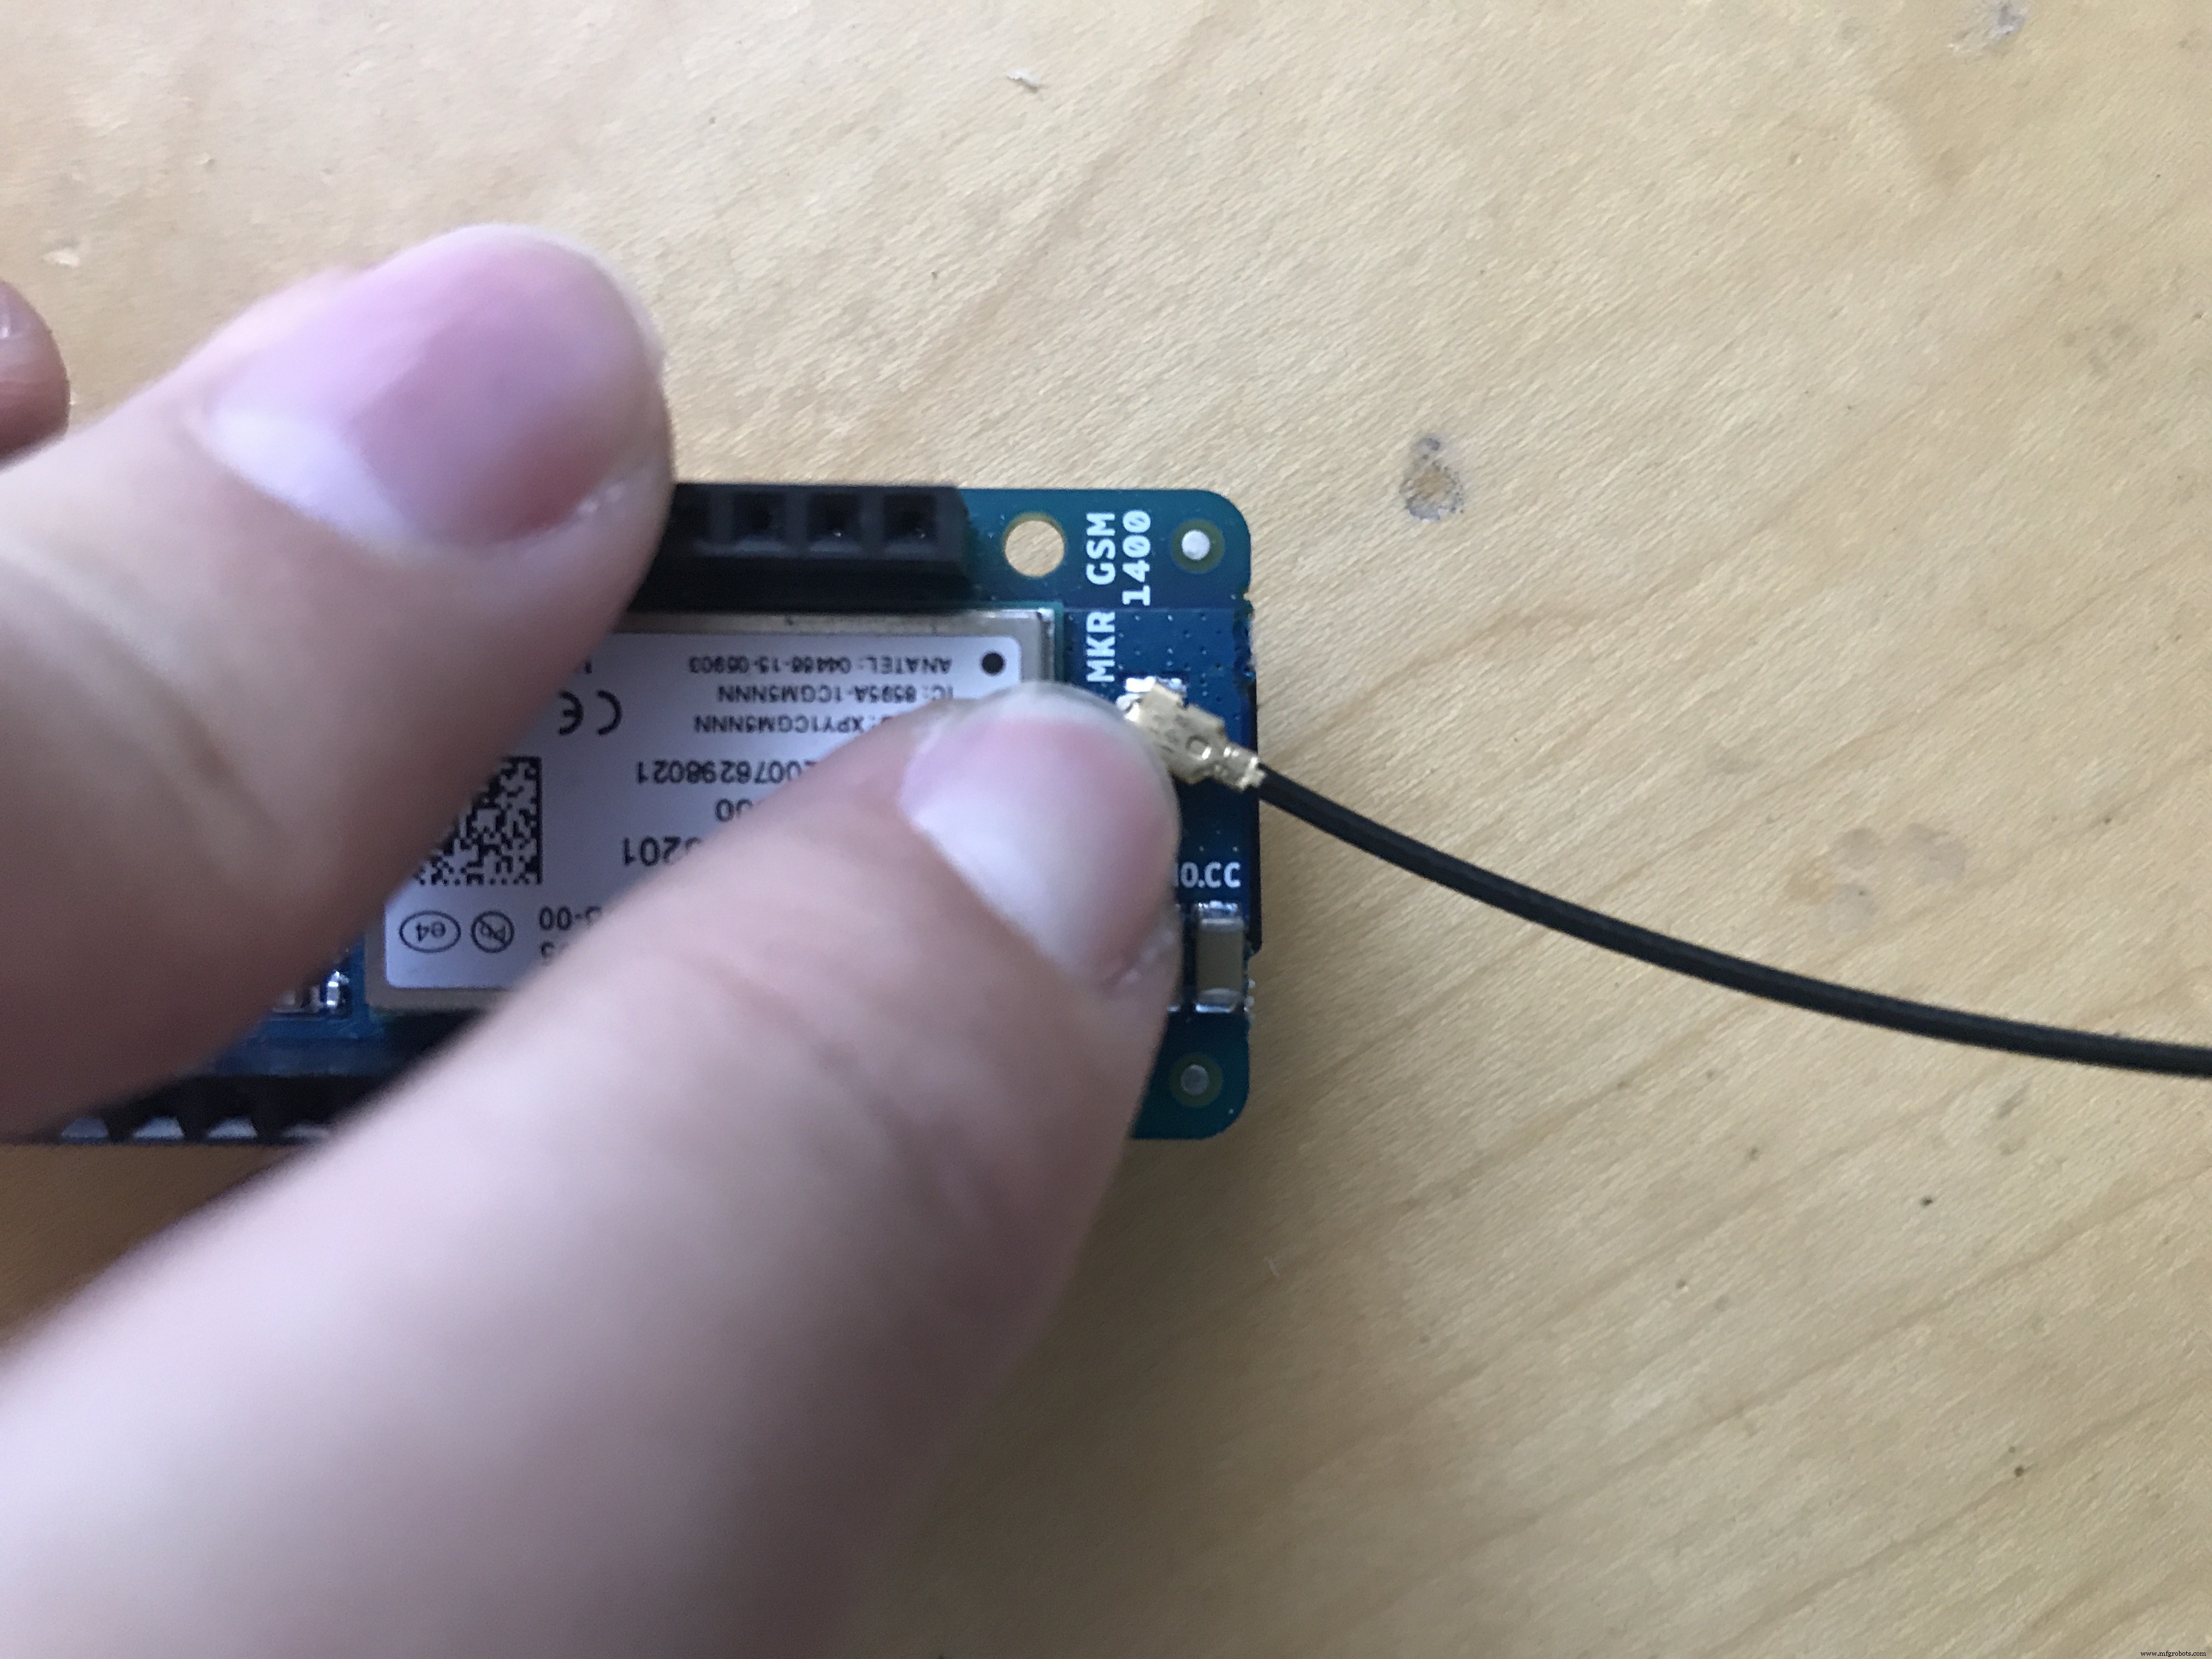
准备 MKR GSM
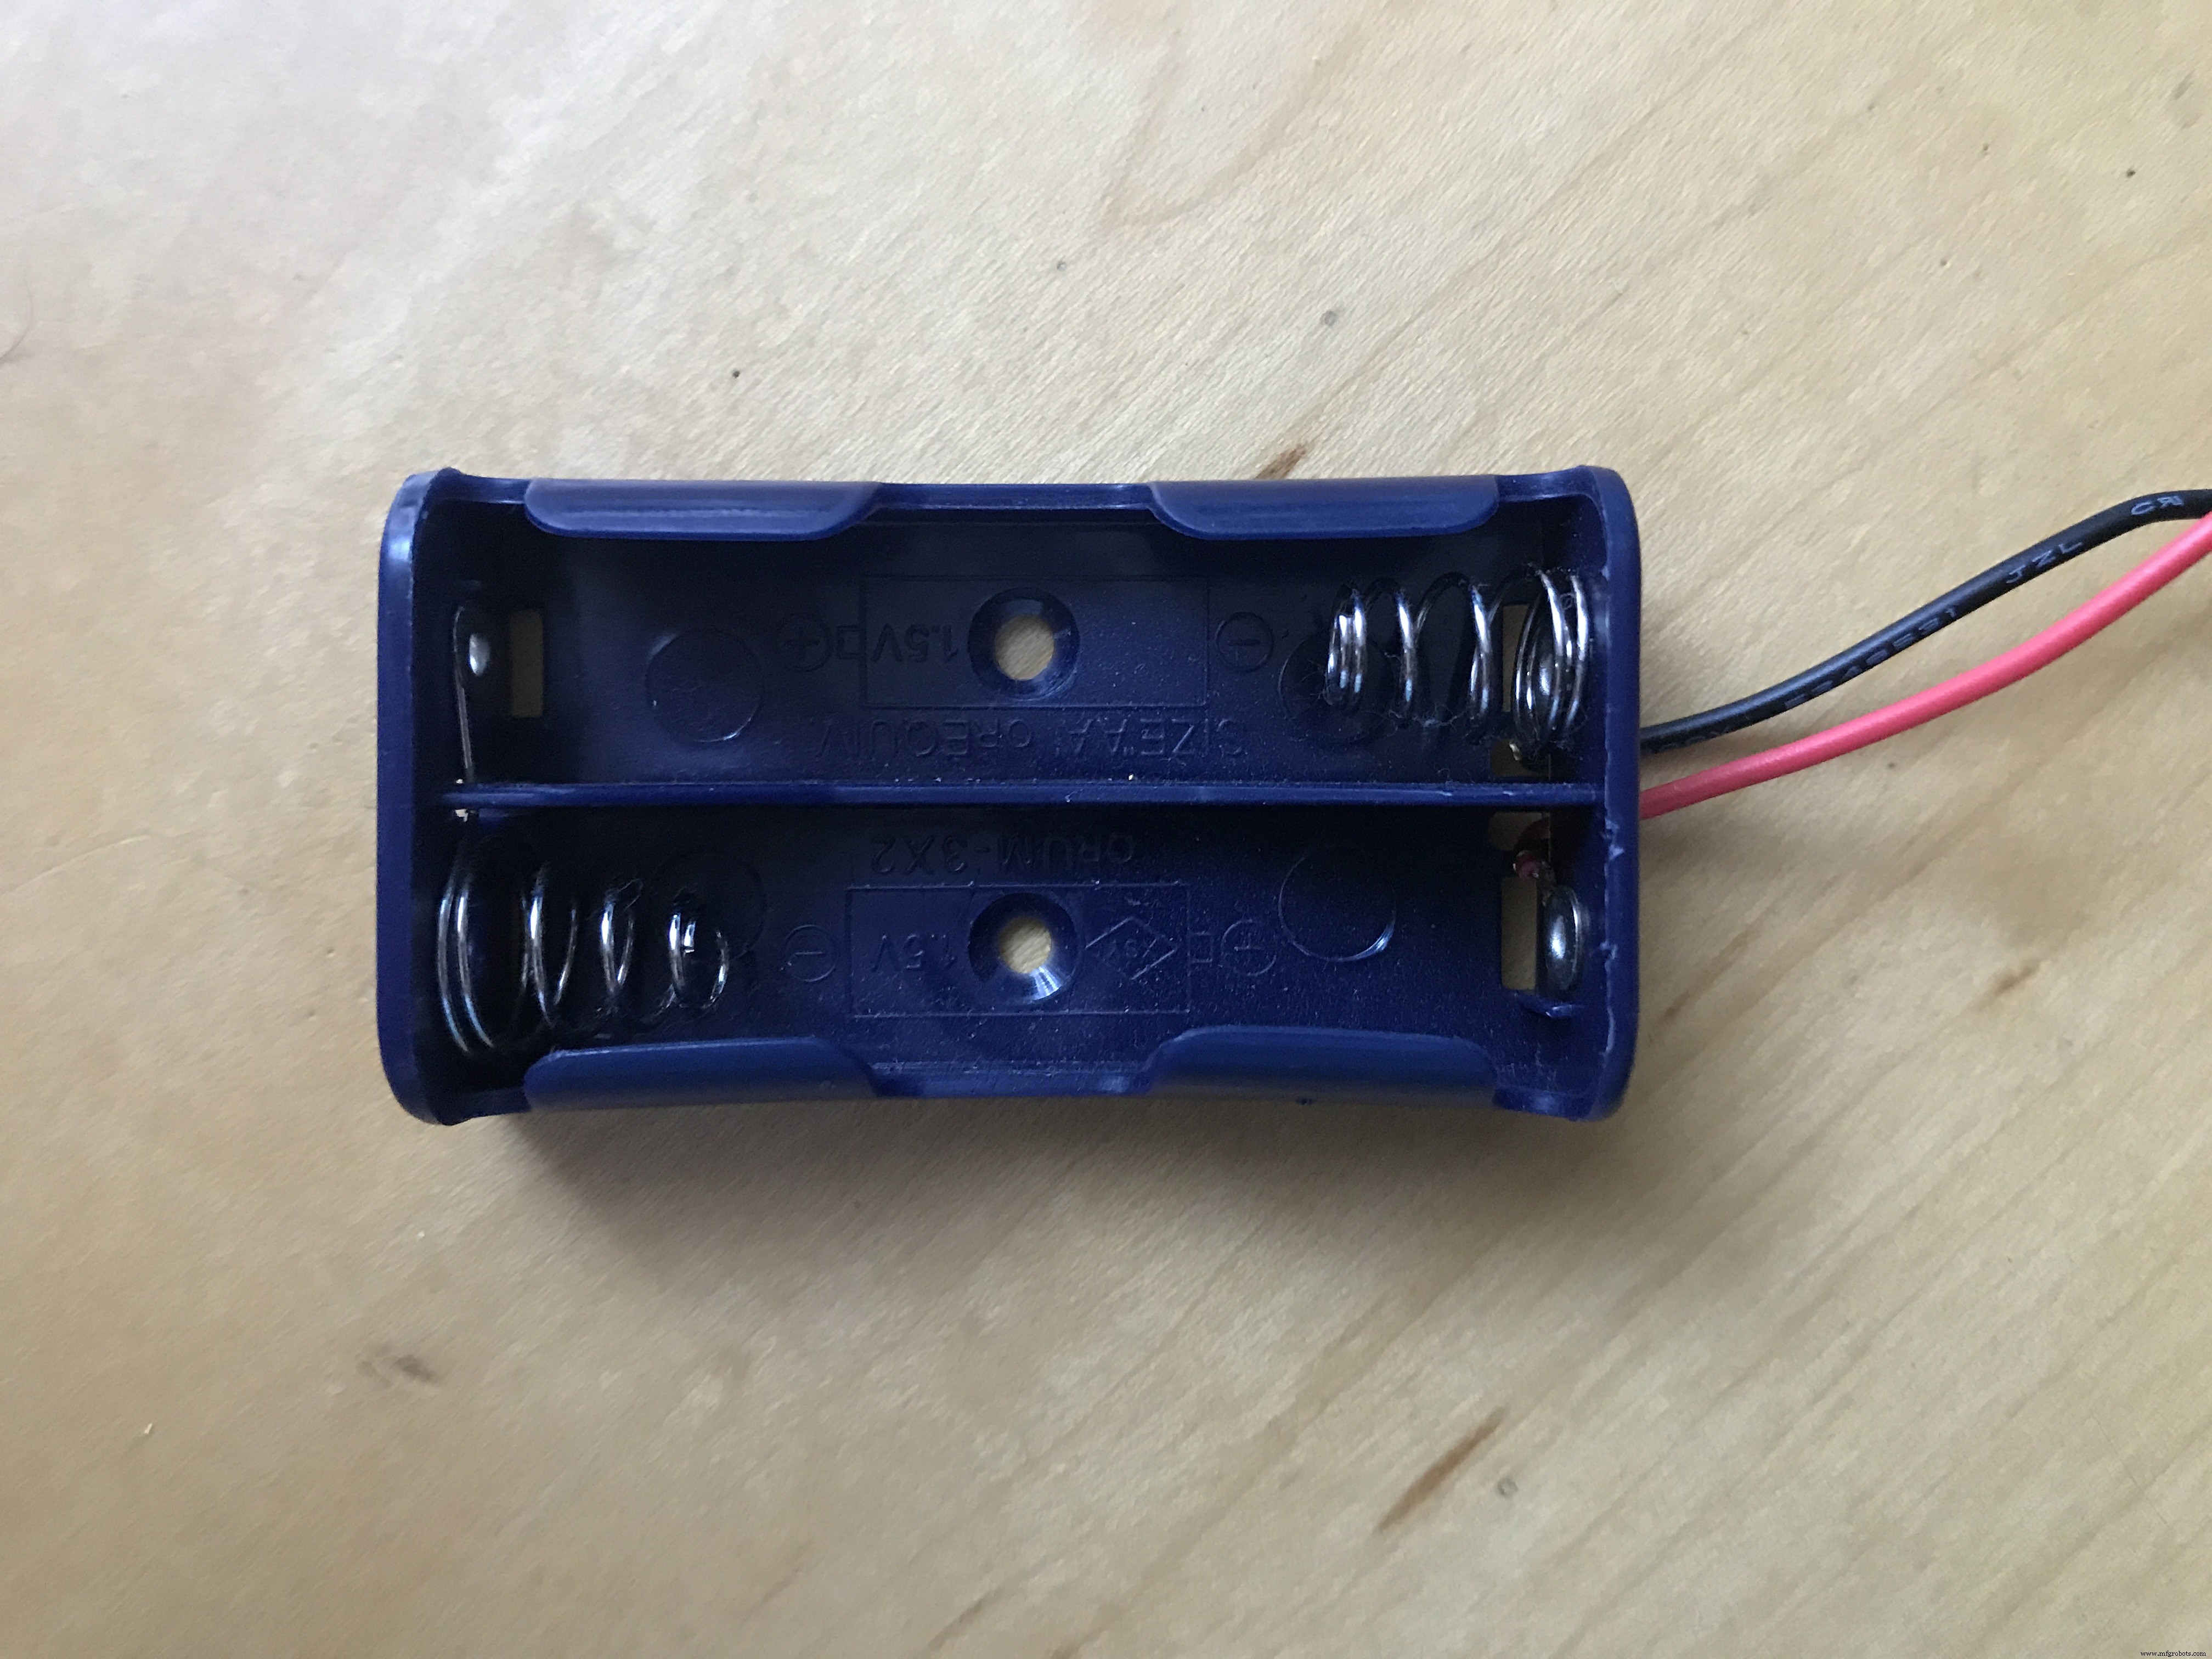
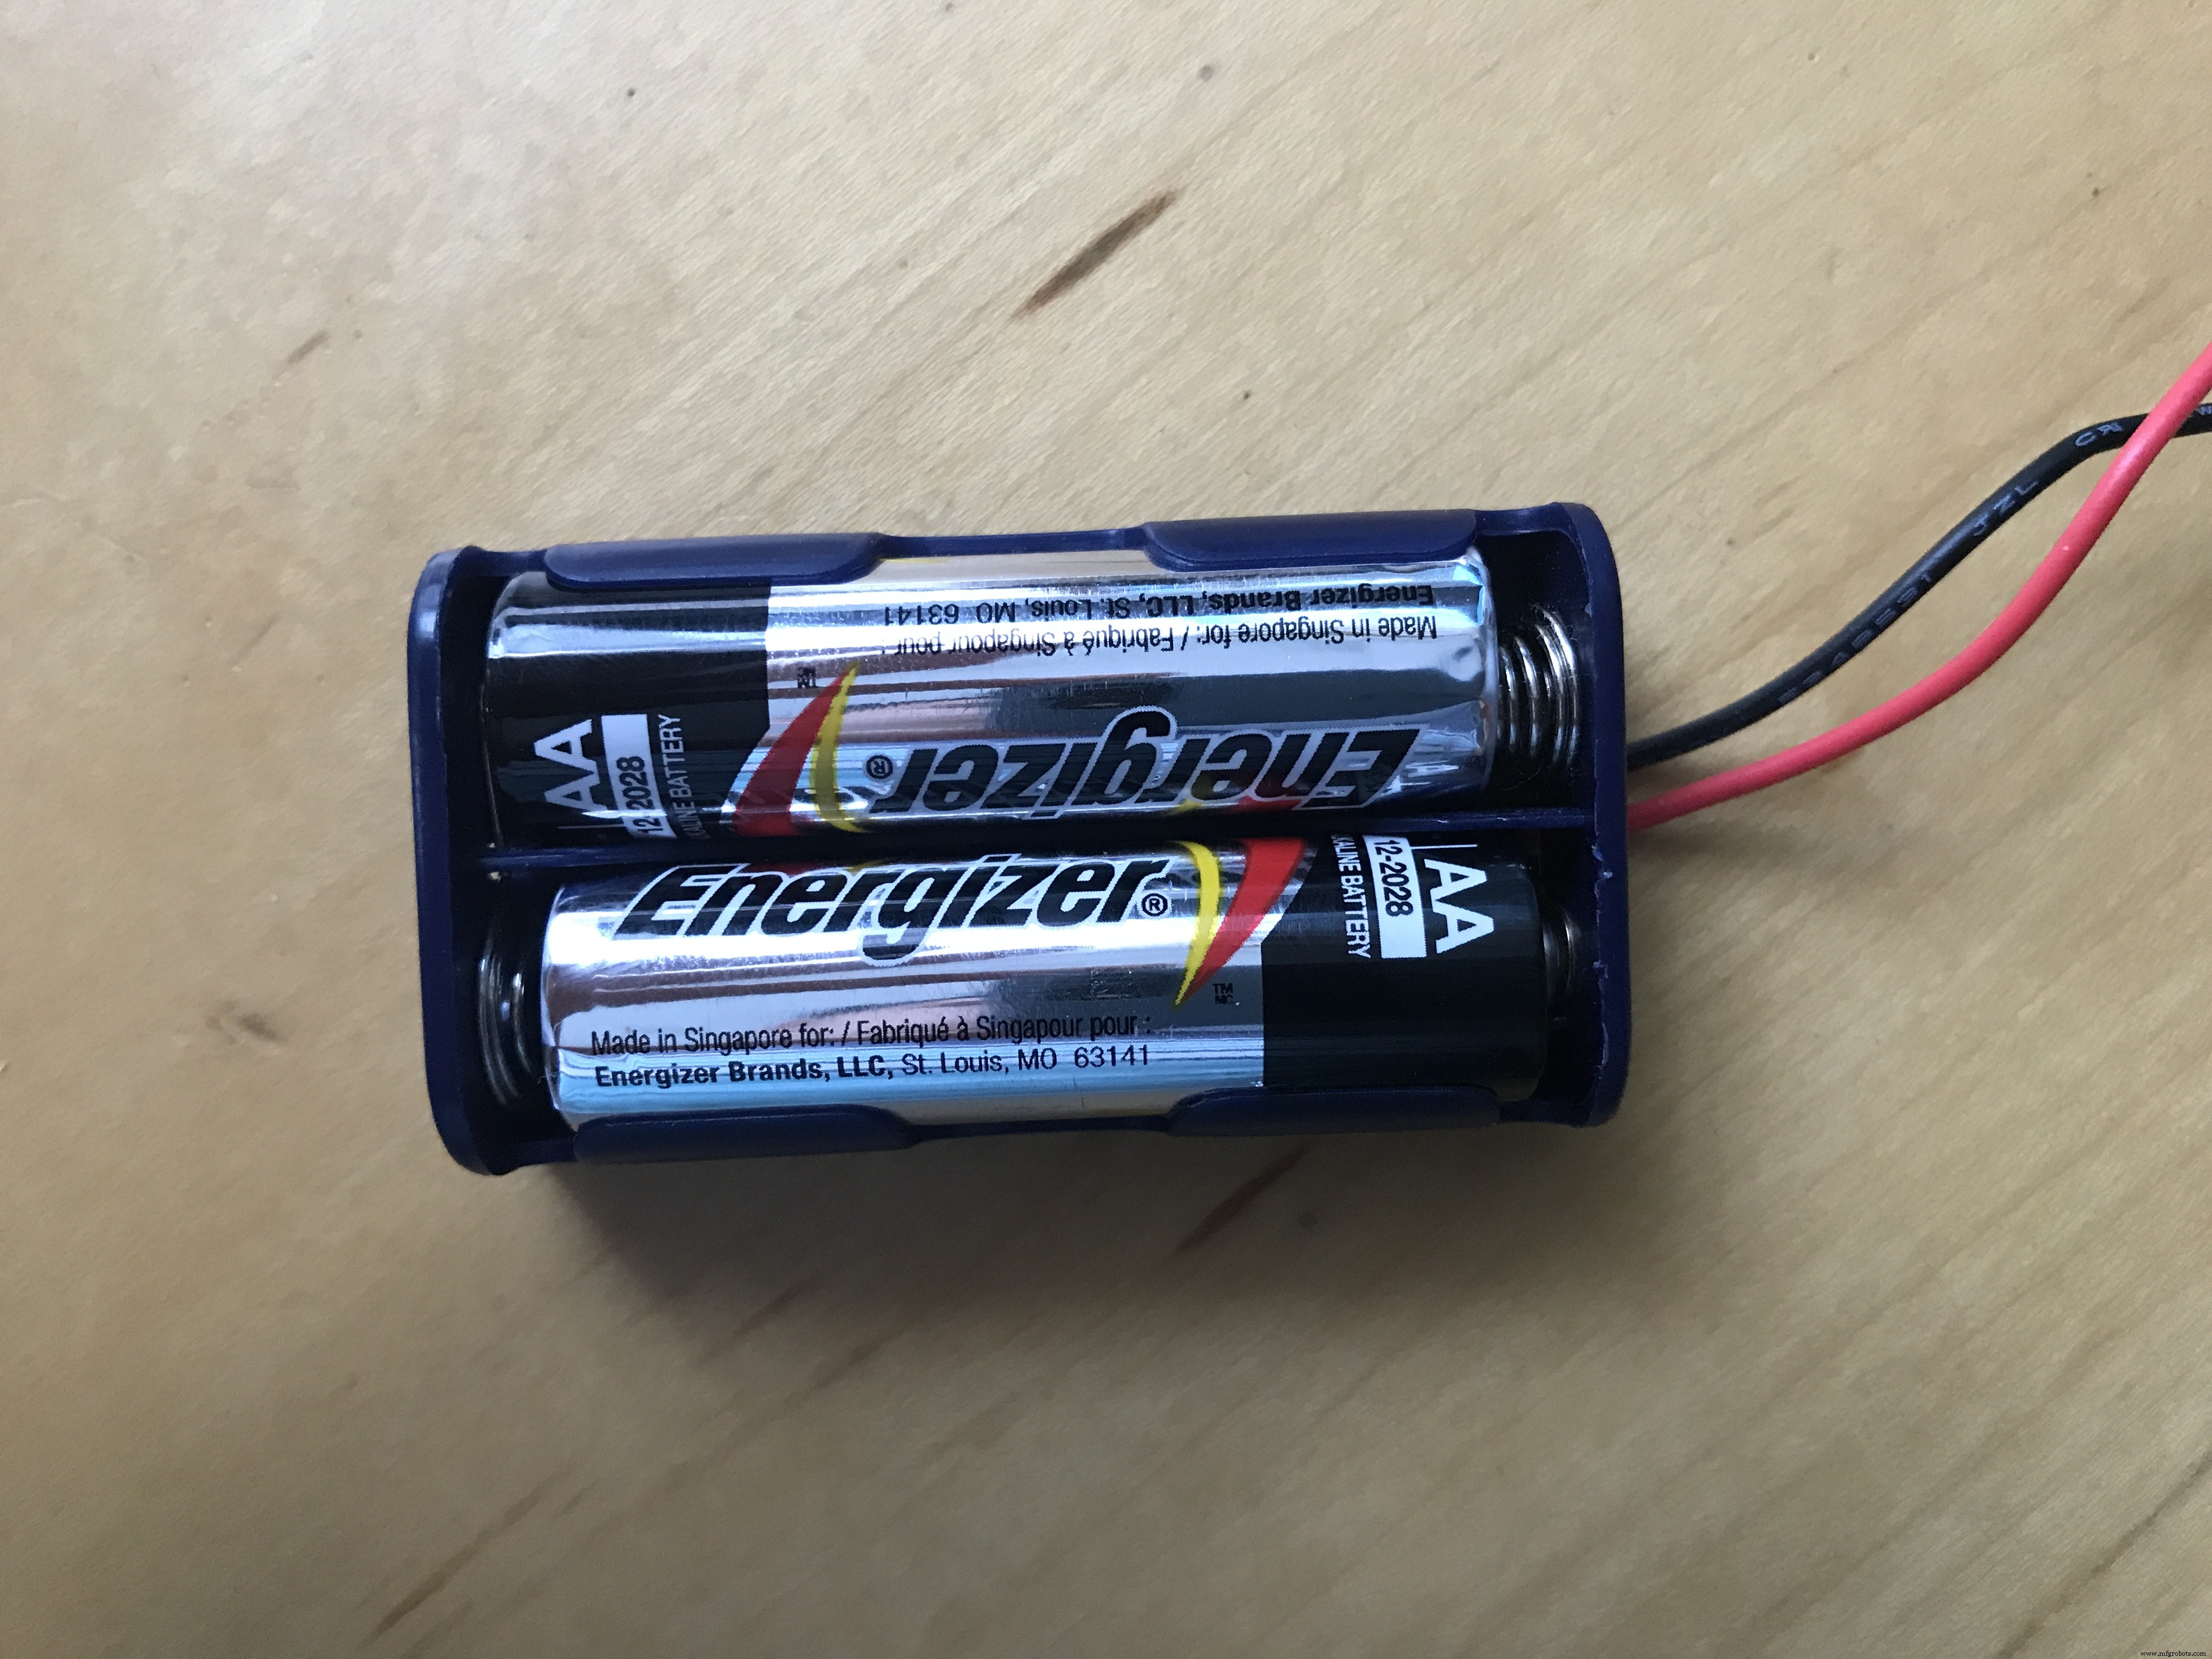
将传感器焊接到设备上后,必须将 SIM 卡、GSM 天线和电池连接到设备上。我通过 VIN 端口用 2 节 AA 电池为电路板供电。步骤如下。
第 3 步:确认代码
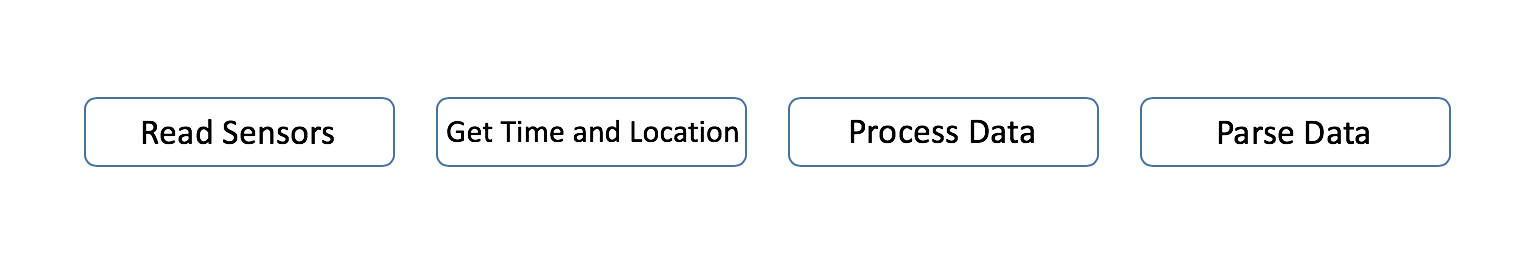
项目代码有4个主要部分。
- 收集传感器数据
- 获取时间和日期
- 过程数据
- 发送数据
下面对所有这些部分进行了描述和详细说明。
收集传感器数据
Serial.println("Taking Sample");
Serial.println("________________________________________");
Serial.println("Taking Sample");
Serial.println (" OK - 热身");
 delay(6000); // 传感器校准延迟
 colourLED(50);
 Serial.println(" OK - Take Sample");
 Serial.print(" ");
 for (int i =0; i <16; i++)
 {
 if (mode ==1)
 {
 strip.setPixelColor(i, strip.Color(0, 255, 0) ));
 strip.show();
 }
 else
 {
 strip.setPixelColor(i, strip.Color(0, 0, 255));
 strip.show();
 }
 // 要采集多个水样 - 传感器不那么精确
 waterTurbidity +=getWaterTurbidity();
 waterPh +=getWaterPh();
 if (i> 14)
 {
 // 为高精度传感器采集单个样本
 waterTemperature =getWaterTemp();
 atmoTemperature =getAtmoTemp ();
 atmoHumidity =getAtmoHumidity();
 }
 Serial.print(".");
 delay(500);
 }
 Serial .println("");
 Serial.println(" 成功 - 采样数");
 for (int i =0; i <=16; i++)
 {
 strip.setPixelColor(i, strip.Color(0, 0, 0));
 strip.show();
 delay(30);
 }
 Serial.println("____________________________________");
 Serial.println("");
 delay(500);
上面的代码部分从等待 6 秒让传感器在水中校准开始。然后设备循环 16 次,每循环一个新的 LED 点亮环。
来自具有波动值的传感器的数据被收集 16 次,然后找到平均值。最后一个循环读取高精度传感器。
获取时间和日期
void getCredentials()
{
 Serial.println(" [1/2] Time");
 Serial.println(" OK - 从 RTC 获取时间");
 currentEpoch =processTime();
 colourLED(50);
 Serial.println(" [2/2] Geolocation");
Serial.println(" OK - Getting来自 GPRS 的地理定位");
 while (!getLocation());
 Serial.print(" Success - Geolocation is "); Serial.print(纬度,7); Serial.print(", "); Serial.println(longitude, 7);
 colourLED(50);
}

bool getLocation()
{
 if (location.available( ))
 {
 latitude =location.latitude();
 longitude =location.longitude();
 delay(500);
 return true;
 }
 else
 {
 delay(500);
 return false;
 }
}
第一个循环处理凭据。时间是从板载 RTC 中提取的,因为它在设置中与 GSM 网络同步。地理位置提取自GPRS。
处理数据
void processData()
{
 Serial.println(" OK - 获得水 pH 值和浊度的平均值");
 waterPh =(waterPh / 16);
 waterTurbidity =(waterTurbidity / 16);
 Serial.println(" OK - Dumping Data to Serial");
 Serial.println("");
 Serial.print(" [水] pH值"); Serial.println(waterPh);
Serial.print(" [水] 浊度"); Serial.println(waterTurbidity);
Serial.print(" [水] 温度"); Serial.println(waterTemperature);
Serial.print(" [Atmo] 温度"); Serial.println(atmoTemperature);
Serial.print(" [Atmo] Humidity "); Serial.println(atmoHumidity);
Serial.println("");
Serial.println("成功 - 数据处理");
 colourLED(50);
}

String makeLine()
{
 Serial.println(" OK - Making String");
 String dataReturned;数据返回 +="{"; dataReturned +=" \n";
 dataReturned +="\"Latitude\":" + String(latitude, 7); dataReturned +=", \n";
 dataReturned +="\"Longitude\":" + String(longitude, 7); dataReturned +=", \n";
 dataReturned +="\"waterpH\":" + String(waterPh); dataReturned +=", \n";
 dataReturned +="\"waterTurbidity\":" + String(waterTurbidity); dataReturned +=", \n";
 dataReturned +="\"waterTemp\":" + String(waterTemperature); dataReturned +=", \n";
 dataReturned +="\"atmoTemp\":" + String(atmoTemperature); dataReturned +=", \n";
 dataReturned +="\"atmoHum\":" + String(atmoHumidity); dataReturned +=",\n";
 dataReturned +="\"deviceID\":" + String(deviceID); dataReturned +=", \n";
 dataReturned +="\"deviceName\":"; dataReturned +=String("\""); dataReturned +=String(deviceName); dataReturned +=String("\""); dataReturned +=", \n";
 dataReturned +="\"epoch\":" + String(currentEpoch); dataReturned +=", \n";
 dataReturned +="\"mode\":" + String(mode); dataReturned +=" \n";
 dataReturned +="}";
 Serial.println(" OK - 数据在下面");
 Serial.println("");
 /> Serial.println(dataReturned);
 Serial.println("");
Serial.println(" Success - String is Ready");
 colourLED(50);
 return dataReturned;
}
processData() 获取从倾向于波动的传感器收集的数据的平均值,然后将所有数据转储到串行监视器。
makeLine() 将所有数据编译成发送到 Soracom 的 JSON 字符串。所有值都被解析为一个 JSON 缓冲区,准备发送到后端。
发送数据
void parseData(String dataToSend)
{
 Serial.println(" OK - 建立连接");
 if(client.connect(url, 80))
 {
 Serial.println(" OK - 连接建立,解析数据");
 client.println("POST / HTTP/1.1");
 client.println("Host :harvest.soracom.io");
 client.println("User-Agent:Arduino/1.0");
 client.println("Connection:close");
 client.print ("Content-Length:");
 client.println(dataToSend.length());
 client.println("");
 client.println(dataToSend);
 Serial.println(" OK - 数据解析");
 }
 Serial.println(" OK - 得到响应");
 Serial.println("");
 while(1)
 {
 if(client.available())
 {
 char c =client.read();
 Serial.print(c);
 }
 if(!client.connected())
 {
 break;
 }
 }
 Serial.println(" Success -数据被解析");
}
最后,数据被发送到 Soracom。设备与服务器建立连接,然后准备凭据。然后将数据发送到服务器,并将响应打印到串行监视器。
然后设备进入睡眠状态,直到触发器将其唤醒并再次重复这些步骤。
第 4 步:设置变量
在使用项目之前,必须编辑某些变量。下面列出了这些。设置它们的说明也在下面。
模式设备的模式决定了它是定期采样还是按按钮进行采样。如果此变量设置为 1,则需要通过按钮操作设备。如果模式设置为 2,设备将定期采样。deviceID 和 deviceName如果正在使用一组设备,这些是用于识别设备的自定义变量。应为每个使用的设备指定唯一的 ID 和名称,以便轻松识别。sleepTime存储设备在读取之间休眠的时间量,它在代码中设置为 5 秒,适用于测试,但在现场使用时必须更改。可以每隔 15 分钟取样一次。proDebug调试时使用,在代码中设置为false,但如果调试时需要串行监视器,则应将其设置为true。请注意,即使调试关闭,设备仍将打印到串行。如果调试打开,除非串行监视器打开,否则设备将不会运行。
第 5 步:上传代码
在设置后端之前,必须将数据发送给它。
为此,请将您的 MKR GSM 连接到您的计算机并将代码上传到设备,确保此设置的设备模式设置为 1。代码上传后,将所有传感器放入水中。
现在按下设备上的按钮并等待数据收集和发送。重复几次以填充 Soracom Air。
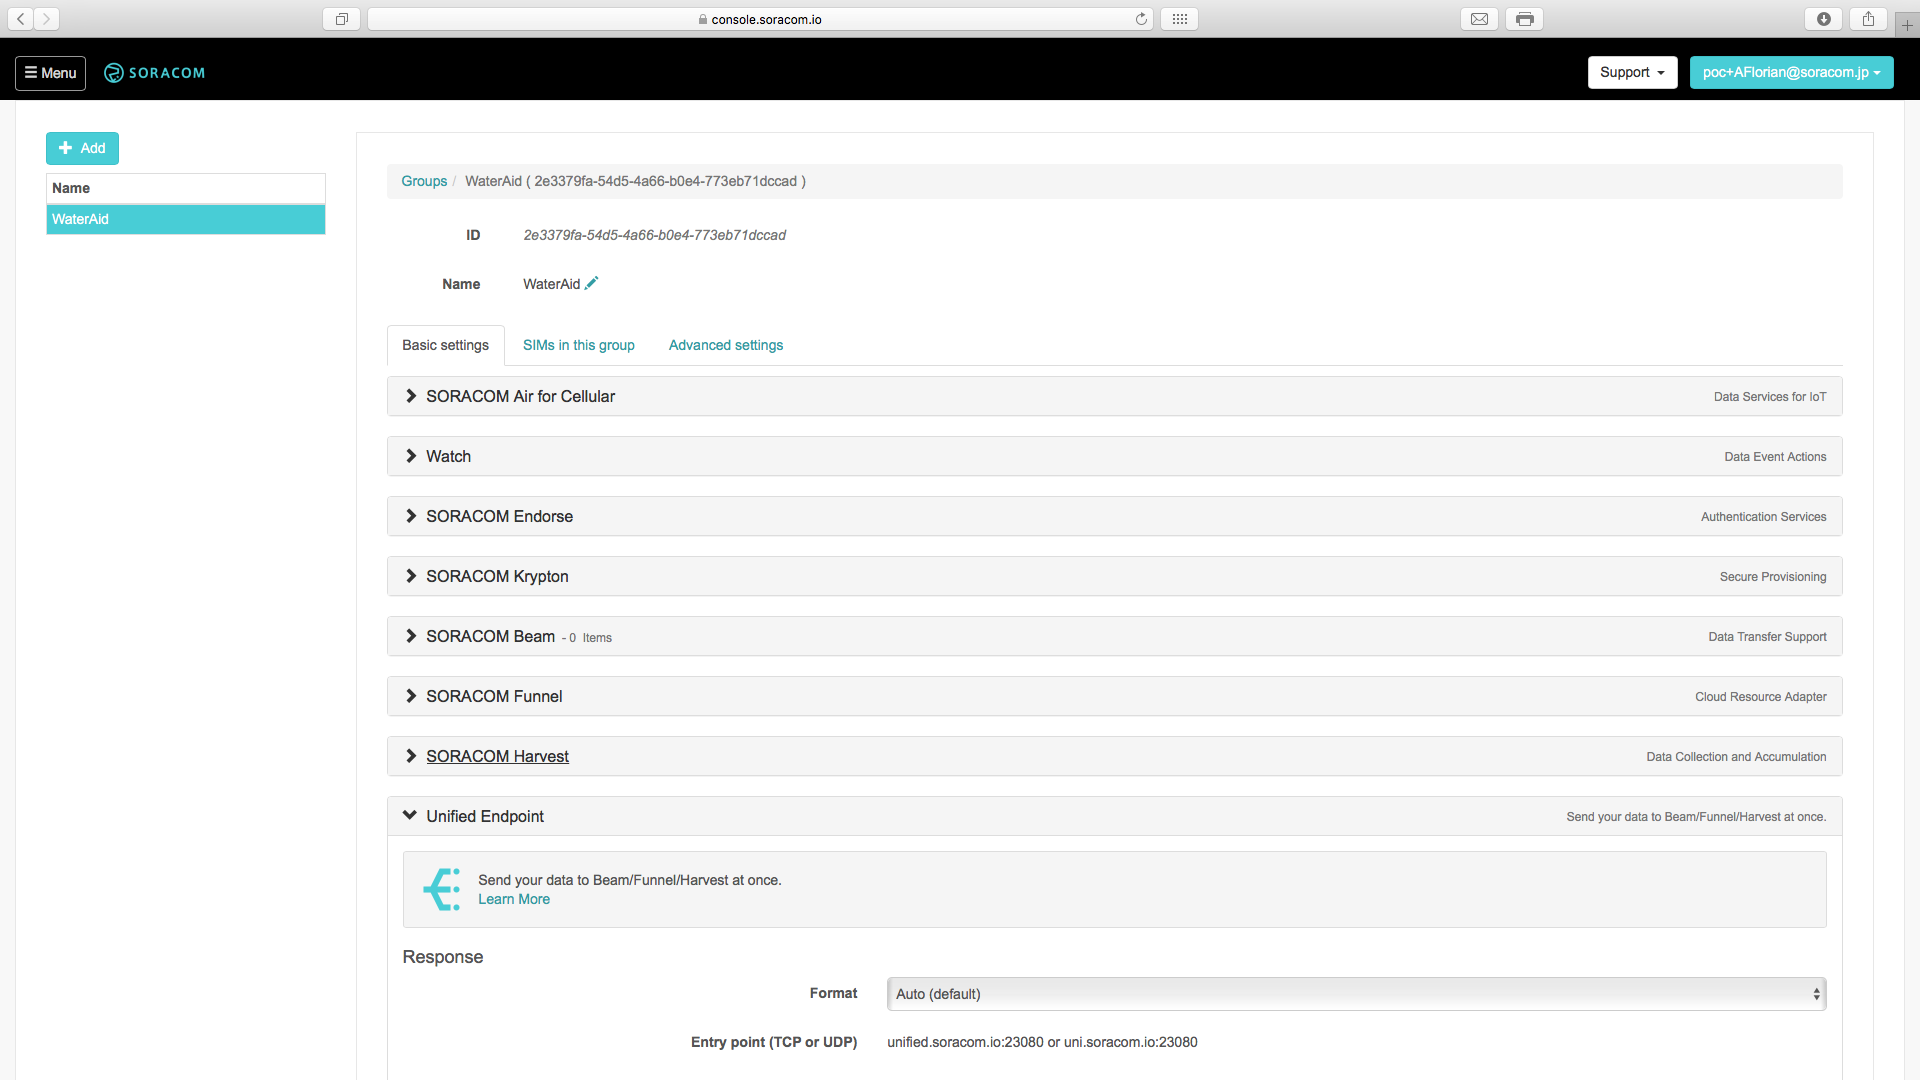
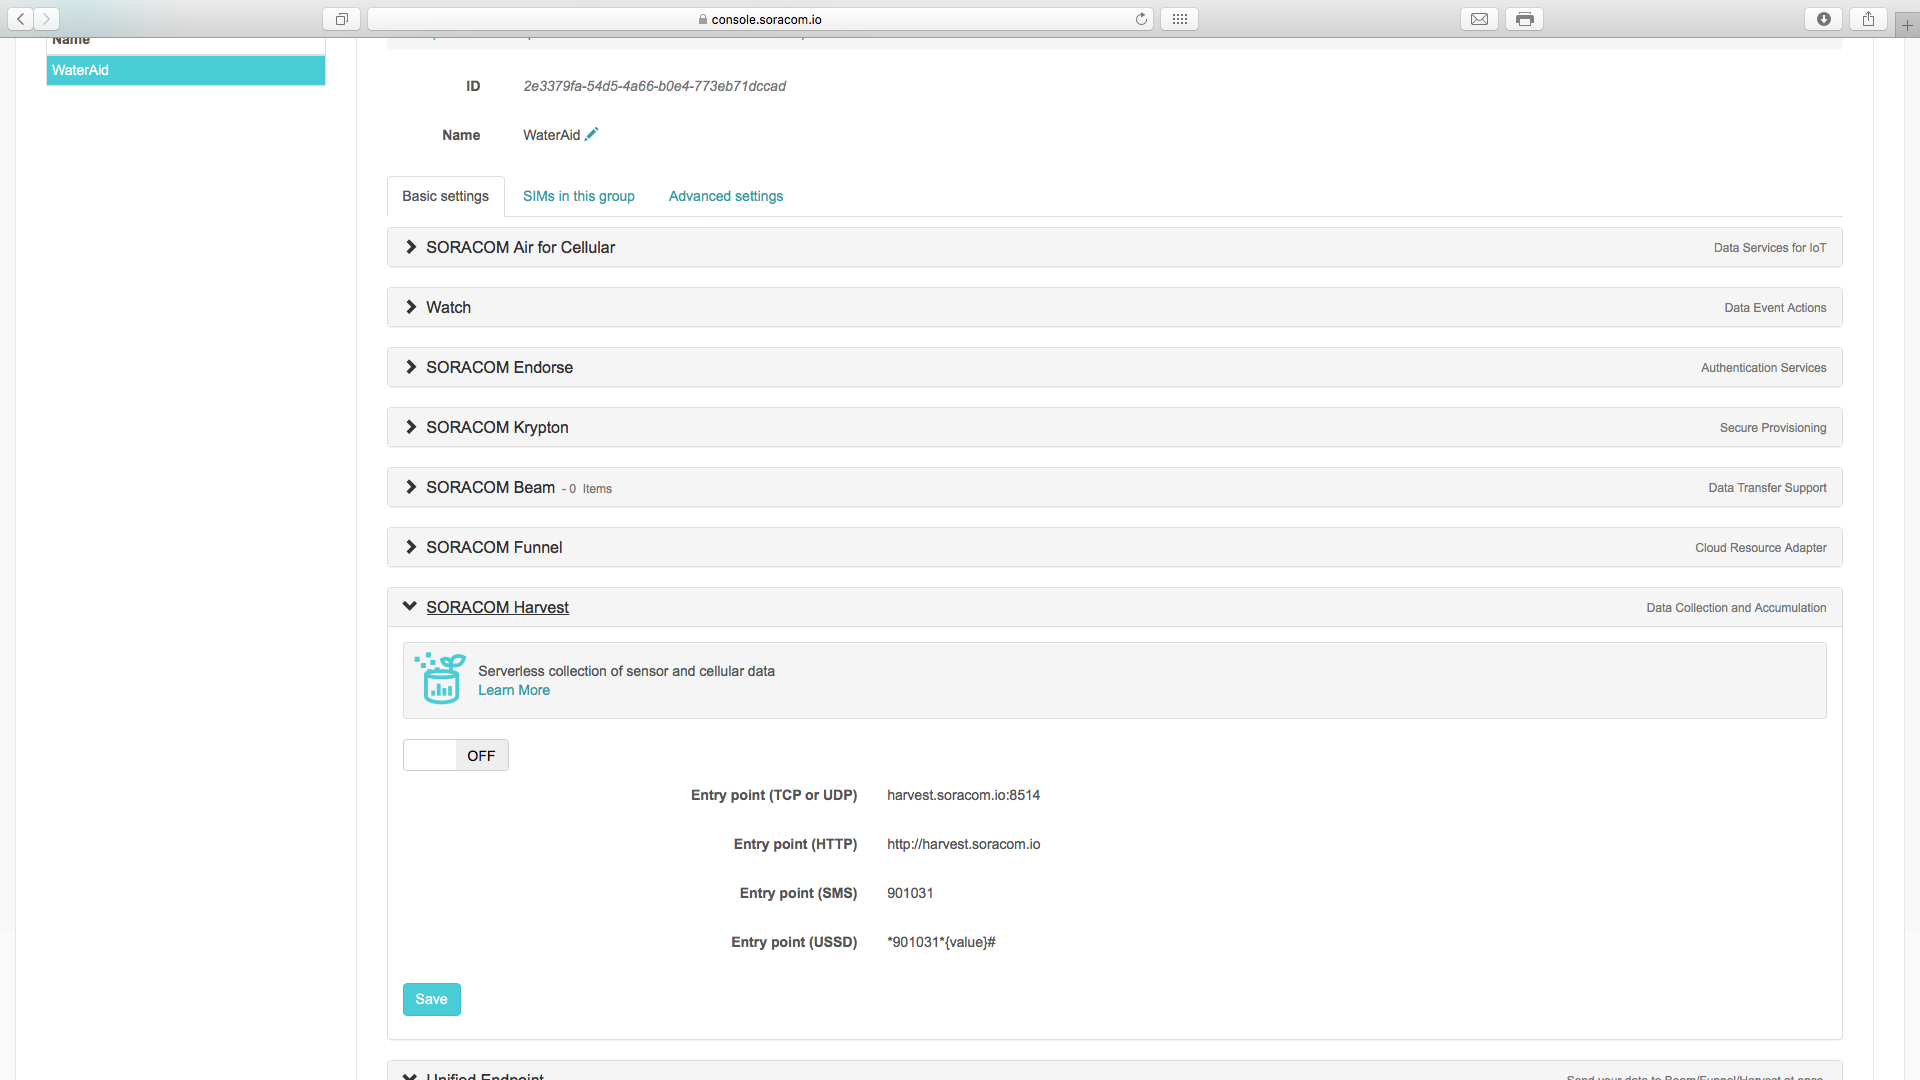
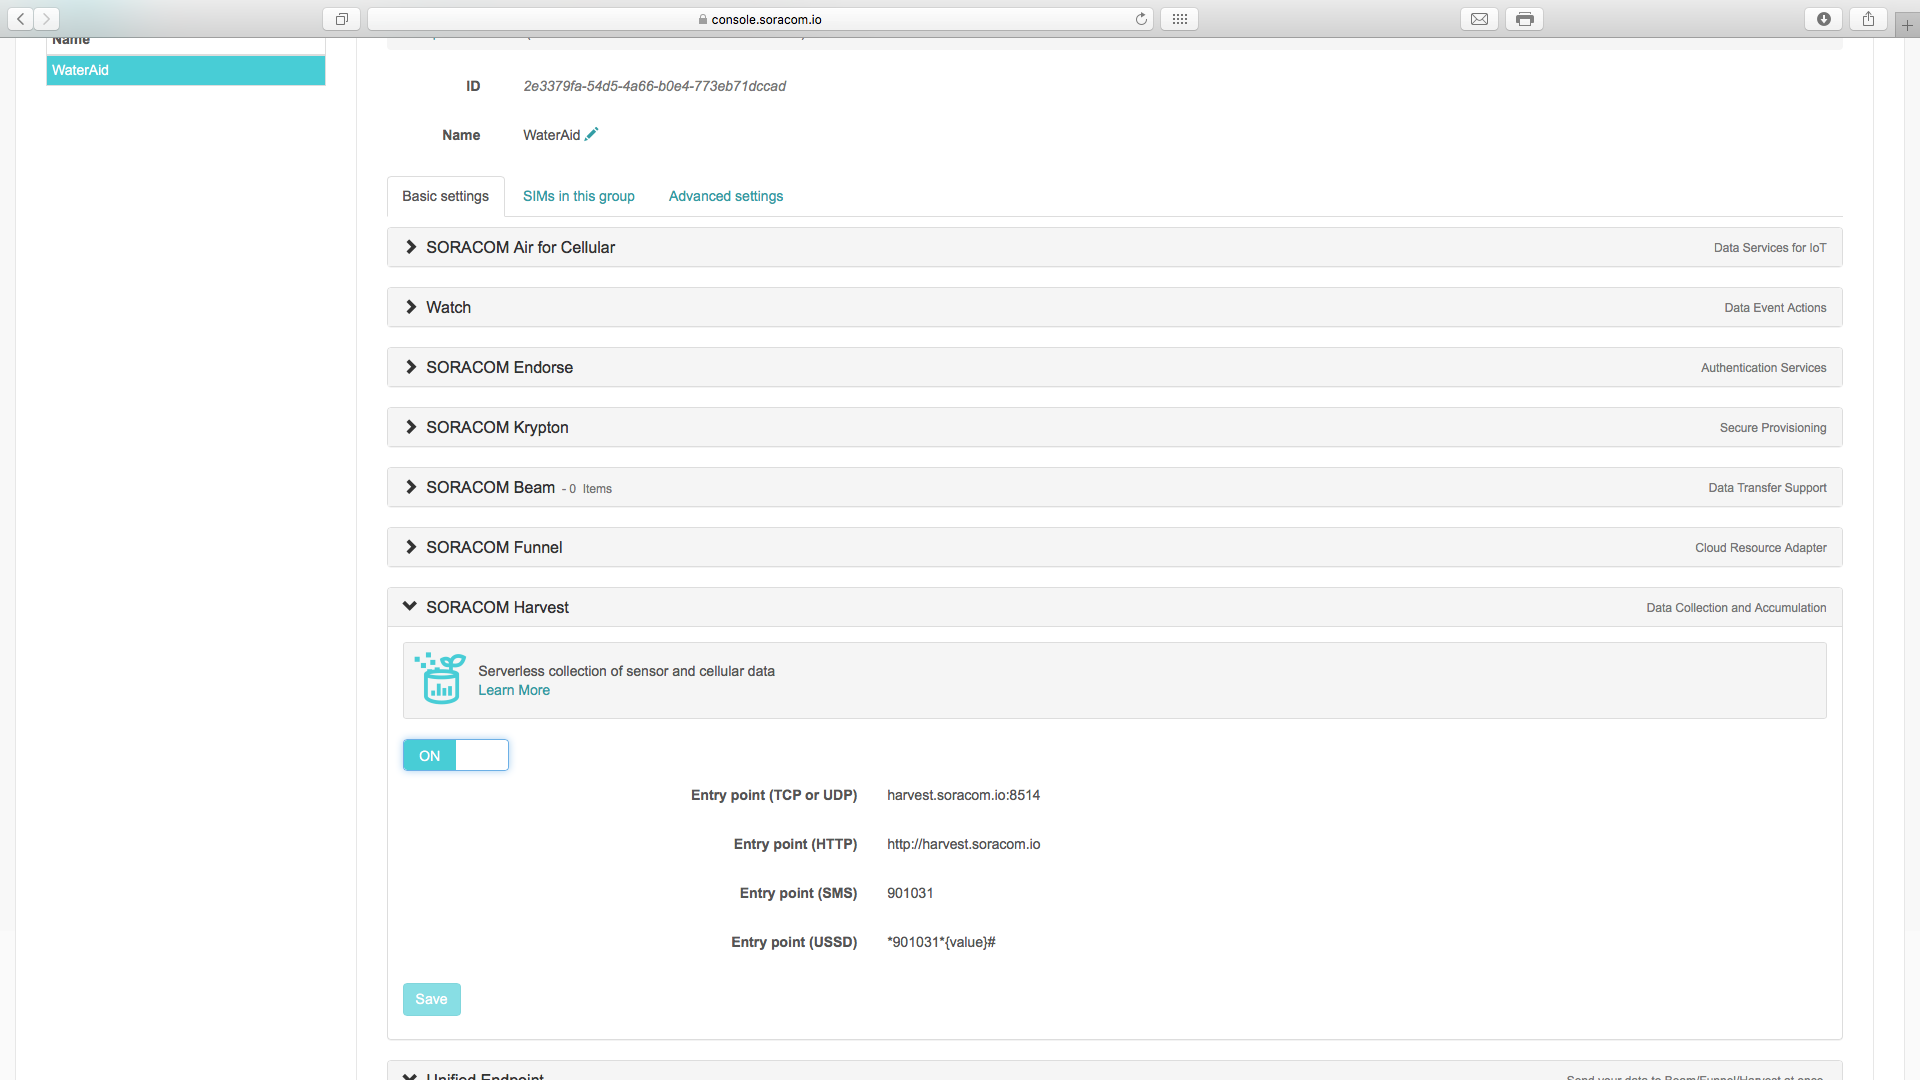
第 6 步:设置 Soracom
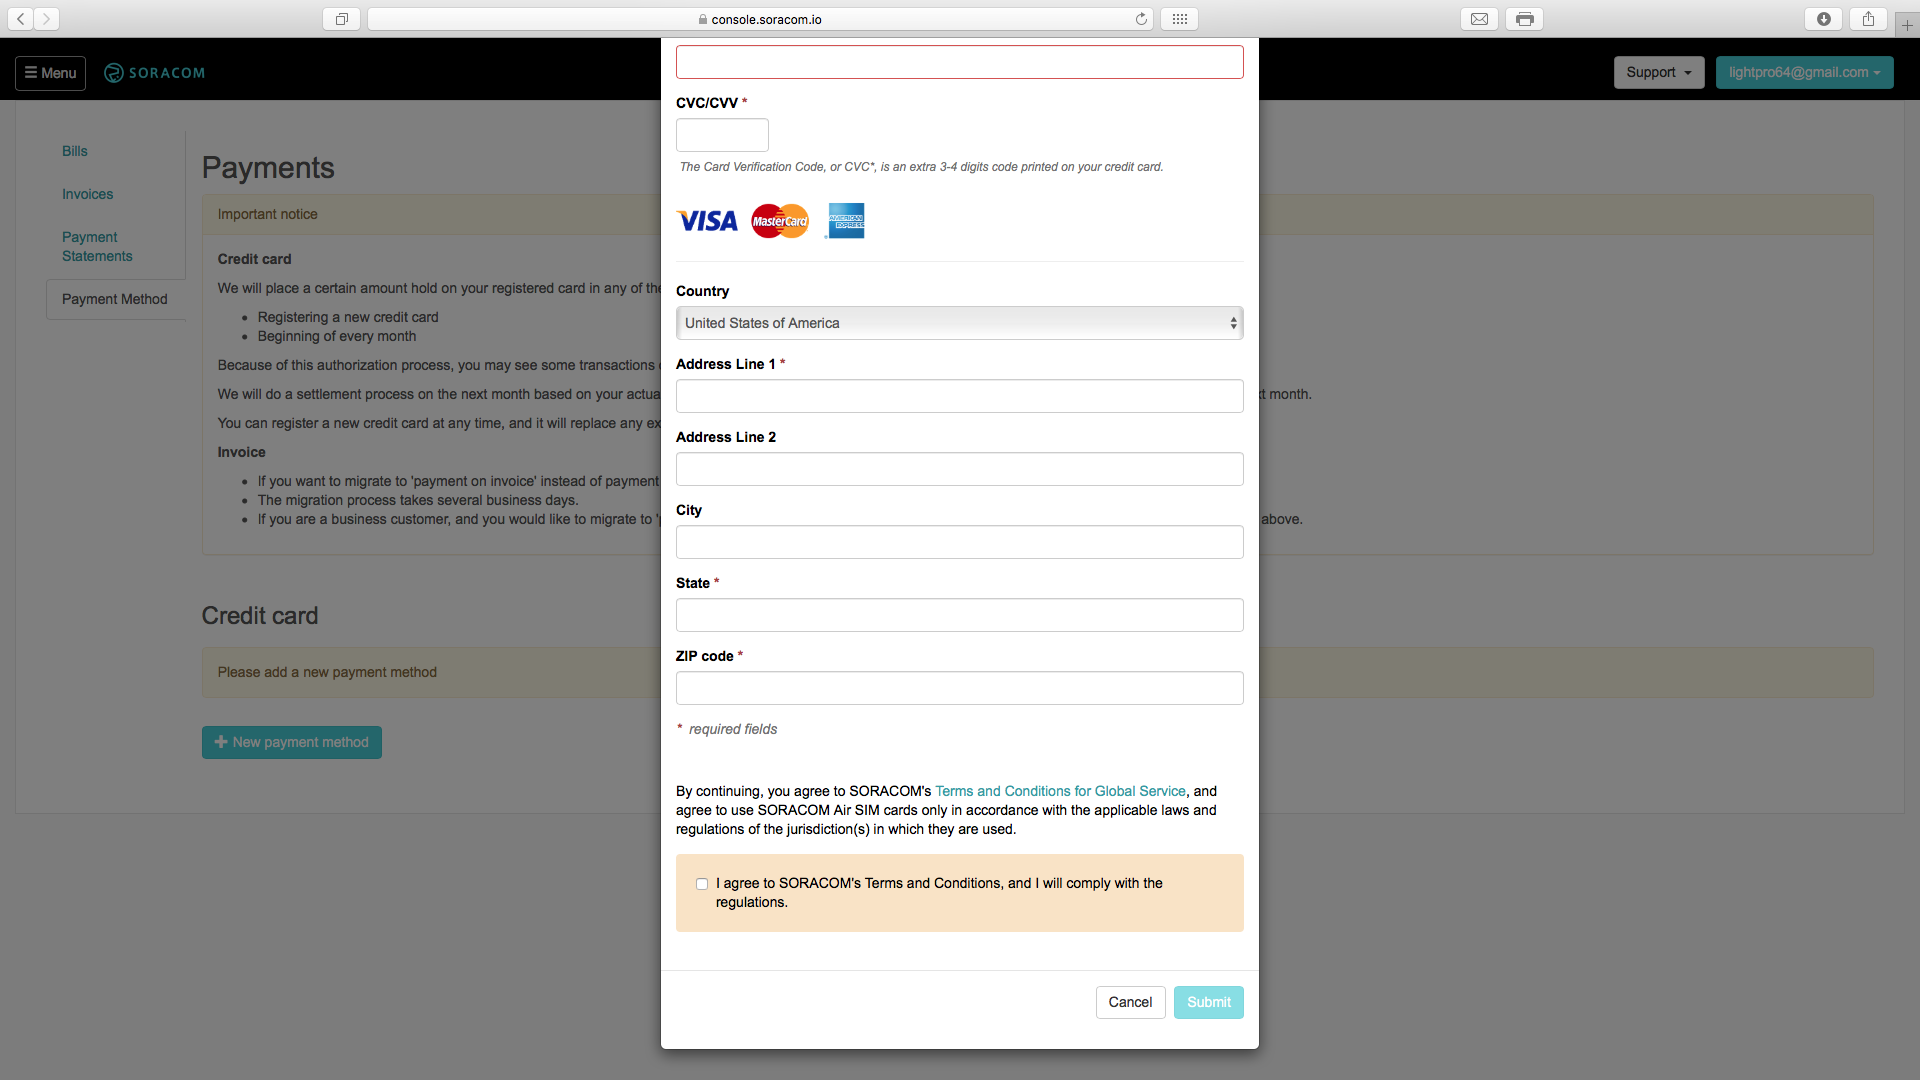
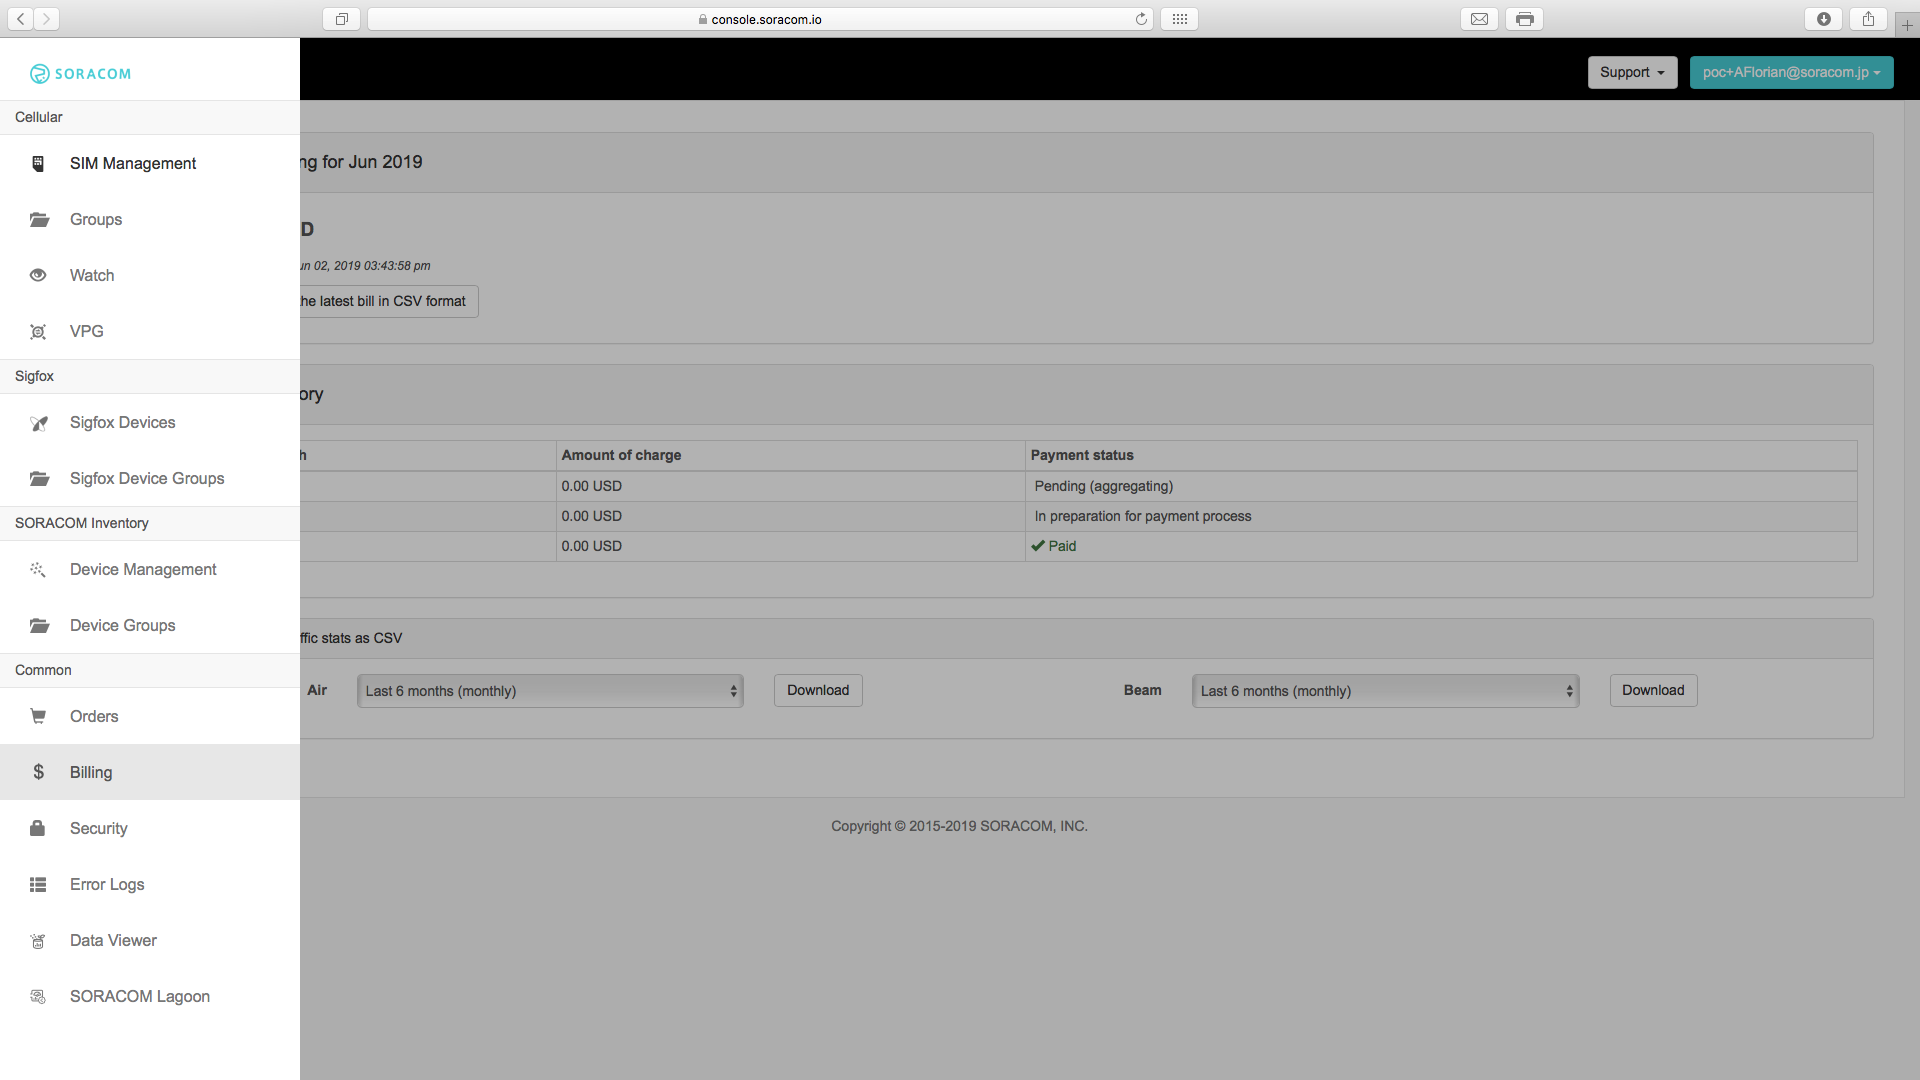
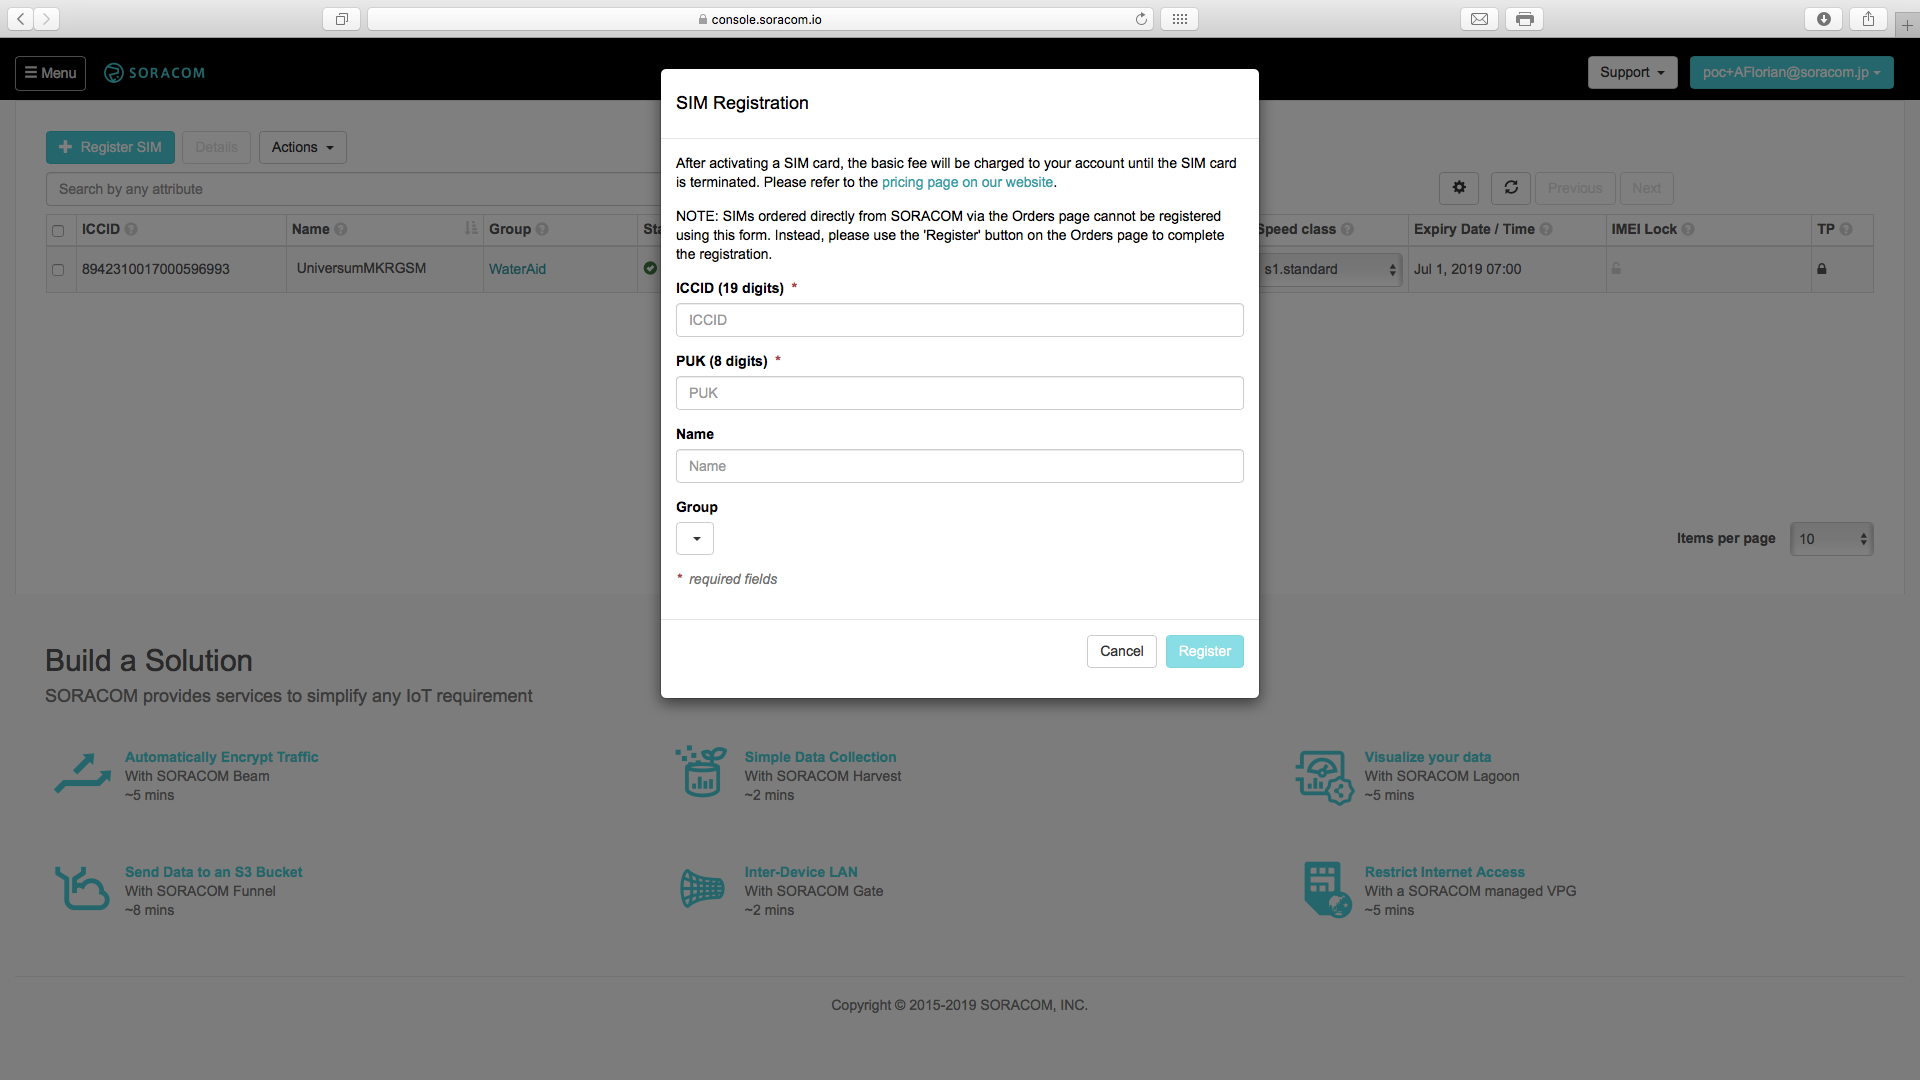
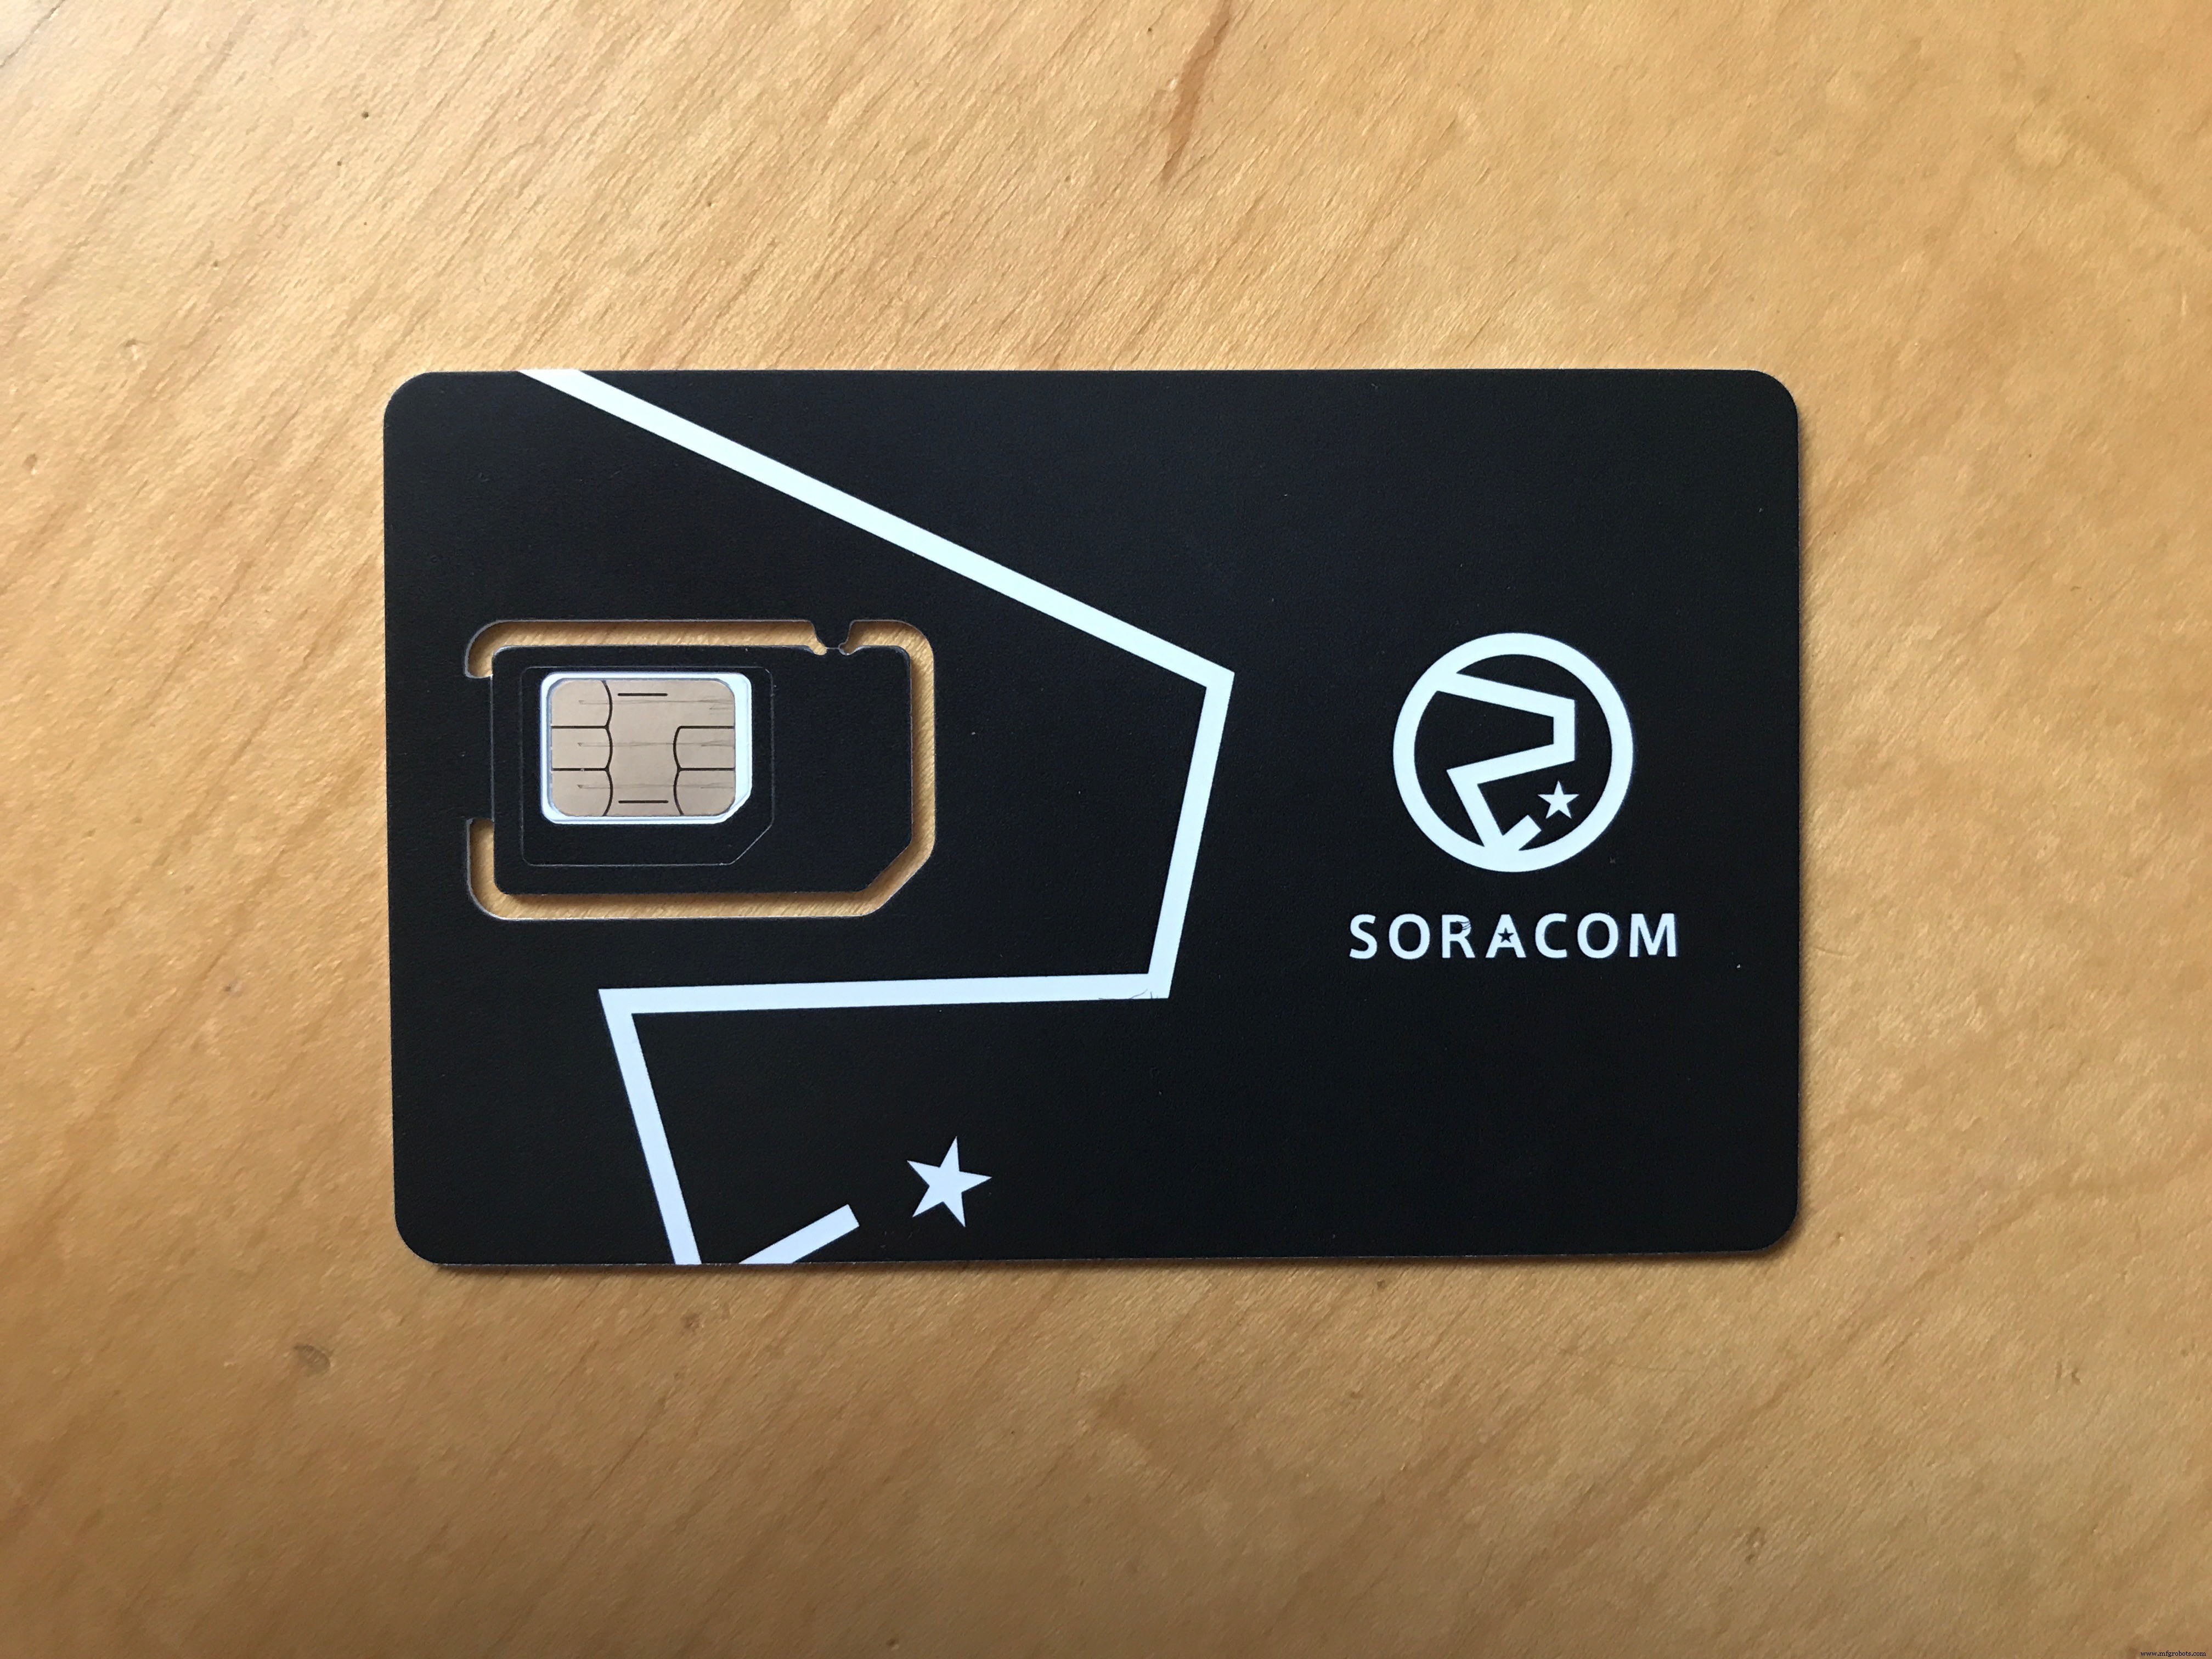
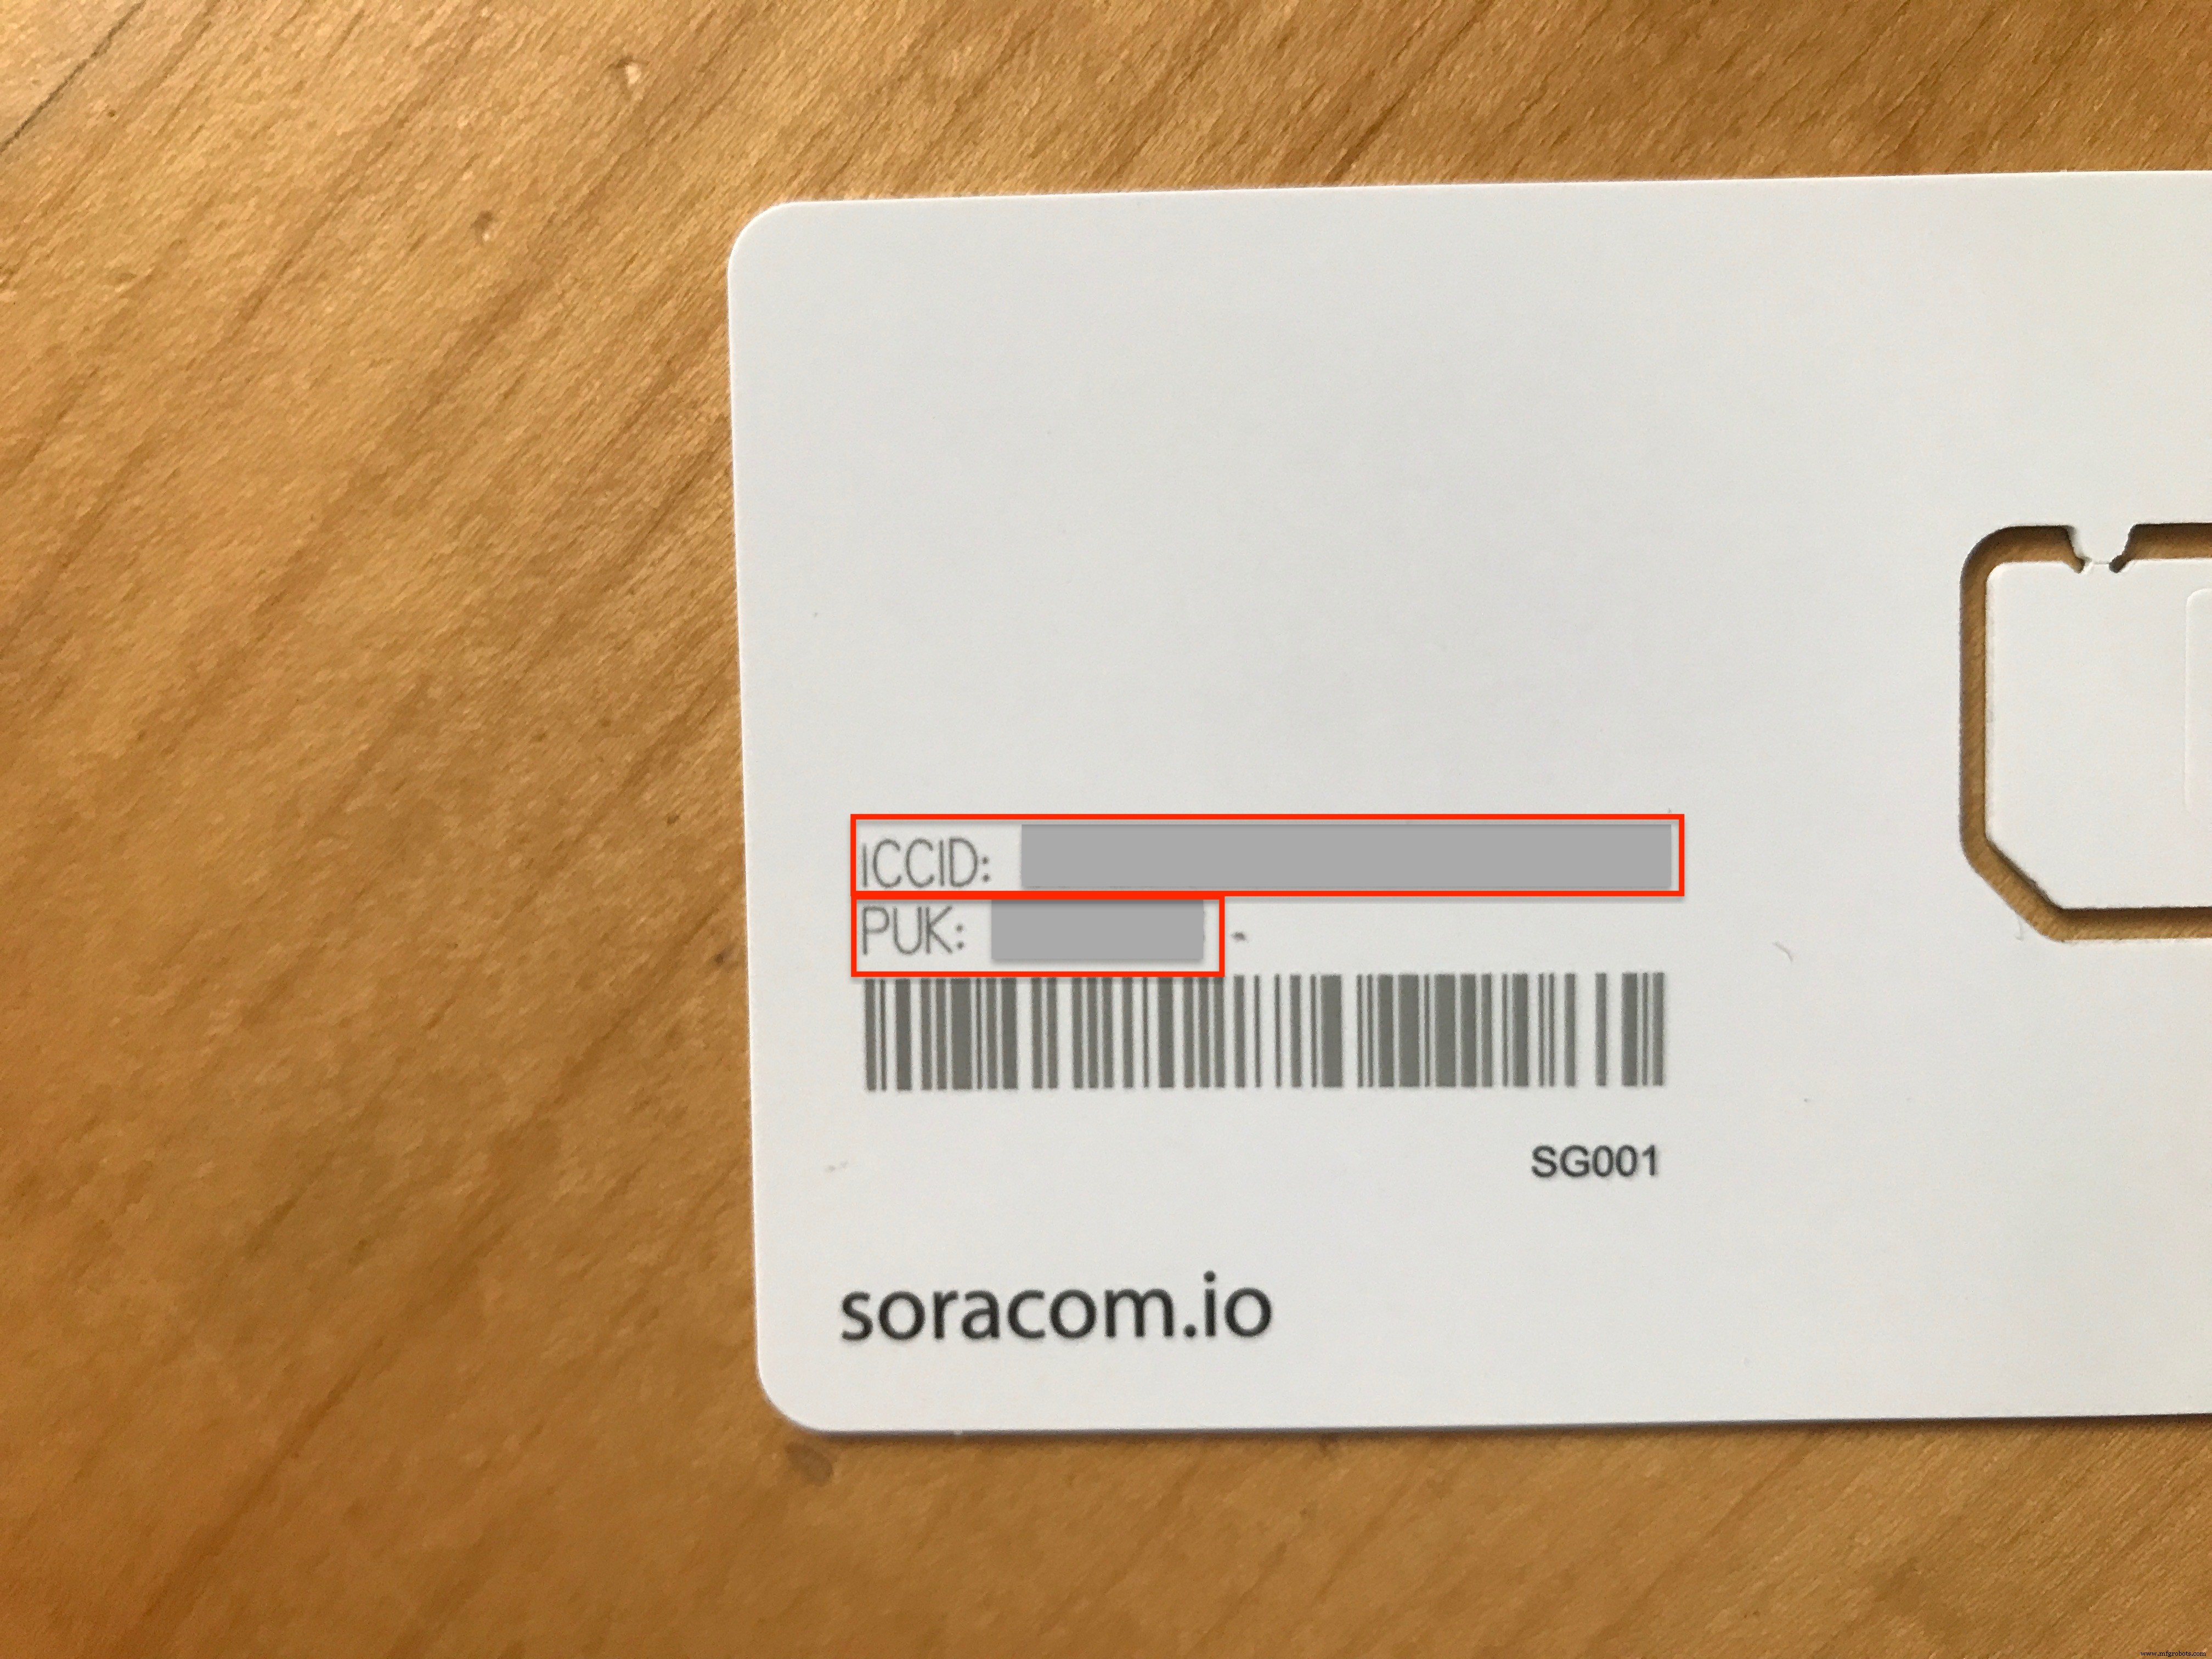
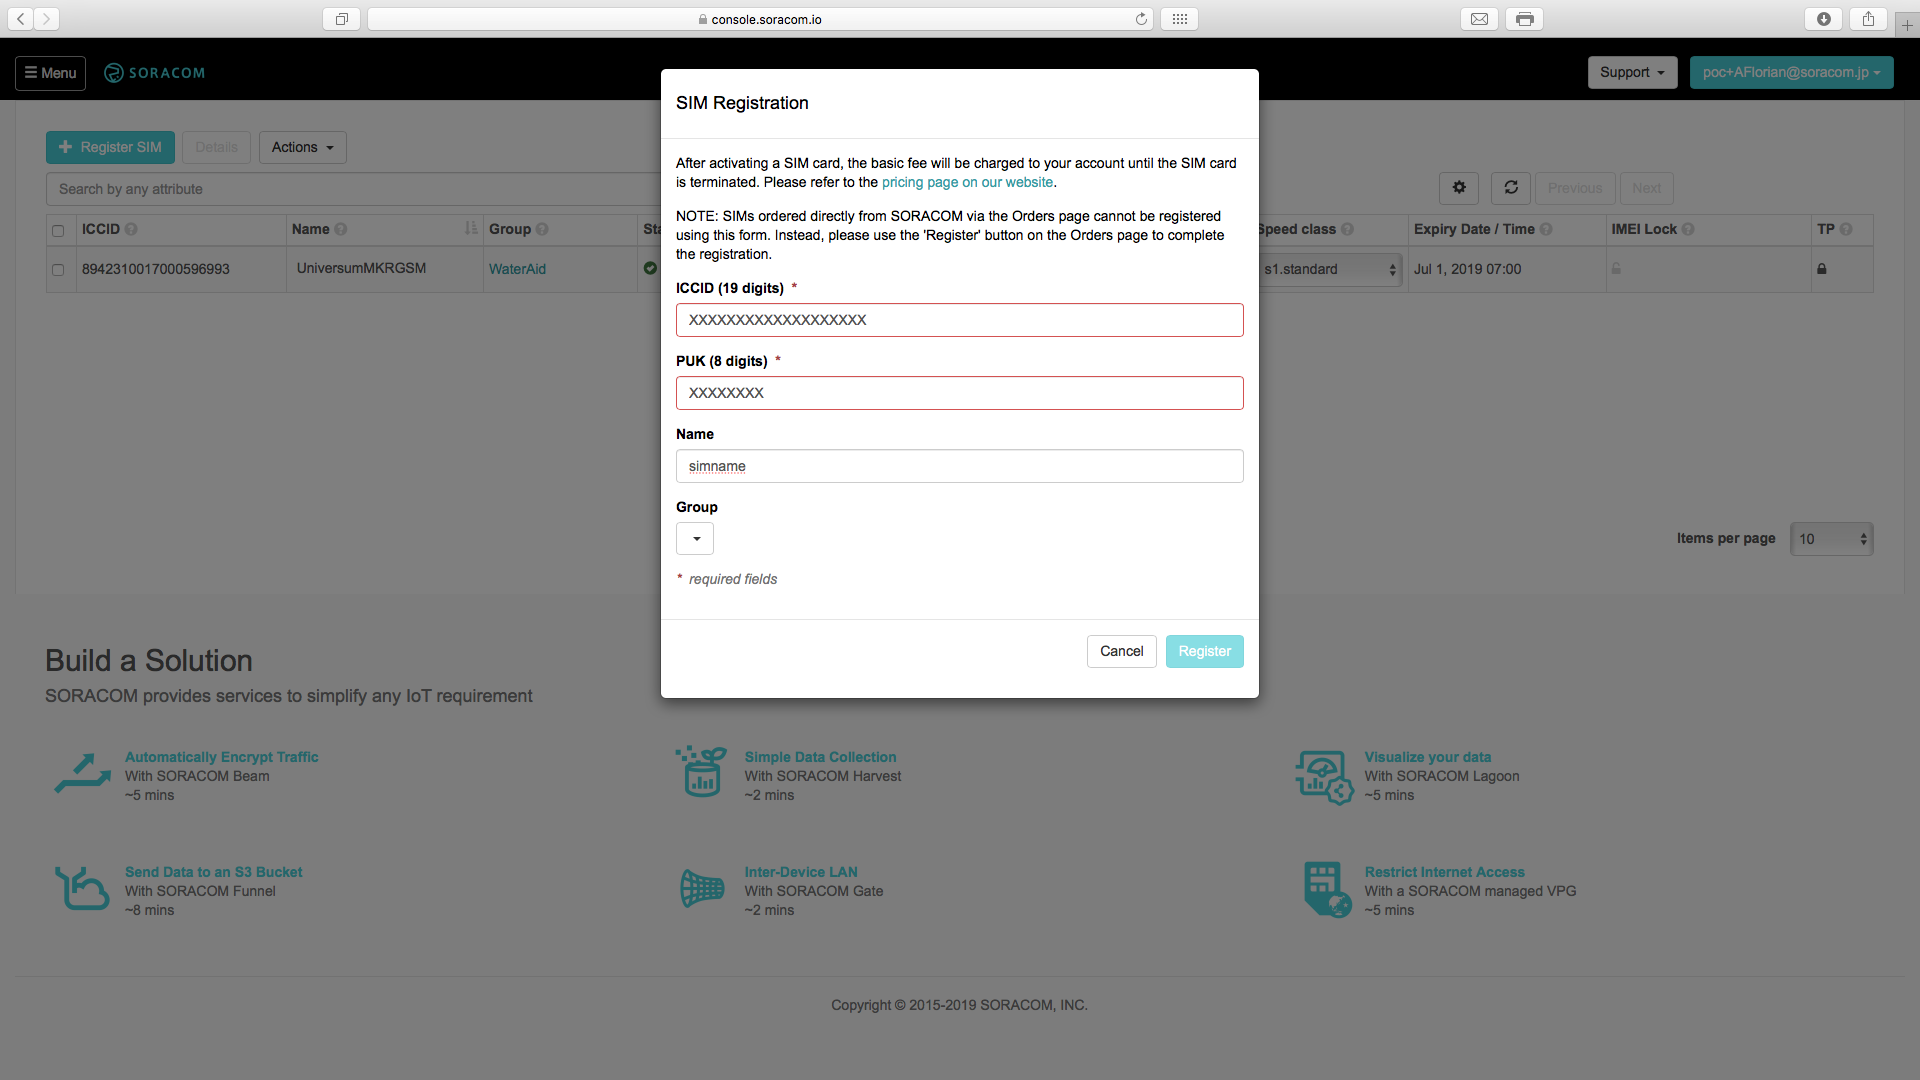
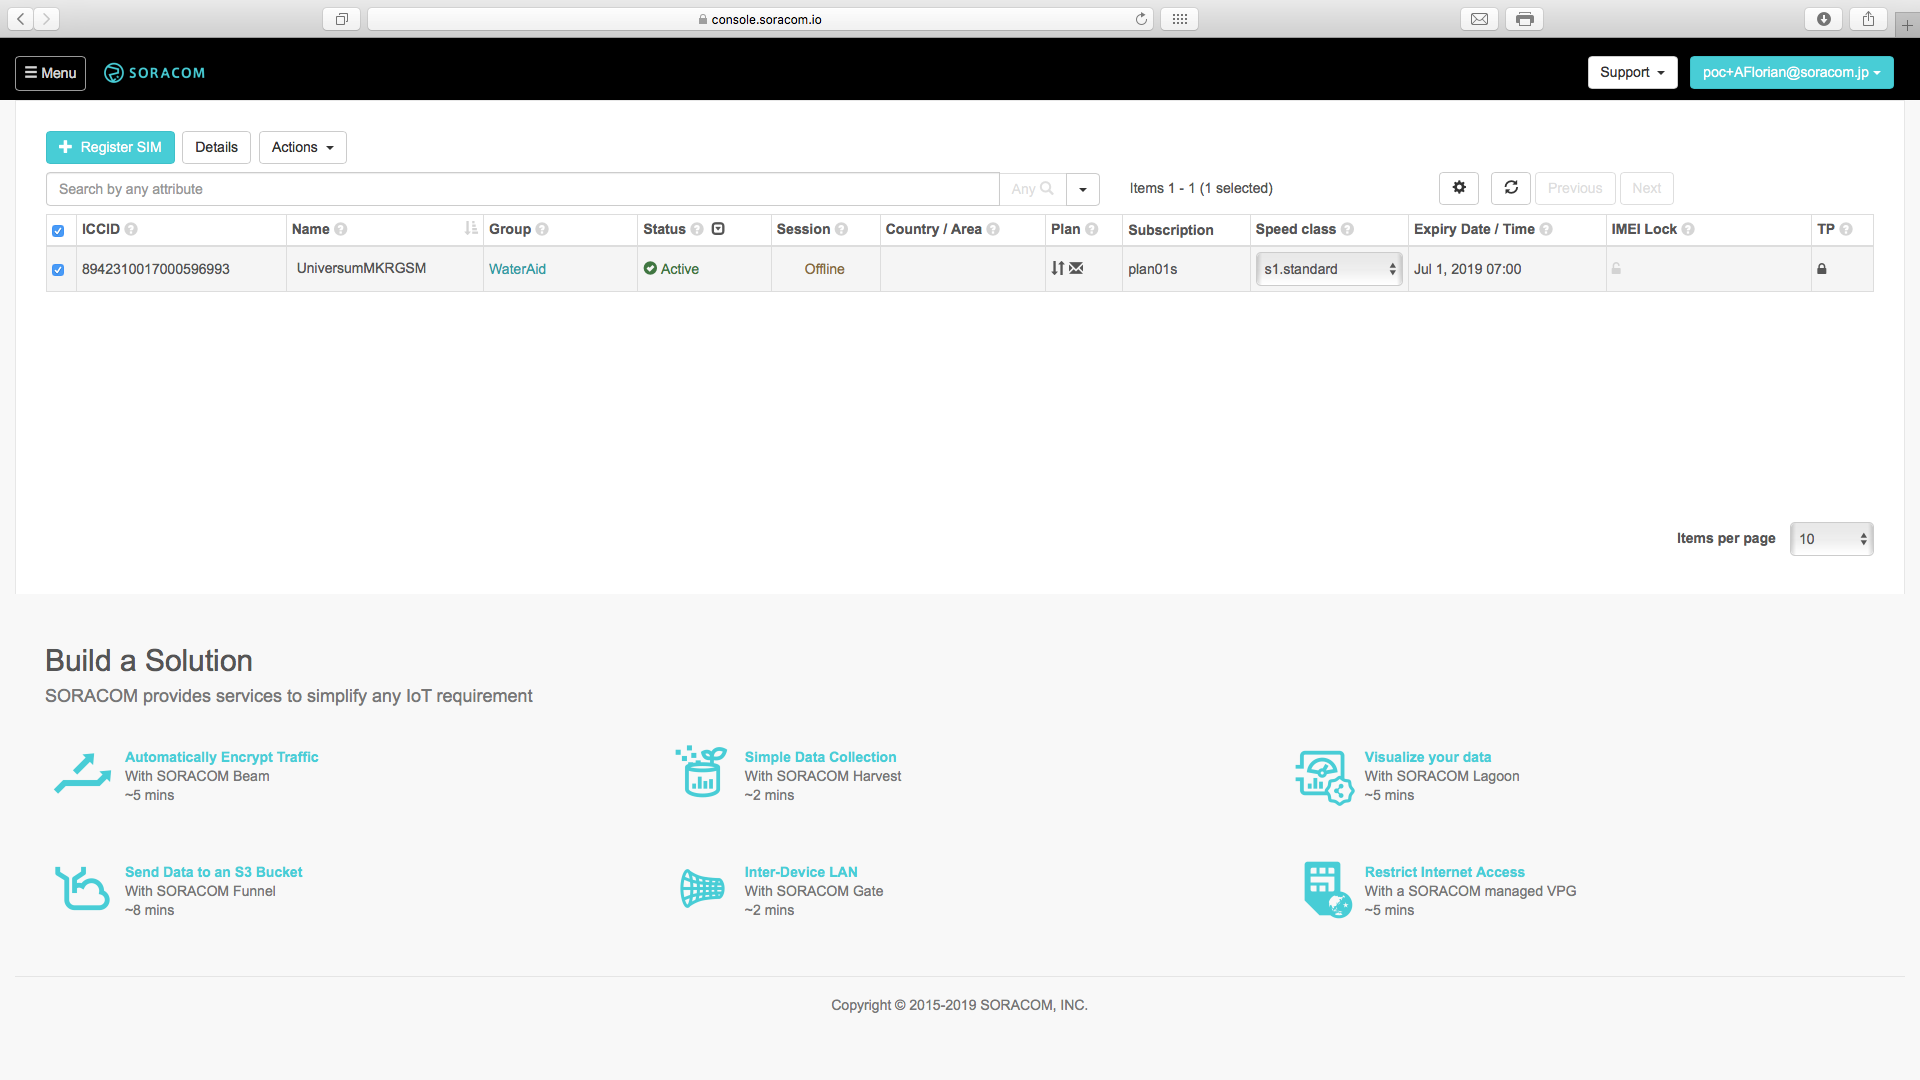
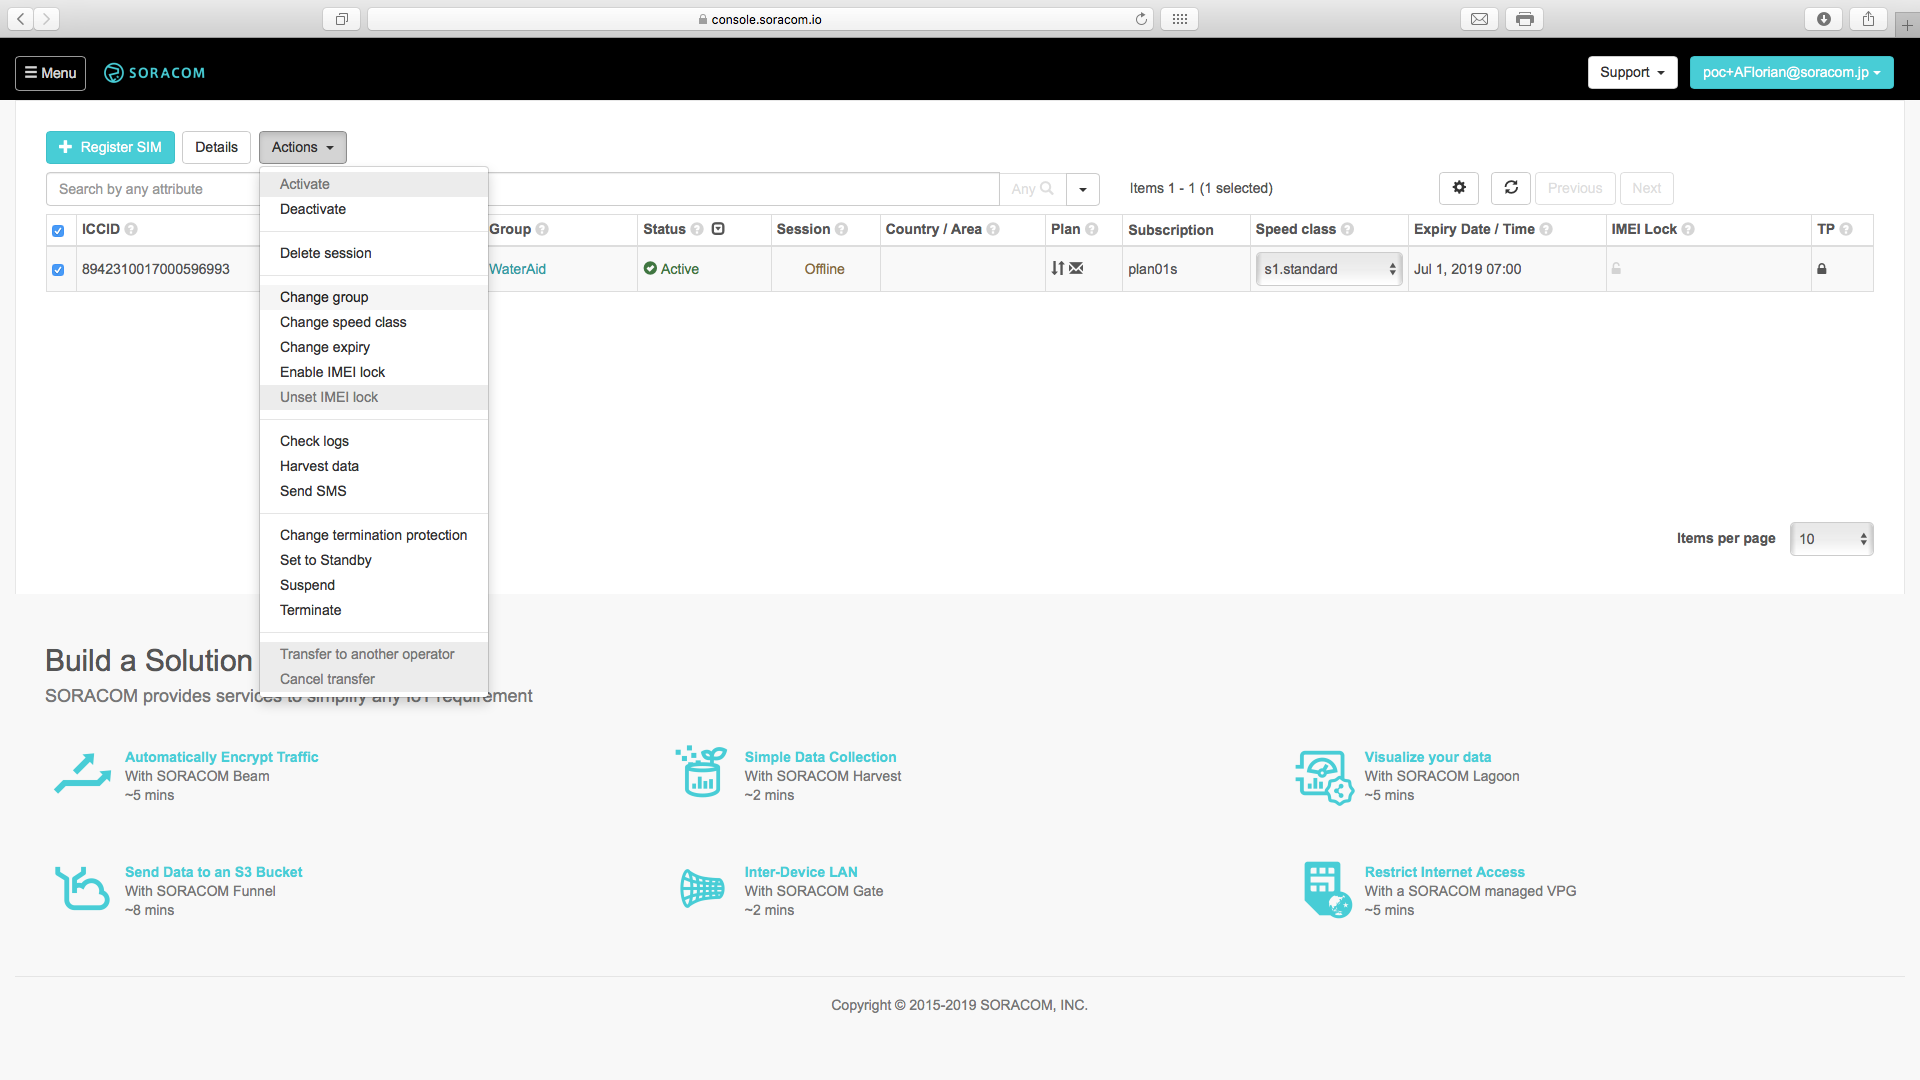
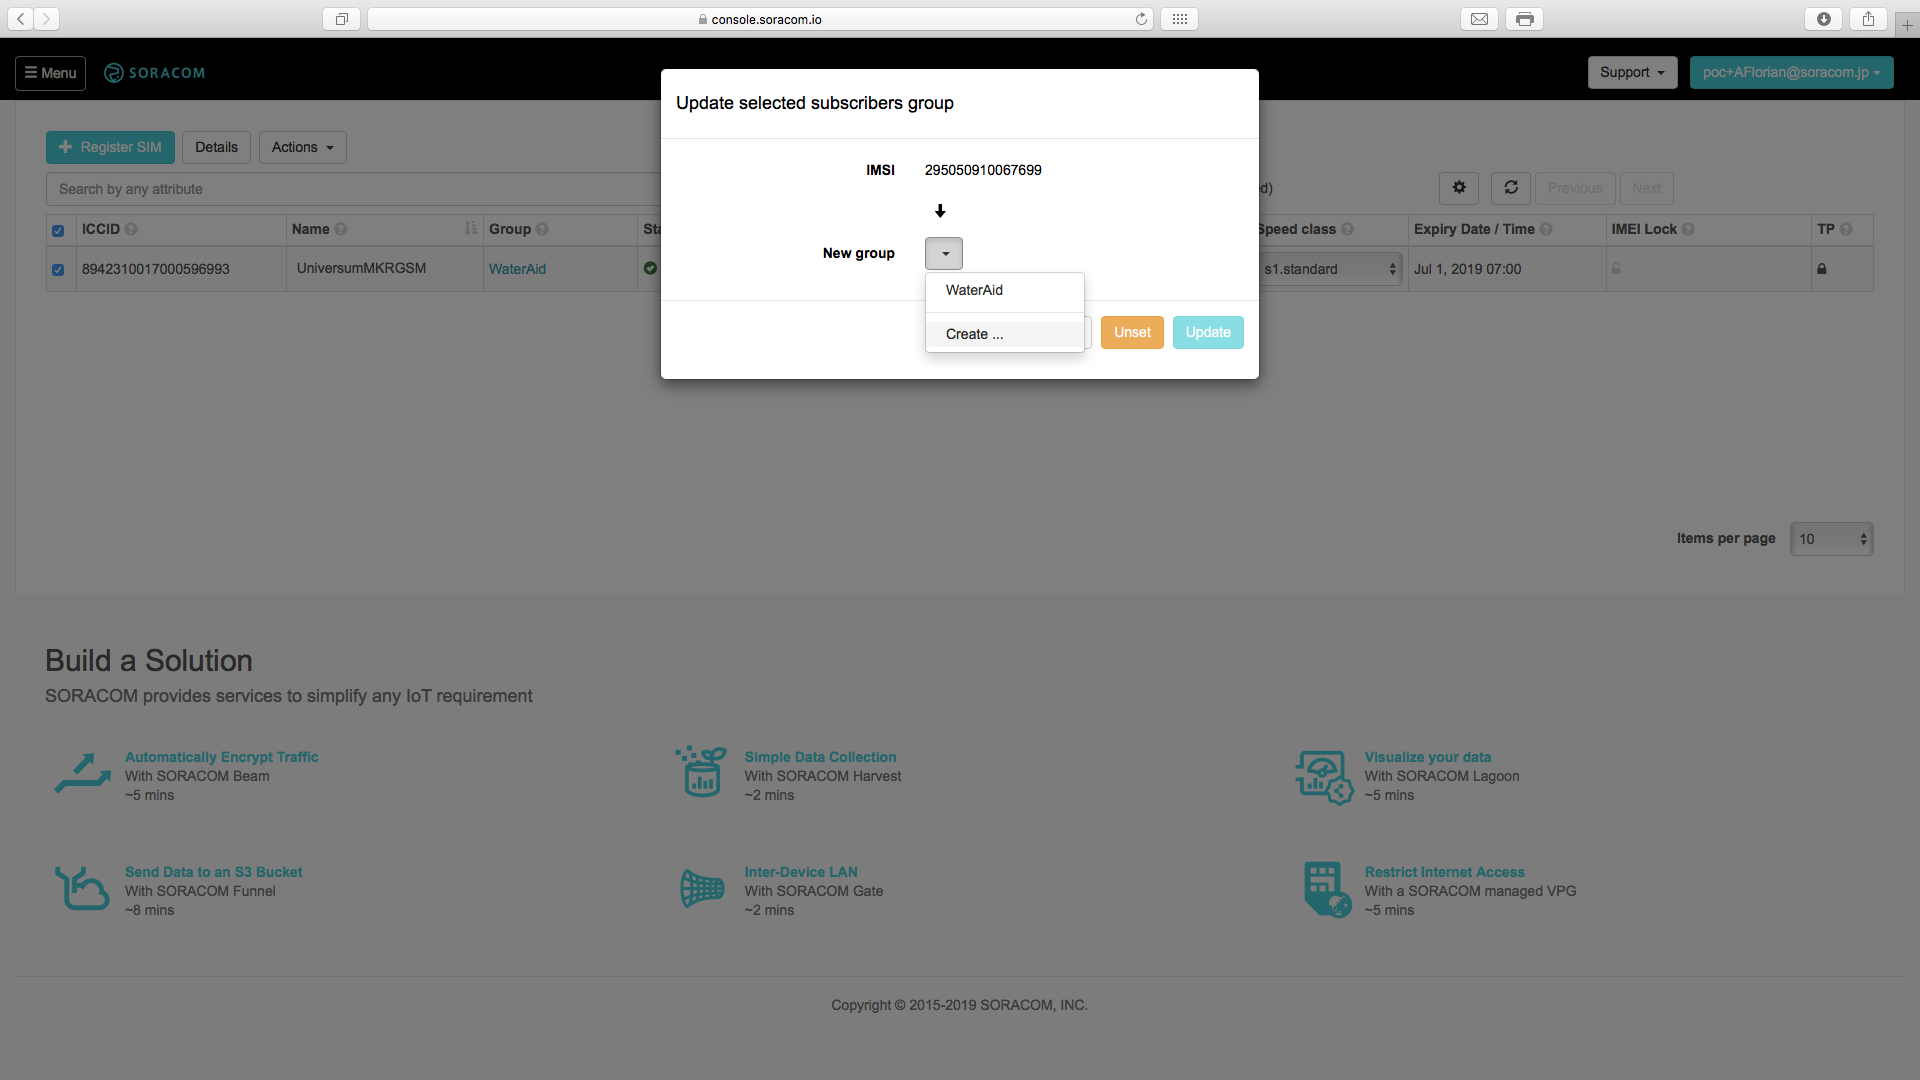
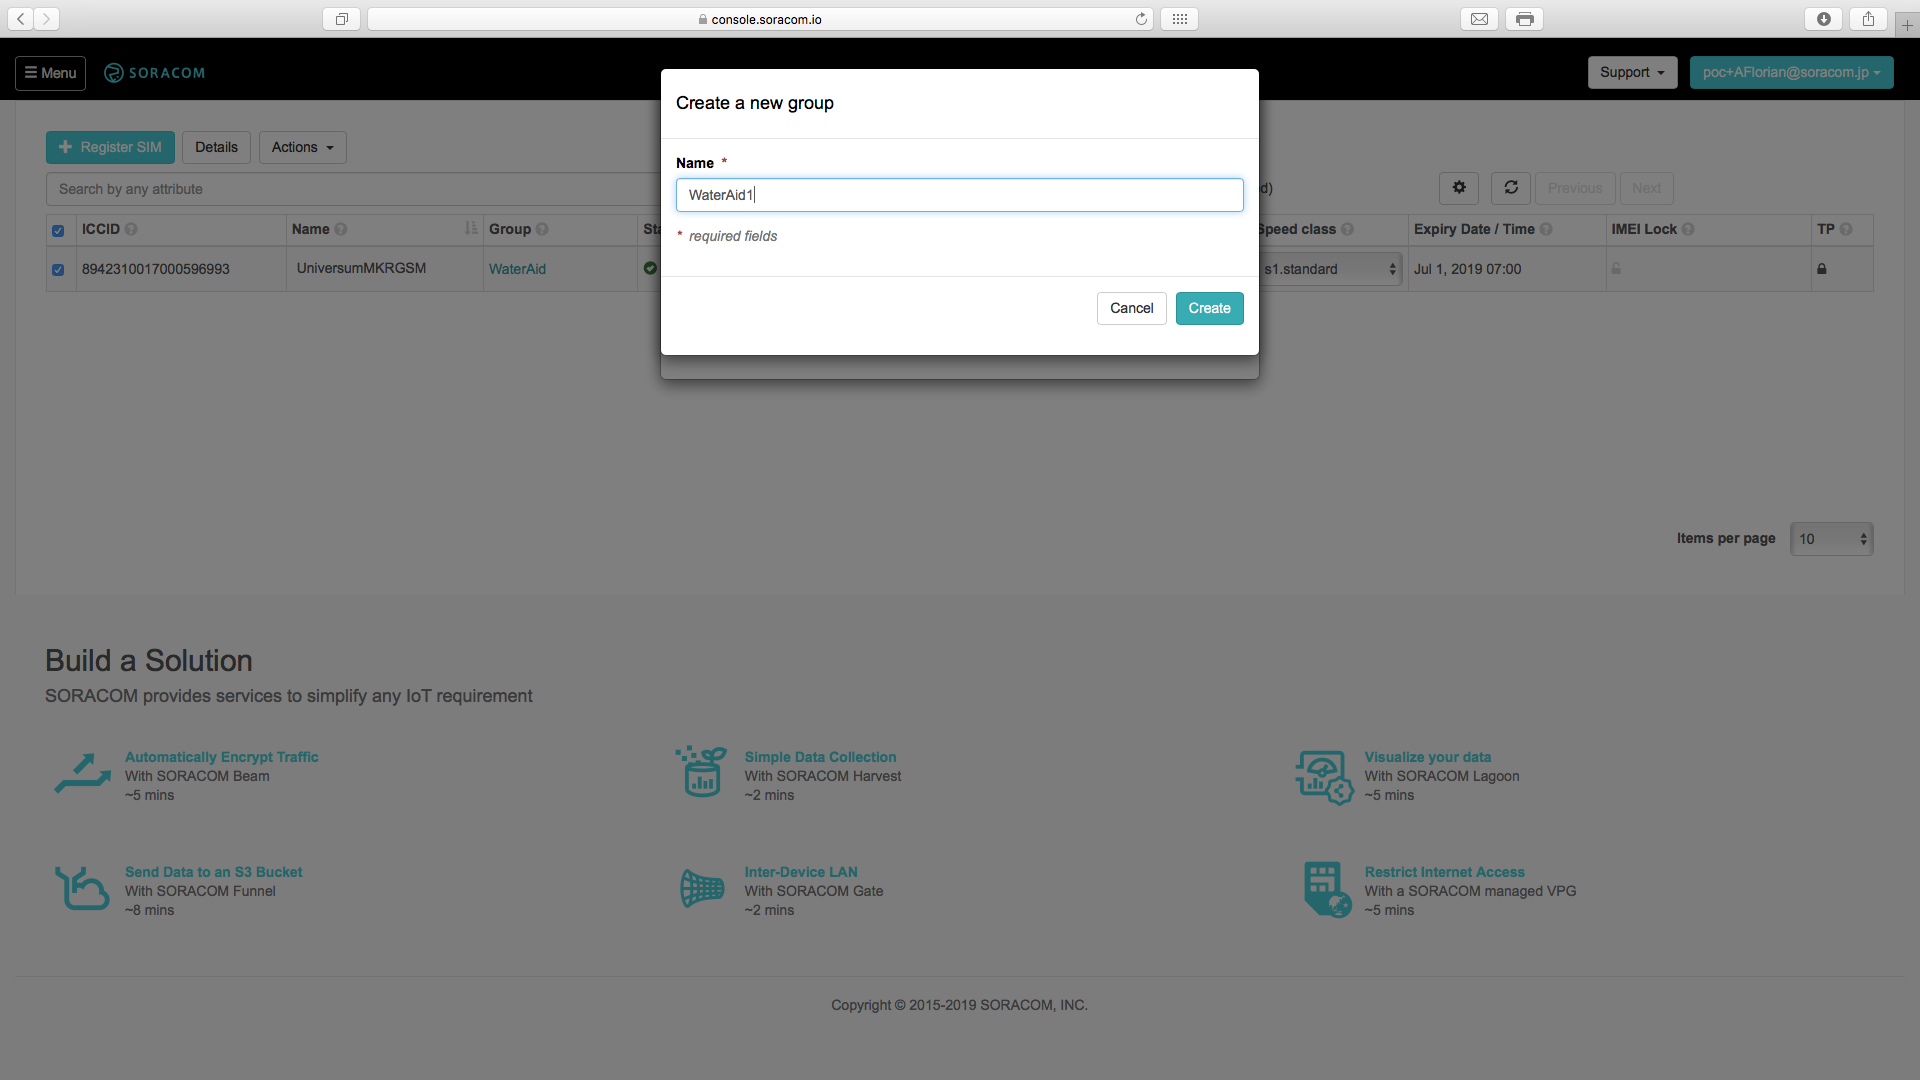
此步骤分为 2 个部分,第一个部分将介绍在 Soracom 上创建帐户并注册您的 SIM 卡,而另一个部分将介绍设置 Soracom Harvest 以从 Air 收集数据。如果您已经拥有 Soracom 帐户,请跳过第一部分。
第 1 部分:创建帐户


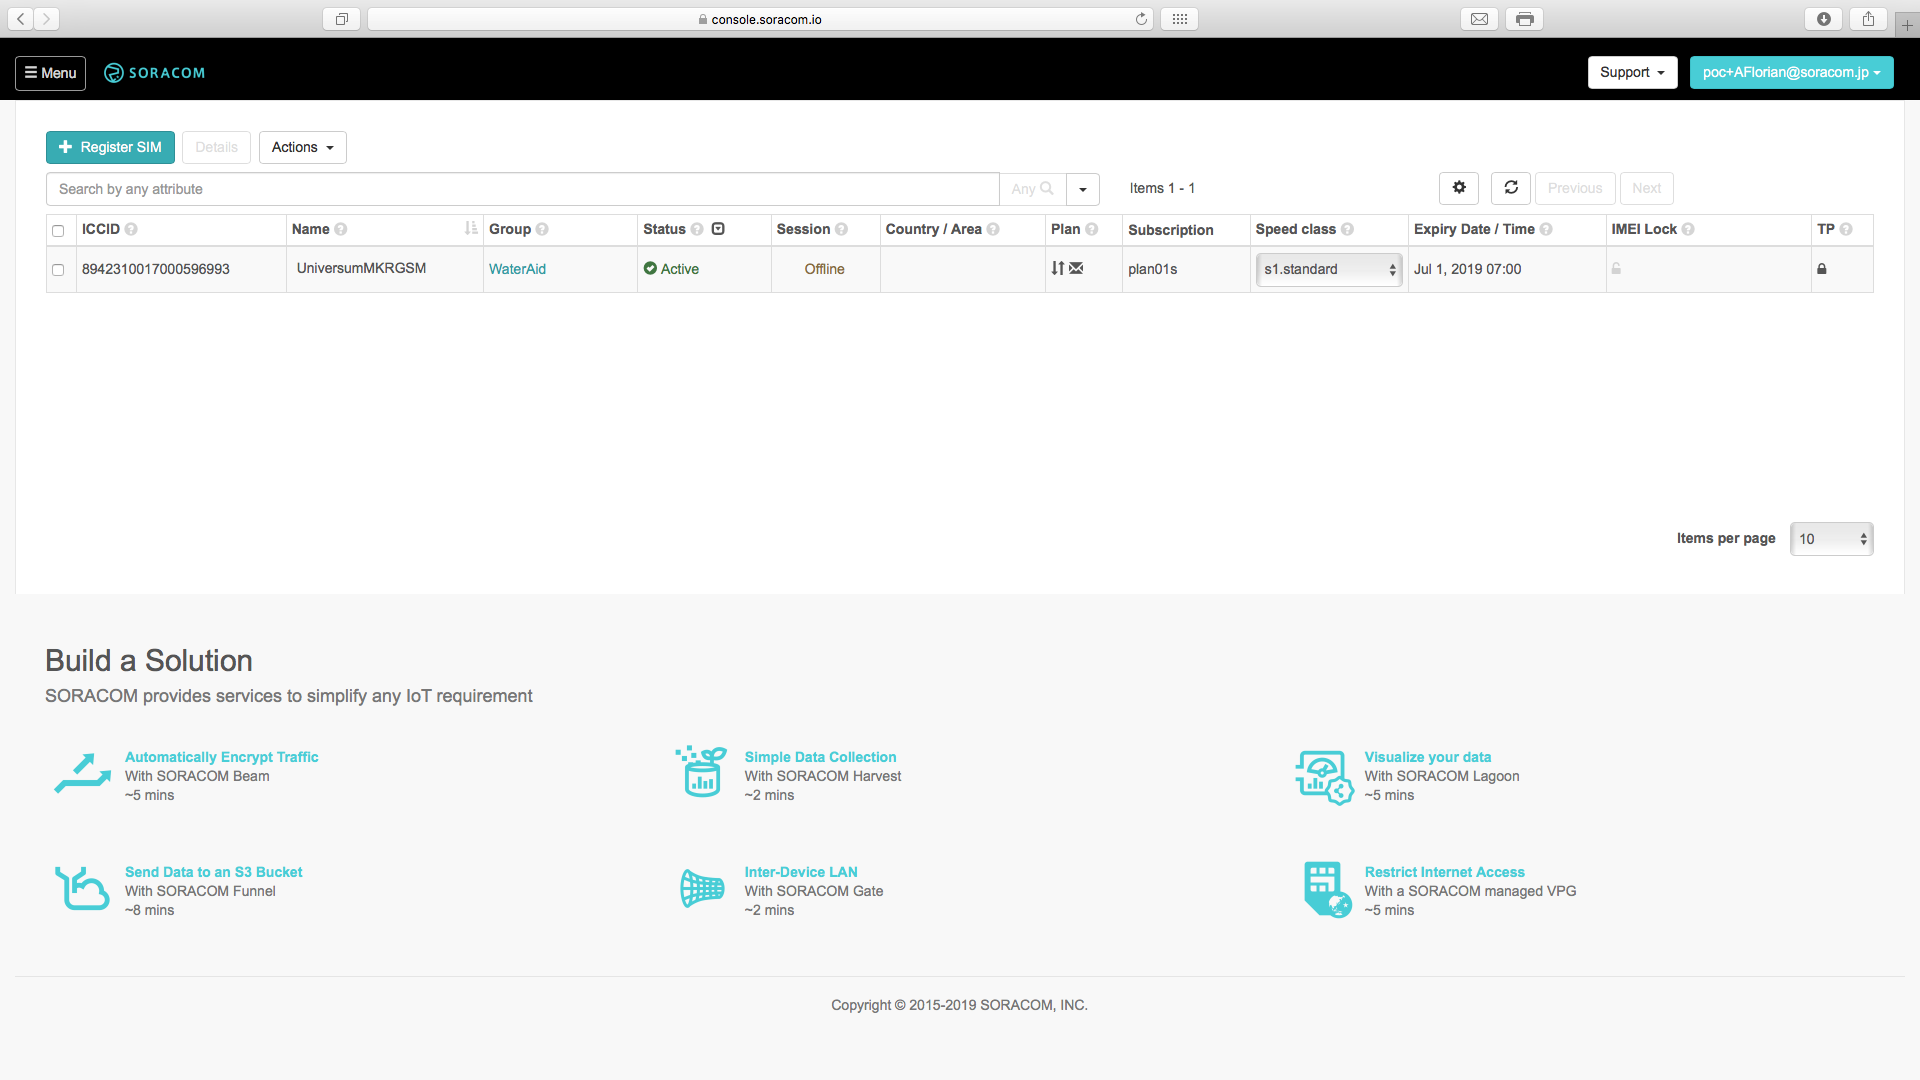
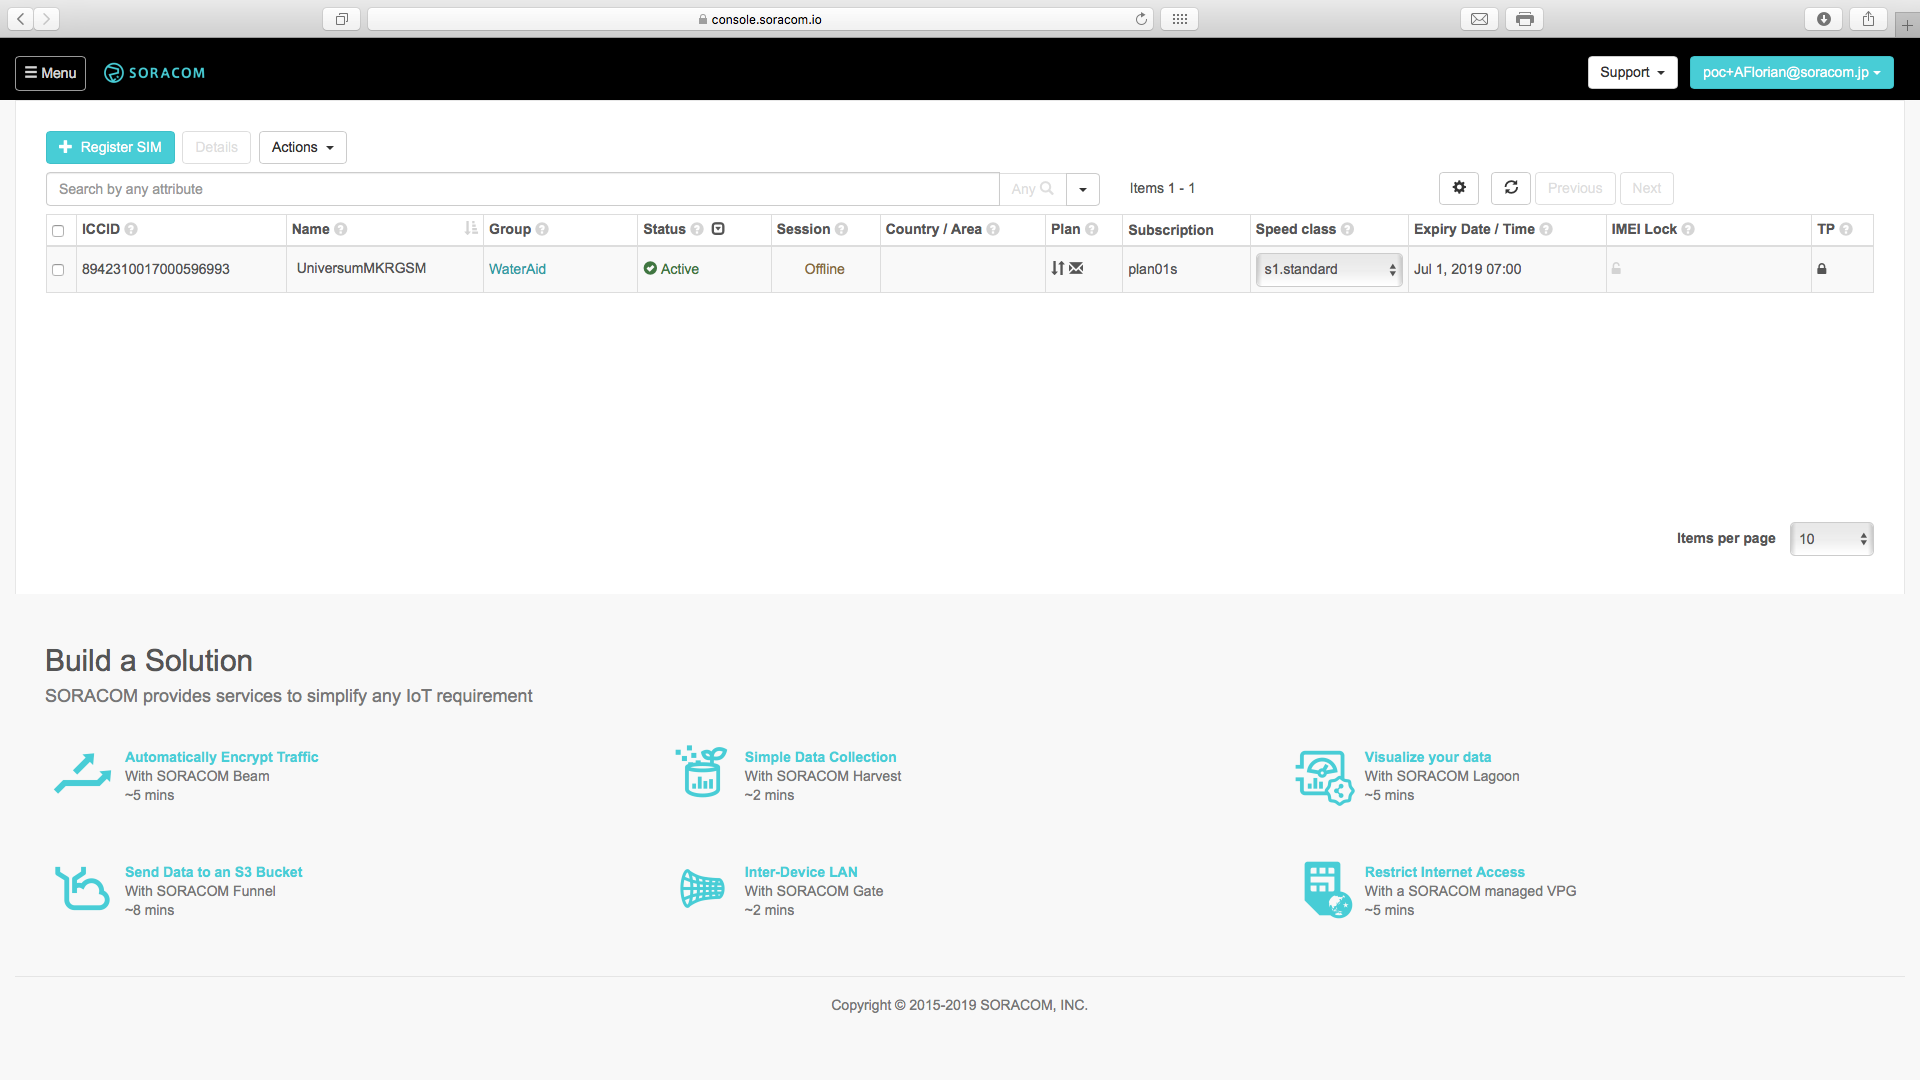
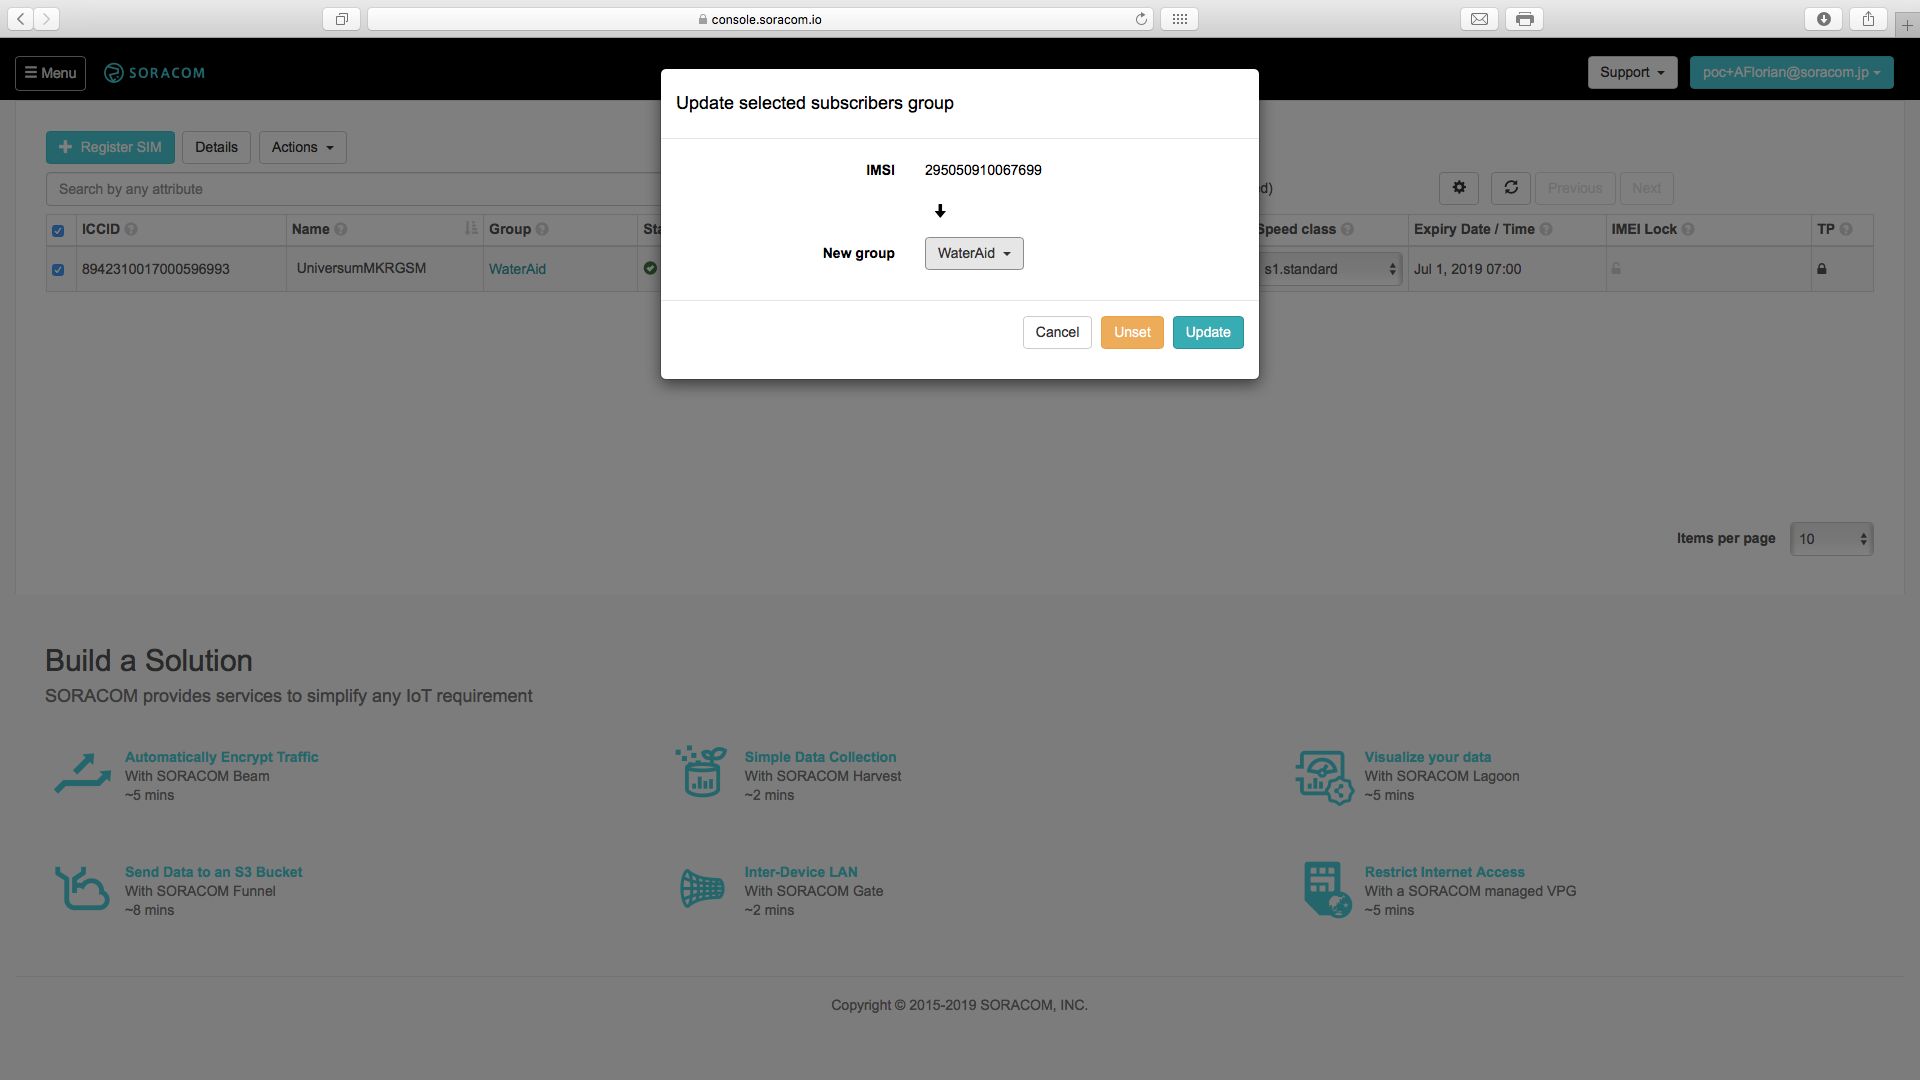
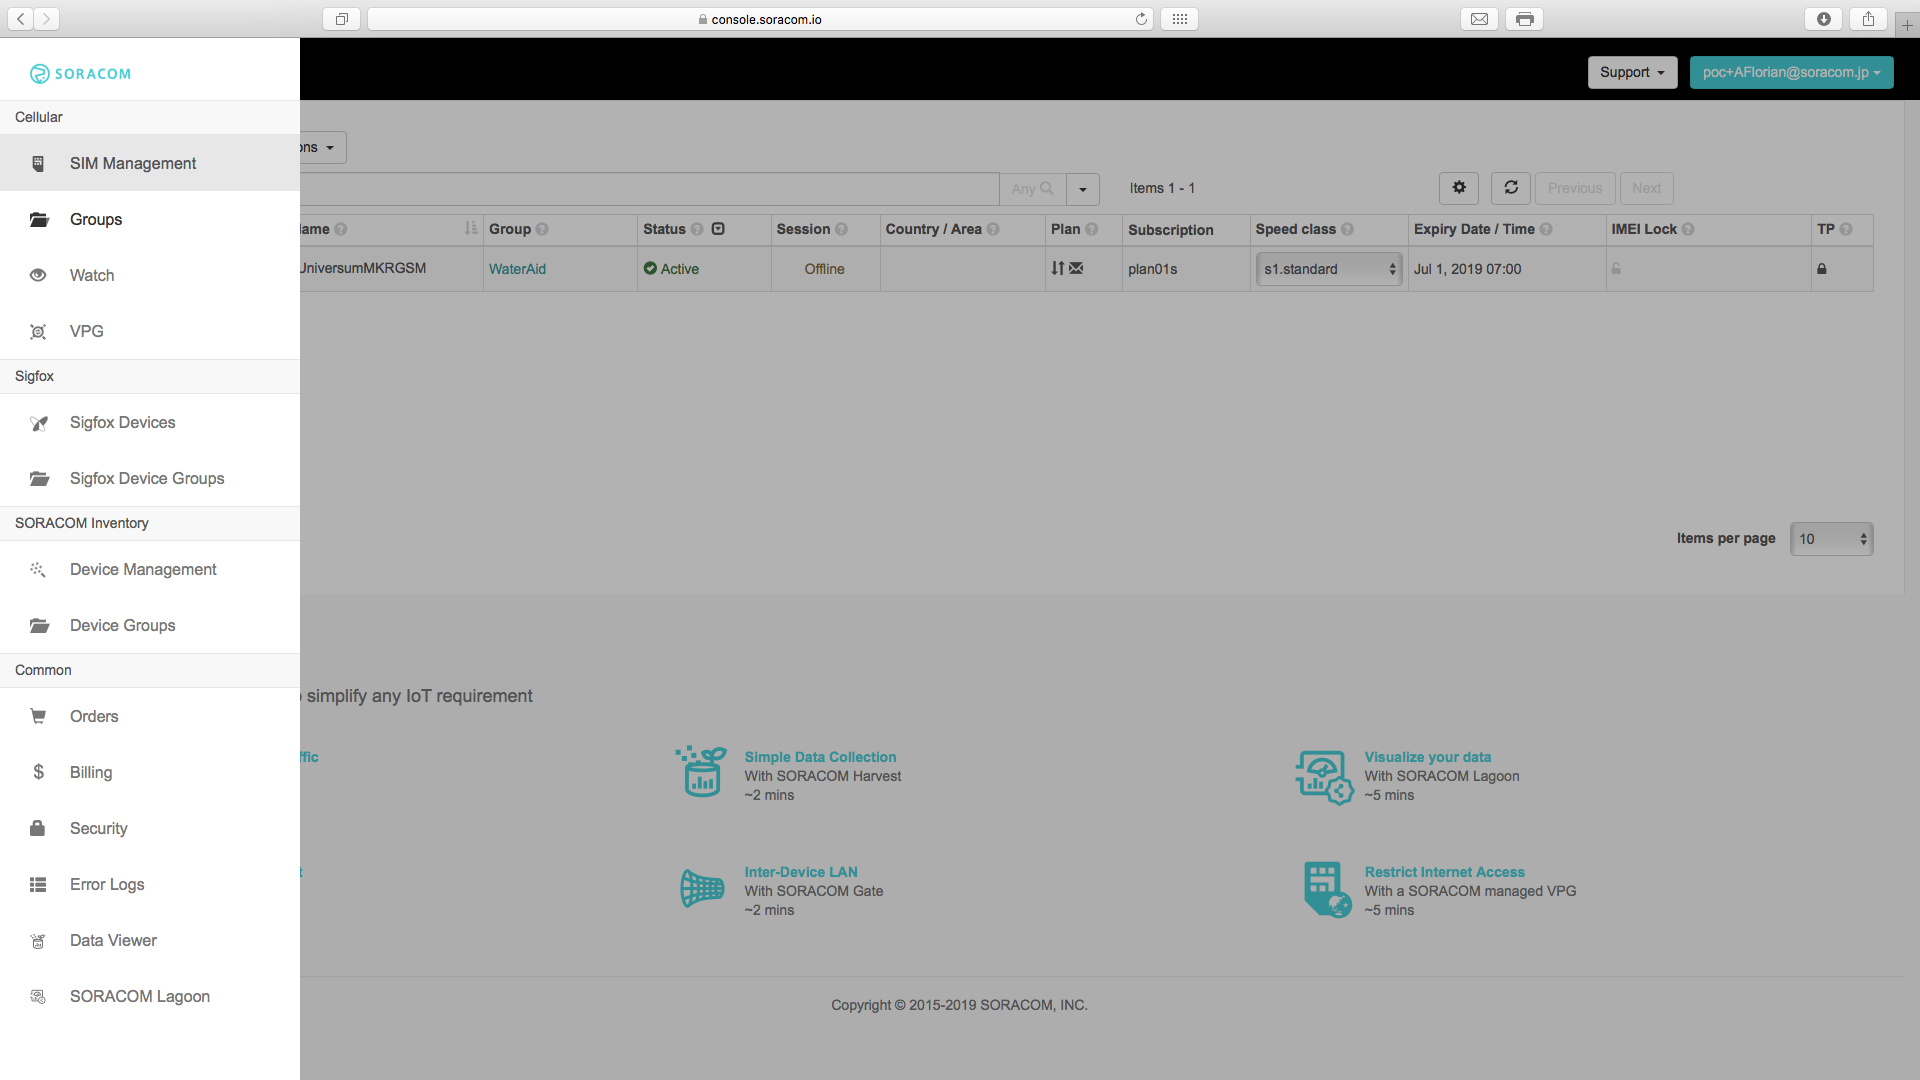
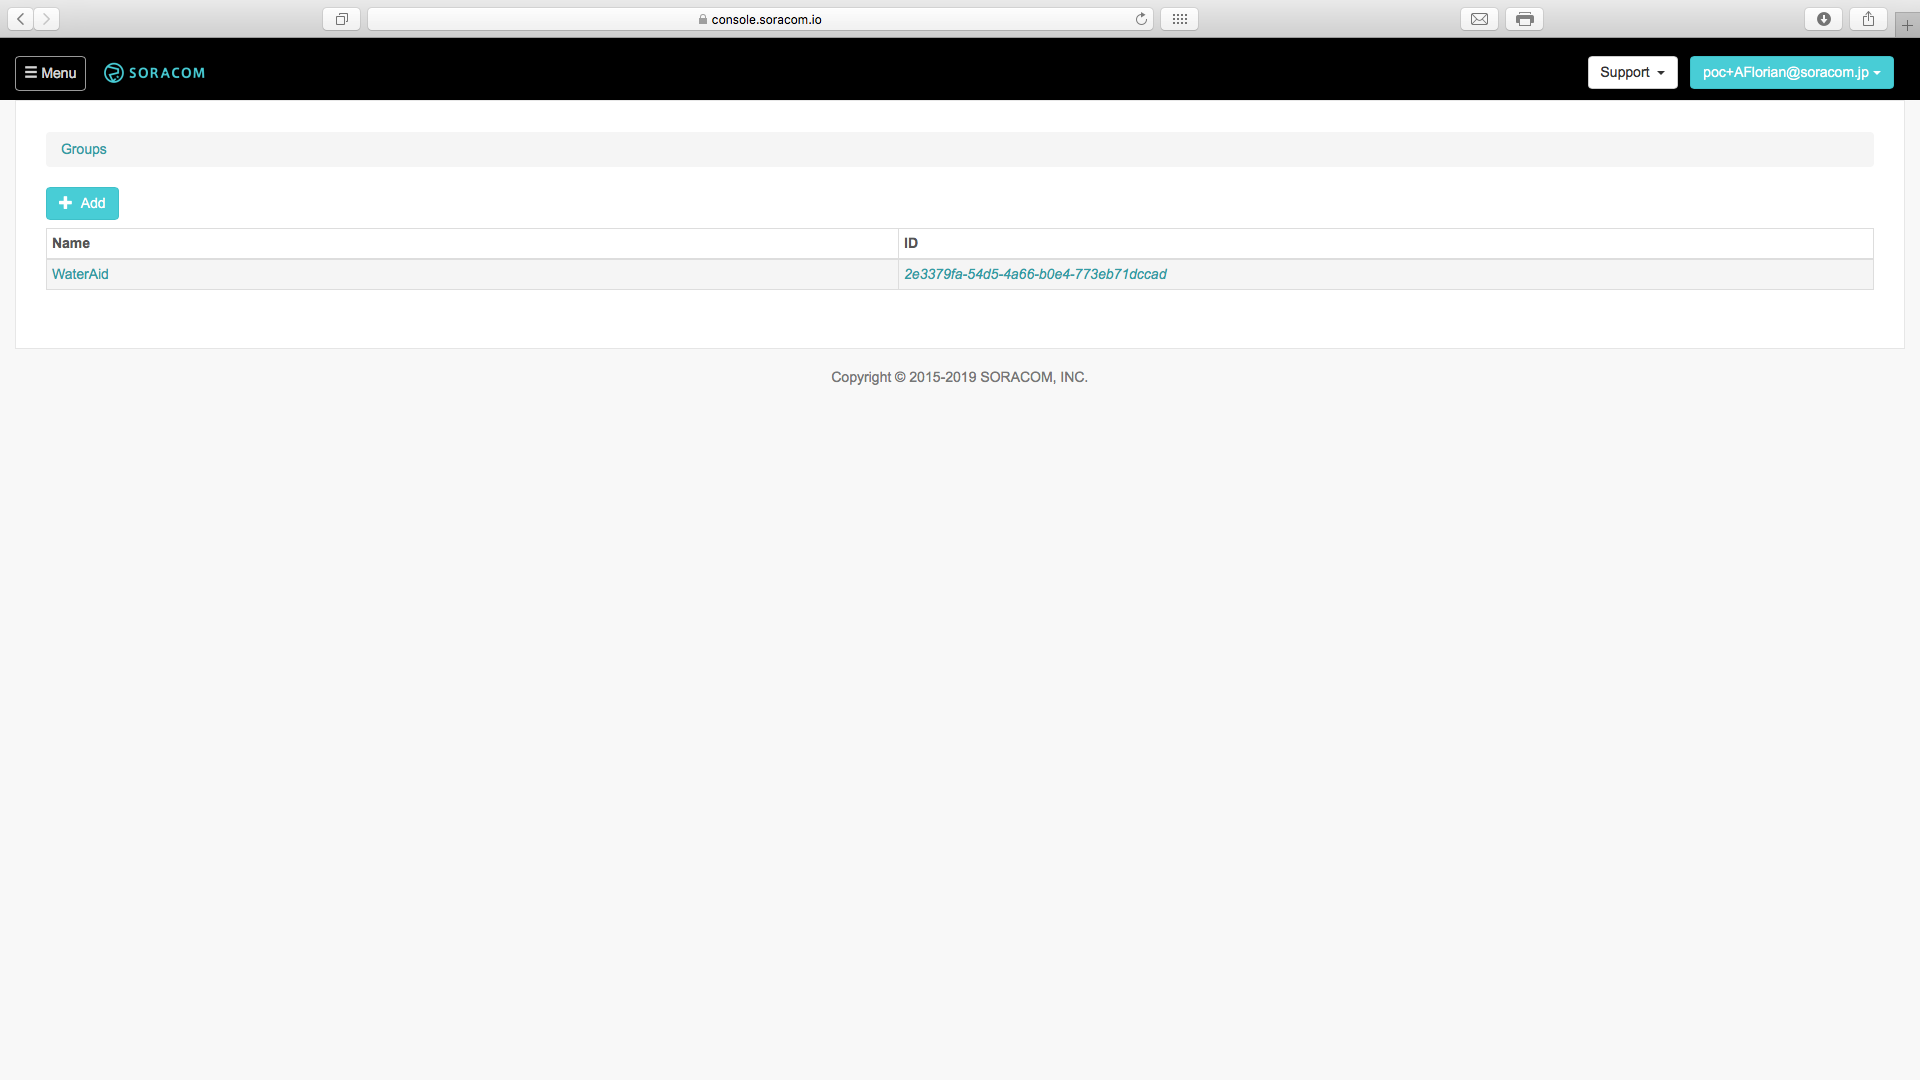
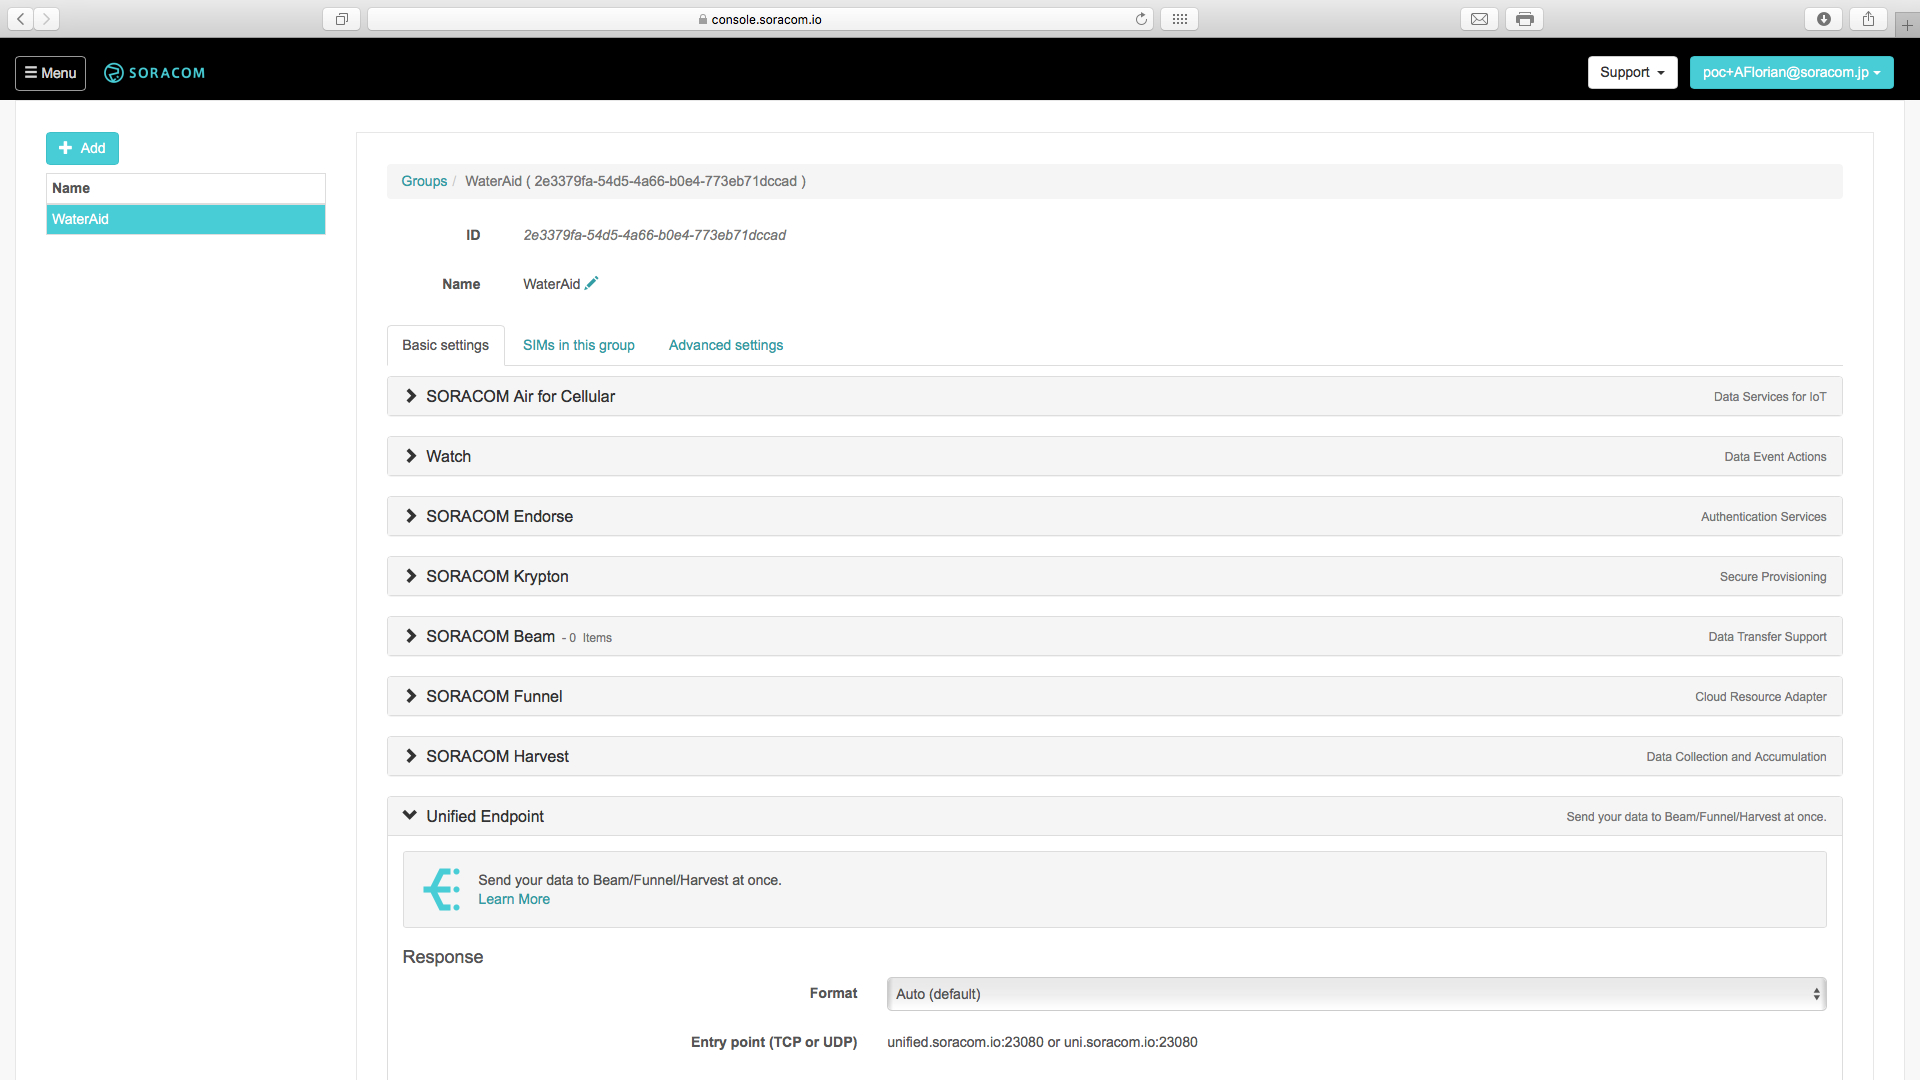
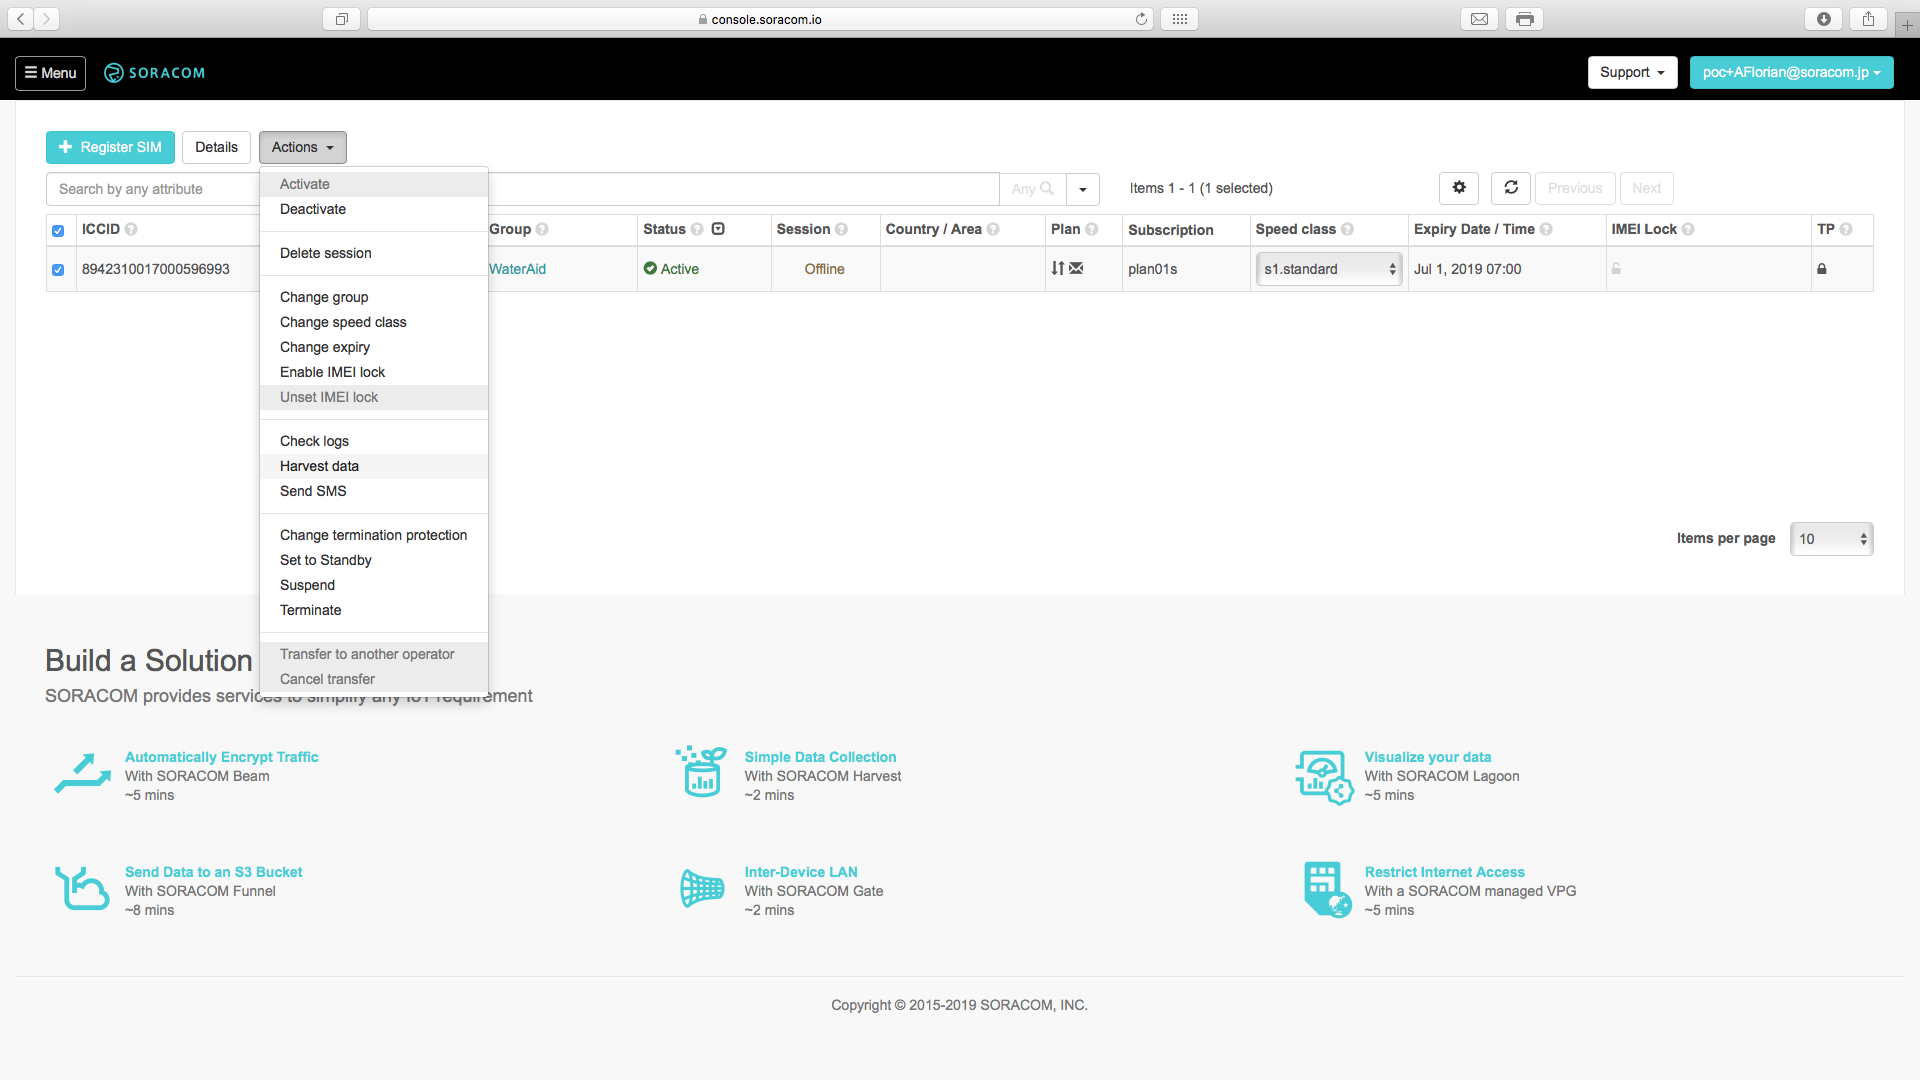
第 2 部分:组和收获


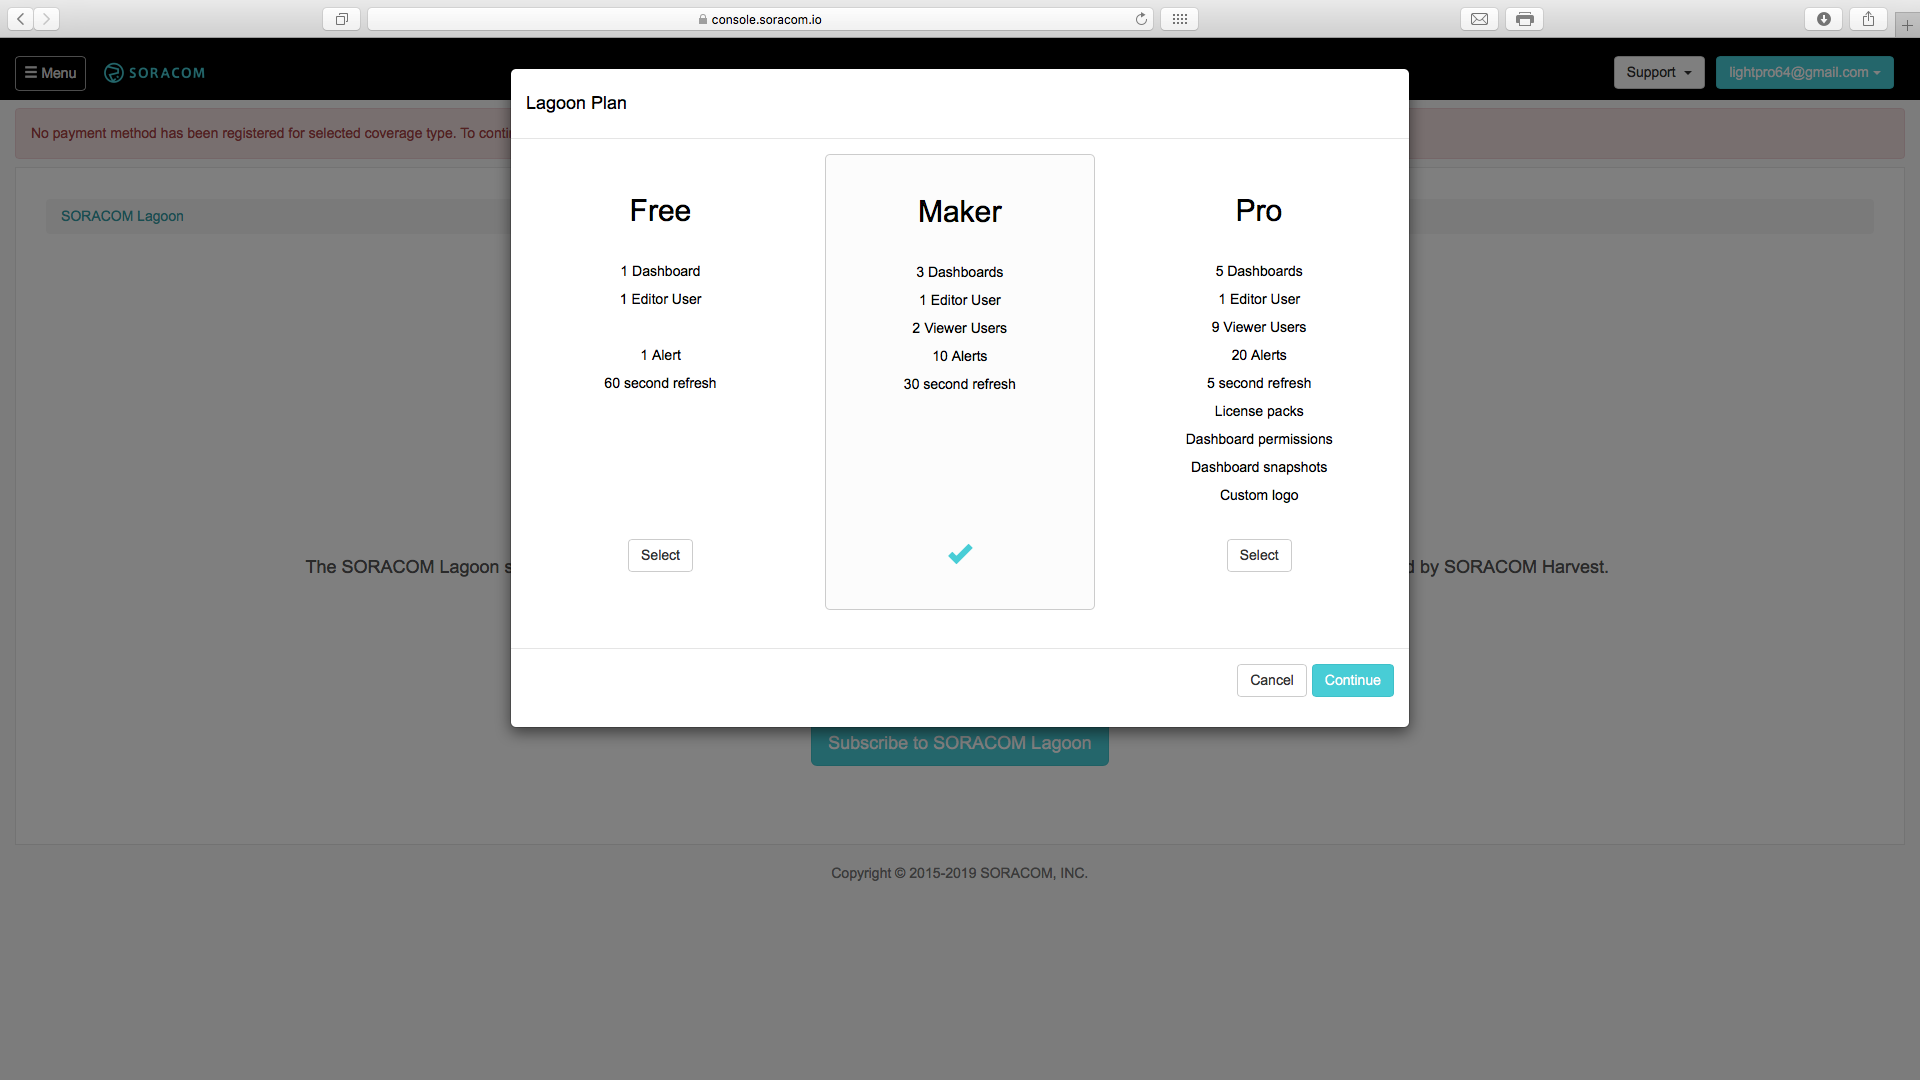
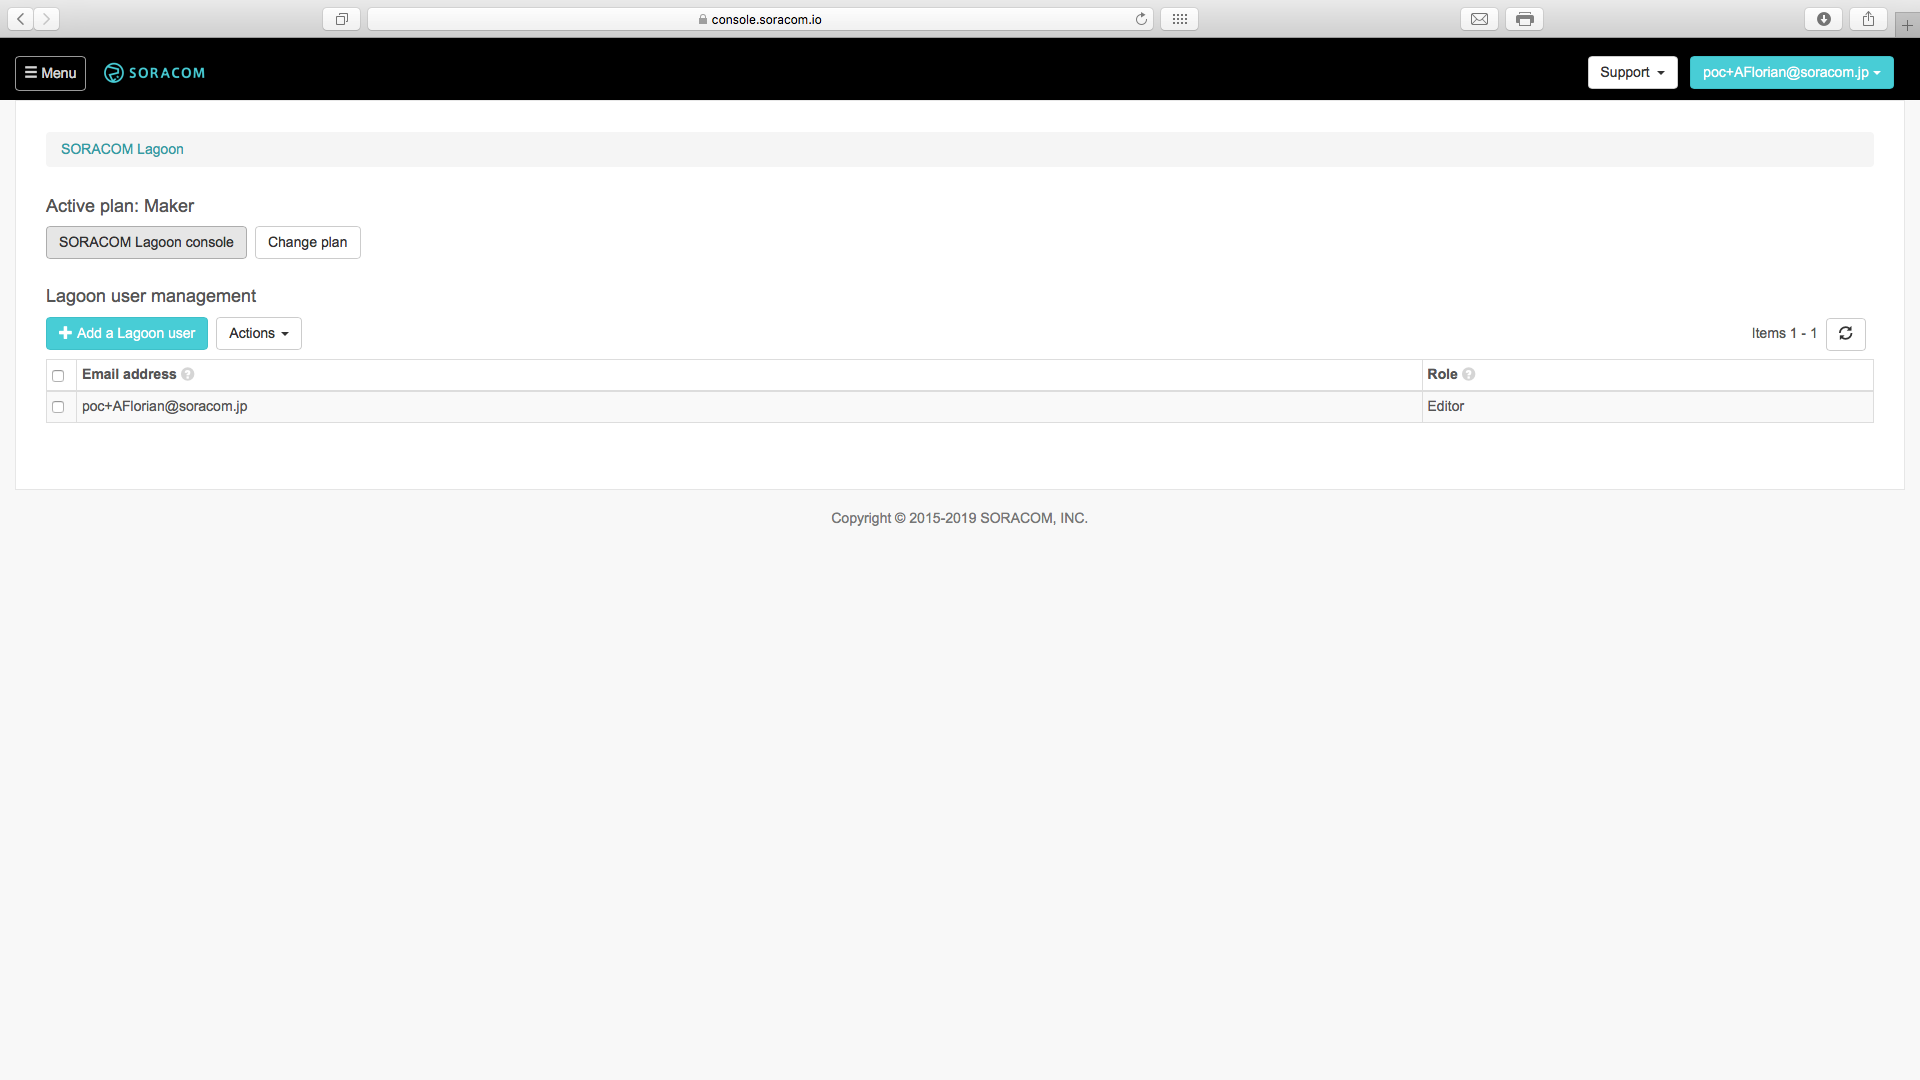
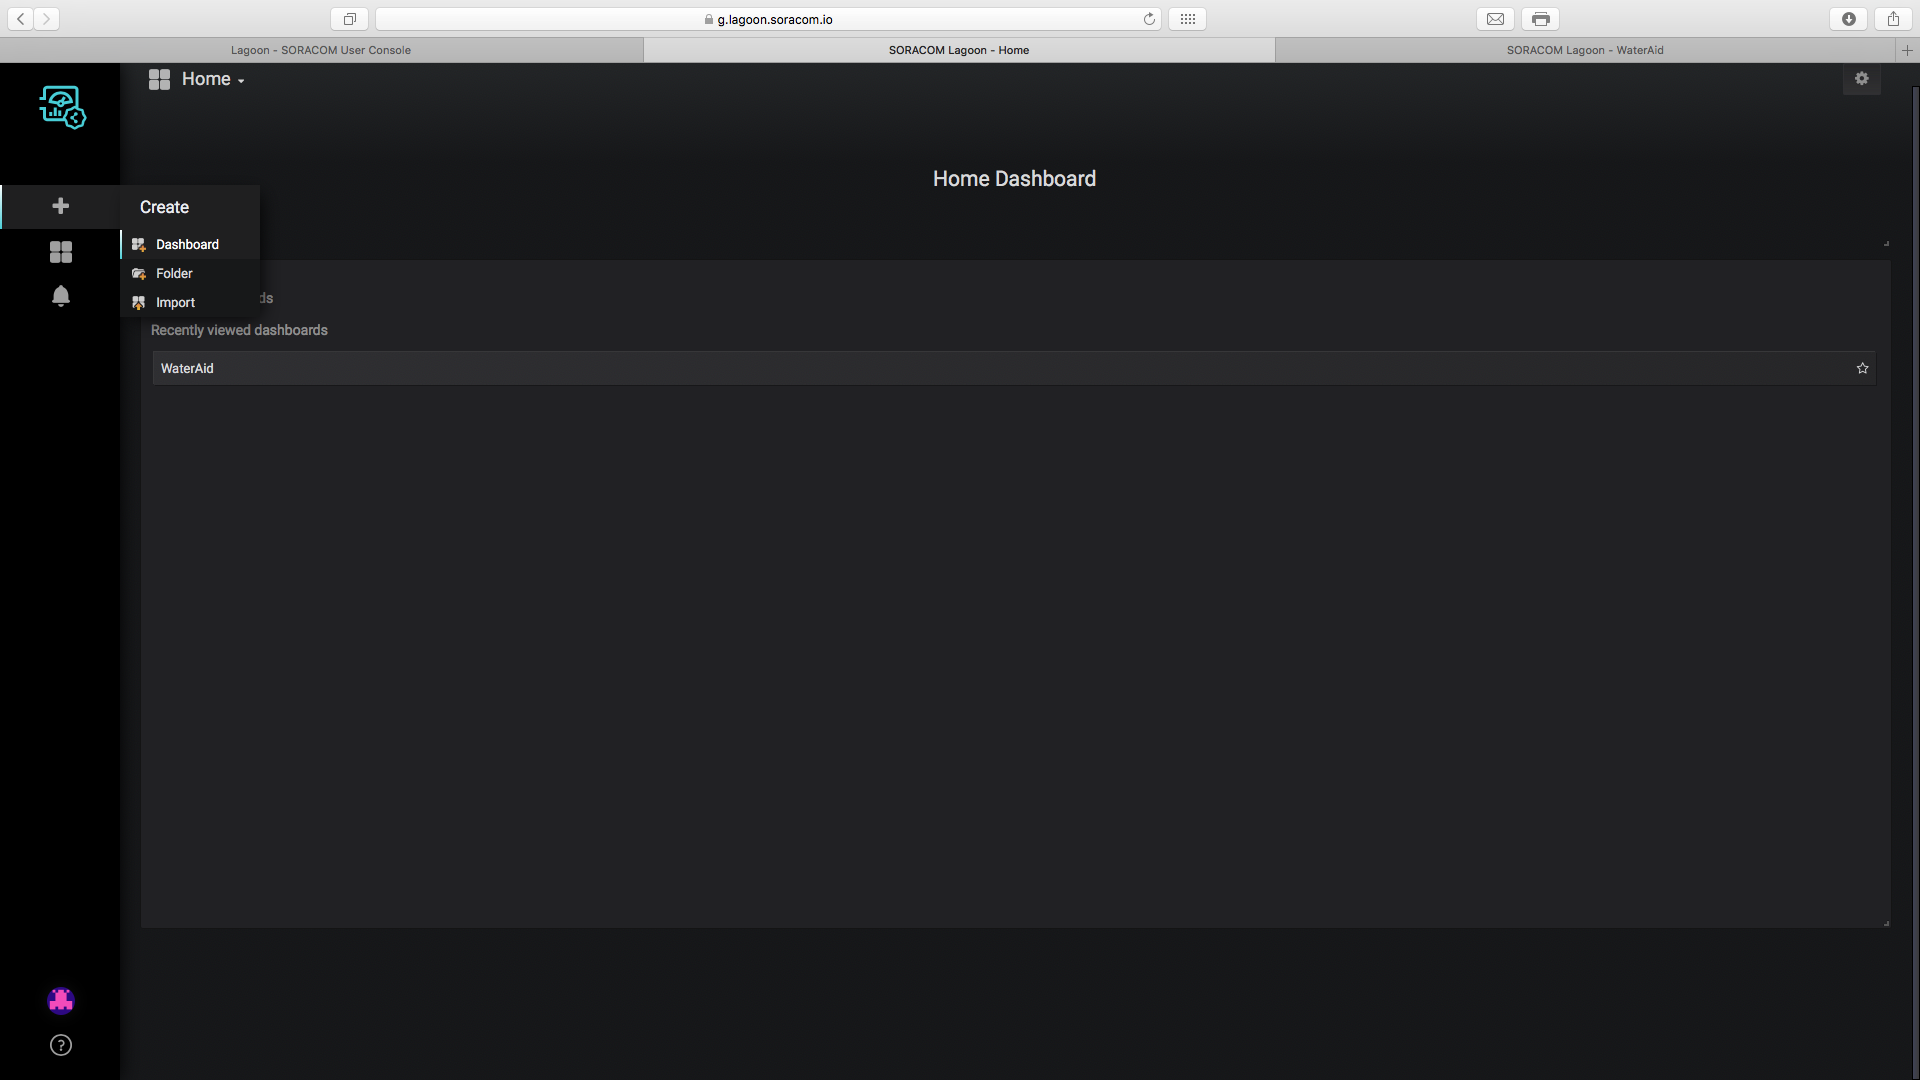
第 7 步:设置 Lagoon
在 Soracom 上设置的最后一件事是 Lagoon,这是我们将用来可视化数据并在数据不好时创建电子邮件警报的工具。请按照以下步骤操作。


Calibration Problems
The turbidity and pH sensors have to be calibrated to be used precisely, you might find that when running the code, the turbidity might by 105% or the pH of water 3. In this case, the sensors have to be calibrated. A quick guide into calibrating them is below.
- pH Sensor The pH sensor can be calibrated using the potentiometers on the module, place the probe in still bottled water of pH 7 and wait for 5 minutes, now develop a code that prints the pH from the sensor to the serial monitor. Twist the potentiometer until the pH is 7.
- Turbidity Sensor The turbidity sensor is not very precise and so a relative percentage, compared to pure water is taken. To refine the value of pure water, if your readings exceed 100% turbidity, you will need to place the turbidity sensor in pure water and develop a code that prints the voltage on the analog pin of the pH sensor to the serial monitor. A variable named
calibrationis found insensors.h, change the value of that variable to the voltage received when the probe was placed in pure water.
Libraries
- ArduinoLowPower (c) 2016 Arduino LLC GNU Lesser General Public Licence this library is in the public domain
- Adafruit_Neopixel (c) Phil Burges Lesser General Public Licence this library is in the public domain
- MKRGSM (c) 2016 Arduino AG GNU Lesser General Public Licence this library is in the public domain
- Wire (c) 2006 Nicholas Zambetti GNU Lesser General Public Licence this library is in the public domain
- OneWire (c) 2007 Jim Studt GNU General Public Licence this library is in the public domain
- DallasTemperature GNU General Public Licence this library is in the public domain
- RTCZero (c) 2015 Arduino LLC GNU Lesser General Public Licence this library is in the public domain
Final
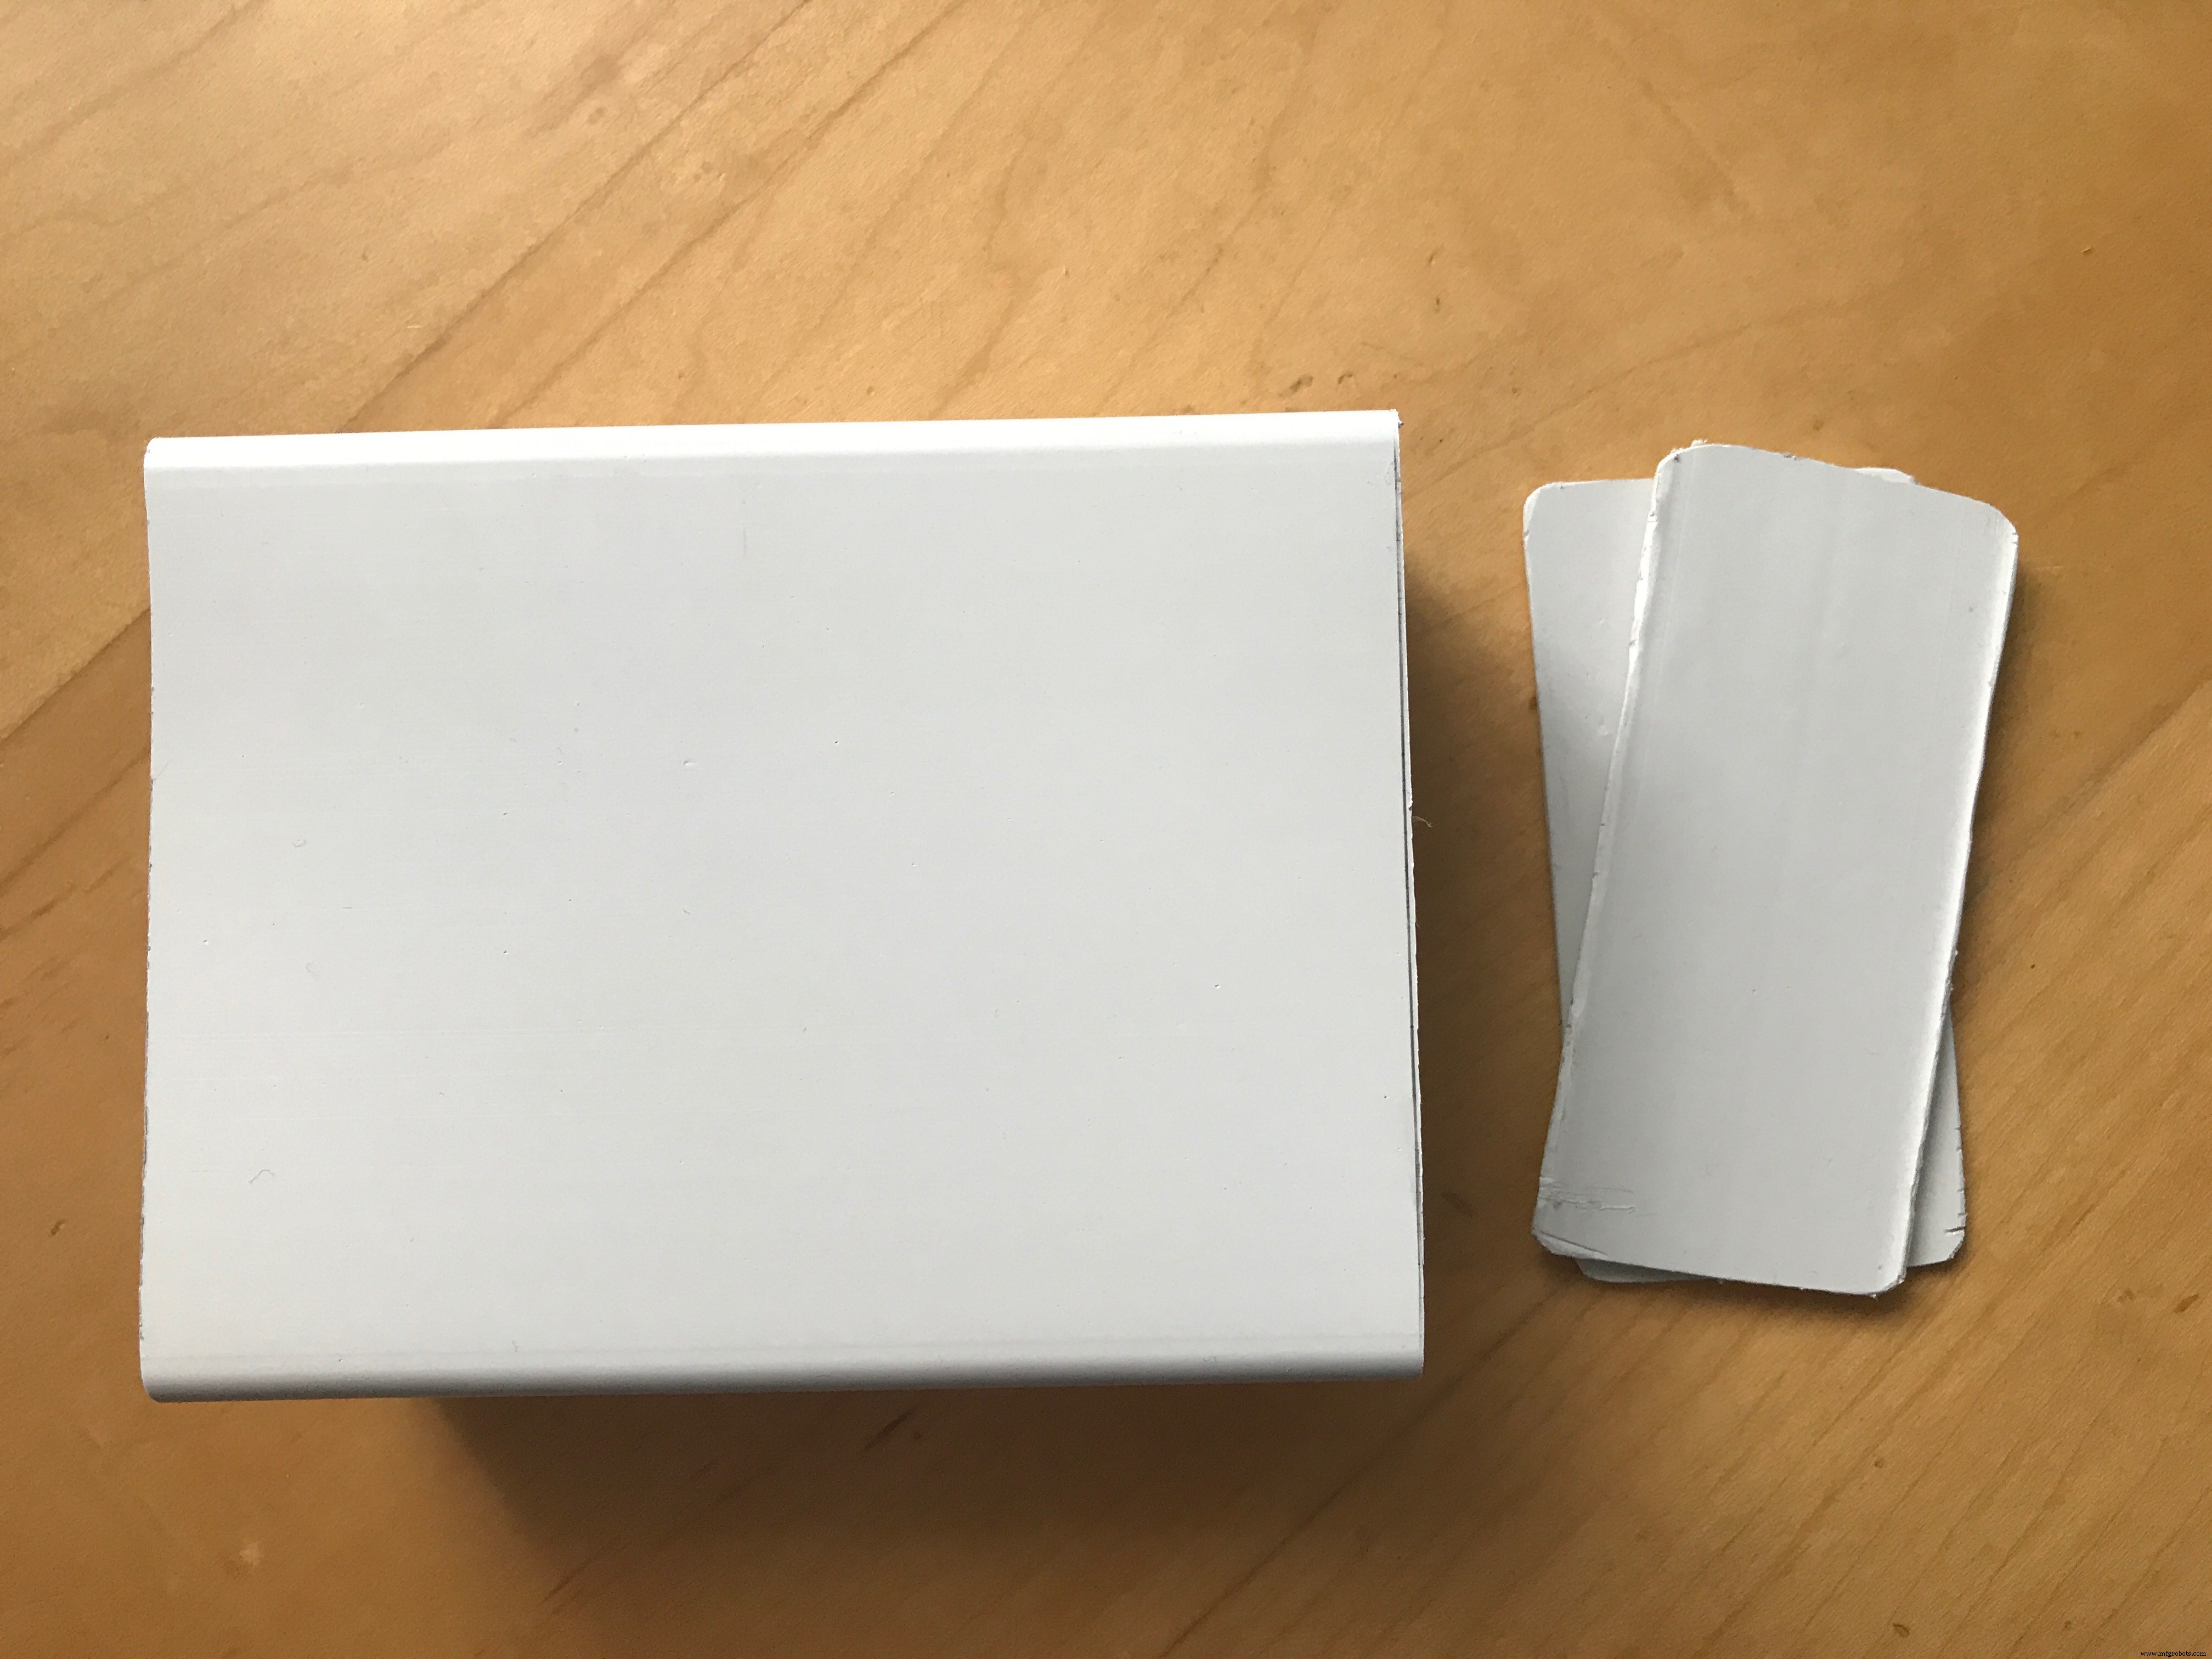
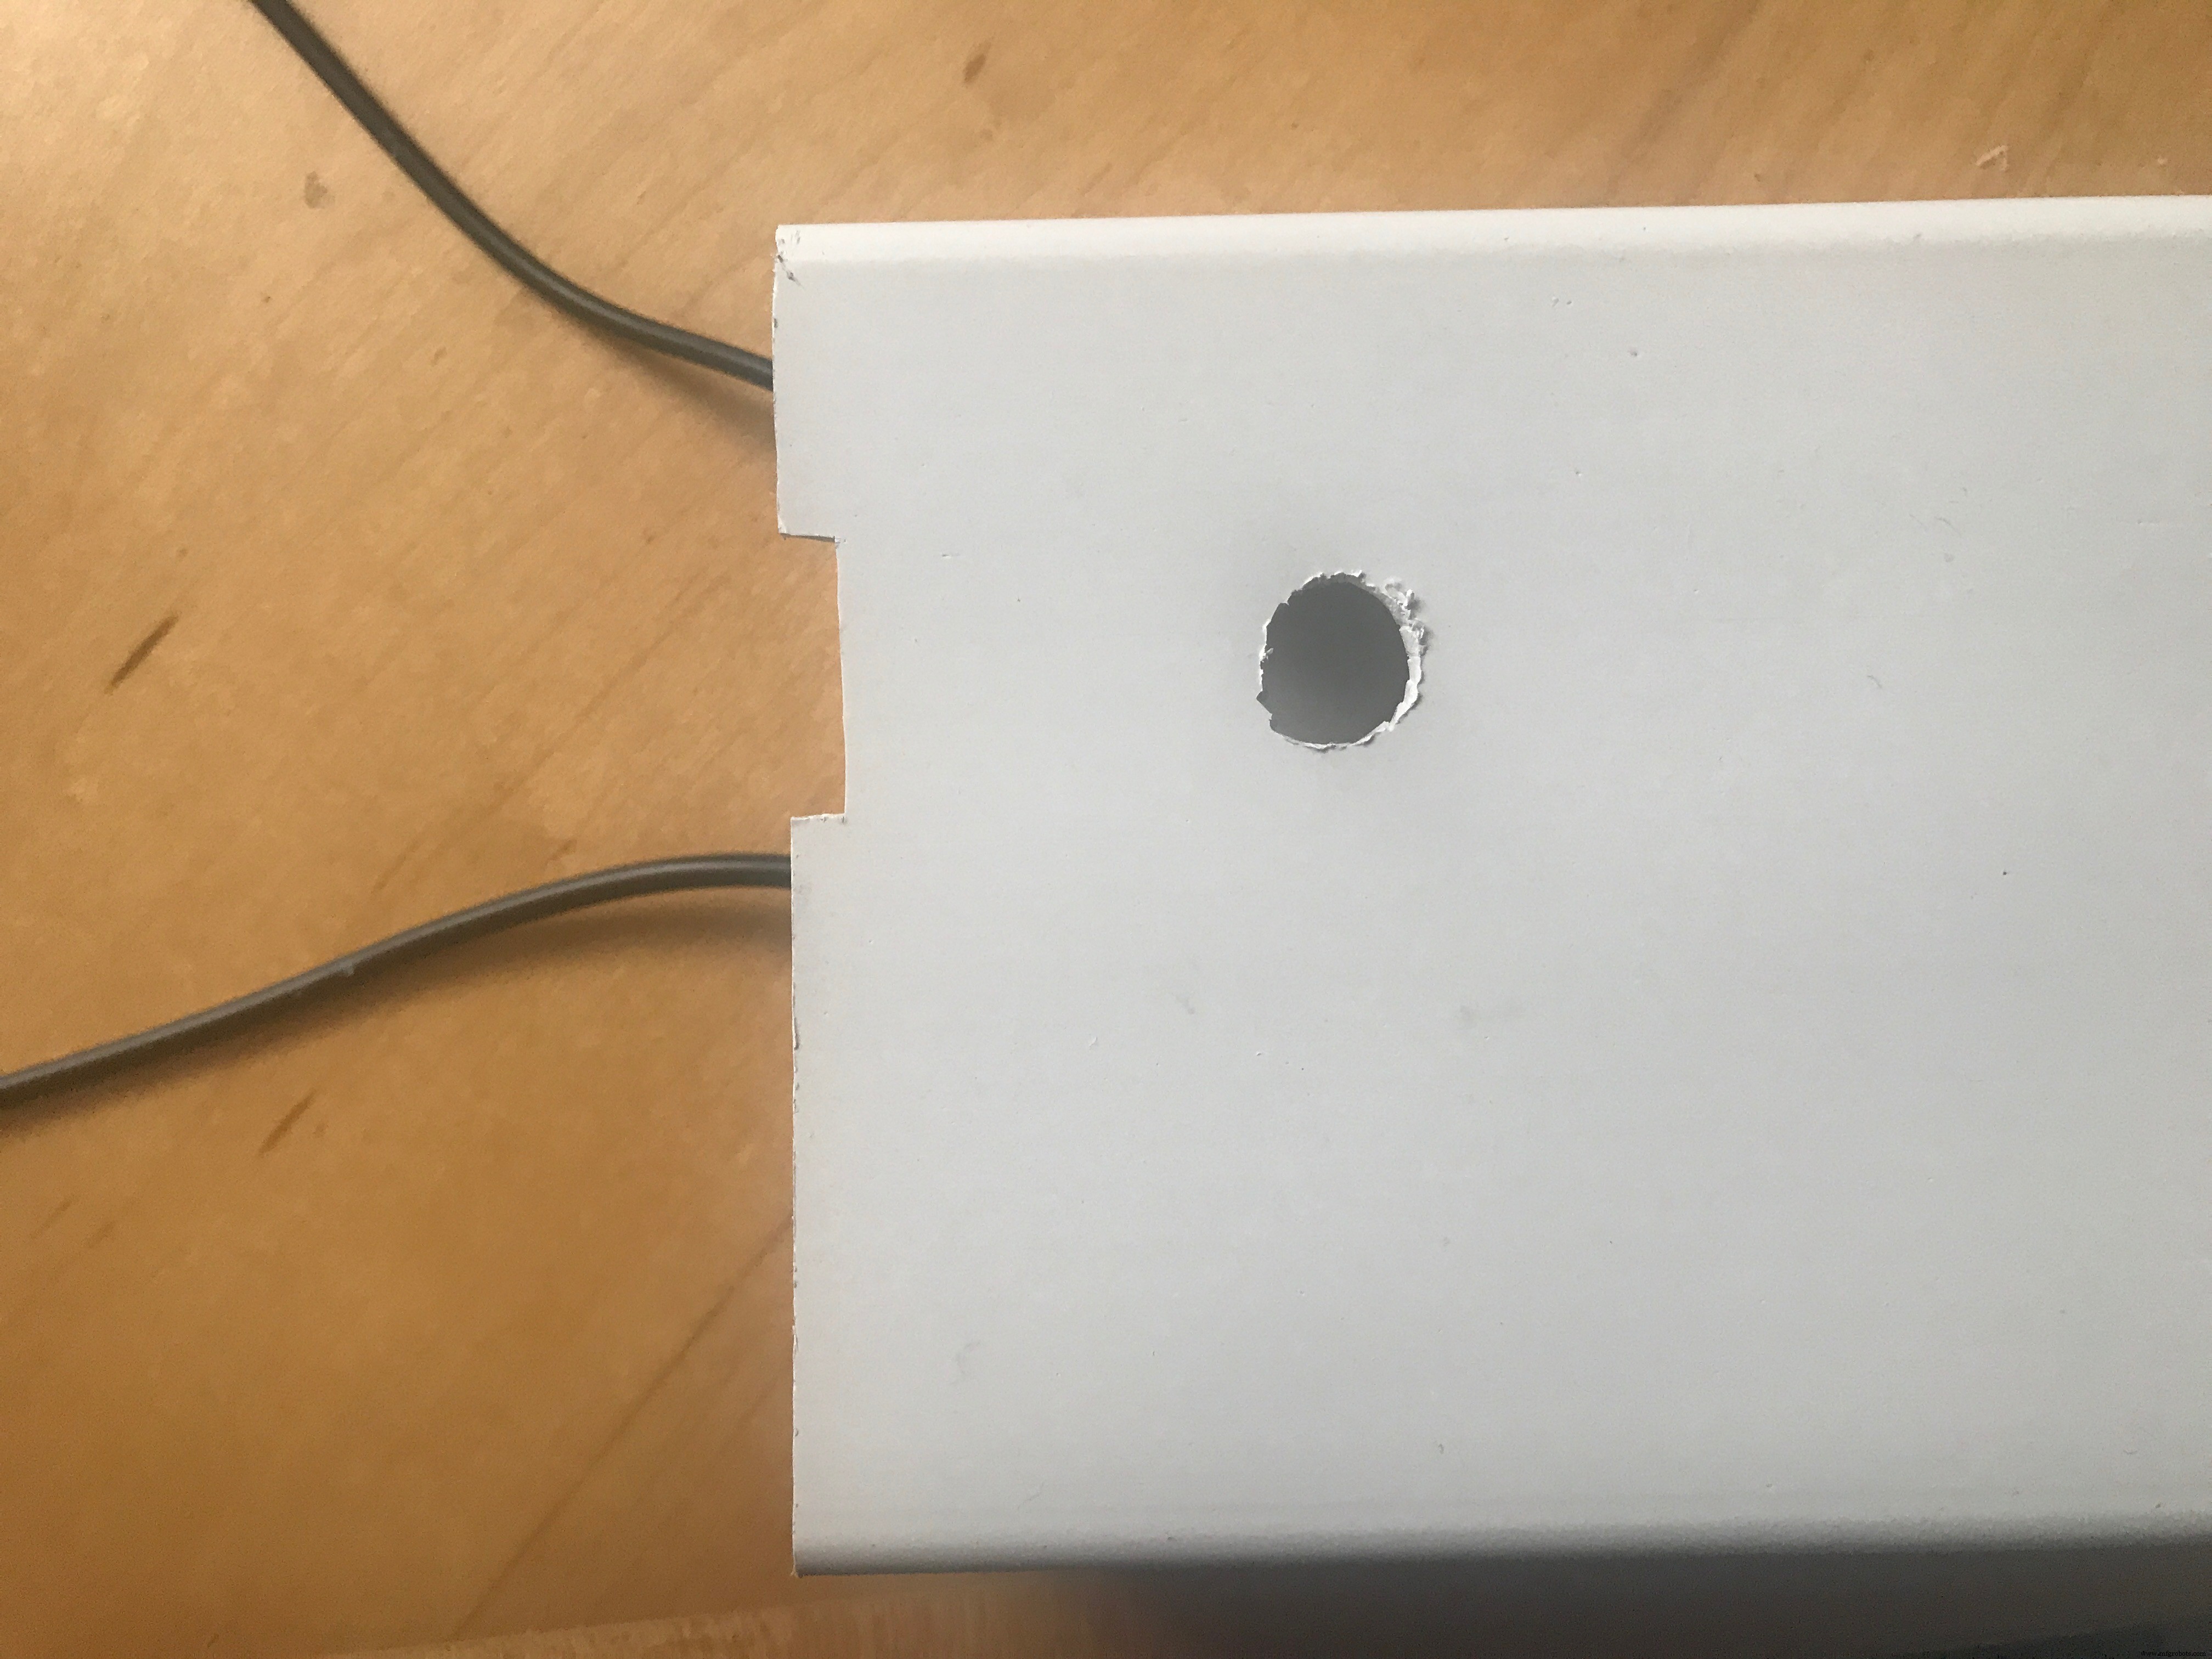
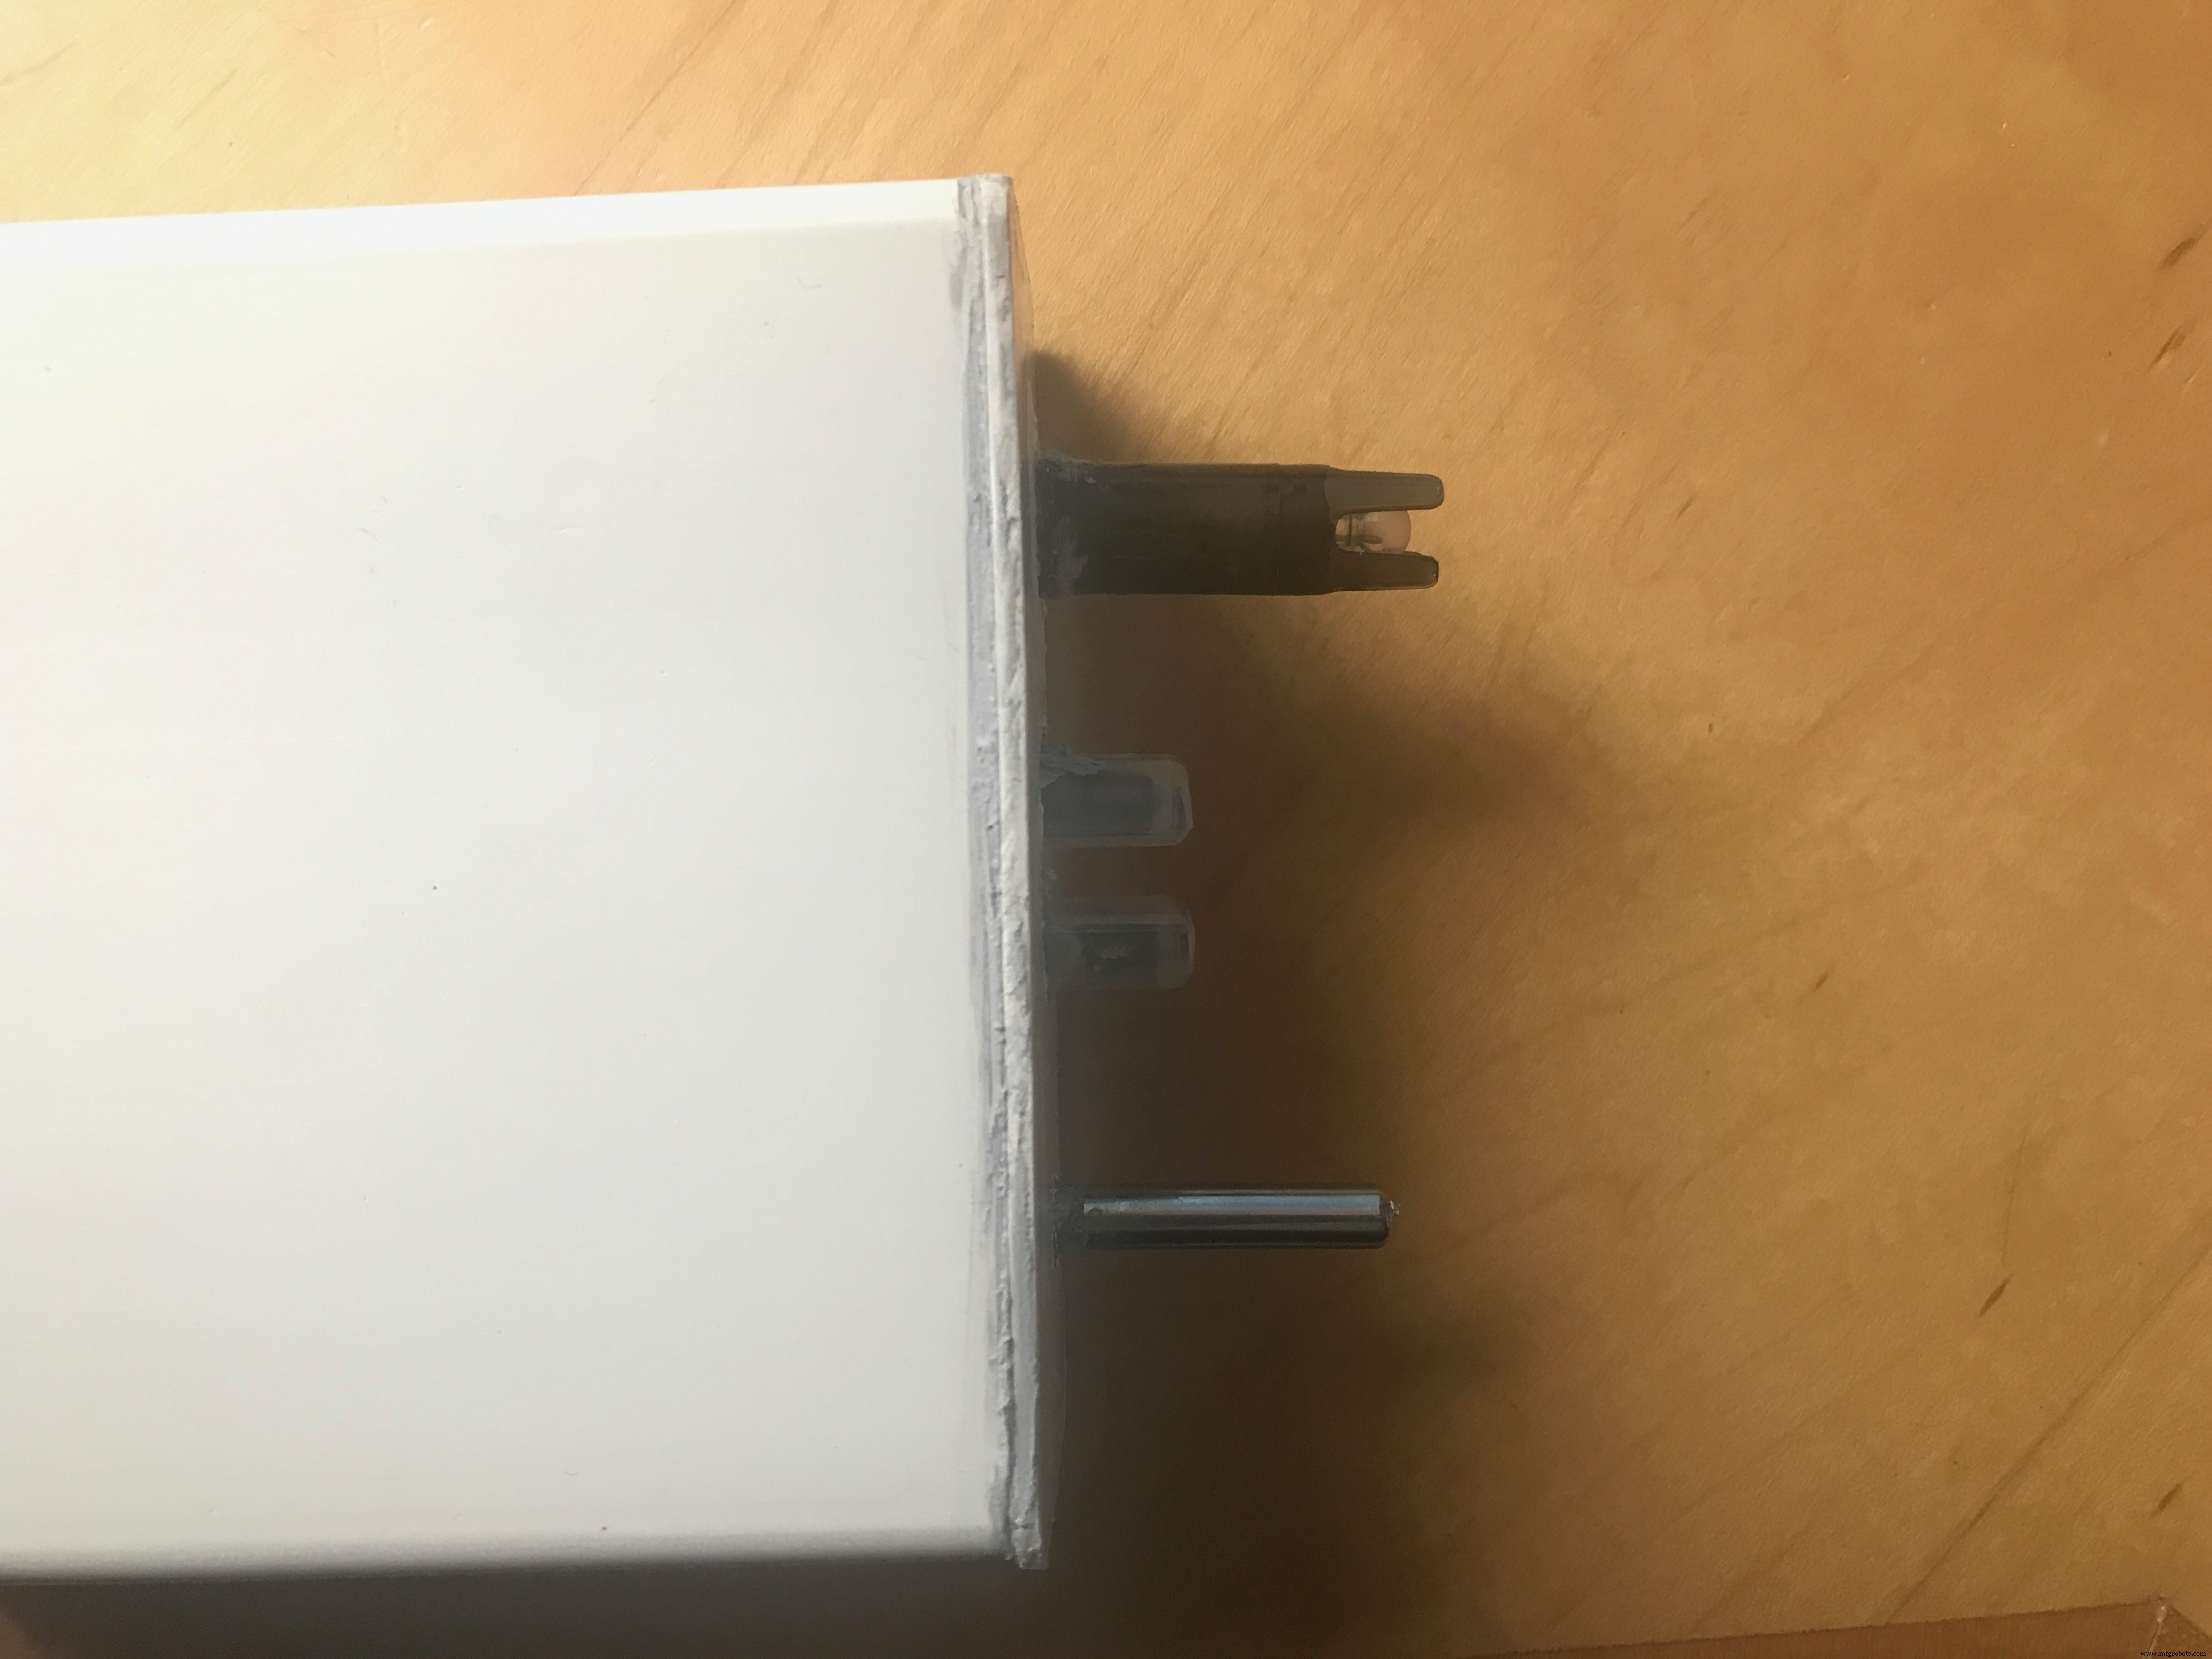
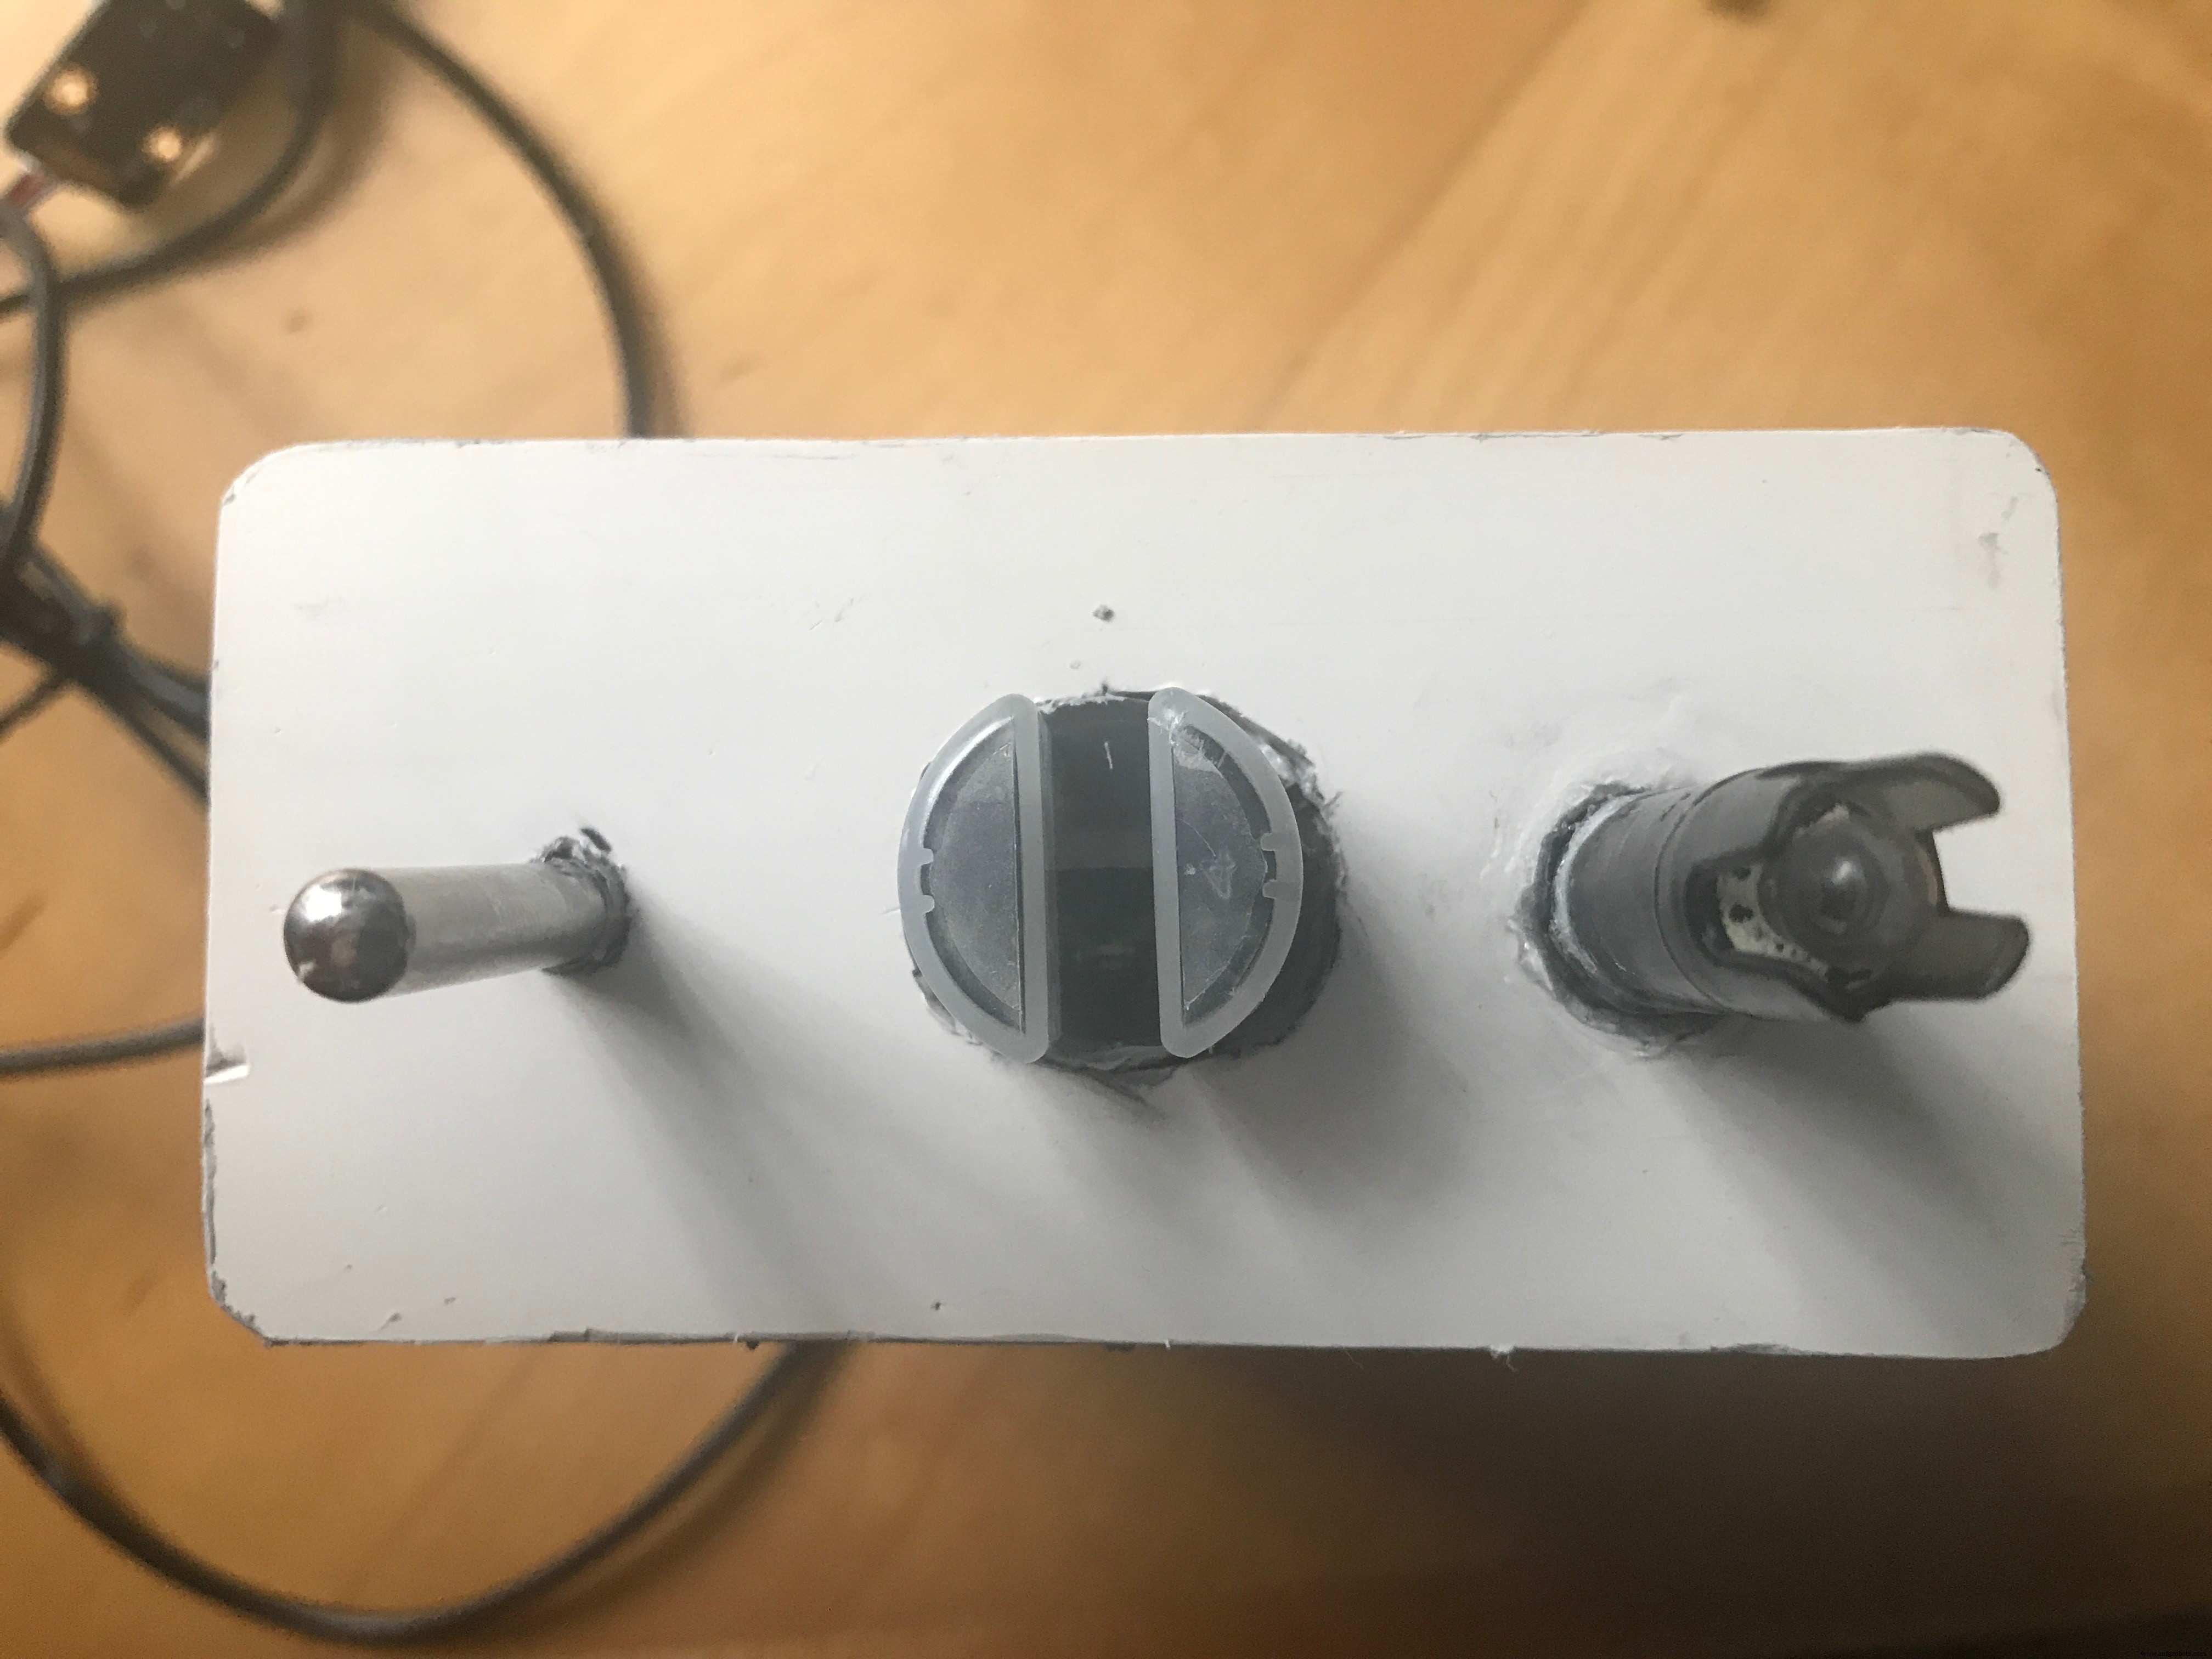
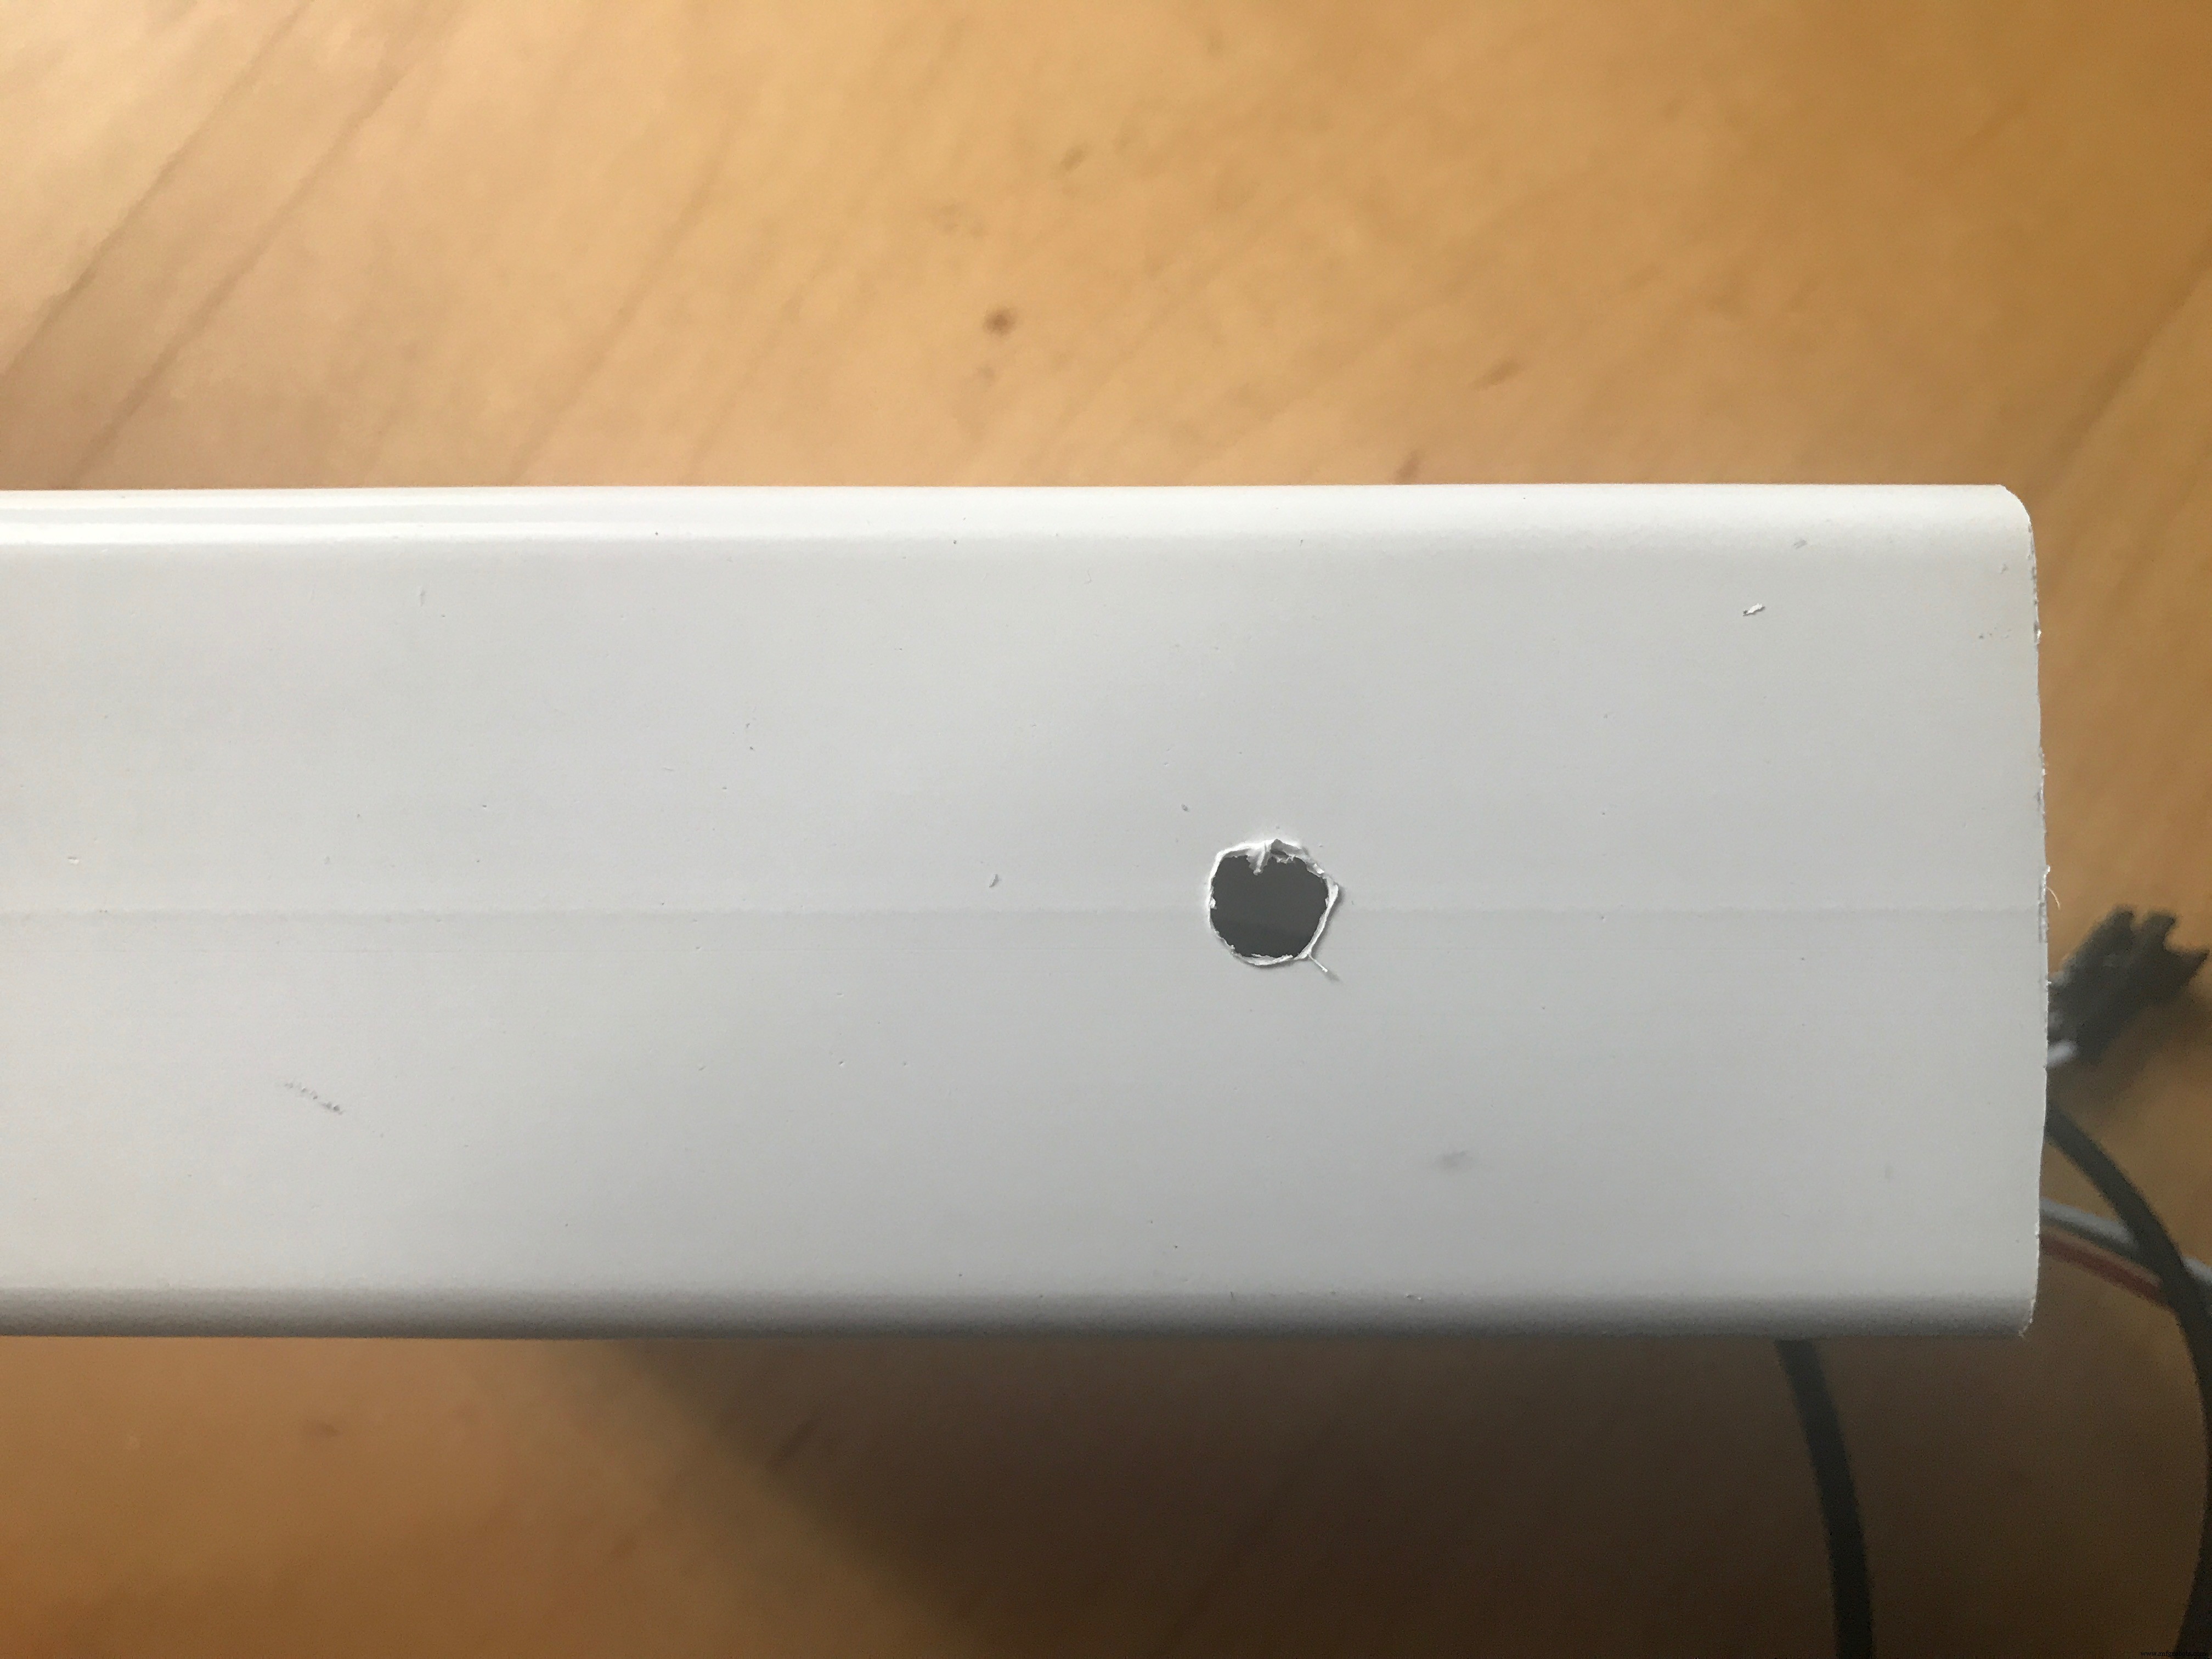
Finally, I got an enclosure done for the project that could be easily portable but be fixed to collect samples both in mode 1 and 2. Steps are below.


Finally, ensure that the mode is set accordingly and start using the device on the field. Check out your local river or lake and see how clean it is. Play around with the dashboard and see what other widgets it has.
Background
Today, data is the new currency and collecting it easily and efficiently is key to a better environment. By measuring the pollution of rivers and lakes collectively, we can raise awareness that the waters are getting dirtier and something has to be done.
I was thinking of an idea for the Soracom contest and I felt like I had to make something beneficial for the environment, the idea of people and companies working together on collective dashboards to visualise the status of rivers and lakes globally inspired me to take this project on.
What will you do to stop water pollution? Because action has to be taken today, and tomorrow is a day too late.
代码
Code
The repo for the projecthttps://github.com/Andrei-Florian/UnifiedWater-v1示意图
 schematics_e7TRP6KJKI.fzz
制造工艺