

使用 Arduino、Python 和 Keras 的 DIY 降雨预测
组件和用品
| × | 1 | ||||
| × | 1 | ||||
| × | 1 | ||||
| × | 1 | ||||
 |
| × | 1 | |||
| × | 1 | ||||
 |
| × | 1 | |||
| × | 1 | ||||
| × | 1 | ||||
| × | 1 | ||||
 |
| × | 1 | |||
| × | 1 | ||||
| × | 1 | ||||
| × | 1 |
必要的工具和机器
| ||||
| ||||
 |
| |||
|
关于这个项目
首先是关于这个项目的动机、涉及的技术以及我们将要构建的最终产品。
所以这里的主要目标显然是预测未来的降雨(我们将尝试 6 小时)。预测将是是或否(编程术语中的布尔值)。我已经从有关此事的教程中进行了搜索,但没有找到一个在各个方面都完整的教程。所以我将把它带到一个全新的方法,并进入它的各个方面。为此,我们将:
- 构建 气象站自己。该站应该完全脱离电网,配备太阳能电池板和极低功率模式(几十微安小时)
- 程序 站,因此它收集数据并每十分钟将其传输到基站
- 收集 基站上的数据并将其存储(在数据库中)
- 使用神经网络 (Keras 库)和其他 Python 库,如 pandas 过滤、清理和预处理数据,然后将其提供给神经网络以训练“模型”来预测是否会下雨
- 最后预测 未来 6 小时是否会下雨并通过电子邮件通知用户
我个人使用这个气象站收集数据(如果您愿意,可以在接下来的步骤中下载数据)。只有大约 600 天的天气数据,系统可以预测未来 6 小时内是否会下雨,准确率约为 80%,具体取决于参数,还不错。
在本教程中,我们将带您完成从头开始预测降雨量的所有必要步骤。我们将制作一个能够完成实际工作的最终产品,而无需使用外部天气或机器学习 API。在此过程中,我们将学习如何构建一个实用的气象站(低功耗和离网),真正在无需维护的情况下长时间收集数据。之后,您将学习如何使用 Arduino IDE 对其进行编程。如何将数据收集到基站(服务器)上的数据库中。以及如何处理数据(Pandas)和应用神经网络(Keras)然后预测降雨量。
第 1 步:建造车站的零件和工具
零件:
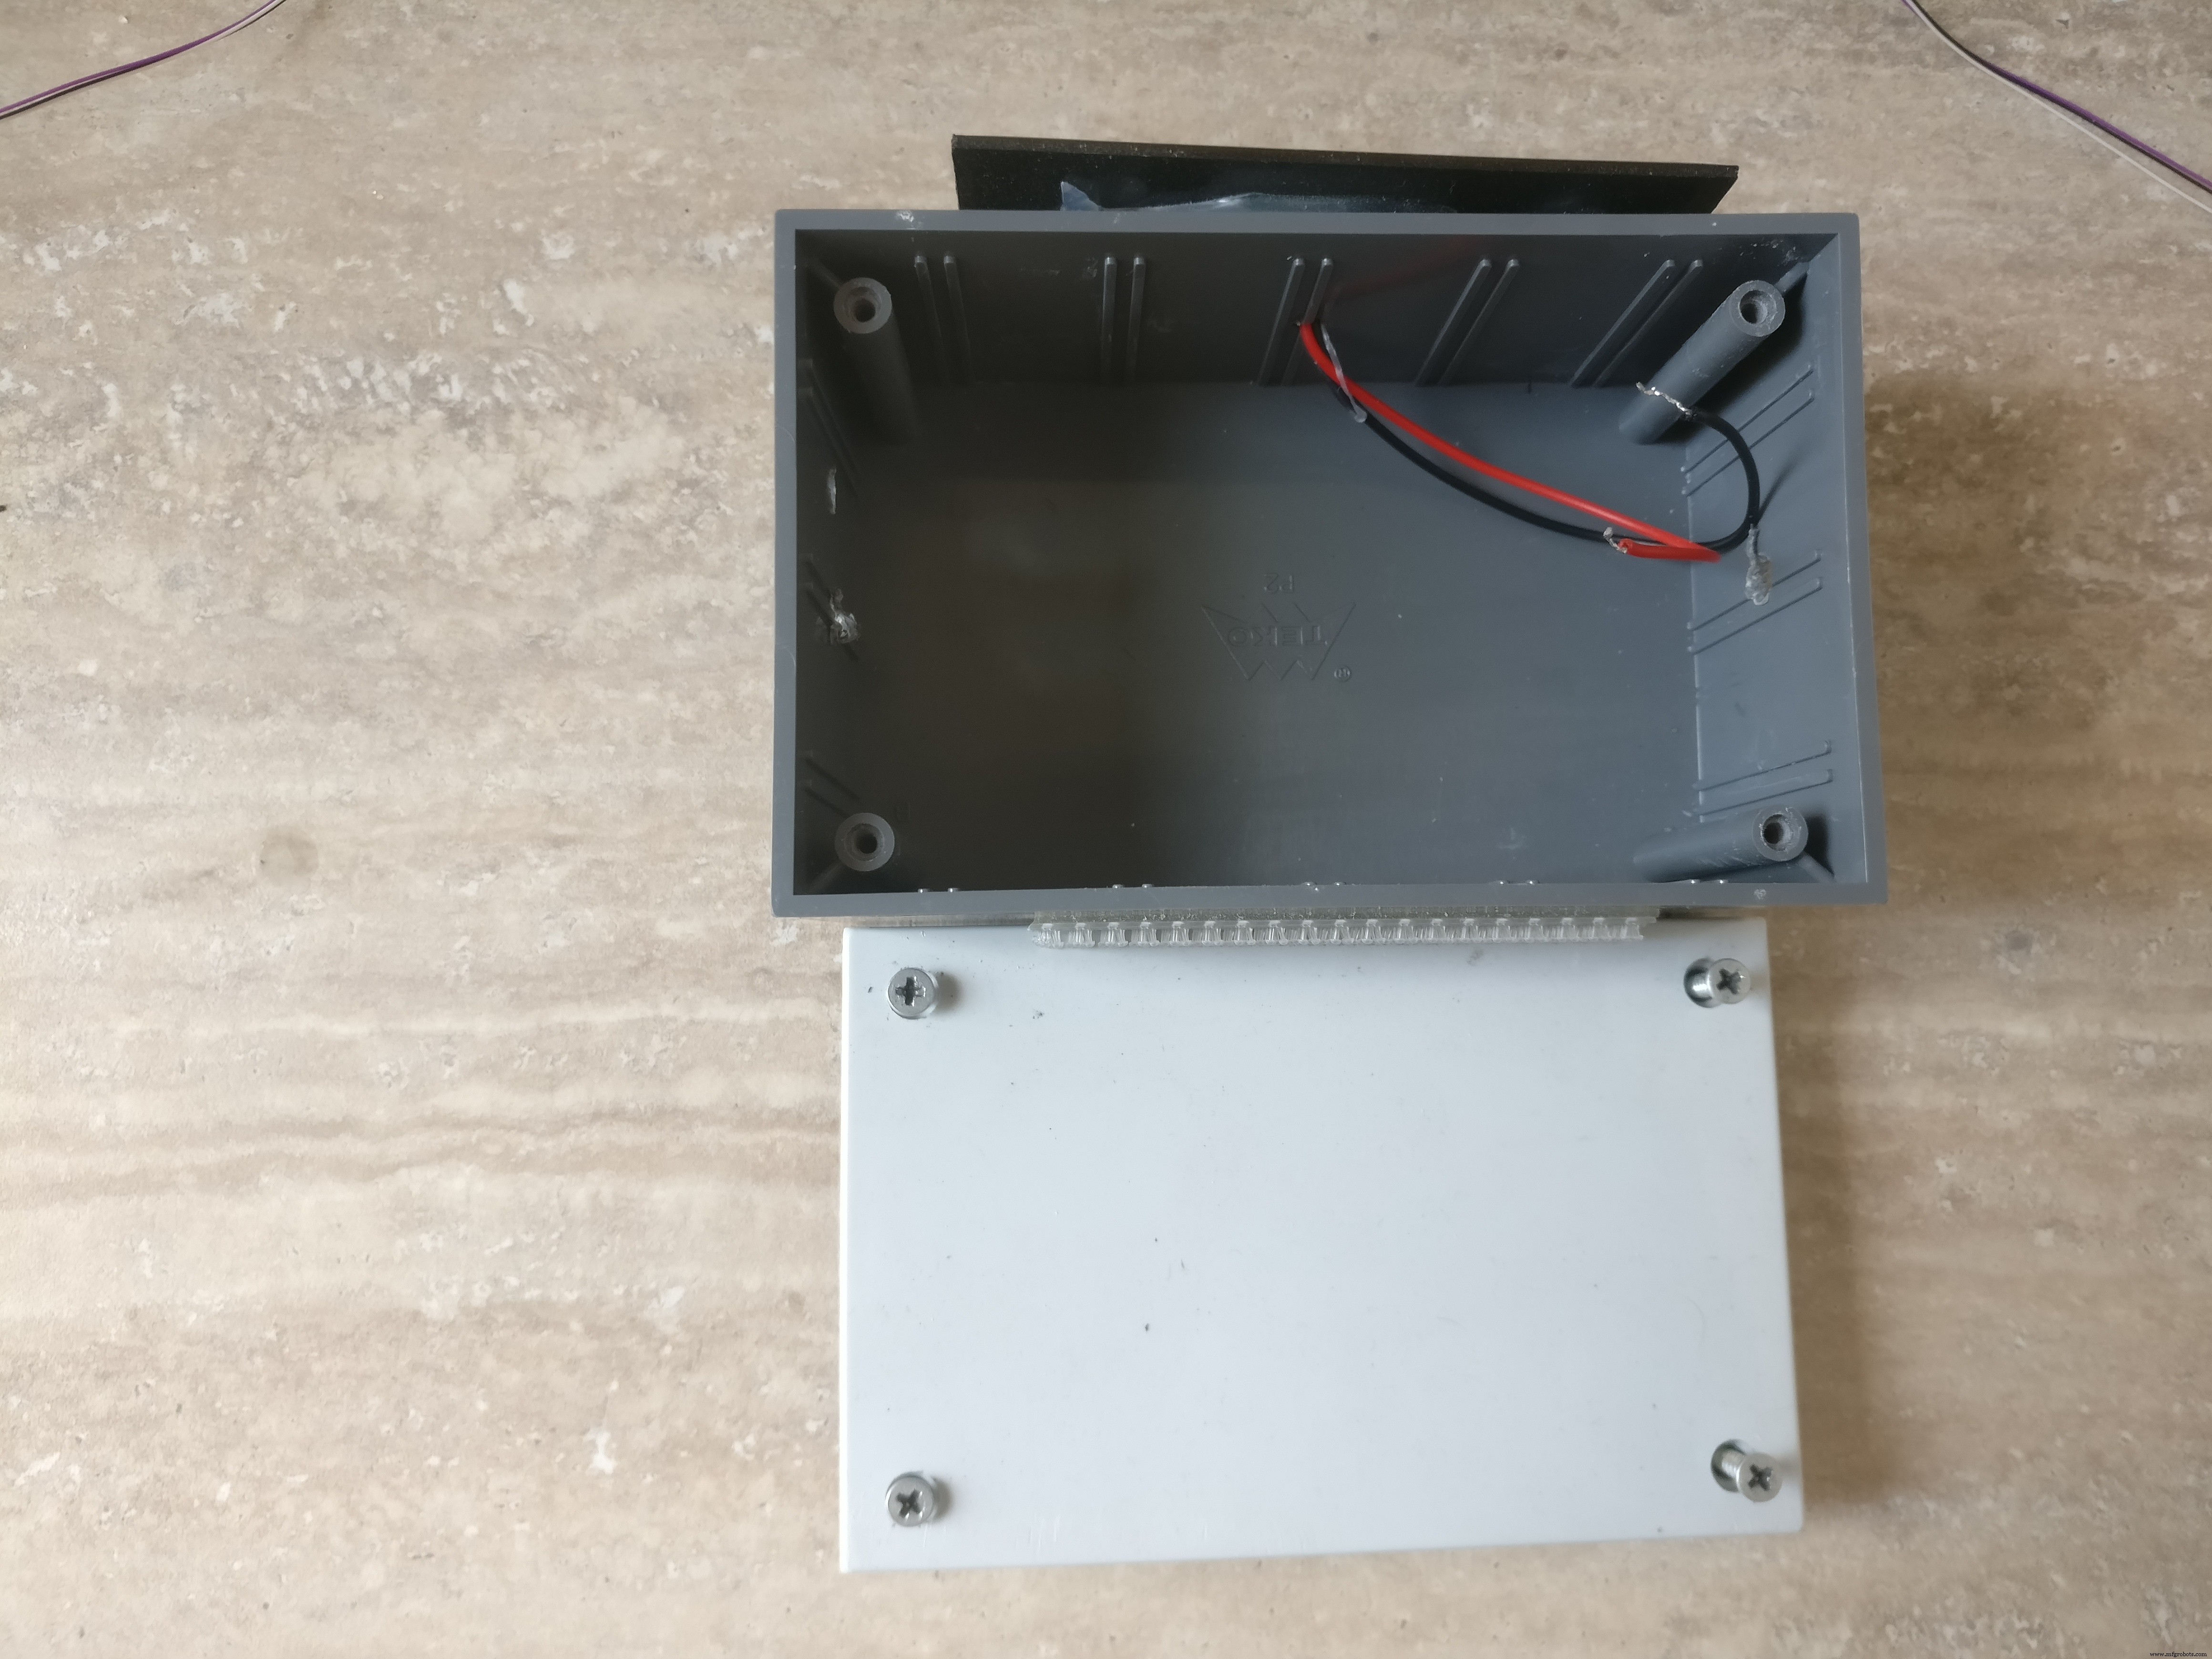
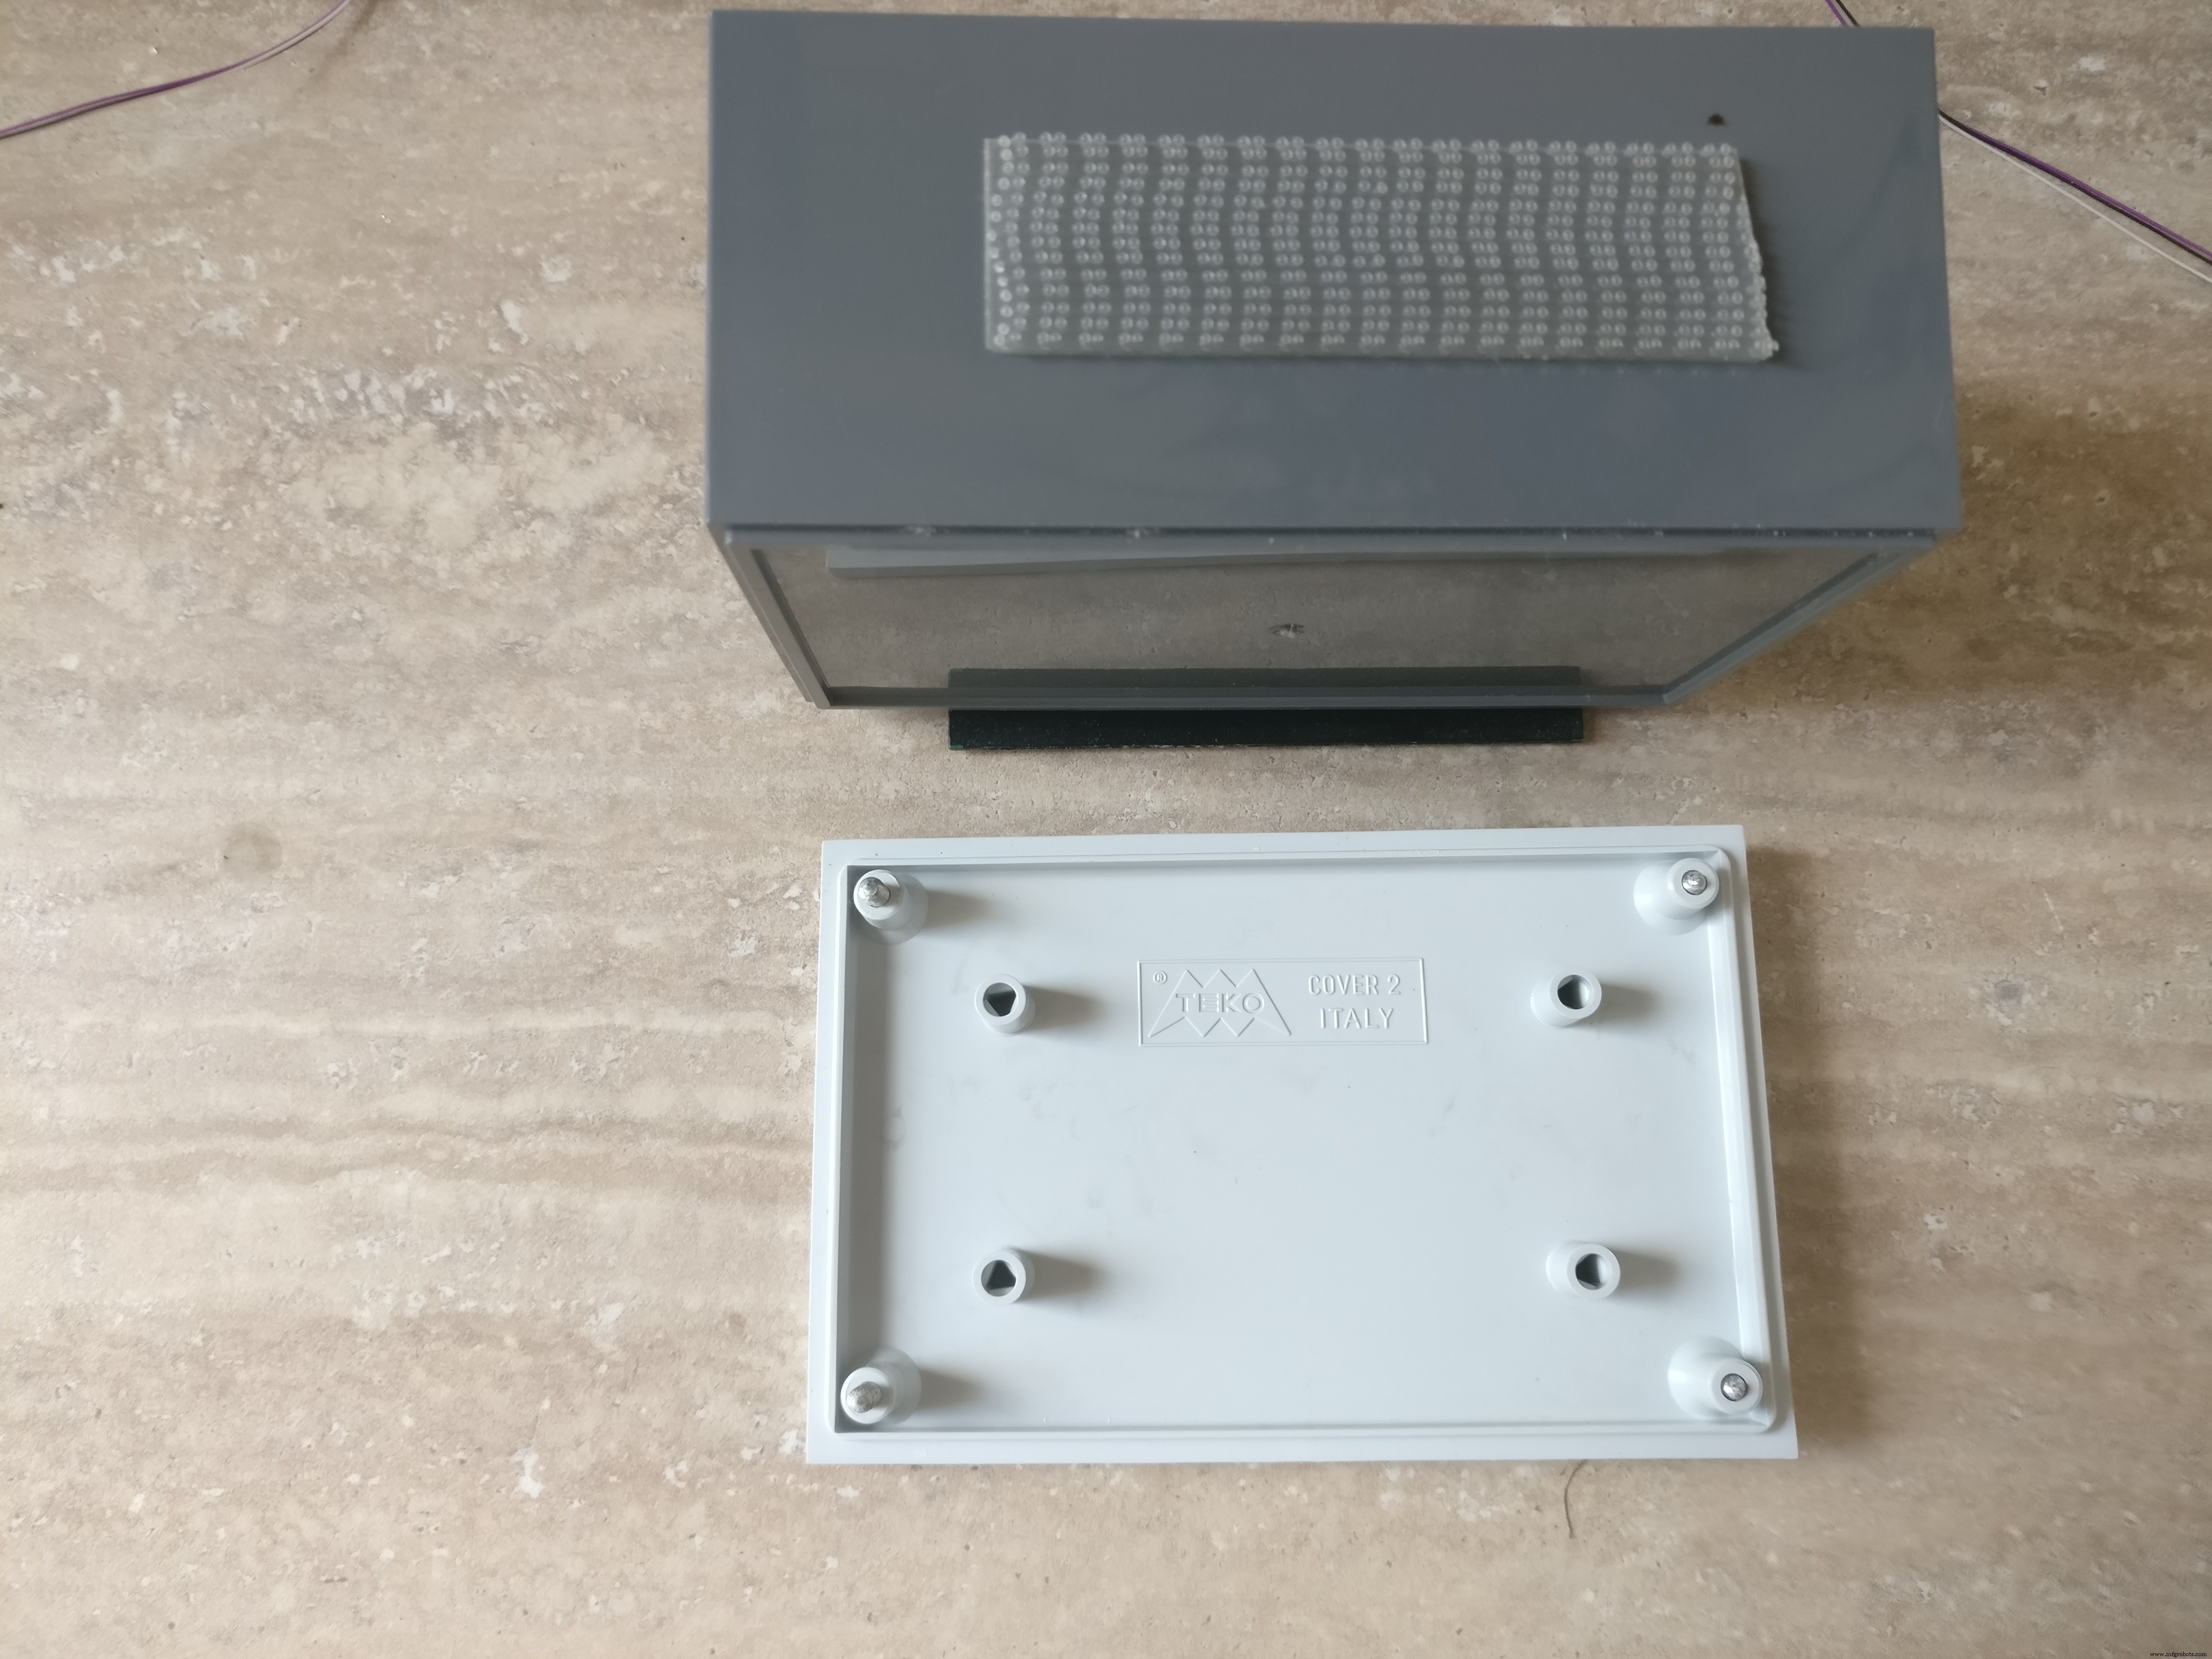
1. 带可拆卸盖子的小塑料盒(我的有螺丝)。盒子的尺寸应该足够大以容纳小部件和电池。我的盒子有 11 x 7 x 5 厘米
2. 三节AAA电池座
3. 三节 AAA 充电电池
4. 6V小型太阳能电池板
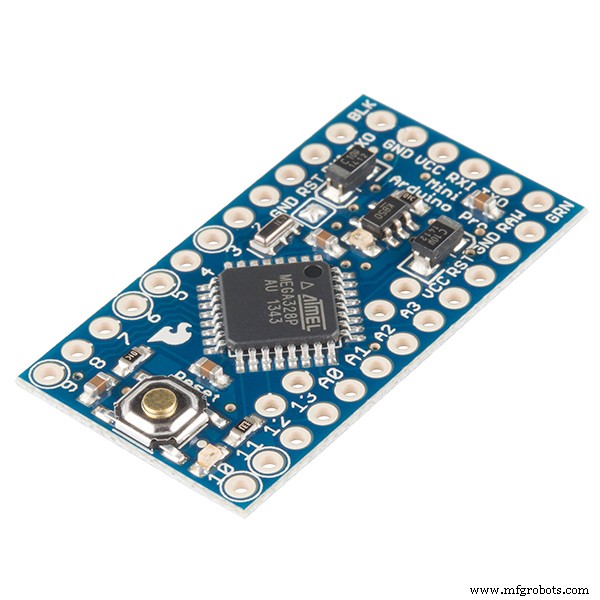
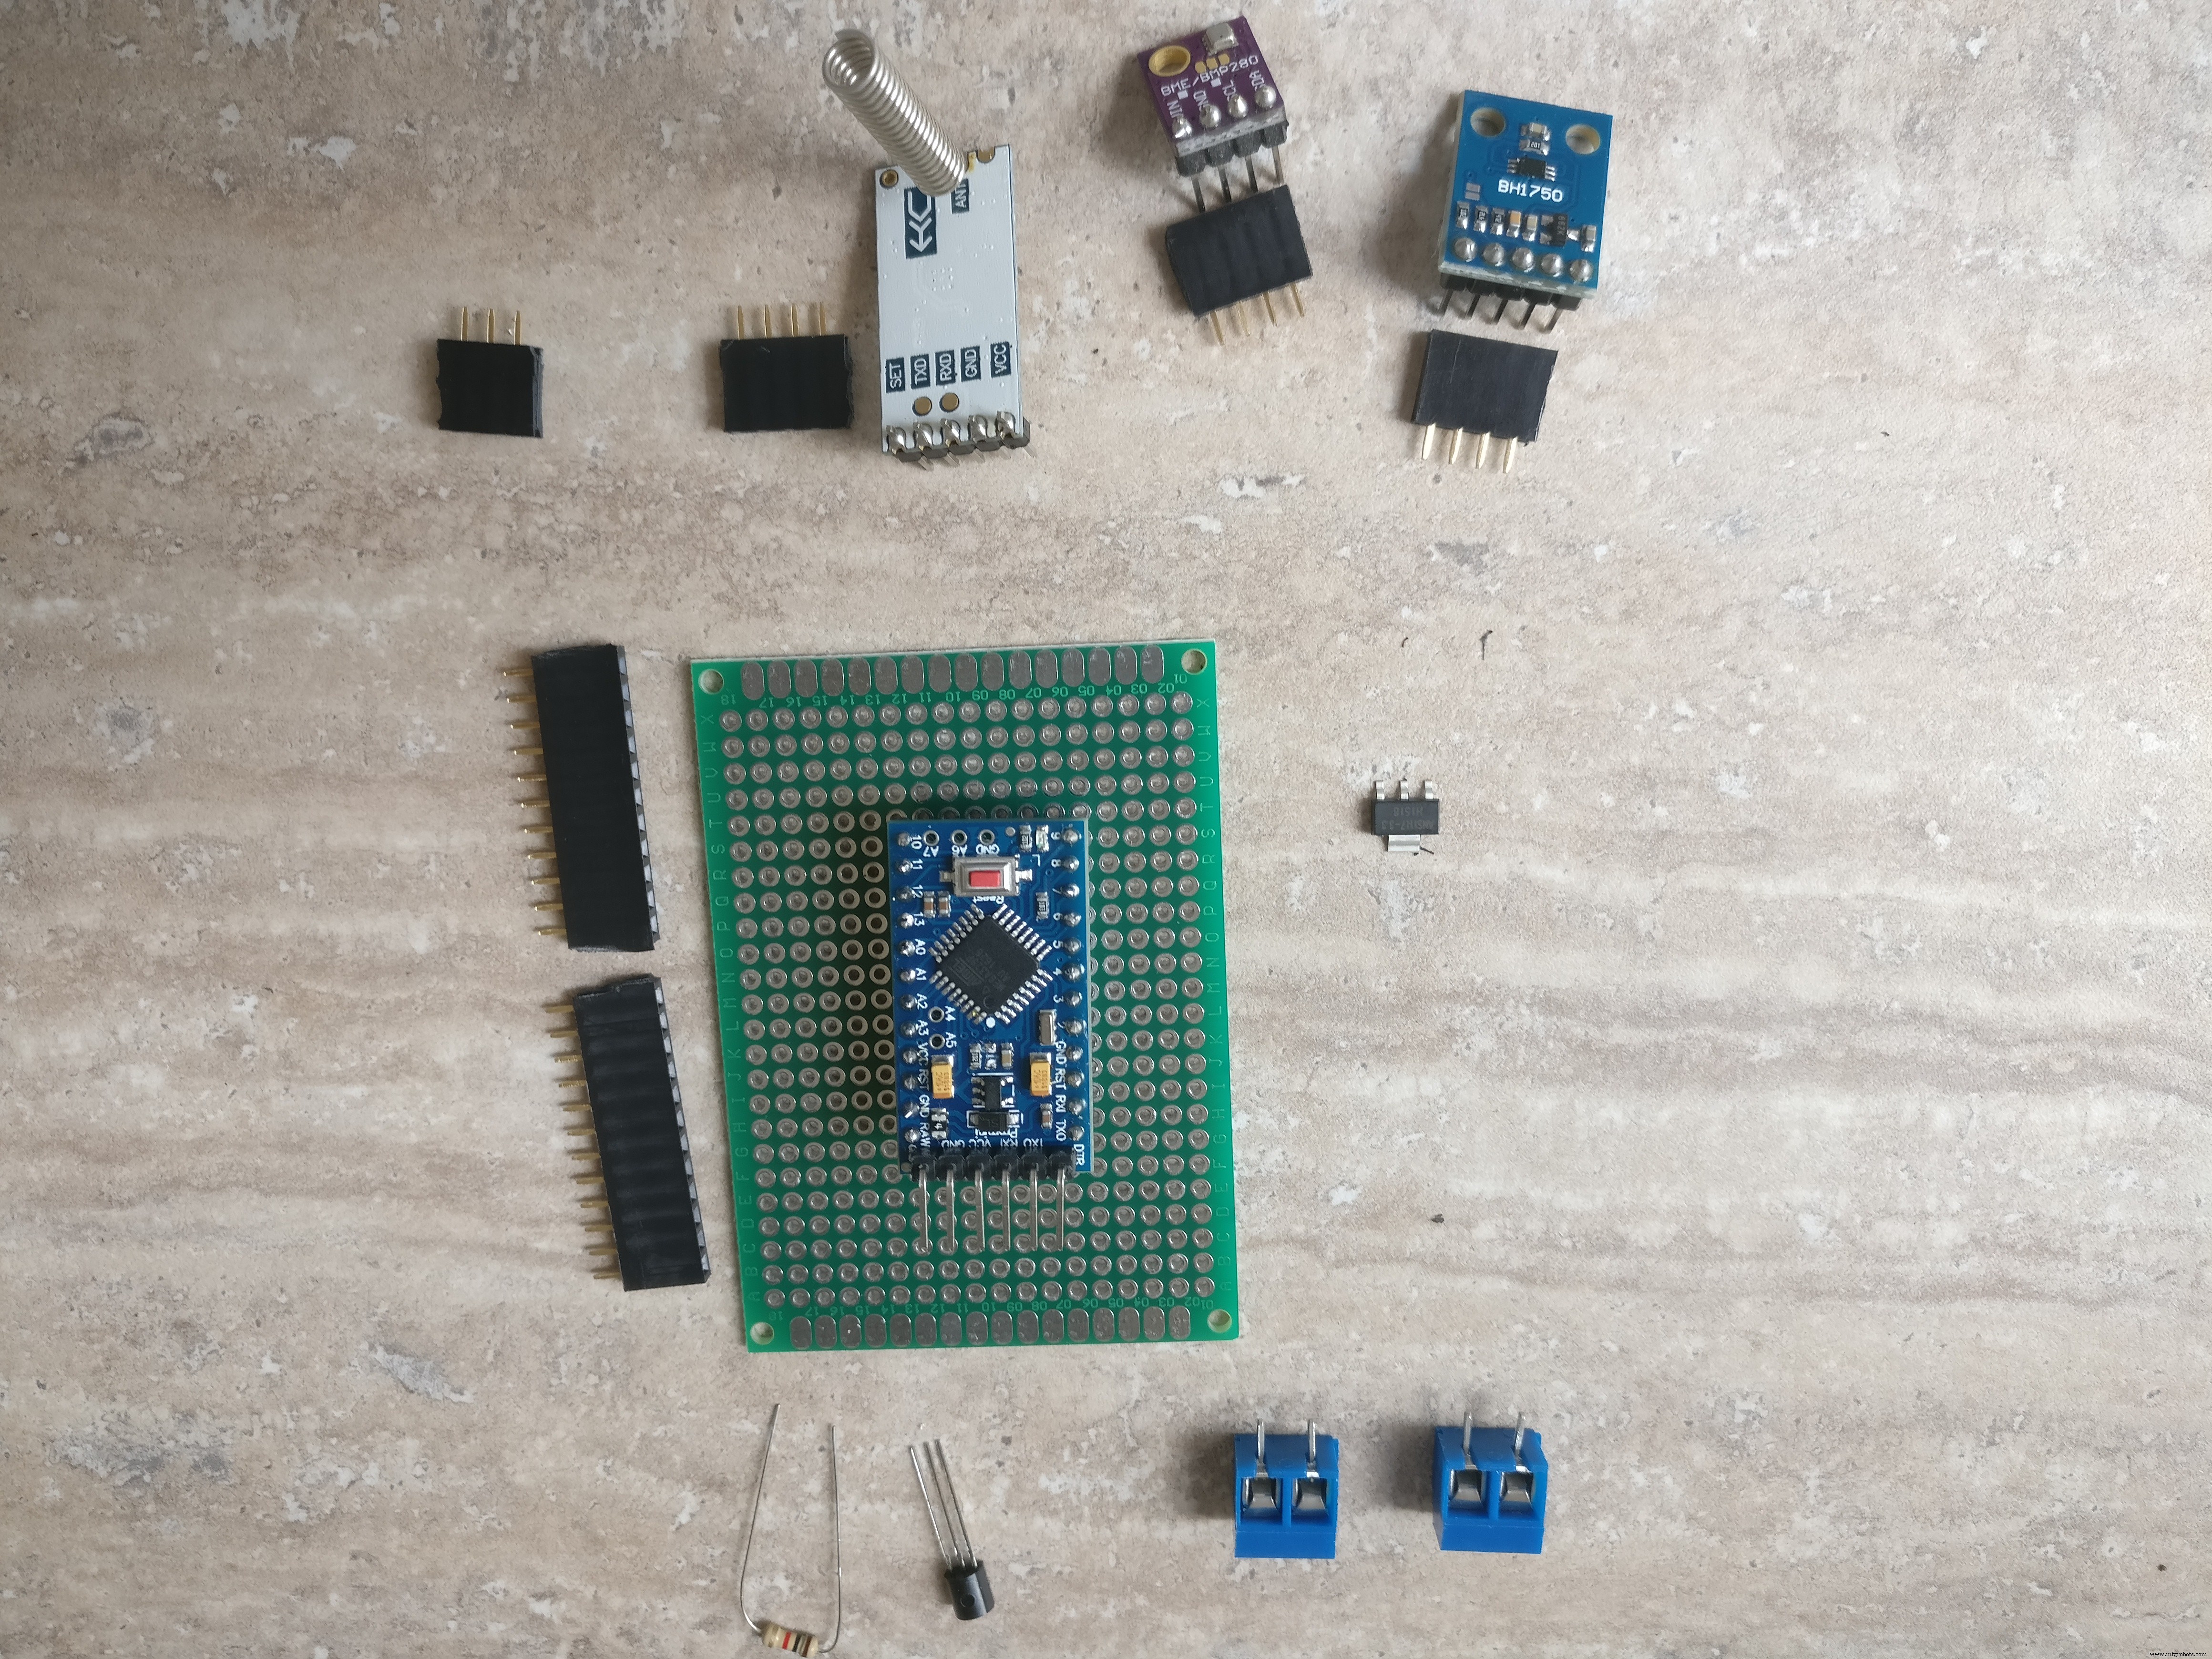
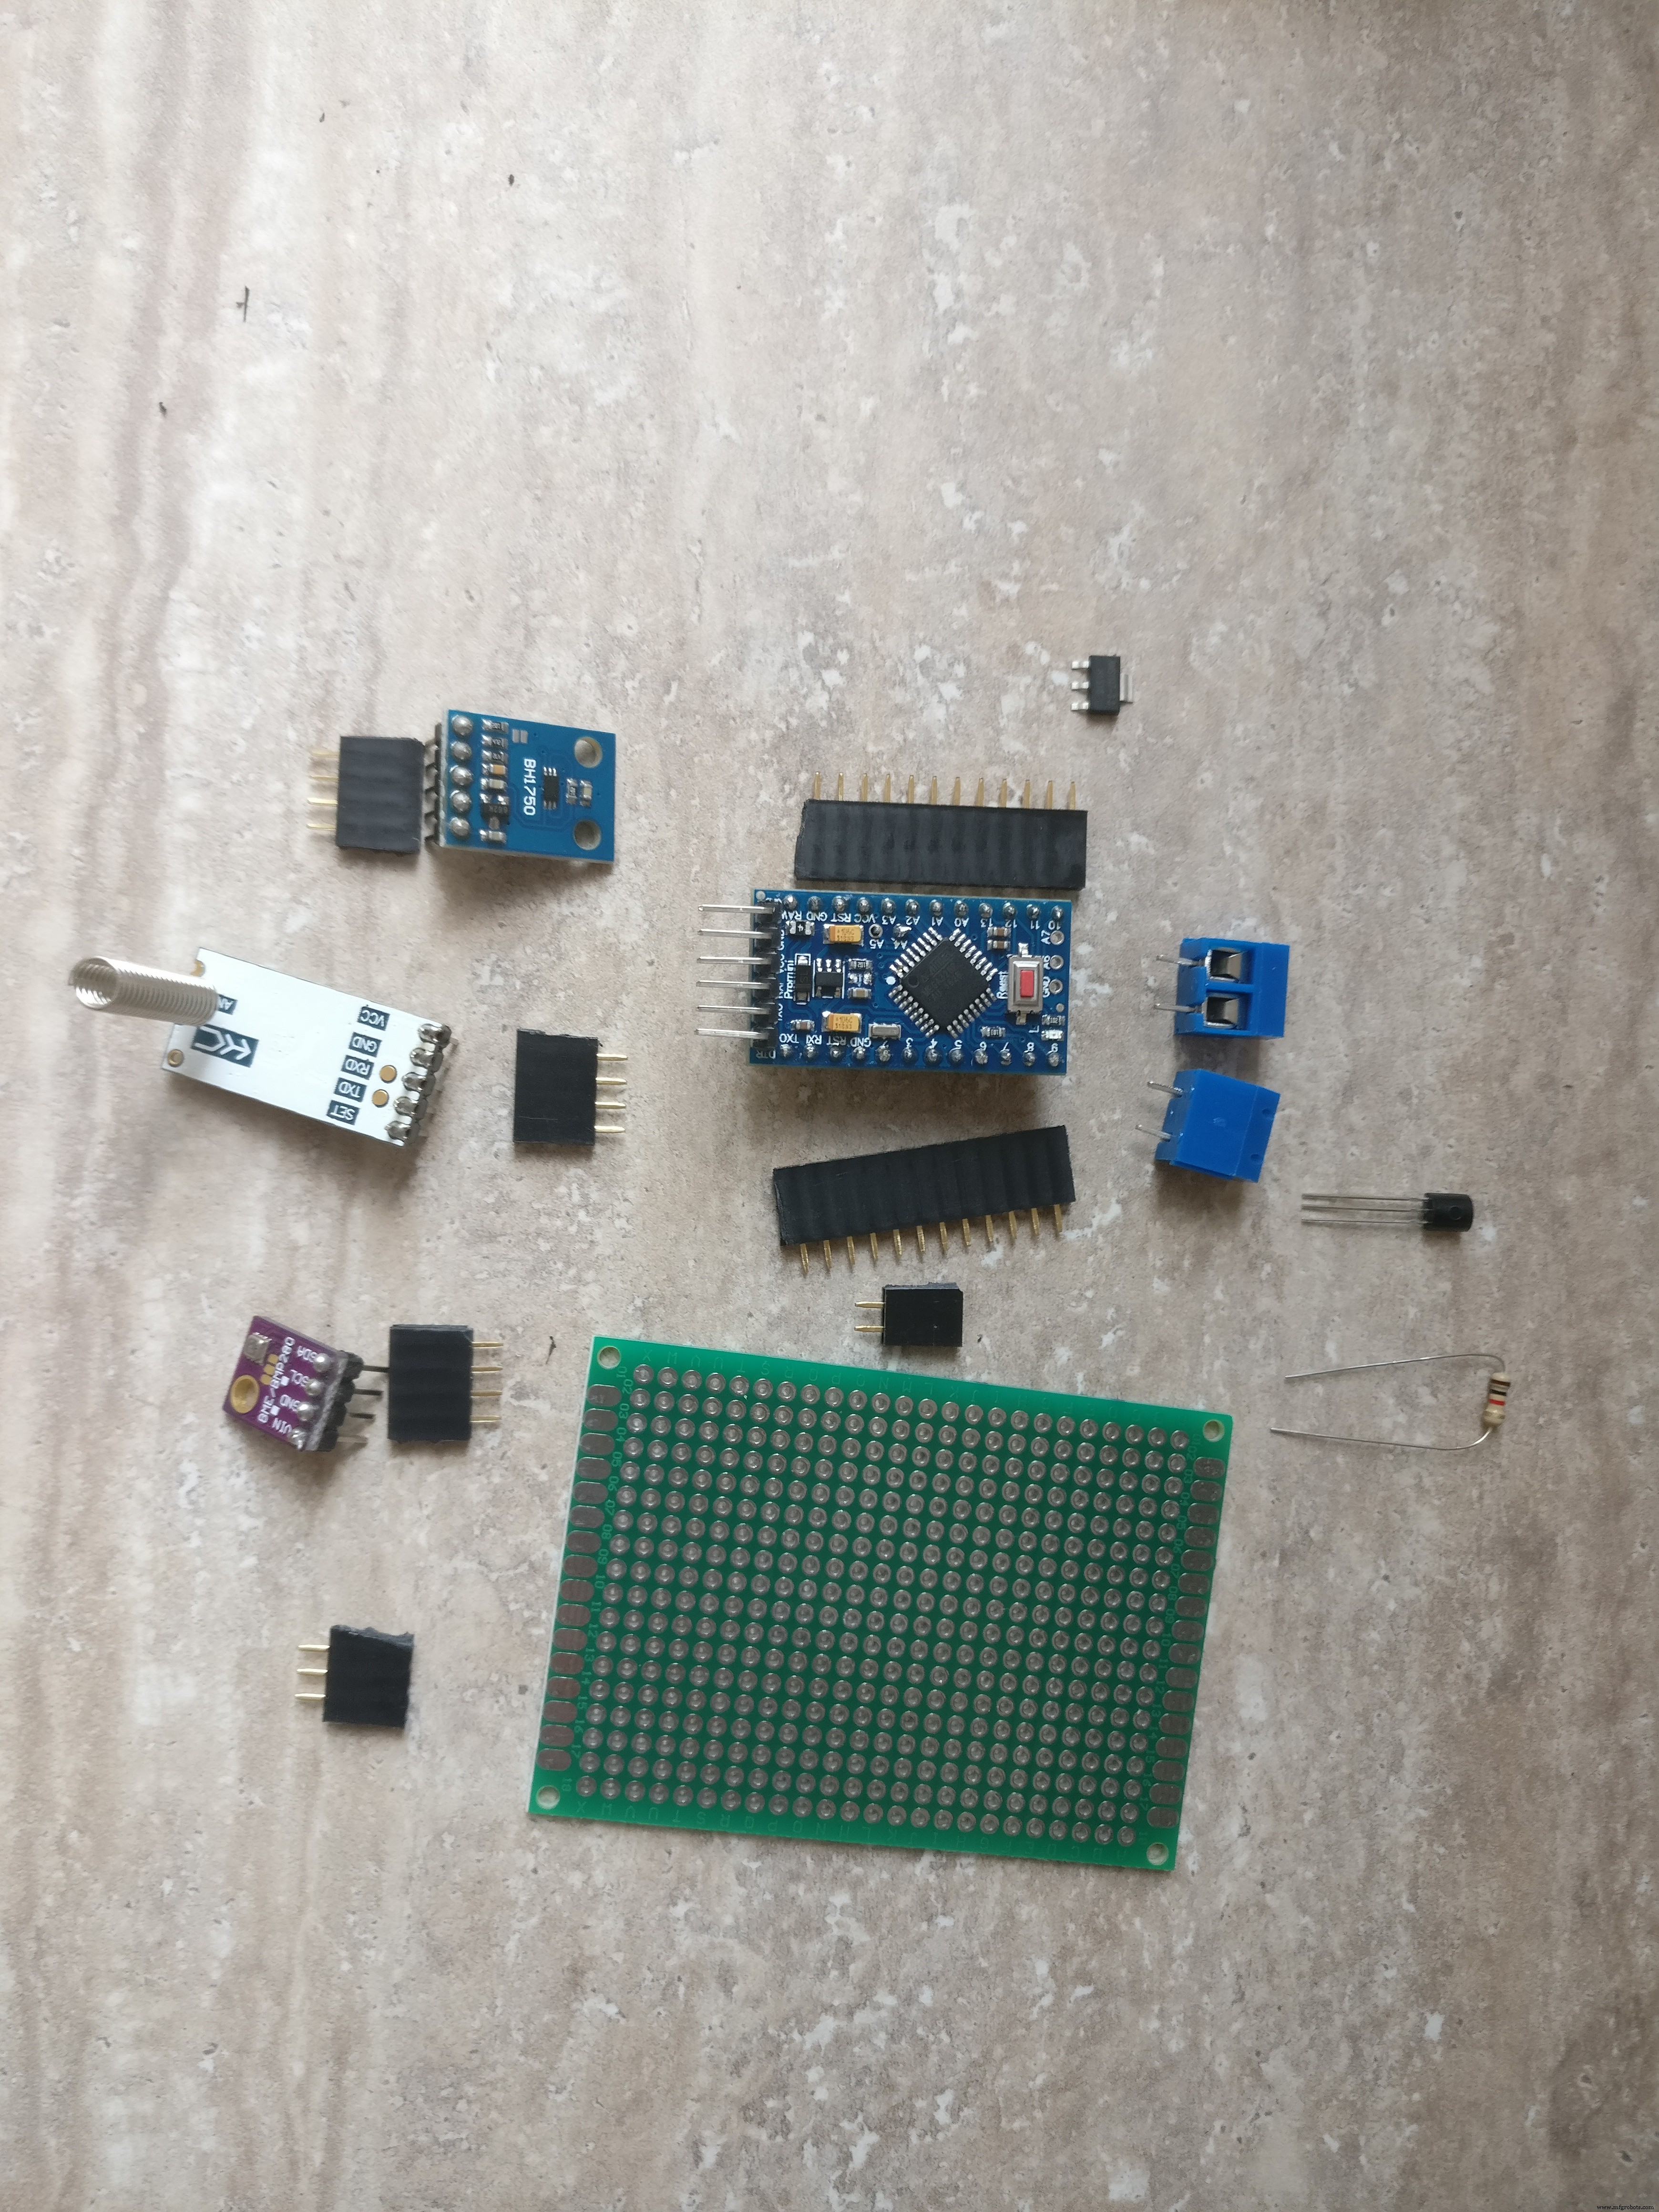
5. Arduino Pro Mini 328p
6.一个二极管,1N4004(防止电池到面板的反向电流)
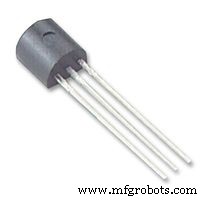
7.一个小的NPN晶体管和1k电阻(用于开关元件的电源)
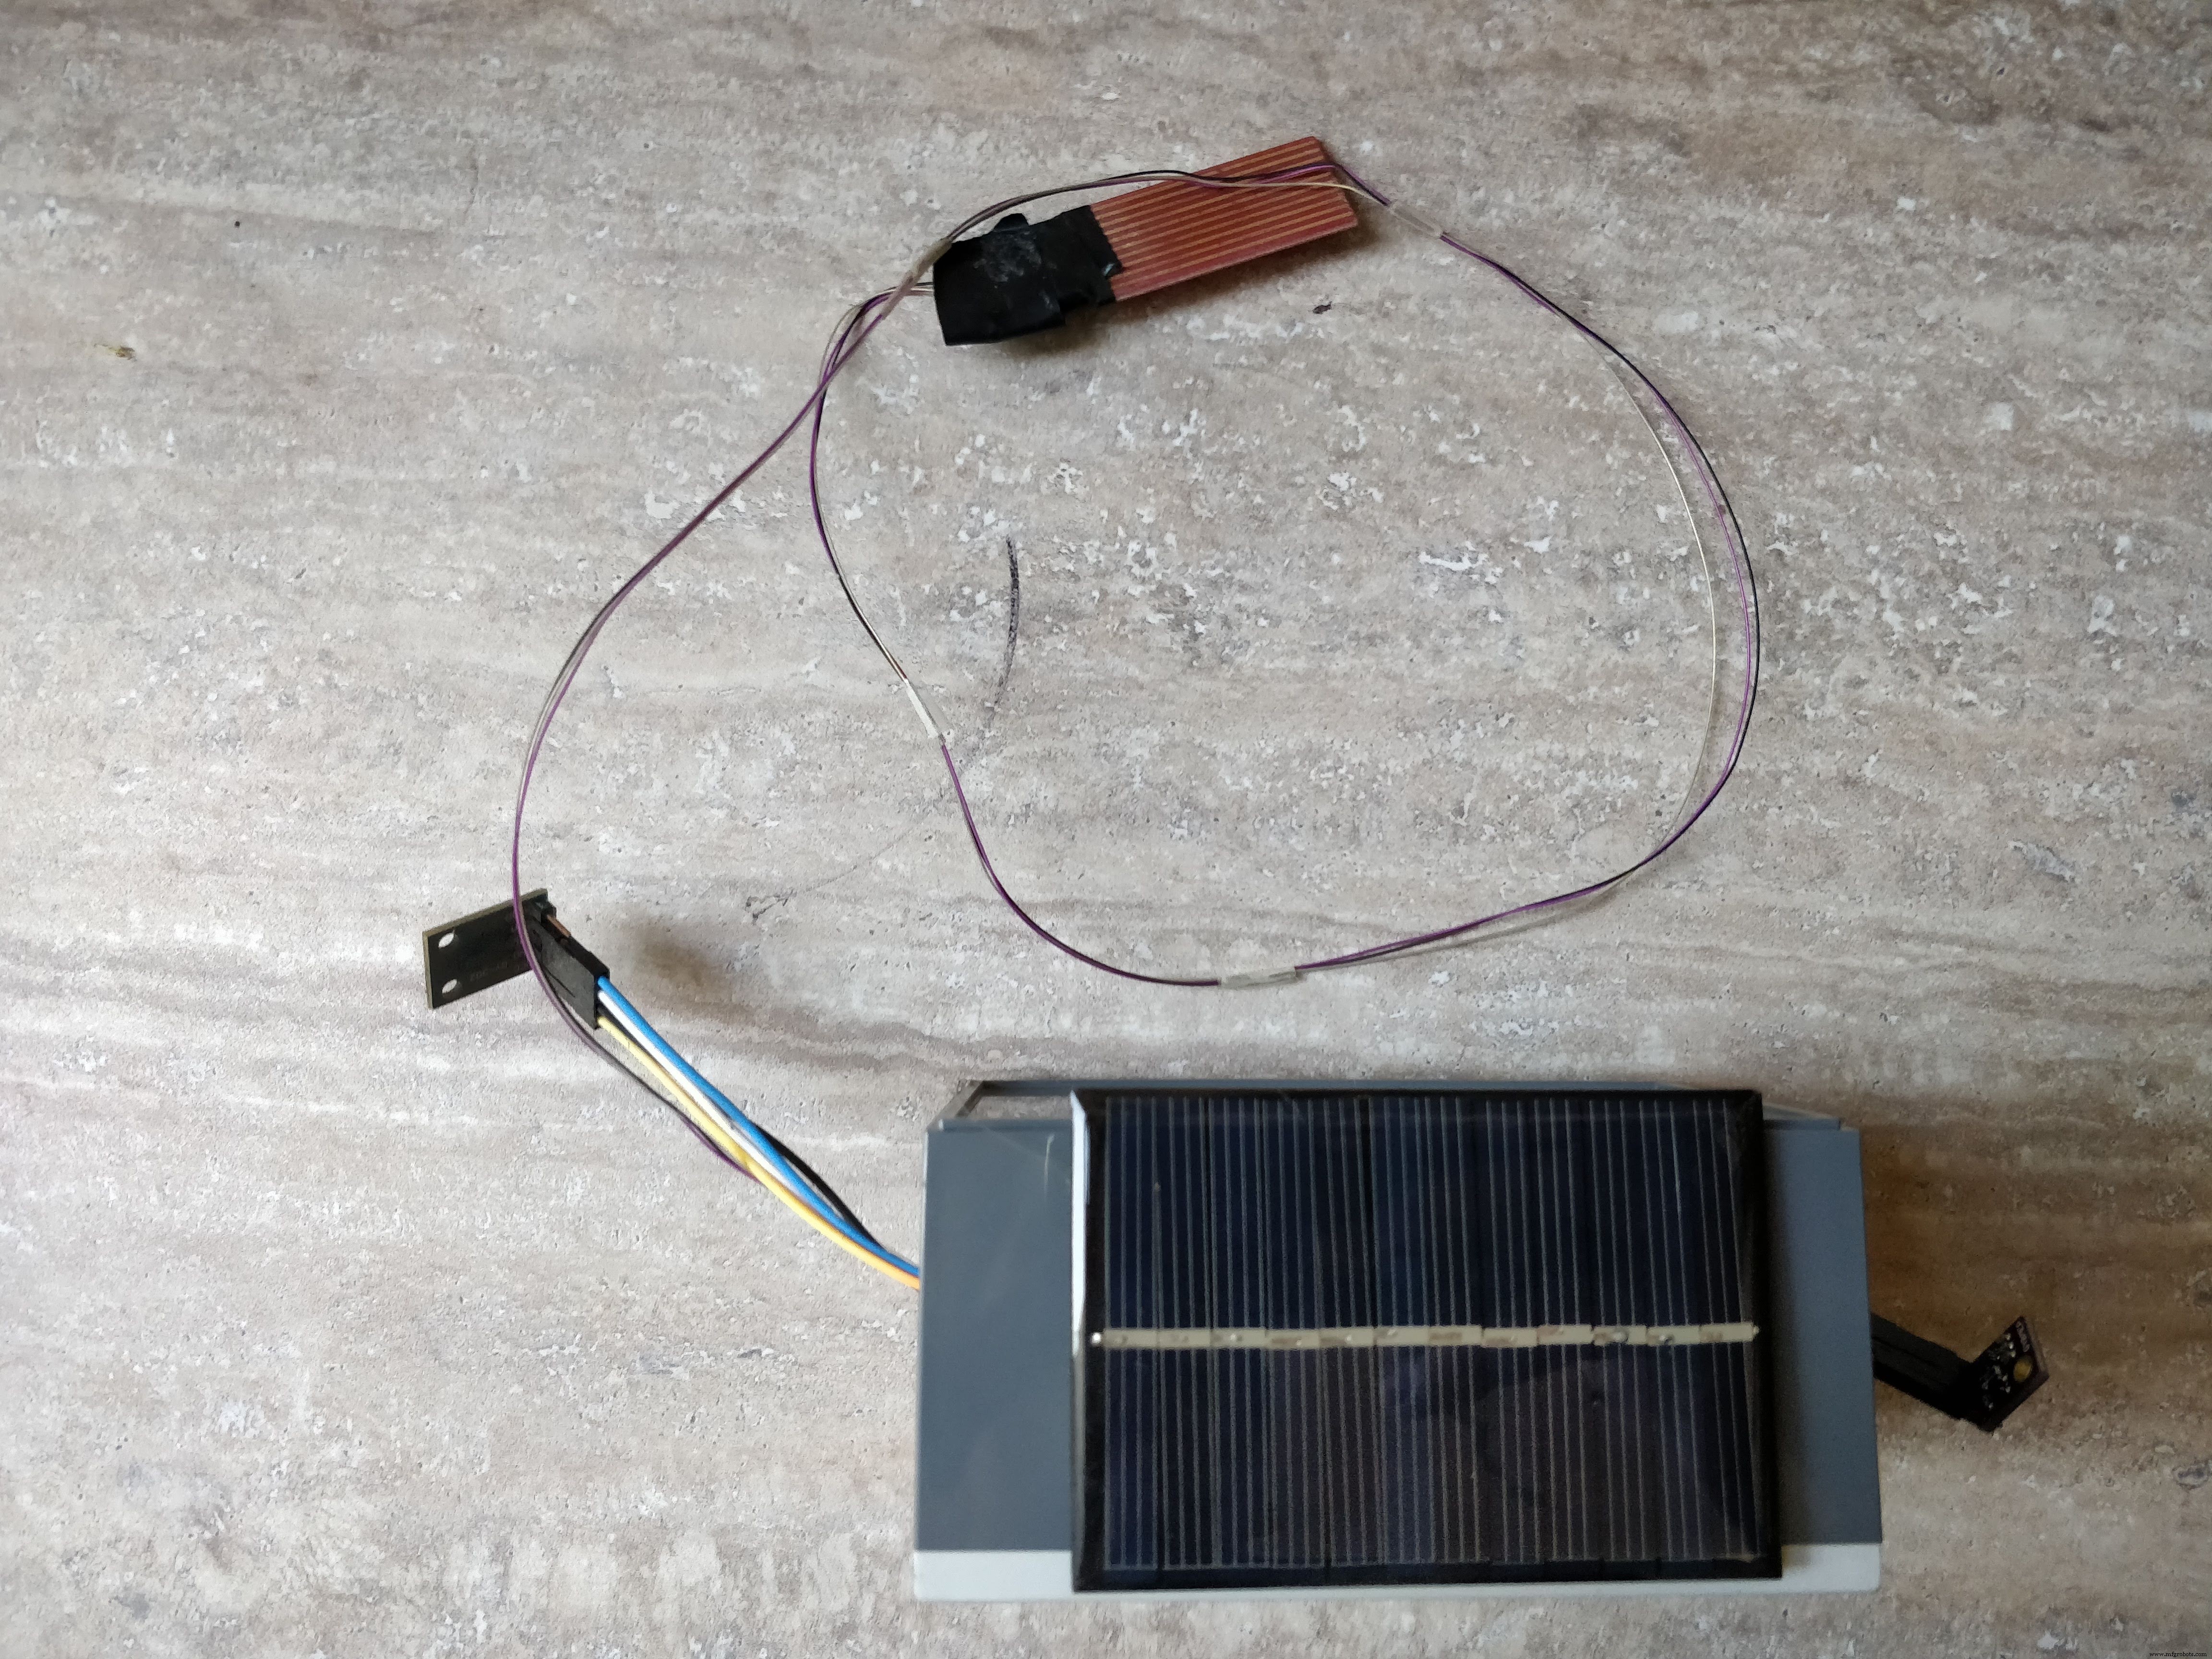
8.雨量传感器
9. HC-12串口通讯模块
10. HC-12 USB串口模块(基站用)
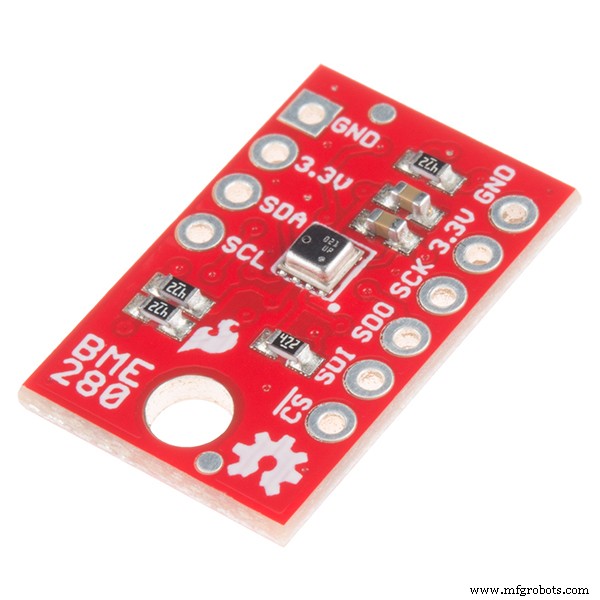
11. BME280 博世传感器模块(用于湿度、温度、压力)
12. BH1750光感模块
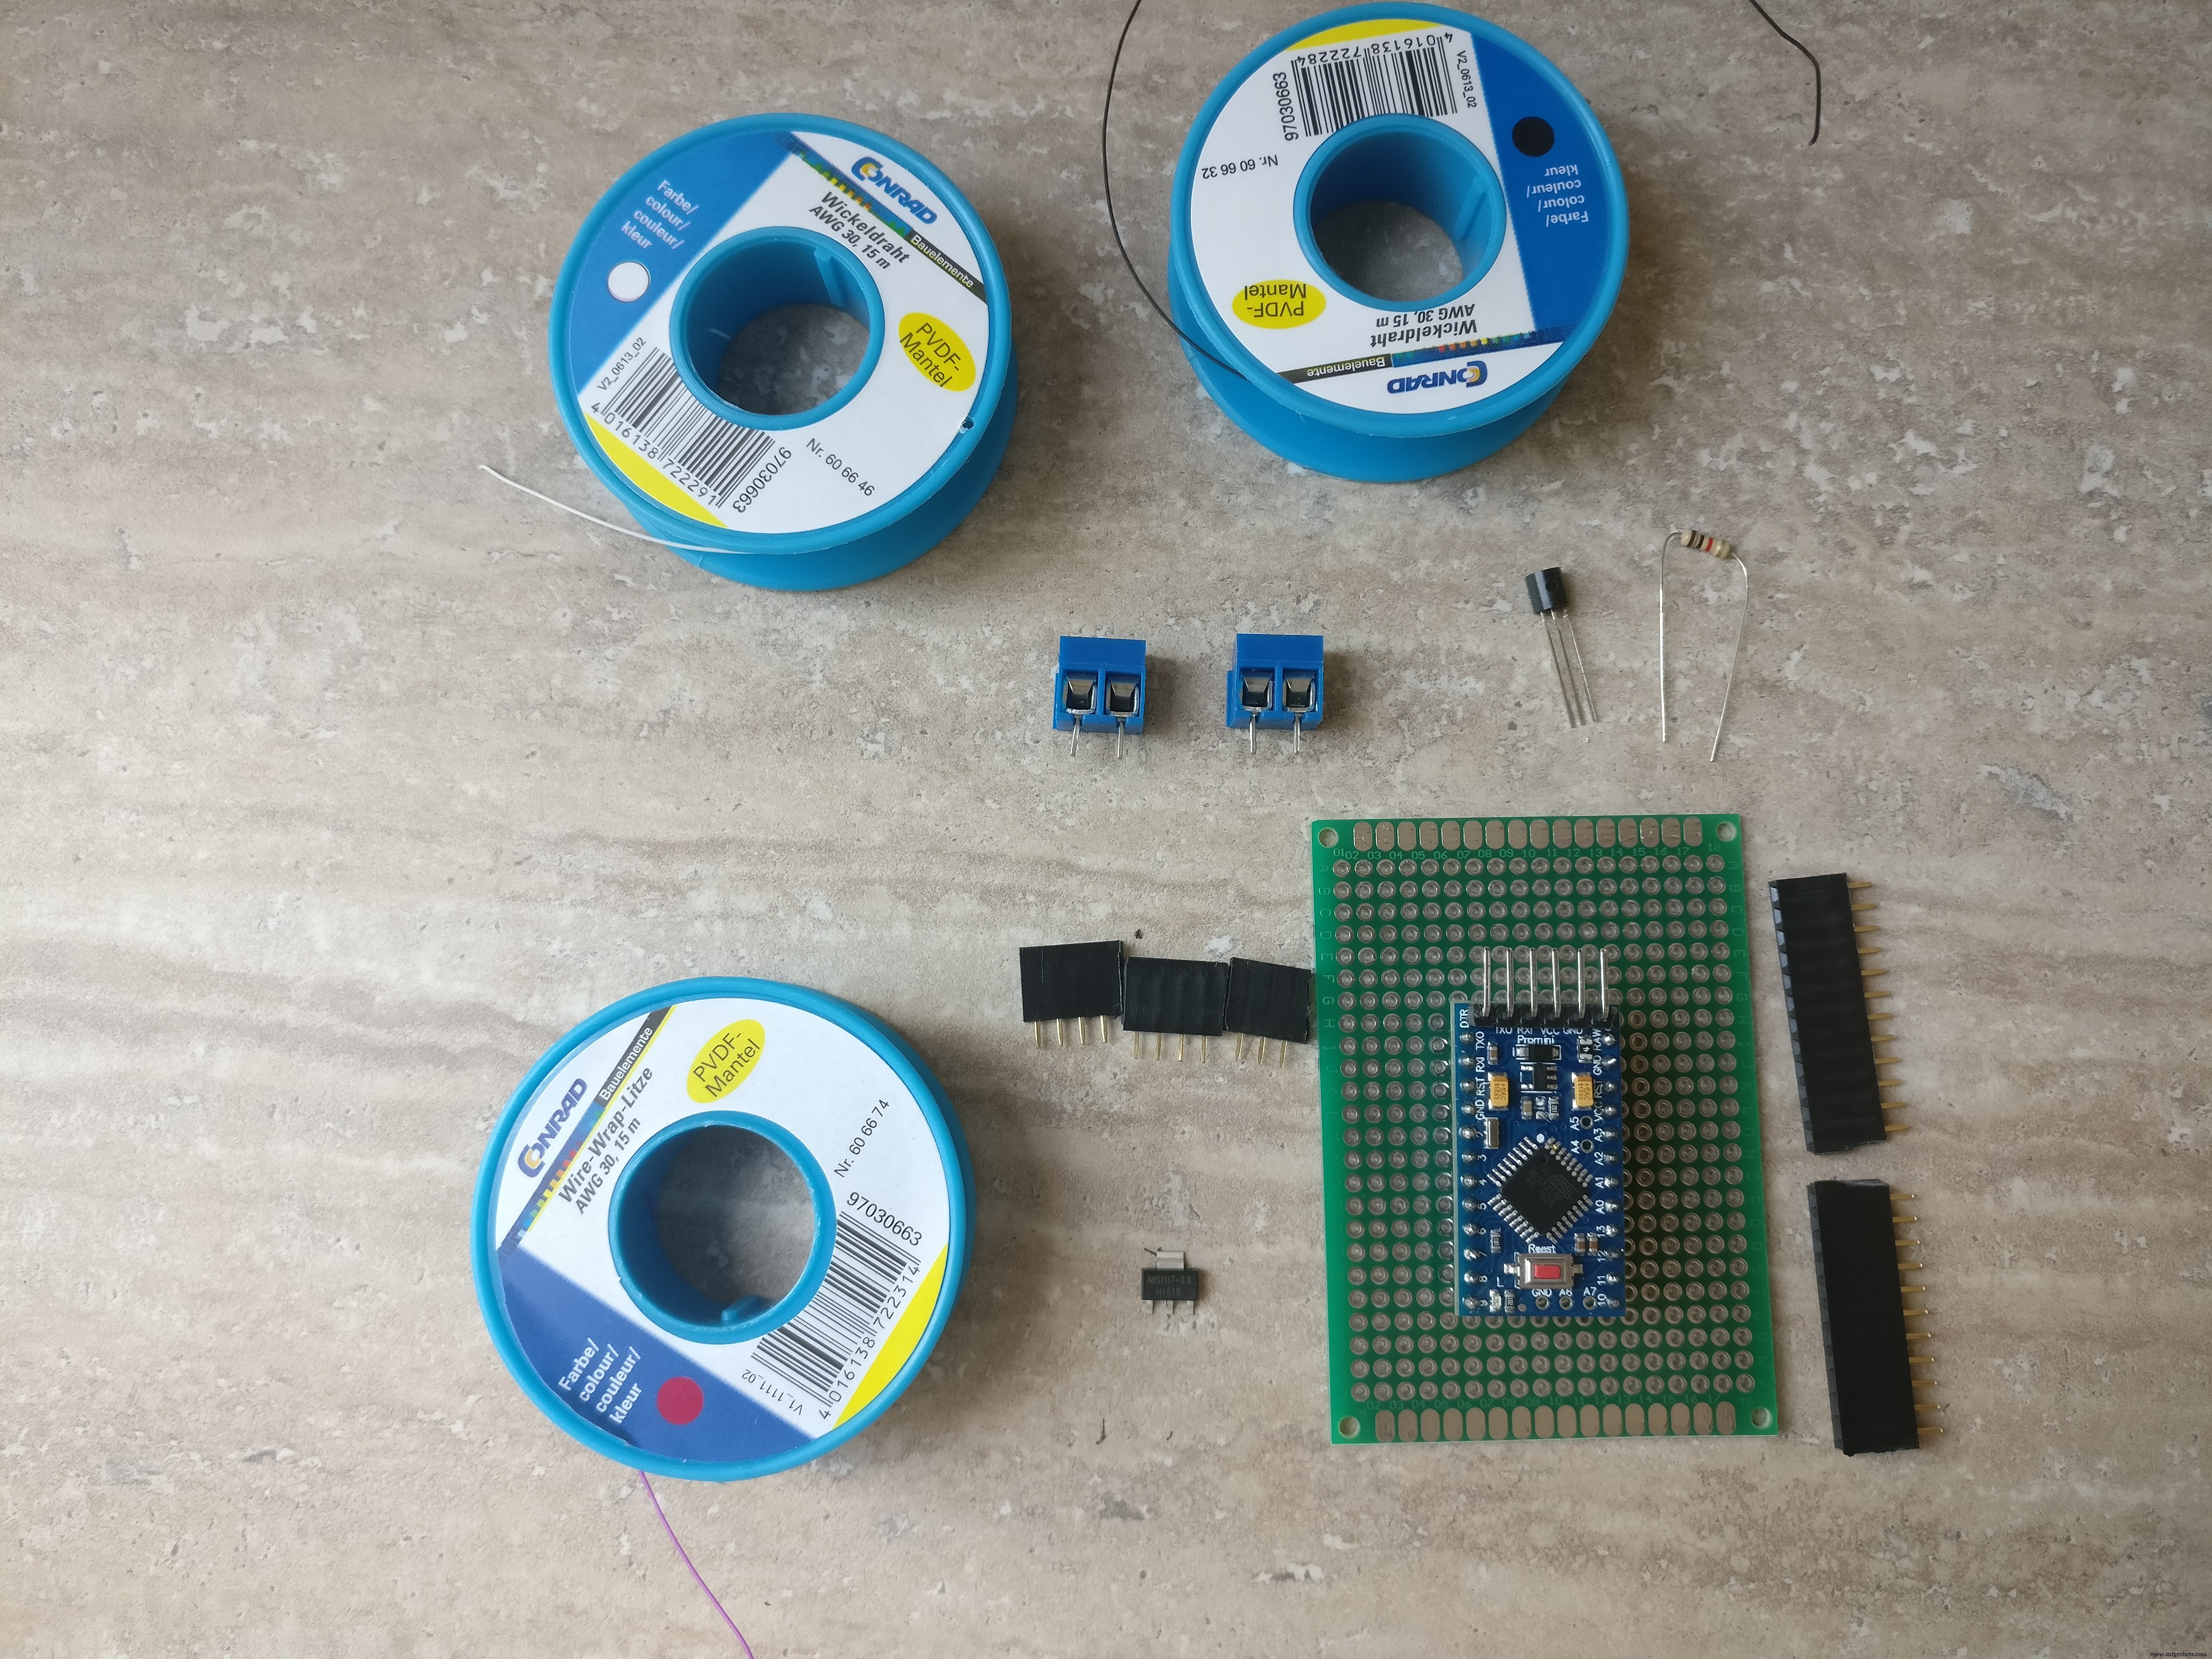
13. PCB,电线,焊料,KF301-2P 插入式螺丝连接器,公母PCB连接器,胶水
14. 3.3V稳压器
15. 基站:一直运行的PC,或开发板。它的作用是收集数据,训练降雨预测模型并进行预测
工具:
1. USB转串口FTDI适配器FT232RL对Arduino Pro Mini进行编程
2. Arduino IDE
3. 钻孔
4.细锯片
5. 螺丝刀
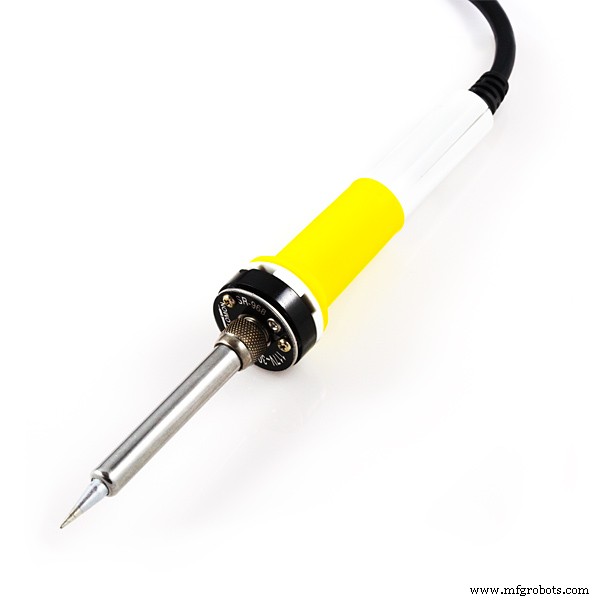
6. 烙铁
7.线切割机
技能:
1.焊接,查看本教程
2. 基本arduino编程
3.Linux服务配置、包安装
4. 一些编程技巧
第 2 步:建立气象站
气象站由以下几组组件组成:
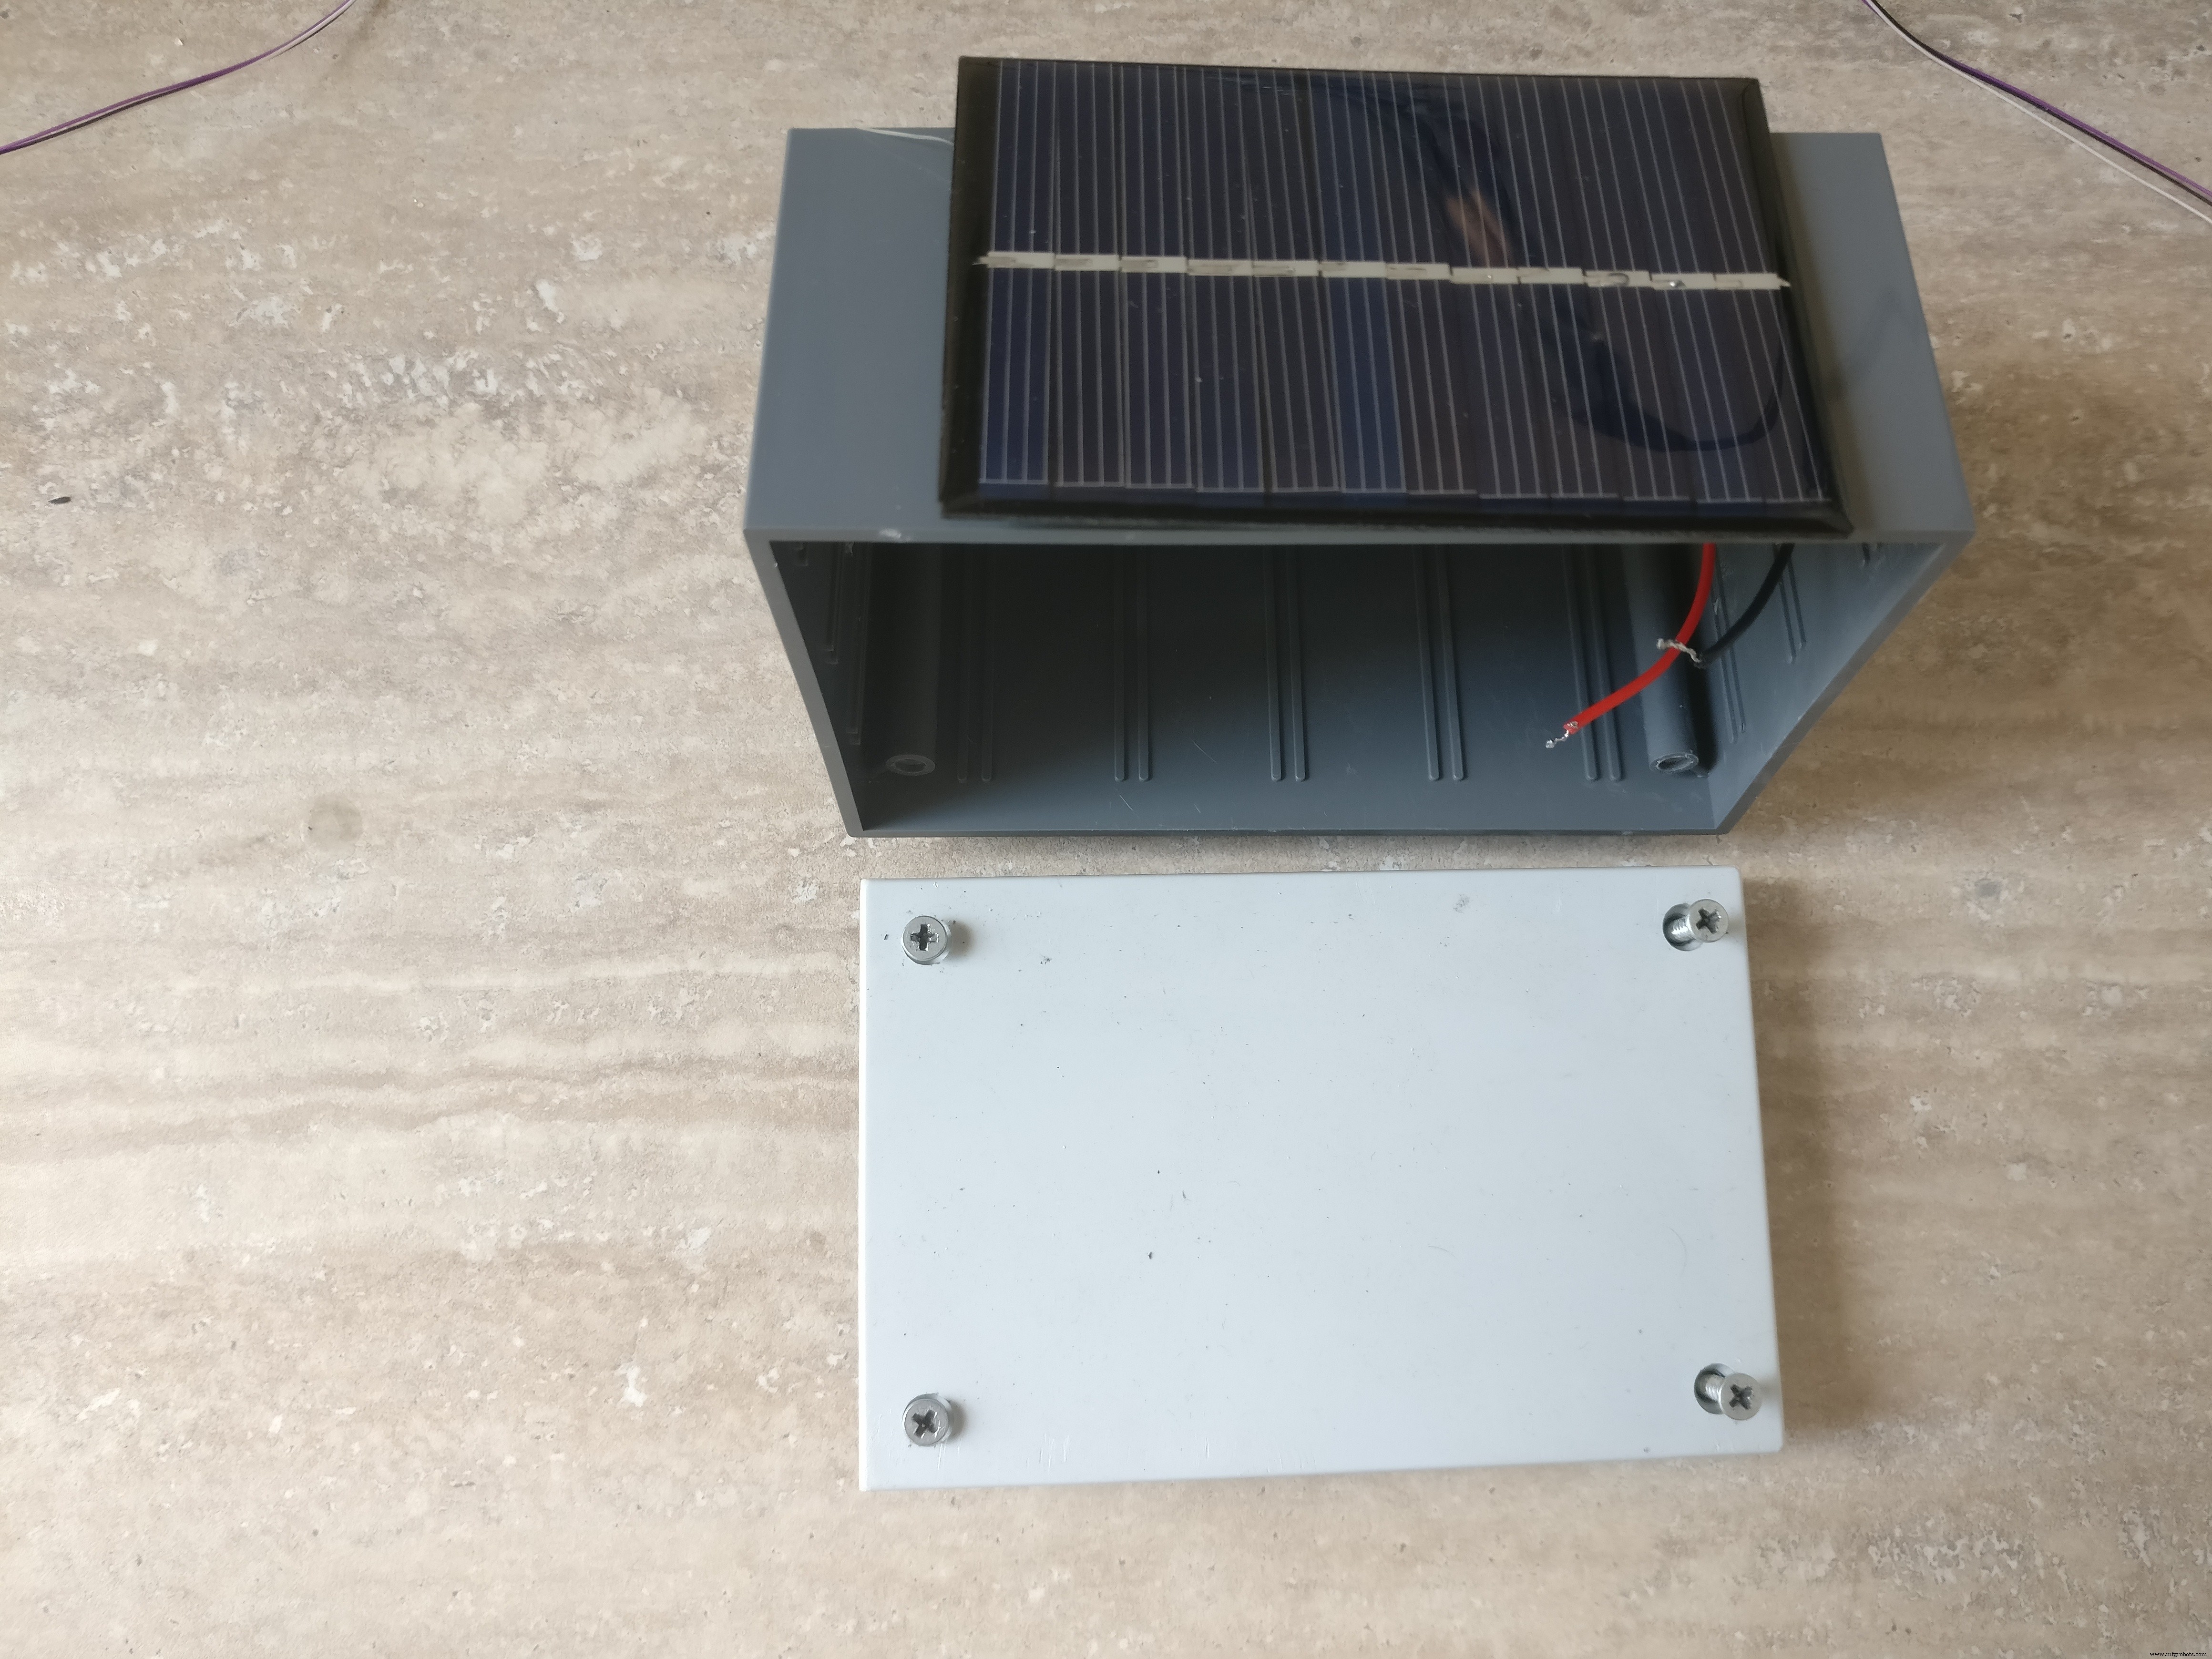
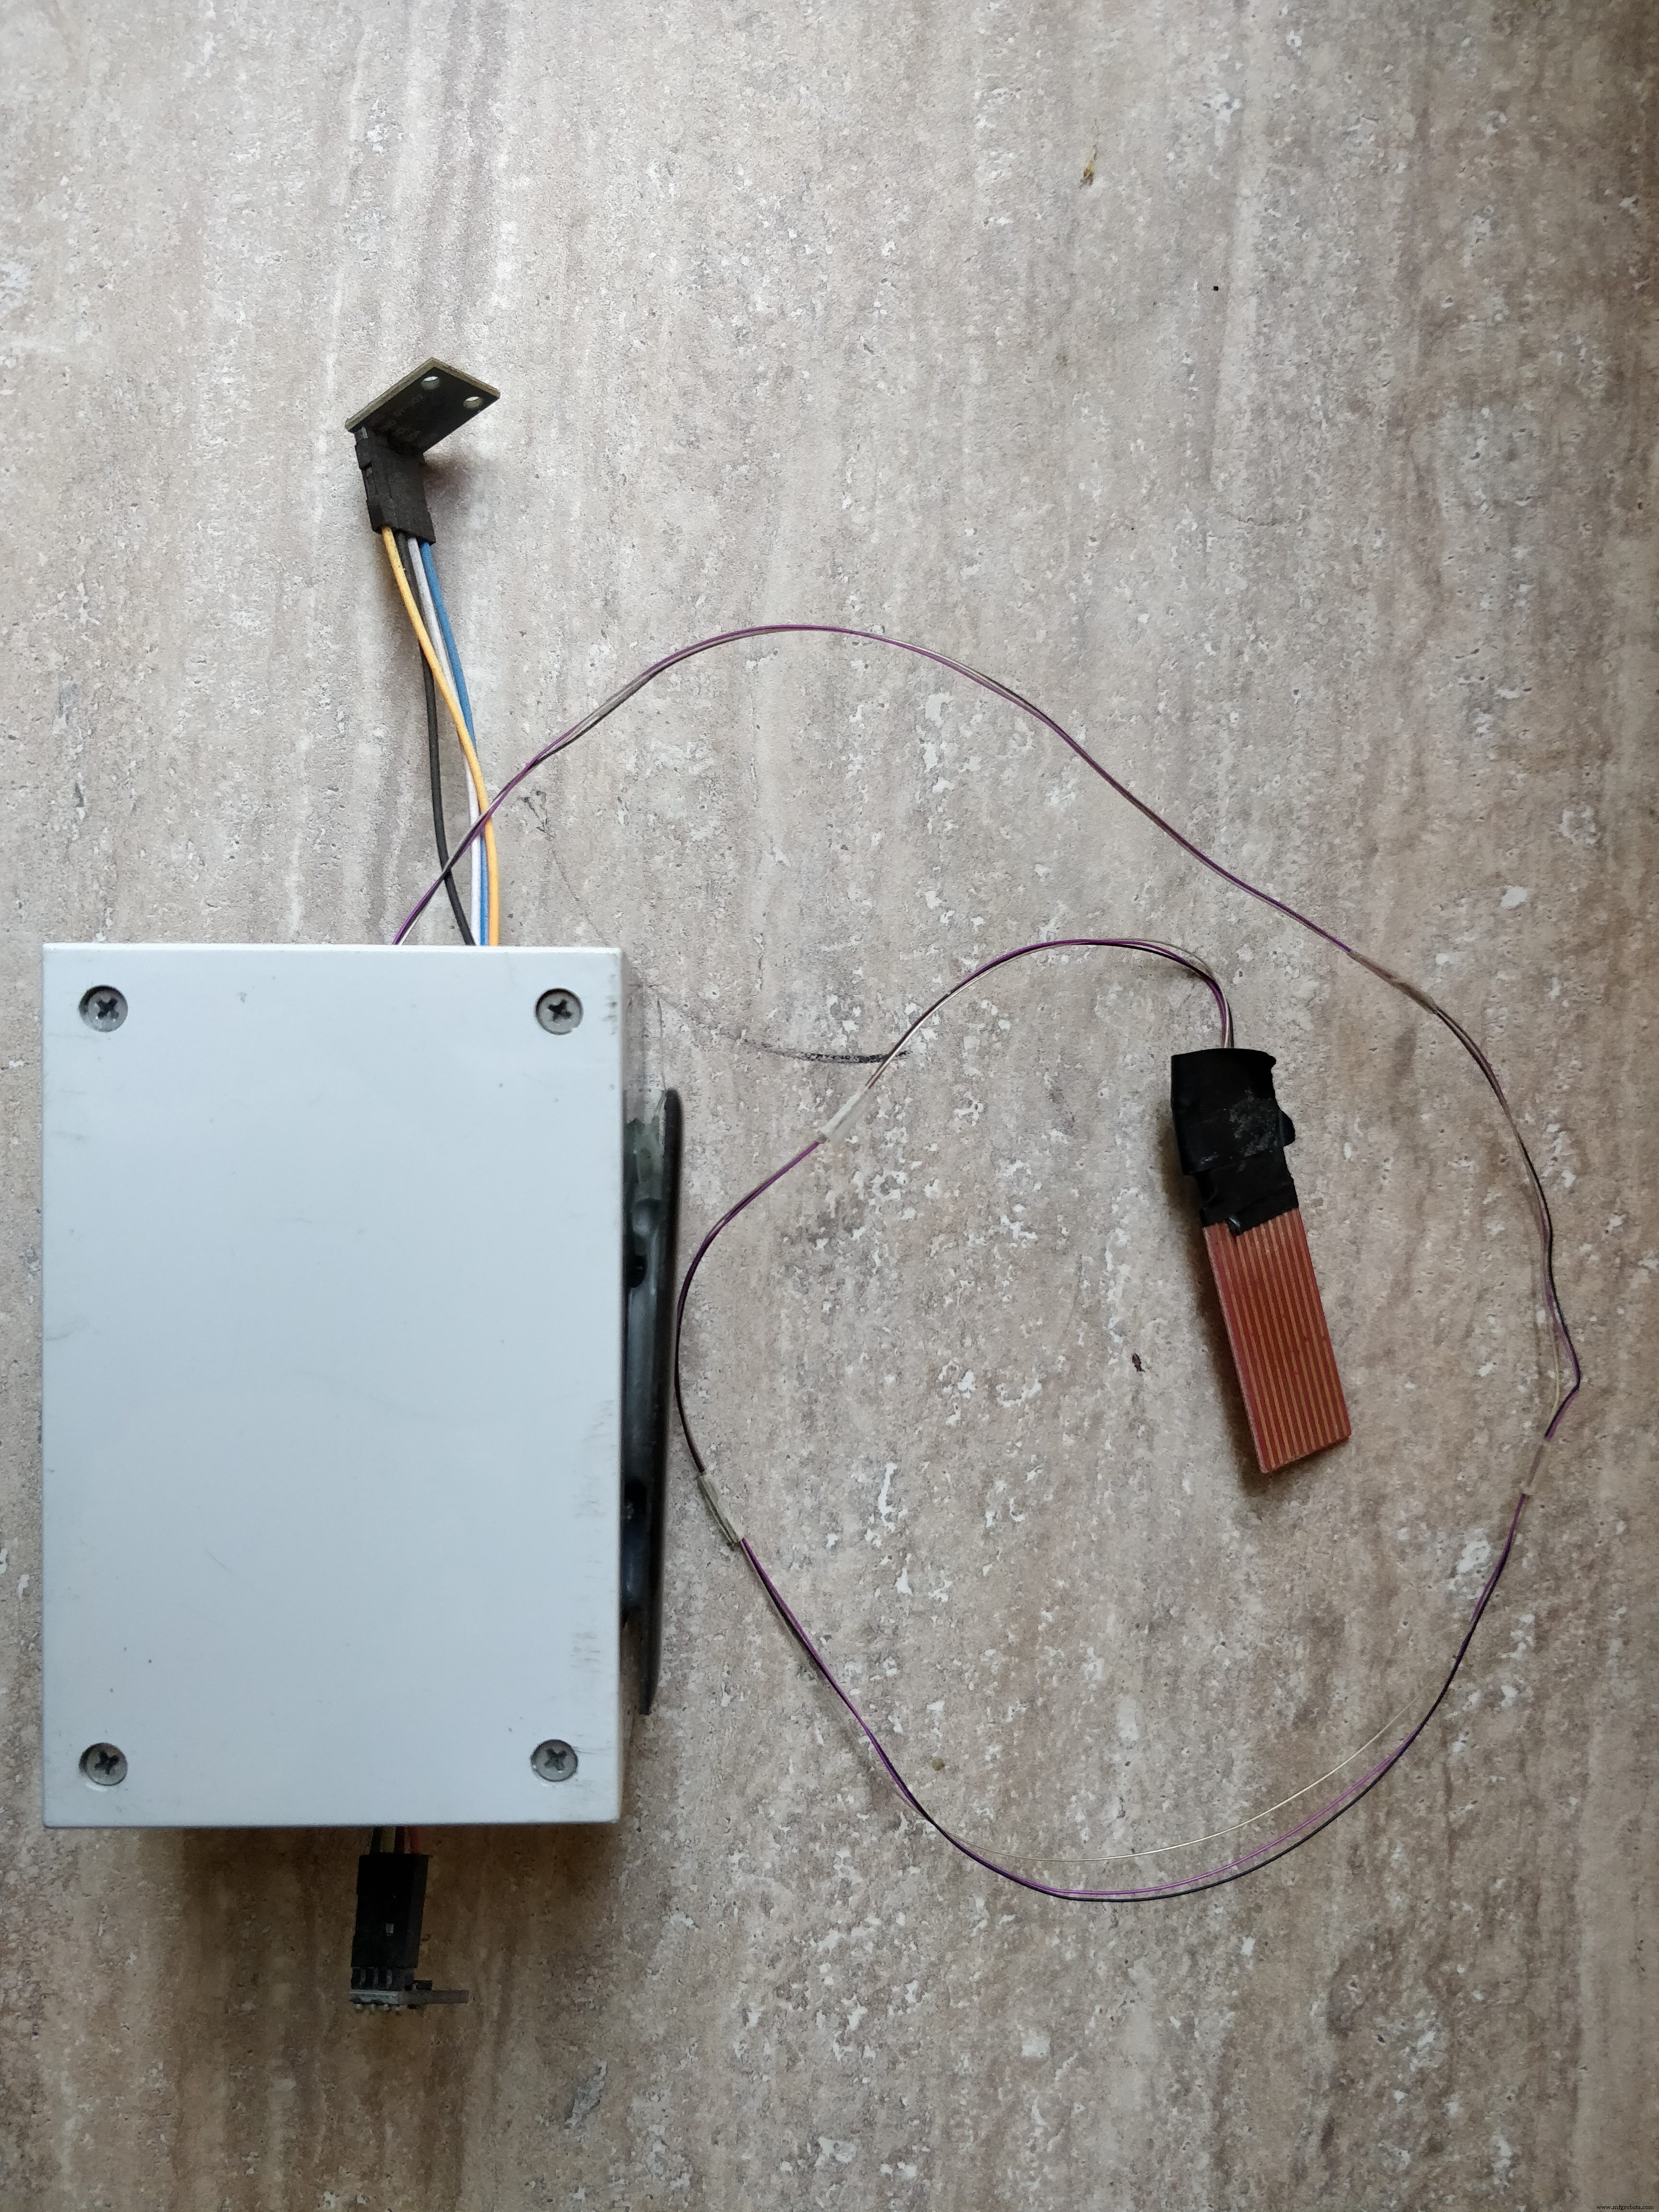
1. 贴有太阳能电池板的盒子
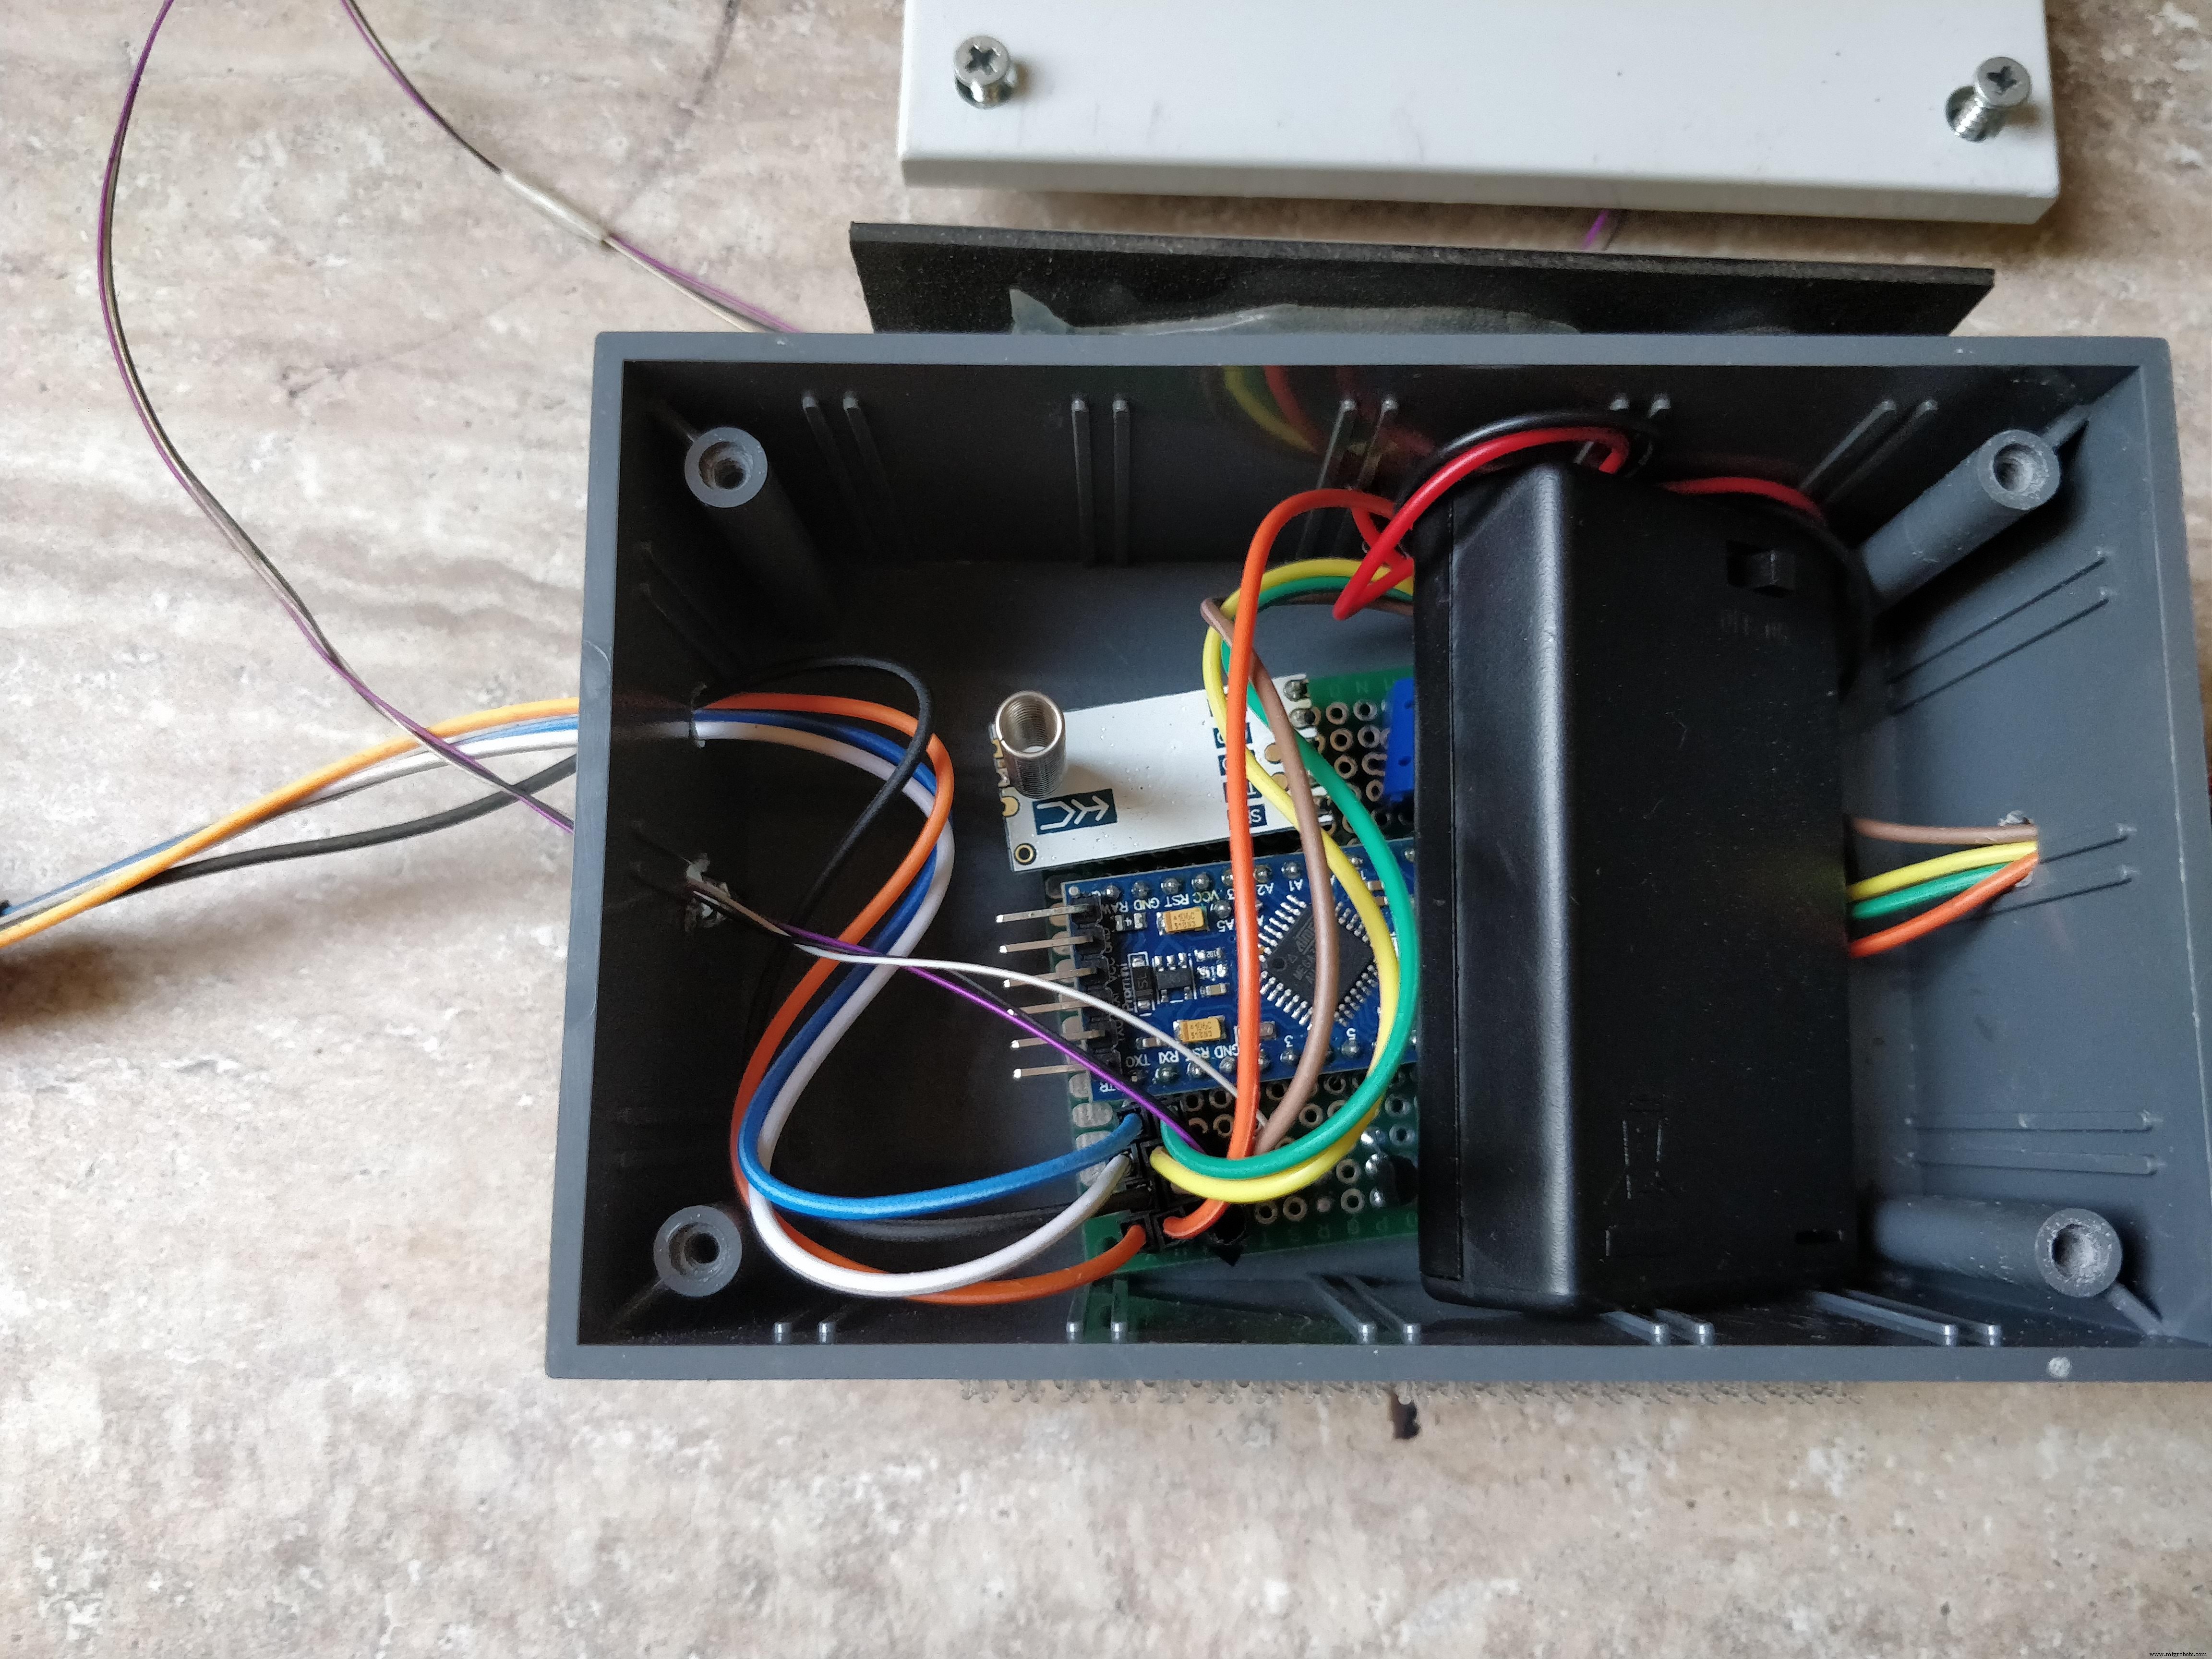
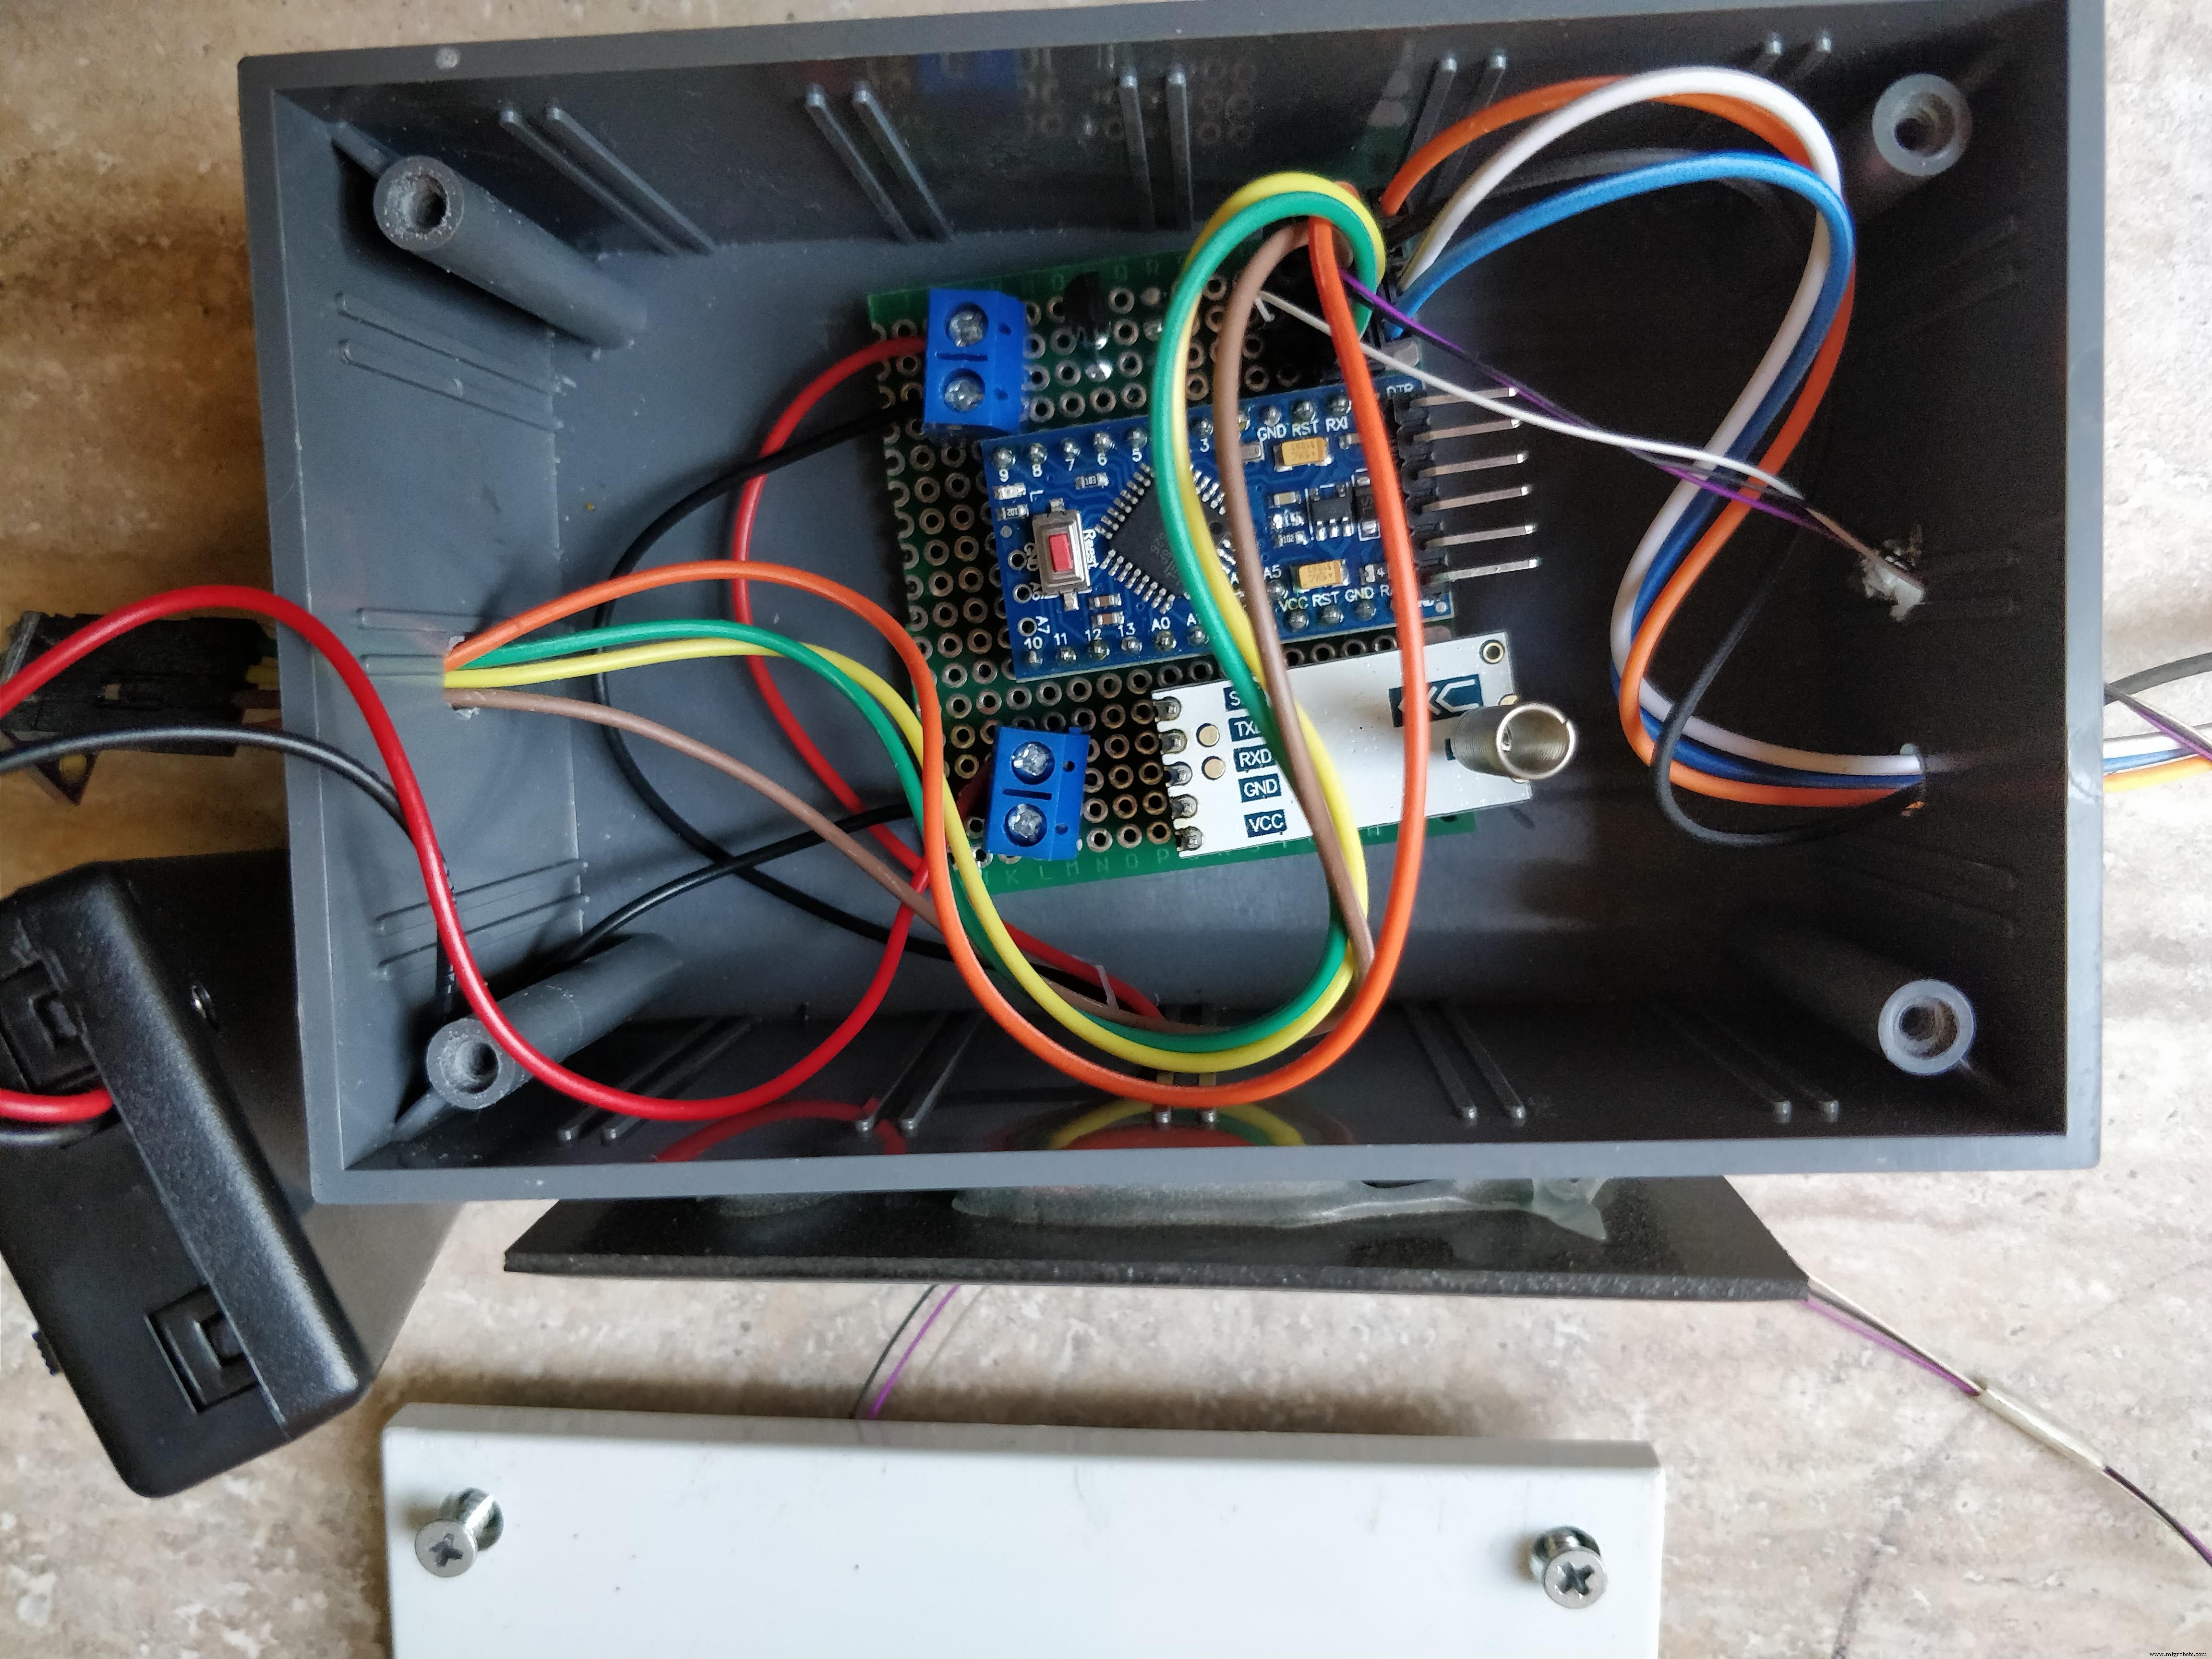
2 .带有电子元件的 PCB
3. 电池座也在里面
4. BME280和外面的光和雨传感器
1. 盒子需要 4 个孔,一个用于太阳能电池板电线,另外三个用于将放置在外面的传感器。首先钻整体,它们应该足够大,以便公母线伸出并到达传感器。整体钻孔后,将面板粘在盒子的一侧,然后将电线穿过里面的孔
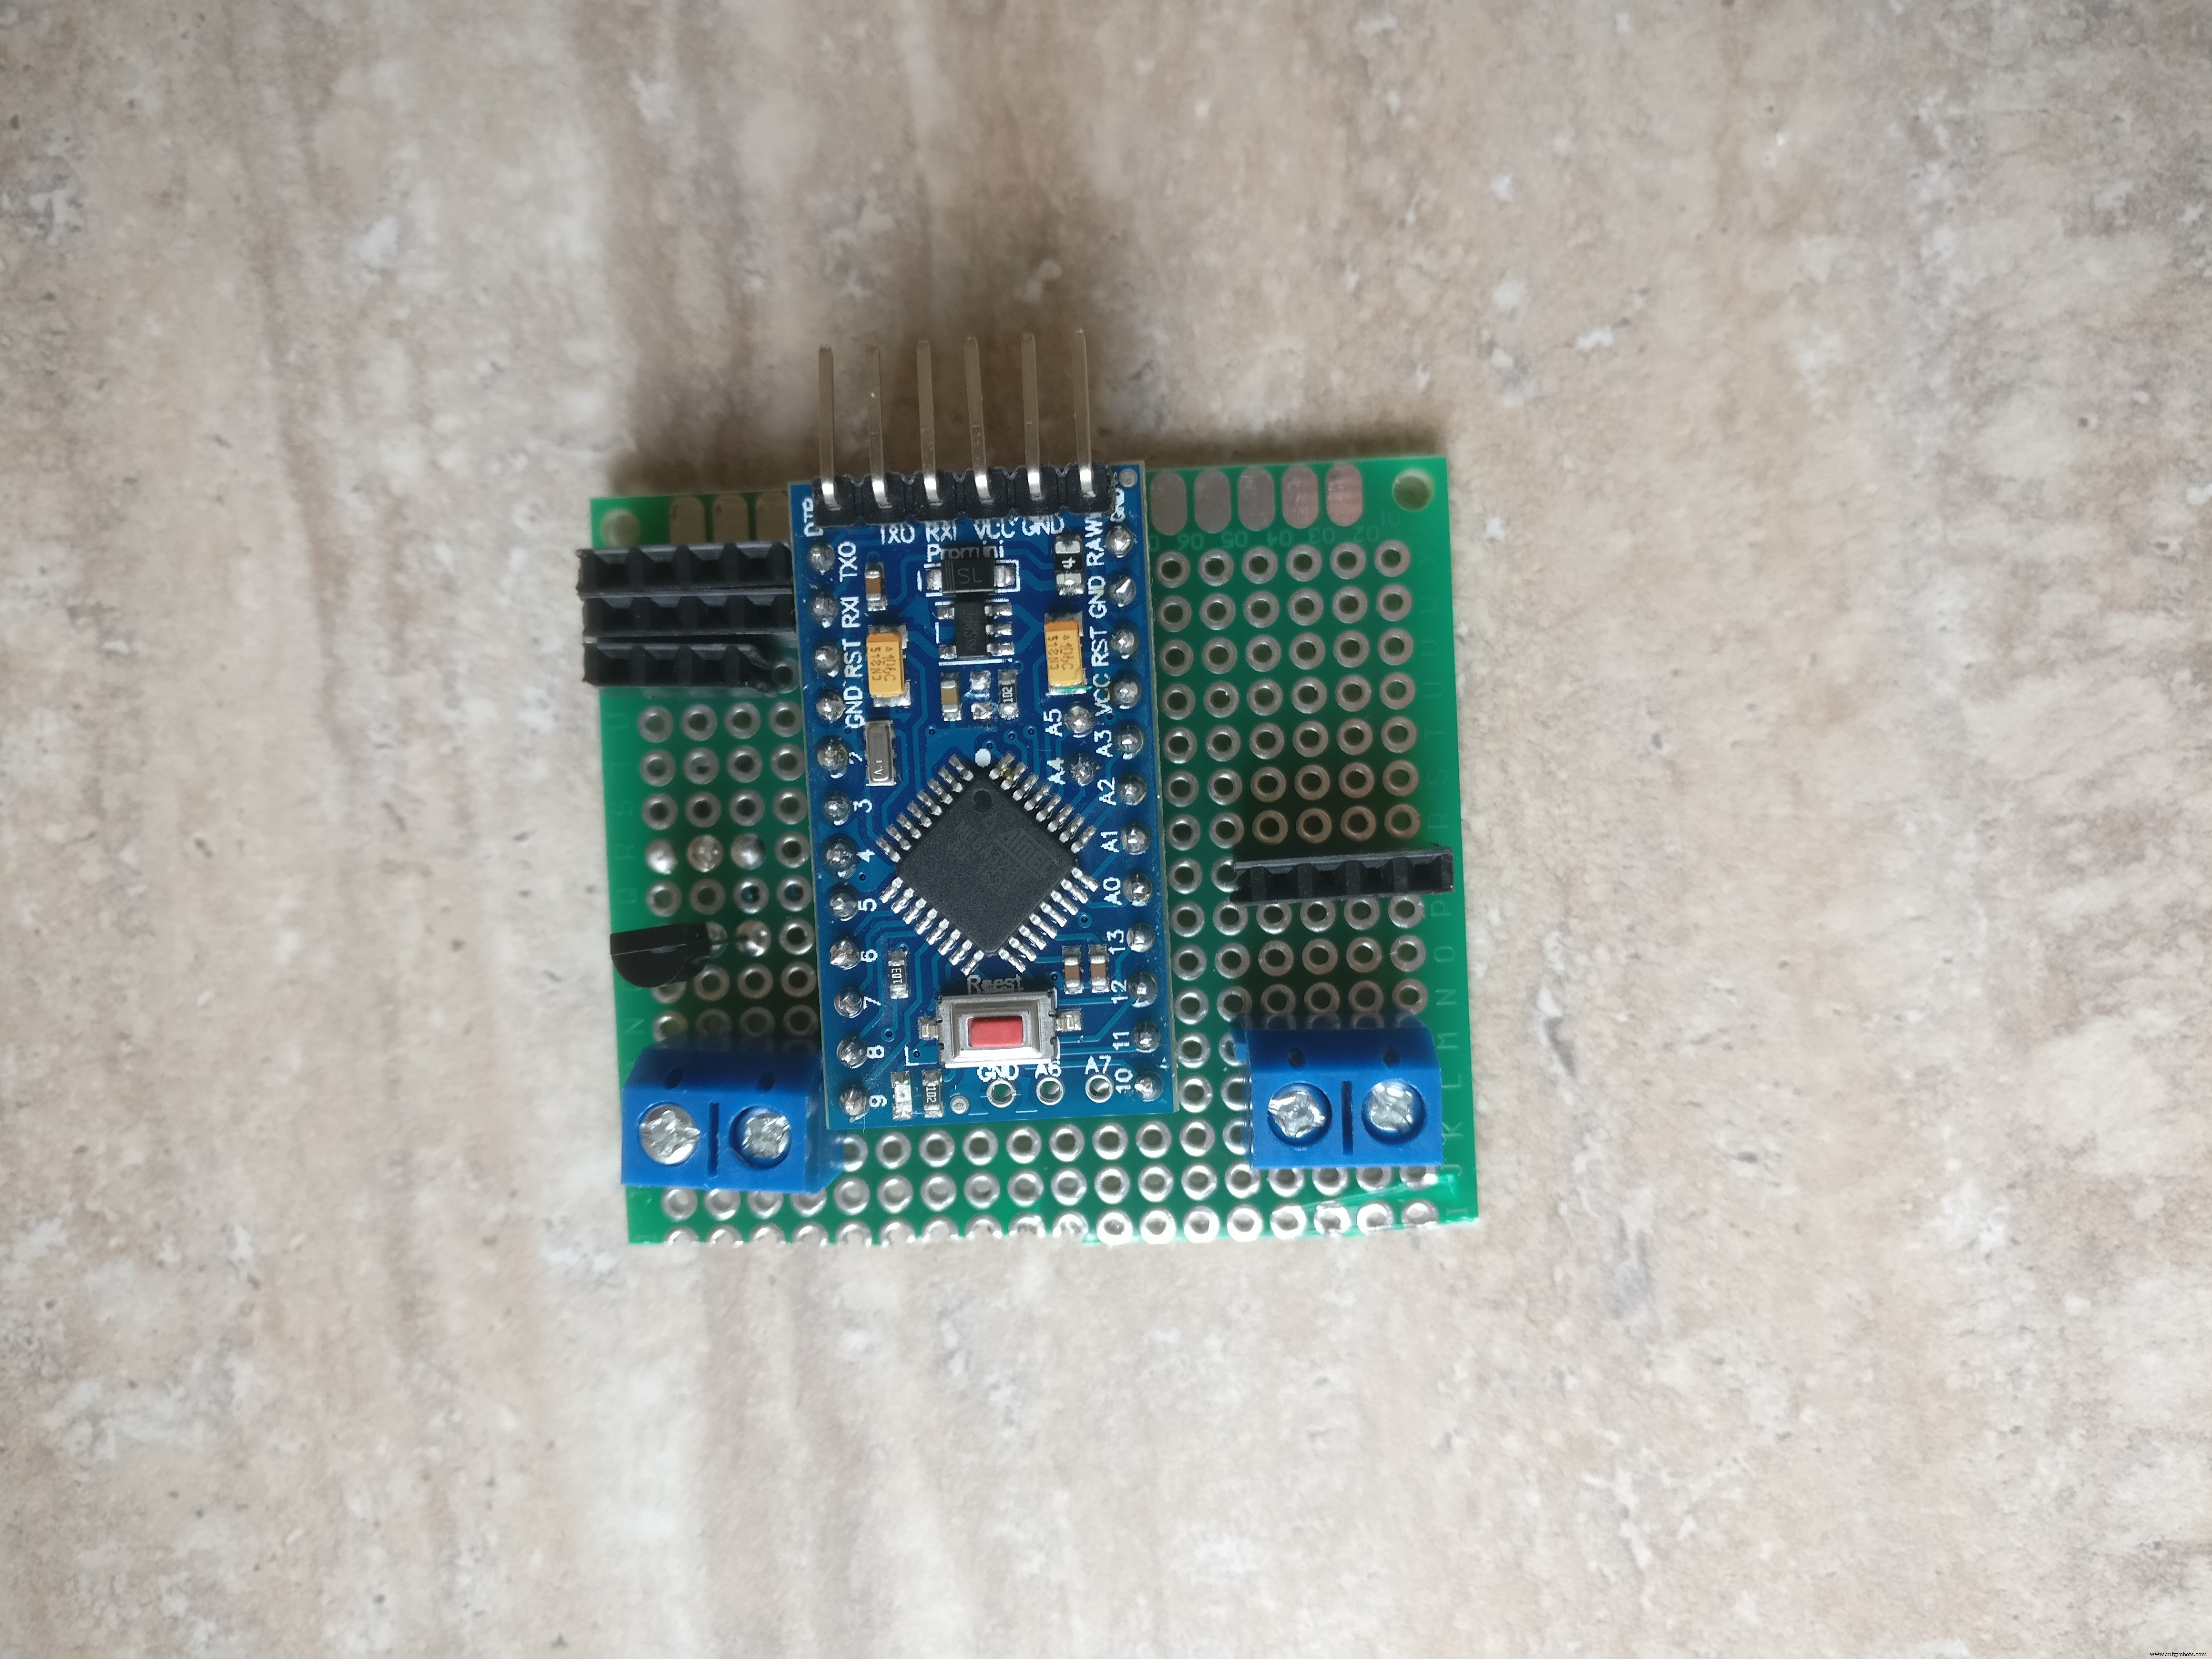
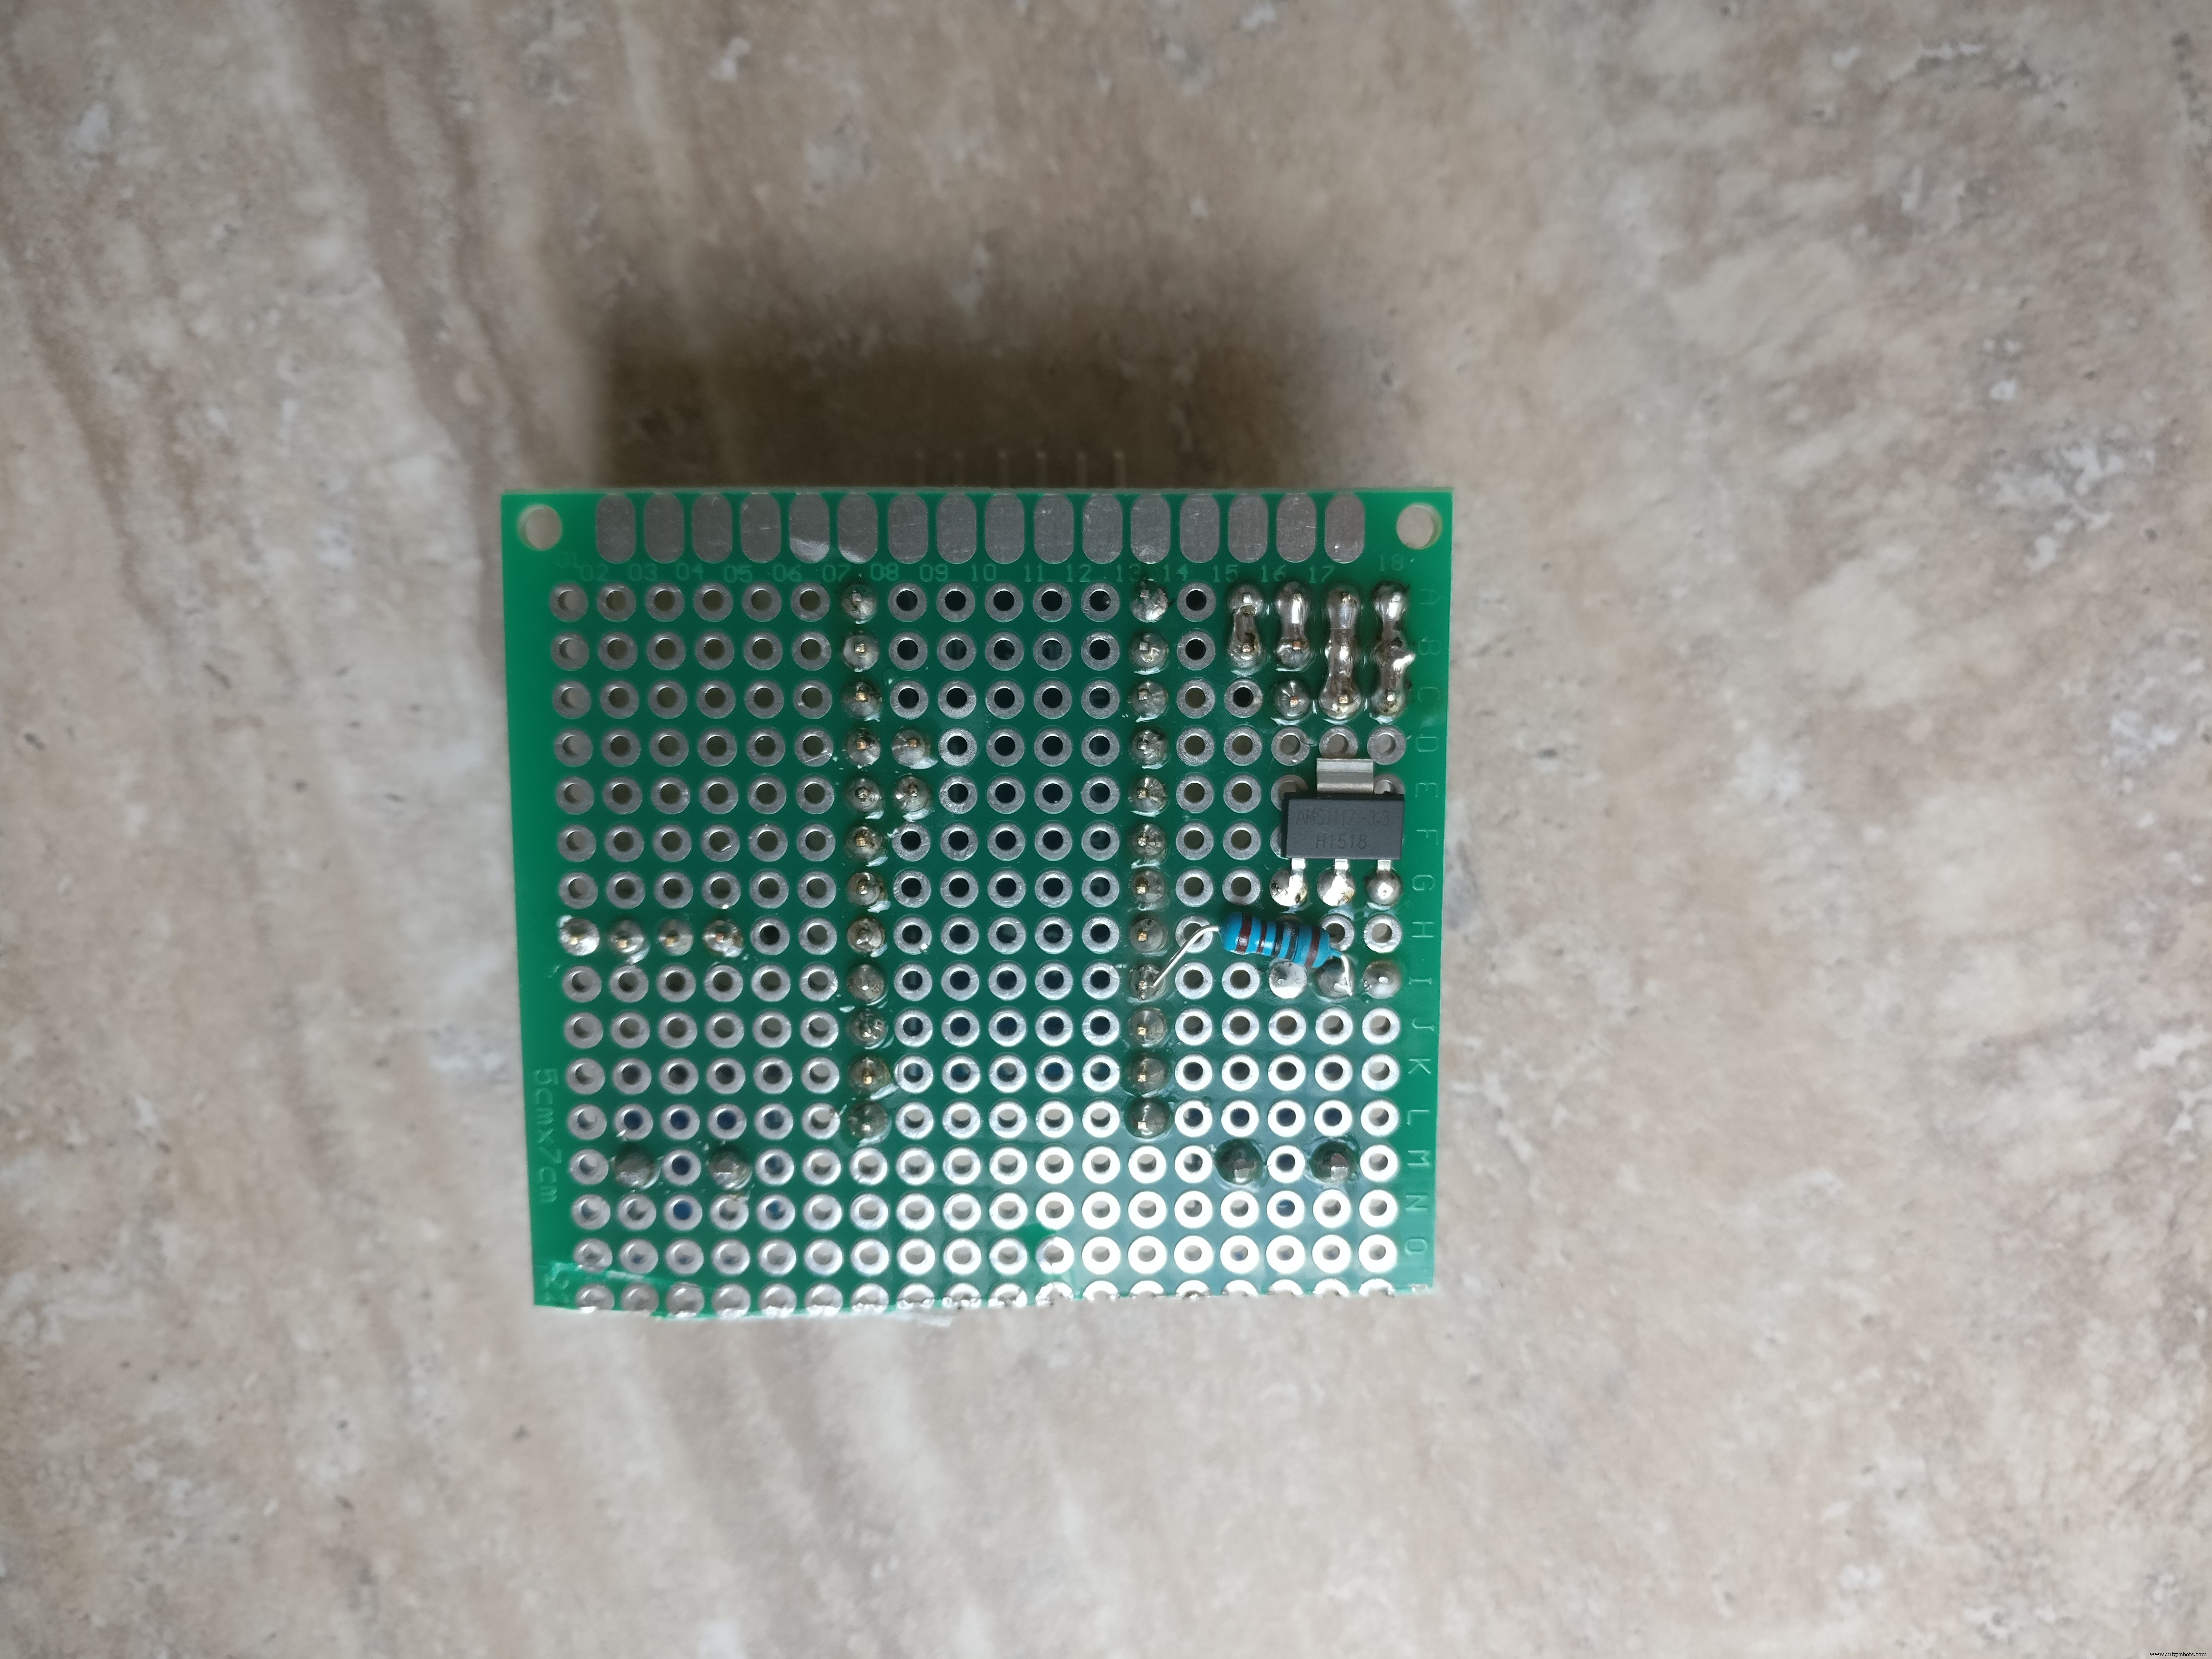
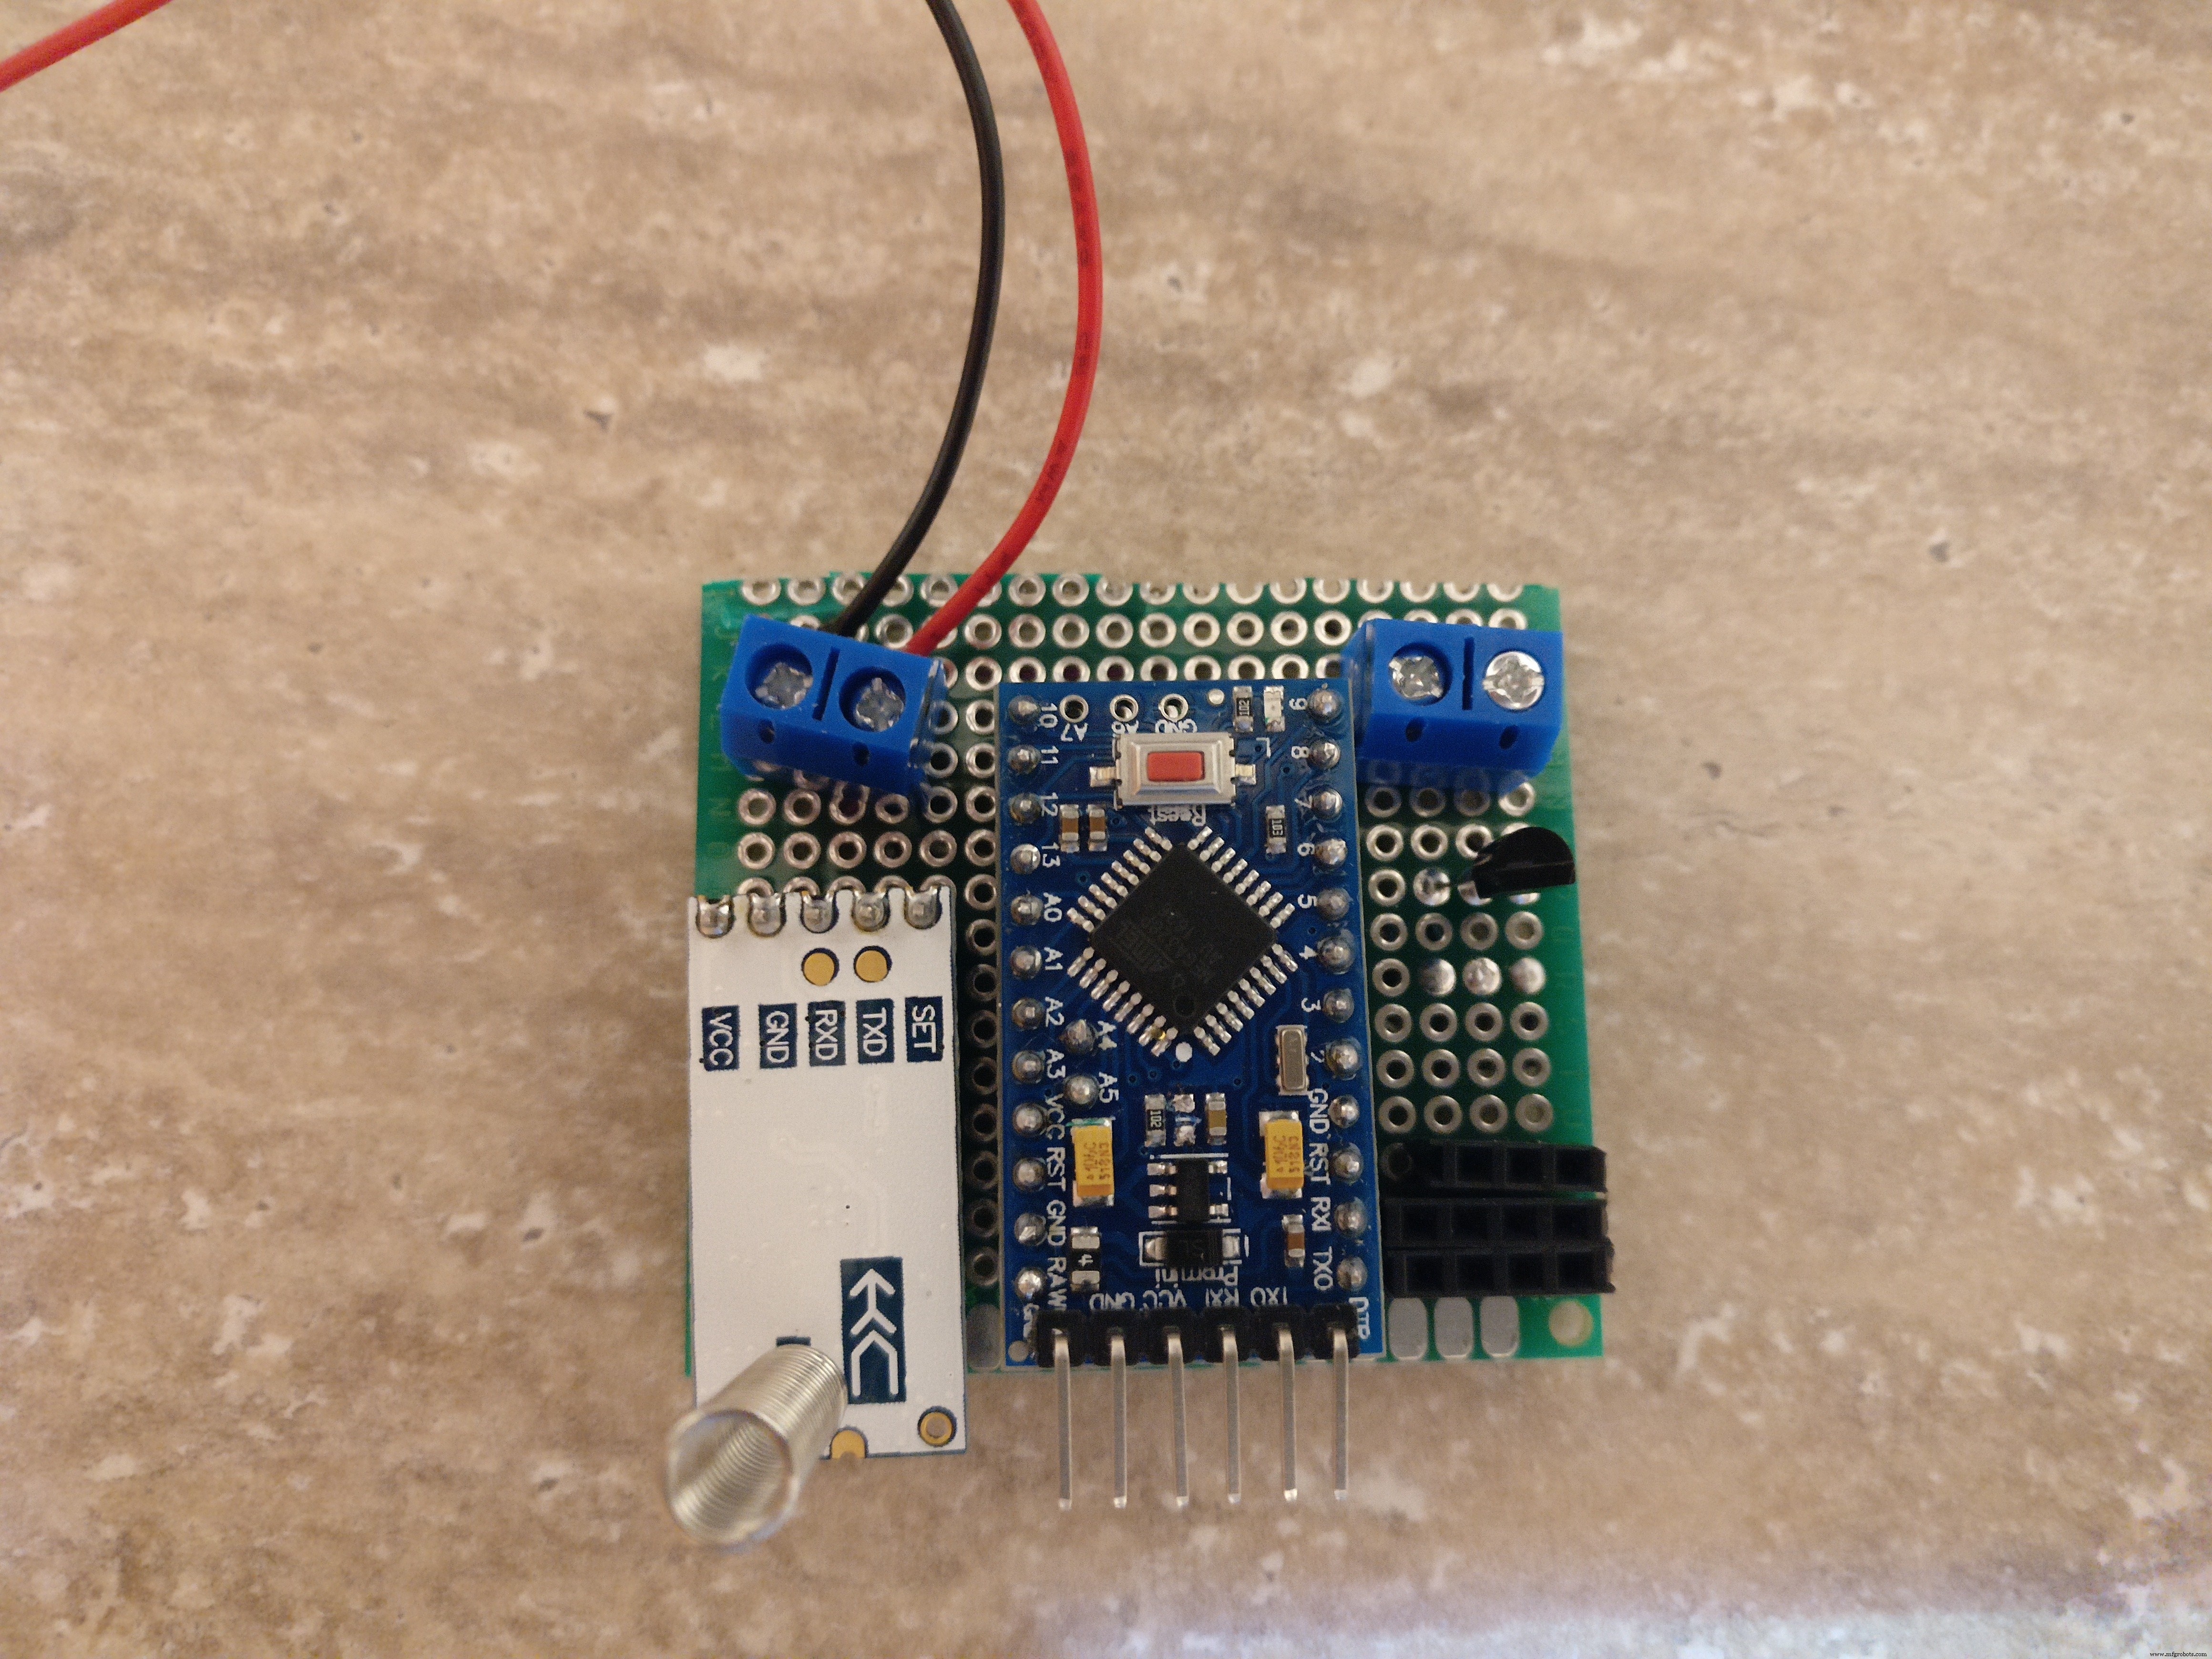
2. PCB将容纳arduino,HC-12,3.3V稳压器,二极管,晶体管,电阻器和两个KF301-2P
- 首先在 arduino 的 PCB 上焊接两个母 PCB 连接器,将公 PCB 连接器焊接到 arduino 并将 arduino 放在 PCB 上
- 应该移除 arduino LED 或至少其中一个引脚。这非常重要 因为led会消耗大量的电量。注意不要损坏其他组件
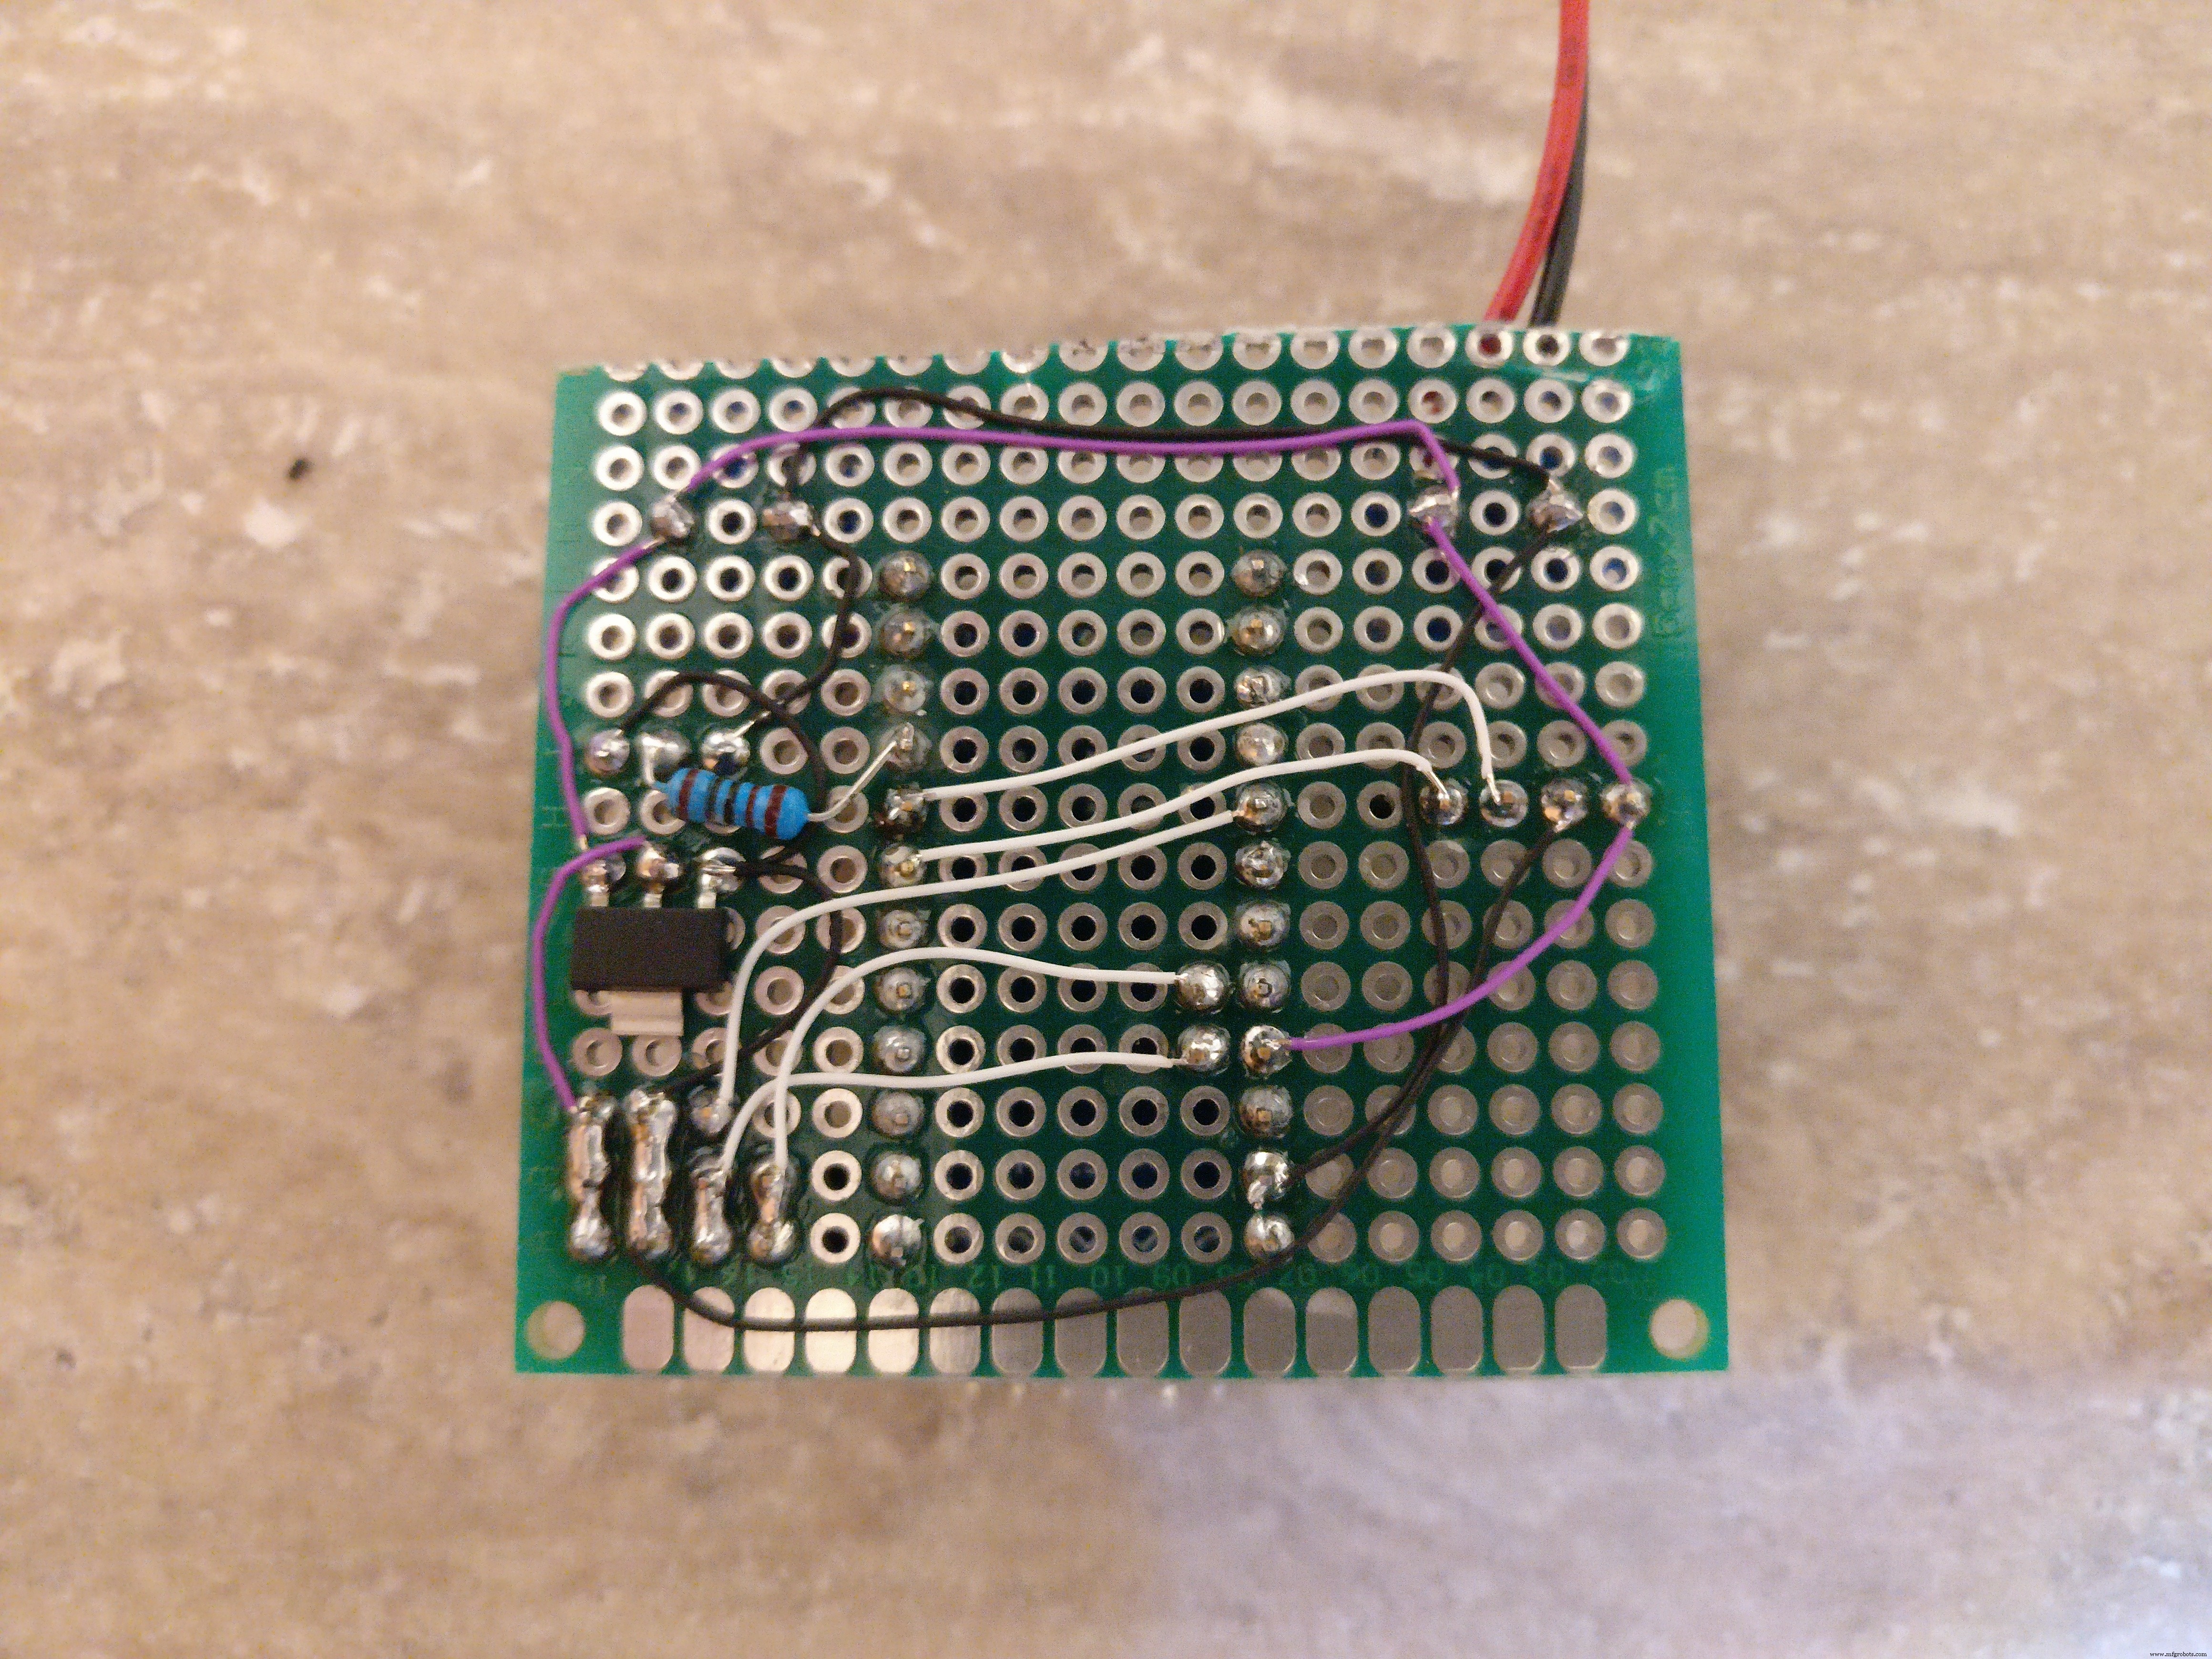
- 焊接晶体管、电阻器和 3.3V 稳压器
- 焊接两个 KF301-2P。一个用于太阳能电池板,另一个用于电池座
- 焊接三个母 PCB 连接器:用于光传感器、BME280 和雨量传感器
- 焊接小电线以连接所有 PCB 组件(检查图片和烧结示意图)
3. 将 3 节已充电的 AAA 镍氢电池放入支架内并将其放入盒子内,将电线连接到 KF301-2P 连接器
4. 将 BME280 和光传感器从盒子外部连接到相应的公连接器
对于雨量传感器,将三根电线(Gnd、Vcc、信号)焊接到它,并在另一侧焊接将进入盒子内部的公针与其相应的公连接器
最后一件事是将电台放置到它的最终位置。我选择了避雨避雪的位置。我为雨量传感器选择了更长的电线,并将其单独放置在雨中的稳定支架上。对于主盒子,我选择了一种特殊的带粘合剂的胶带(检查图片),但任何能固定盒子的东西都可以。
草图.fzz
第 3 步:Arduino 代码
在这一步中,您将了解需要哪些外部库,我们将概述代码及其工作原理,当然您可以下载它或将其复制粘贴到 Arduino IDE 中并上传到气象站。
气象站的作用是每 10 分钟向基站传输一次有关其传感器的数据。
首先让我们描述一下气象站程序的作用:
1. 读取传感器数据(湿度、温度、压力、降雨、光照、电压)
2. 通过第二条软件串行线传输编码数据。
编码后的数据如下所示:
H1:78|T1:12|PS1:1022|L1:500|R1:0|V1:4010| 上面的陈述意味着:“1”站的湿度为 78%,“1”站的温度为 12 度,压力为 1022 巴,光照度为 500 勒克斯,雨水为 0,电压为 4010 毫伏
3. 关闭辅助部件:传感器和通信设备
4. 将 arduino 置于睡眠模式 10 分钟(这将使其消耗更少的 50 微安)
5. 打开组件并重复步骤 1 - 4
这里有一点额外的调整,如果电压水平高于 4.2 V,arduino 将使用正常的睡眠功能“延迟(毫秒)”。这将大大增加功耗并迅速降低电压。这有效地防止了太阳能电池板对电池过度充电。
你可以从我的 Github 存储库中获取代码:https://github.com/danionescu0/home-automation/tre...
或者从下面复制粘贴它,无论哪种方式只需删除带有“transmitSenzorData("V",sensor.voltage);”的行
#include "LowPower.h"
#include "SoftwareSerial.h"#include "Wire.h"#include "Adafruit_Sensor.h"#include "Adafruit_BME280.h"#include "BH1750.h "SoftwareSerial serialComm(4, 5); // RX, TXAdafruit_BME280 bme; BH1750 lightMeter;const byterainPin =A0;bytesensorsCode =1;/** * 将微控制器置于深度睡眠而不是常规睡眠的电压电平 */int voltageDeepSleepThreshold =4200; const byte peripherialsPowerPin =6;char buffer[] ={' ',' ',' ',' ',' ',' ',' '};struct sensorData { 字节湿度;内部温度;字节雨;内部压力;长电压;内光; };sensorData 传感器;void setup() { Serial.begin(9600); serialComm.begin(9600); pinMode(peripheralsPowerPin, OUTPUT);数字写入(外设电源引脚,高);延迟(500); if (!bme.begin()) { Serial.println("找不到有效的 BME280 传感器,请检查接线!");而 (1) { customSleep(100); } } Serial.println("初始化成功");延迟(50); digitalWrite(peripherialsPowerPin, HIGH);}void loop() { updateSenzors();传输数据();自定义睡眠(75); }void updateSenzors() { bme.begin(); lightMeter.begin();延迟(300);传感器.温度 =bme.readTemperature(); sensor.pressure =bme.readPressure() / 100.0F;传感器.湿度 =bme.readHumidity(); sensor.light =lightMeter.readLightLevel();传感器.电压 =readVcc(); sensor.rain =readRain();}void transferData(){ emptyIncommingSerialBuffer(); Serial.print("Temp:");Serial.println(sensors.temperature); Serial.print("Humid:");Serial.println(传感器.湿度); Serial.print("压力:");Serial.println(sensors.pressure); Serial.print("Light:");Serial.println(sensors.light); Serial.print("Voltage:");Serial.println(sensors.电压); Serial.print("Rain:");Serial.println(sensors.rain);传输传感器数据(“T”,传感器。温度);传输传感器数据(“H”,传感器。湿度);传输传感器数据(“PS”,sensors.pressure);传输传感器数据(“L”,sensors.light);传输传感器数据(“V”,传感器。电压);传输传感器数据(“R”,sensors.rain);}void emptyIncommingSerialBuffer(){ while (serialComm.available()> 0) { serialComm.read();延迟(5); }}void transferSenzorData(String type, int value){ serialComm.print(type); serialComm.print(sensorsCode); serialComm.print(":"); serialComm.print(value); serialComm.print("|"); delay(50);}void customSleep(long8SecondCycles){ if (sensors.voltage> voltageDeepSleepThreshold) { delay(eightSecondCycles * 8000);返回;数字写入(外围电源引脚,低); for (int i =0; i <八秒周期; i++) { LowPower.powerDown(SLEEP_8S, ADC_OFF, BOD_OFF);数字写入(外围电源引脚,高); delay(500);}byte readRain(){ byte level =analogRead(rainPin);返回地图(级别, 0, 1023, 0, 100); }long readVcc() { // 读取 1.1V 参考 AVcc // 将参考设置为 Vcc 并将测量设置为内部 1.1V 参考 #if defined(__AVR_ATmega32U4__) ||定义(__AVR_ATmega1280__) ||定义(__AVR_ATmega2560__) ADMUX =_BV(REFS0) | _BV(MUX4) | _BV(MUX3) | _BV(MUX2) | _BV(MUX1); #elif 定义 (__AVR_ATtiny24__) ||已定义(__AVR_ATtiny44__) ||定义(__AVR_ATtiny84__) ADMUX =_BV(MUX5) | _BV(MUX0); #elif 定义 (__AVR_ATtiny25__) ||已定义(__AVR_ATtiny45__) ||定义(__AVR_ATtiny85__) ADMUX =_BV(MUX3) | _BV(MUX2); #else ADMUX =_BV(REFS0) | _BV(MUX3) | _BV(MUX2) | _BV(MUX1); #endif 延迟(2); // 等待 Vref 稳定 ADCSRA |=_BV(ADSC); // 开始转换 while (bit_is_set(ADCSRA,ADSC)); // 测量 uint8_t 低 =ADCL; // 必须先读取 ADCL - 然后锁定 ADCH uint8_t high =ADCH; // 解锁两个 long result =(high<<8) |低的;结果 =1125300L / 结果; // 计算 Vcc(以 mV 为单位); 1125300 =1.1*1023*1000 返回结果; // 以毫伏为单位的 Vcc}
在上传代码之前,请下载并安装以下 arduino 库:
* BH1750 库:https://github.com/claws/BH1750 * LowPower 库:https://github.com/rocketscream/Low-Power
* Adafruit 传感器库:https://github.com/adafruit/Adafruit_Sensor
* Adafruit BME280 库:https://github.com/adafruit/Adafruit_Sensor
如果您不知道该怎么做,请查看本教程。
第四步:准备基站
基站将包括一台 linux 计算机 (台式机、笔记本电脑或开发板)带有 HC-12 USB 附模块。计算机必须保持开启状态,每 10 分钟从站收集一次数据。
我在 Ubuntu 18 上使用了我的笔记本电脑。
安装步骤:
1. 安装蟒蛇。 Anaconda 是一个 Python 包管理器,它使我们可以轻松地使用相同的依赖项。我们将能够控制Python版本,以及每个包的版本
如果您不知道如何安装,请查看:https://www.digitalocean.com/community/tutorials/h...教程并按照步骤 1 - 8
2. 安装 mongodb。 MongoDb 将是我们这个项目的主要数据库。它将存储有关所有传感器时间序列的数据。它是无模式的,就我们的目的而言,它易于使用。
有关安装步骤,请查看他们的页面:https://docs.mongodb.com/v3.4/tutorial/install-mon...
我使用了旧版本的 mongoDb 3.4.6,如果您按照上面的教程进行操作,您将完全了解。原则上它应该适用于最新版本。
[可选] 在日期字段上添加索引:
猫鼬天气 db.weather_station.createIndex({"date" :1}) 3. 从这里下载项目:https://github.com/danionescu0/home-automation。我们将使用天气预测文件夹
sudo apt-get install gitgit clone https://github.com/danionescu0/home-automation.gi... 4. 创建和配置anaconda环境:
cd weather-predict # 使用 python 3.6.2conda 创建名为“weather”的 anaconda 环境 create --name weather python=3.6.2 # activate environmentconda activate weather# 安装所有包 pip install -r requirements.txt
这将创建一个新的 anaconda 环境并安装所需的包。一些包是:
Keras(高级神经网络层,我们将使用这个库进行所有神经网络预测)
pandas(操作数据的有用工具,我们会大量使用)
pymongo(python mongoDb 驱动程序)
sklearn(数据挖掘和数据分析工具)
配置项目
配置文件位于 weather-predict 文件夹中,名为 config.py
1.如果您远程安装MongoDb或在不同的端口上更改
中的“主机”或“端口” mongodb ={ 'host':'localhost', 'port':27017}...
2. 现在我们需要连接 HC-12 USB 串行适配器。运行前:
ls -l /dev/tty*
你应该得到一个已安装设备的列表。
现在将 HC-12 插入 USB 端口并再次运行相同的命令。它应该是该列表中的一个新条目,即我们的串行适配器。如有必要,现在更改配置中的适配器端口
serial ={ 'port':'/dev/ttyUSB0', 'baud_rate':9600}
其他配置项是一些文件默认路径,无需更改。
第 5 步:在实践中使用气象站 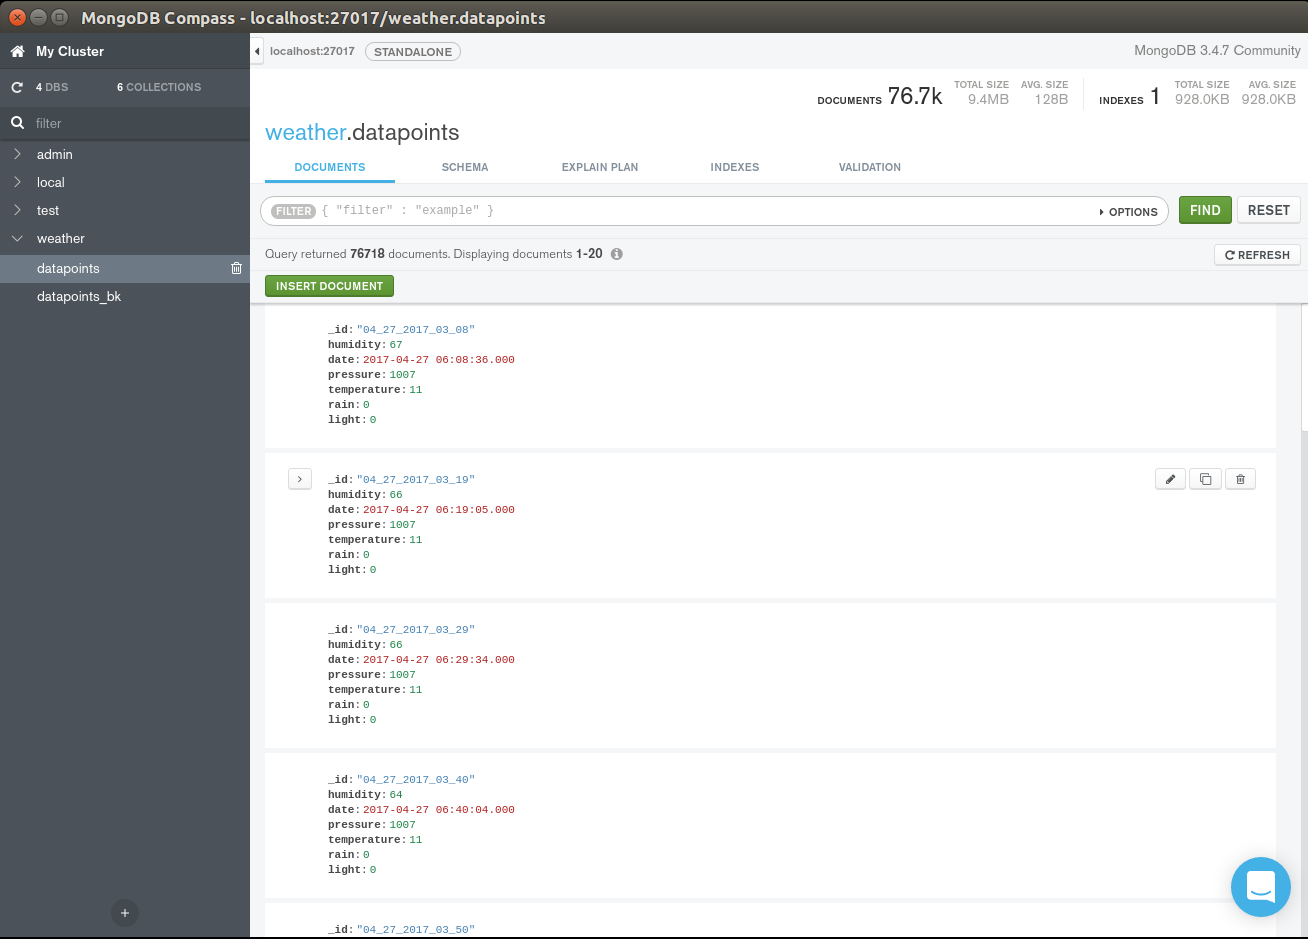
在这里,我们将讨论有关导入我的测试数据、对其运行一些测试、设置您自己的数据、显示一些图表以及设置带有未来几个小时预测的电子邮件的基本内容。
如果您想详细了解它是如何工作的,请查看下一步“它是如何工作的”
导入我已经收集的数据
MongoDb 自带 cli 命令,用于从 json 导入数据:
mongoimport -d weather -c weather_station --file sample_data/weather_station.json
这会将文件从样本数据导入“天气”数据库和“数据点”集合
警告 在这里,如果您使用我收集的数据,并将其与新的本地数据相结合,由于硬件(传感器)和本地天气模式的细微差异,准确性可能会下降。
收集新数据
基站的作用之一是将来自气象站的传入数据存储到数据库中以供以后处理。要启动侦听串行端口并存储在数据库中的进程,只需运行:
conda activate weatherpython serial_listener.py# 每 10 分钟你应该看到来自气象站的数据:[Sensor:type(temperature), value(14.3)][Sensor:type(pressure), value( 1056.0)]...
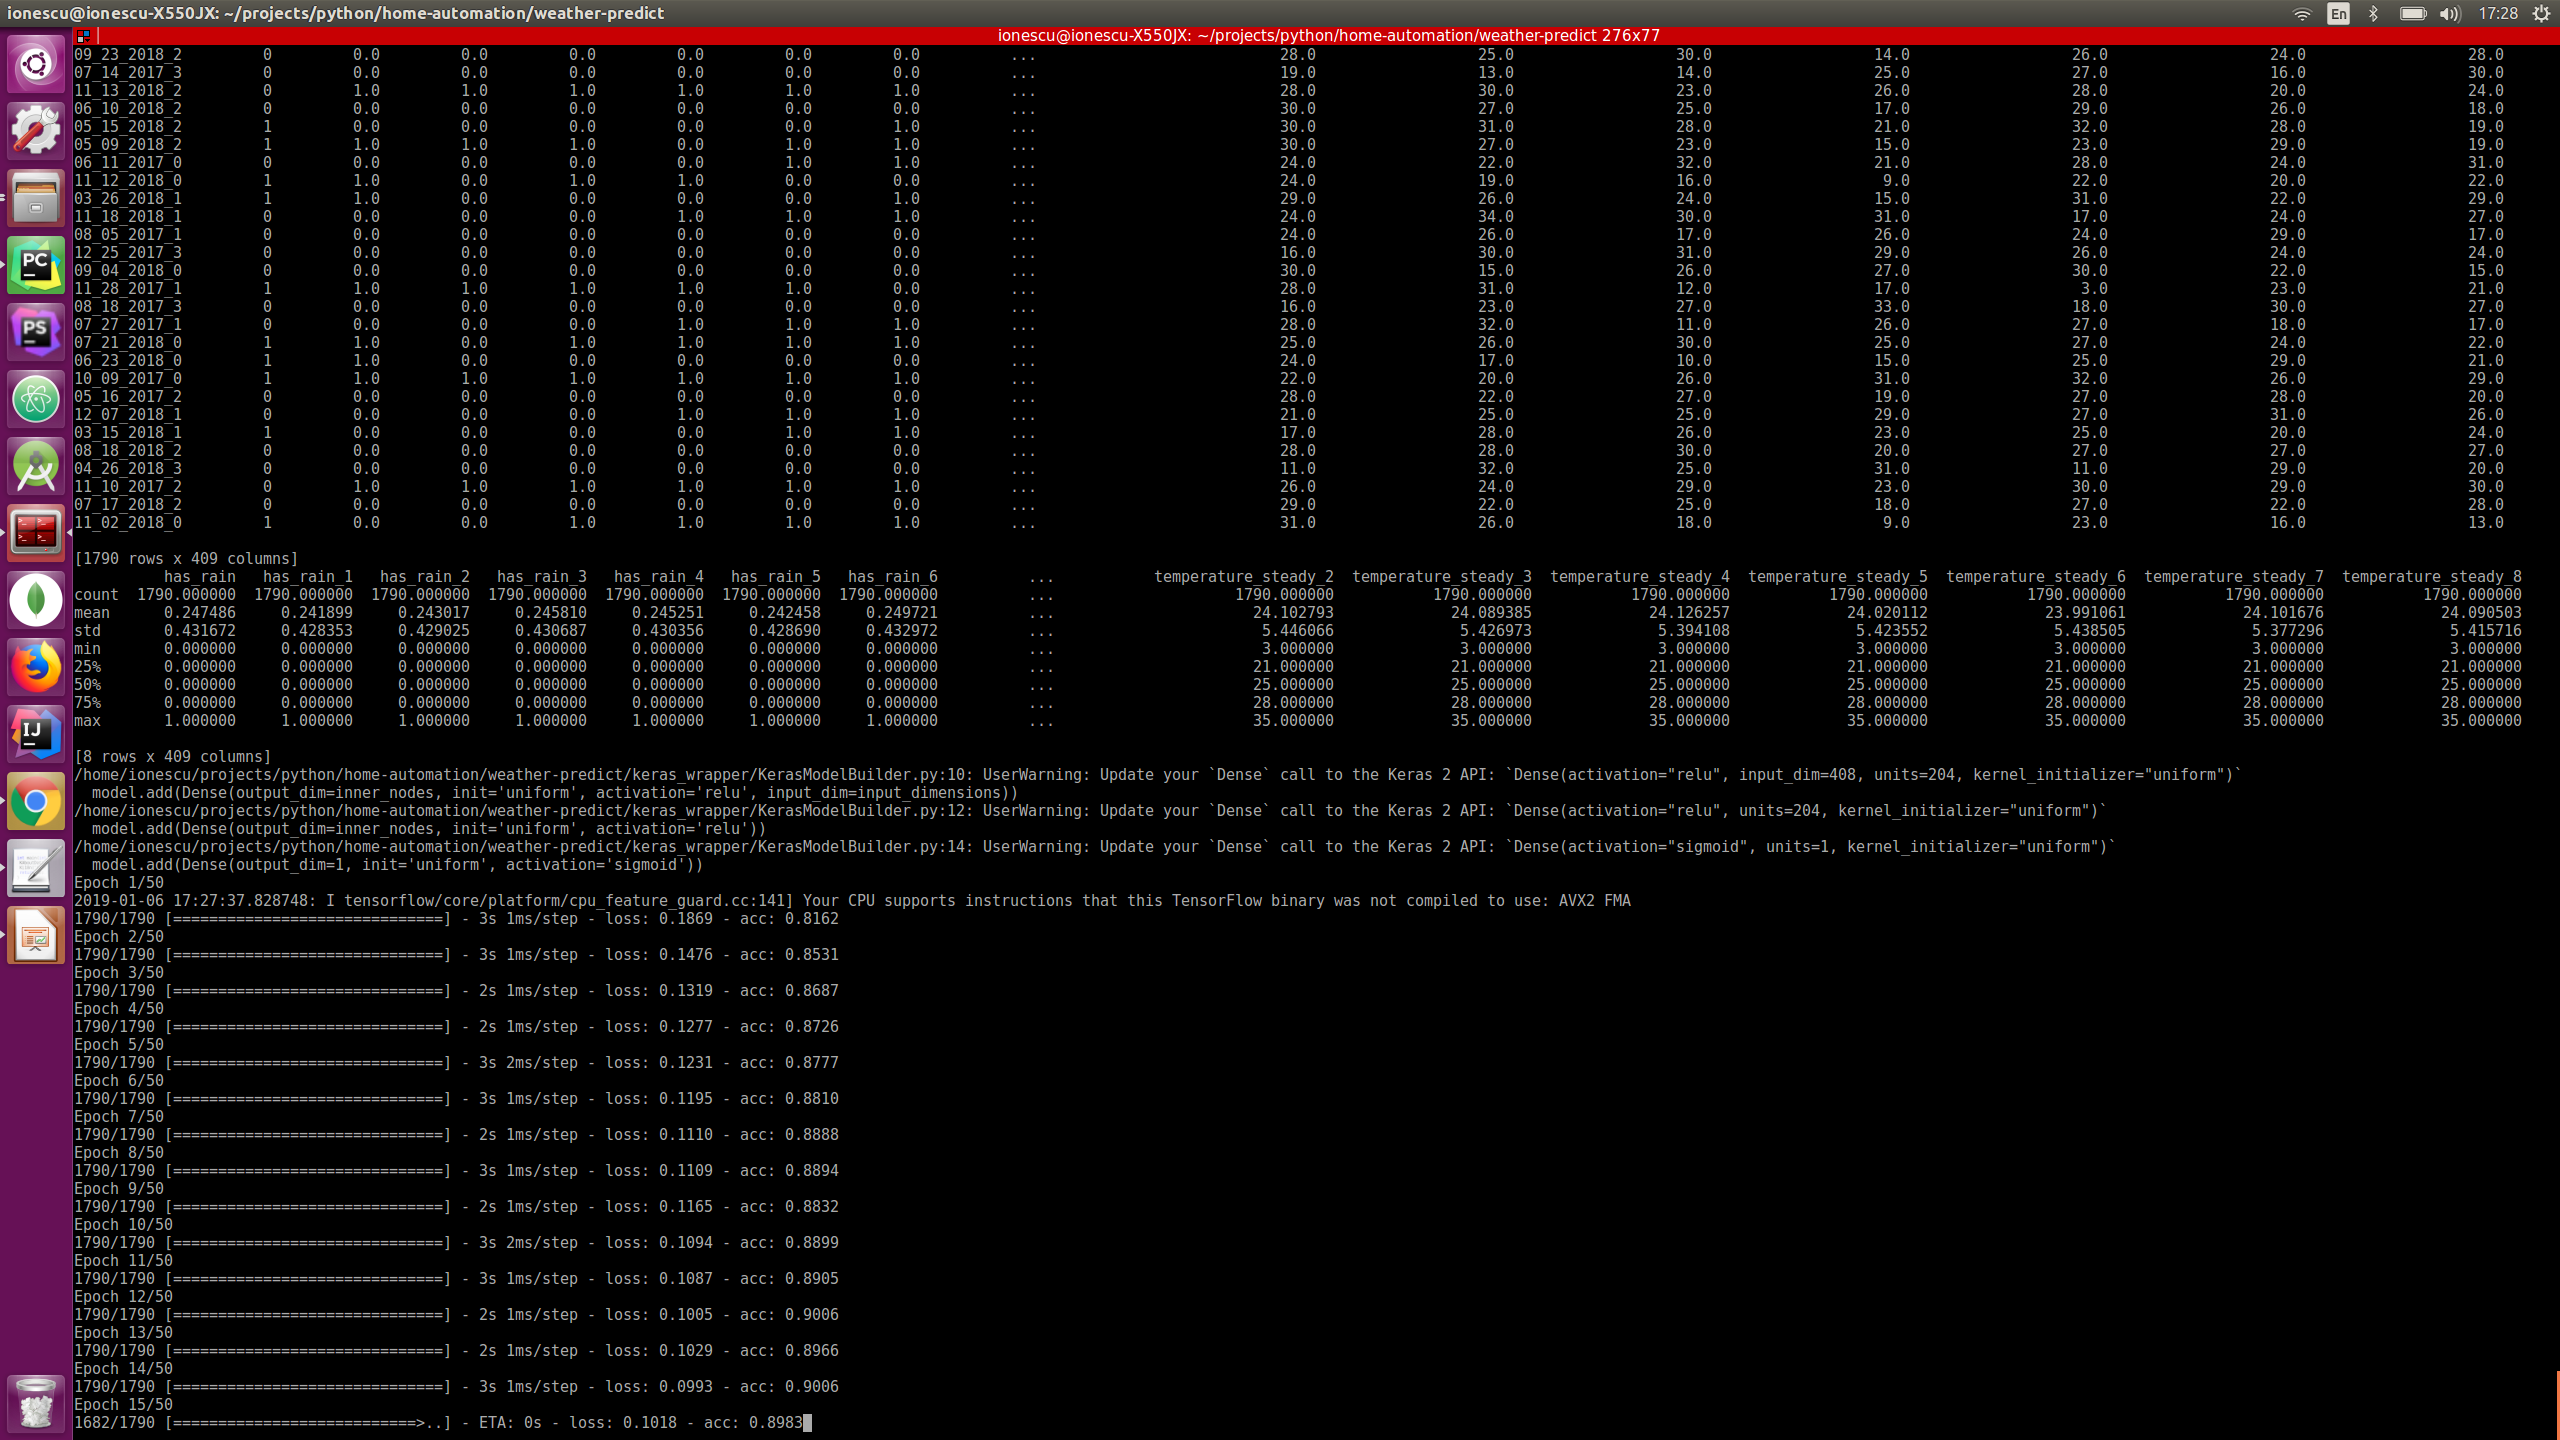
生成预测模型
我假设您已导入我的数据或“运行脚本几年”来收集您的个性化数据,因此在这一步中,我们将处理数据以创建用于预测未来降雨的模型。
conda activate weatherpython train.py --days_behind 600 --test-file-percent 10 --datapoints-behind 8 --hour-granularity 6
* 第一个参数 --days_behind 表示脚本应该处理多少过去的数据。以天为单位
* --test-file-percent 表示应该考虑多少数据用于测试目的,这是机器学习算法中的常规步骤
* --hour-granularity 基本上意味着我们想要预测的未来几个小时
* --datapoints-behind 这个参数将在下一节进一步讨论
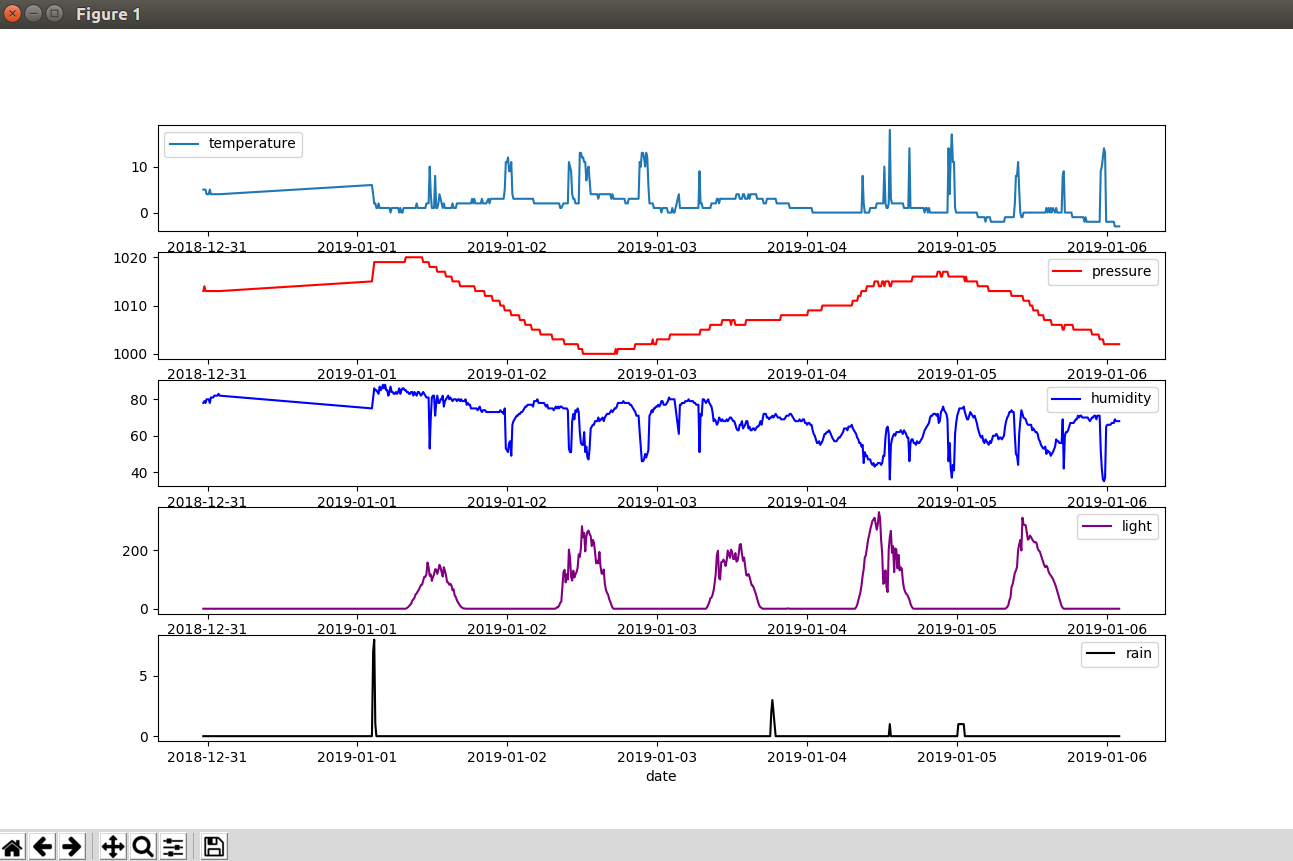
查看一些带有所有气象站传感器的数据图表
假设过去 10 天:
conda 激活天气 python 图表 --days-behind 10
预测下一个时期是否会下雨
我们会预测是否会下雨并发送通知电子邮件
conda 激活天气 python predict.py --datapoints-behind 8 --hour-granularity 6 --from-addr a_gmail_address --from-password gmail_password --to-addr a_email_destination
对测试数据运行批量预测:
python predict_batch.py -f sample_data/test_data.csv
使用与上面训练脚本中相同的参数很重要。
要使电子邮件通知生效,请登录您的 Gmail 帐户并将允许安全性较低的应用程序设置为 ON。请注意,这会让其他人更容易访问您的帐户。
您需要两个电子邮件地址,一个启用了上述选项的 Gmail 地址,以及一个用于接收通知的其他地址。
如果你喜欢每小时收到通知,把脚本放到crontab中
要了解所有这些是如何实现的,请检查下一步
第 6 步:它是如何工作的
在这最后一步中,我们将讨论该项目架构的几个方面:
1. 项目概述,我们将讨论涉及的一般架构和技术
2. 机器学习的基本概念
3. 数据是如何准备的(最重要的一步)
4. 实际的神经网络包装器 API 是如何工作的(Keras)
5. 未来改进
我将尝试在此处提供一些代码示例,但请记住,它不是 100% 来自项目的代码。在项目中它是自己的代码,它的类和结构稍微复杂一些
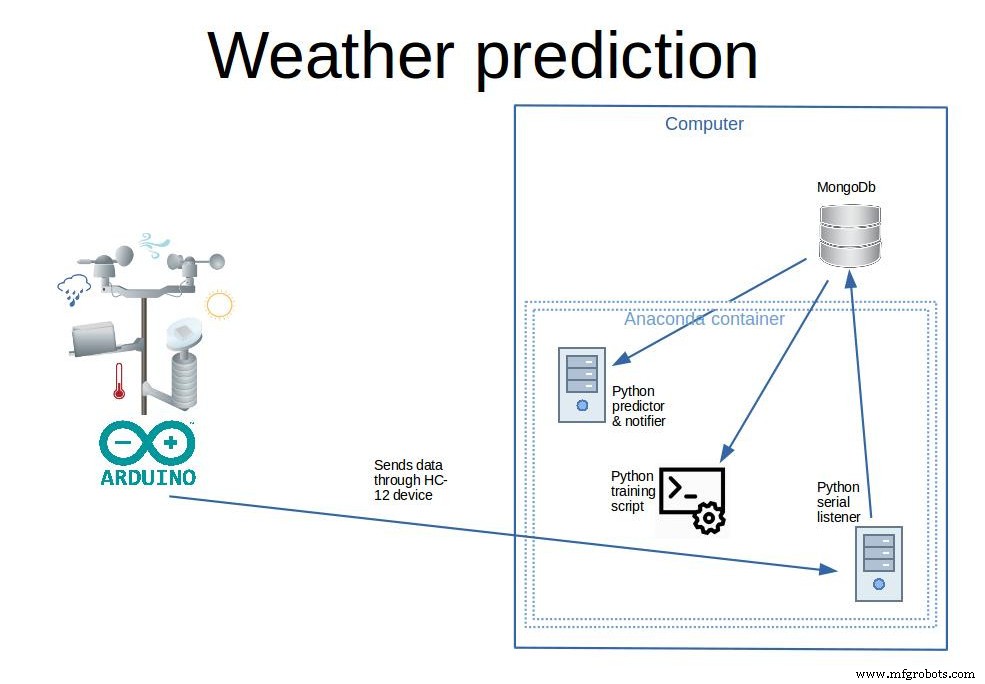
1.项目概述,我们将讨论一般架构和涉及的技术
正如我们之前所说,该项目有两个独立的部分。气象站是它自己的唯一功能是收集和传输数据。以及进行所有采集训练和预测的基站。
分离的优点 气象站和基站:
- 电力要求,如果气象站也能够处理数据,则需要大量电力,可能是大型太阳能电池板或永久性电源
- 便携性,由于体积小,气象站可以从几百米外收集数据,如果需要,您可以轻松改变它的位置
- 可扩展性,您可以通过建立多个气象站并将它们分布在数百米范围内来提高预测准确性
- 成本低,因为它是一种便宜的设备,您可以轻松构建另一个设备,以防万一丢失或被盗
数据库选择 .我选择 mongoDb 是因为它有很好的特性:无模式、免费且易于使用的 API
每次接收到传感器数据时,数据都会保存在数据库中,数据条目如下所示:
{“_id”:“04_27_2017_06_17”,“湿度”:65,“日期”:ISODate(“2017-04-27T06:17:18Z”),“压力”:1007,“温度”: 9、“雨”:0、“光”:15}
数据库以 BSON 格式(类似于 JSON)存储数据,因此易于阅读和使用。我已经在一个标识符下聚合了数据,该标识符包含格式为字符串的日期到分钟,所以这里最小的分组是一分钟。
气象站(正常工作时)将每 10 分钟传输一个数据点。数据点是“日期”、“湿度”、“压力”、“温度”、“降雨”和“光照”值的集合。
数据处理和神经网络 技术选择
我选择 Python 作为后端是因为在 Python 中发现了神经网络的许多主要创新。拥有大量 Github 存储库、教程博客和书籍的不断壮大的社区随时为您提供帮助。
* 对于数据处理部分,我使用了 Pandas (https://pandas.pydata.org/ ) . Pandas 使处理数据变得容易。您可以从 CSV、Excel、Python 数据结构中加载表格并对其重新排序、删除列、添加列、按列索引以及许多其他转换。
* 为了使用神经网络,我选择了 Keras (https://keras.io/)。 Keras 是一种高级神经网络包装器,它覆盖了更底层 API 的(如 Tensorflow),并且可以用十几行代码构建一个多层神经网络。这是一个很大的优势,因为我们可以在其他人的伟大工作的基础上构建一些有用的东西。嗯,这是编程的基本内容,以其他较小的构建块为基础。
2. 机器学习的基本概念
本教程的范围不是教授机器学习,而只是概述其中一个可能的用例以及我们如何将其实际应用到这个用例中。
神经网络是类似于称为神经元的脑细胞的数据结构。科学发现大脑具有称为神经元的特殊细胞,它们通过称为轴突的“线”通过电脉冲与其他神经元进行通信。如果受到足够的刺激(来自许多其他神经元),神经元将在这个“网络”中触发更远的电脉冲,刺激其他神经元。这当然是对过程的过度简化,但基本上计算机算法试图复制这个生物过程。
在计算机神经网络中,每个神经元都有一个“触发点”,如果在该点上受到刺激,它将向前传播刺激,否则不会。为此,每个模拟神经元都有一个偏差,每个轴突都有一个权重。在对这些值进行随机初始化后,一个称为“学习”的过程开始,这意味着在循环中,算法将执行以下步骤:
- 刺激输入神经元
- 通过网络层传播信号直到输出神经元
- 读取输出神经元并将结果与所需结果进行比较
- 调整轴突的权重以获得更好的结果
- 重新开始直到达到循环次数
如果您想了解有关此过程的更多详细信息,可以查看这篇文章:https://mattmazur.com/2015/03/17/a-step-by-step-ba .... 还有许多书籍和教程。
还有一件事,在这里我们将使用监督学习方法。这意味着我们还将教授算法输入和输出,以便给定一组新的输入,它可以预测输出。
3.数据是如何准备的(最重要的一步)
在许多机器学习和神经网络问题中,数据准备是一个非常重要的部分,它将涵盖:
- 获取原始数据
- 数据清理:这意味着删除孤立值、畸变或其他异常
- 数据分组:获取许多数据点并转换为聚合数据点
- 数据增强:添加从自己的数据或外部来源获得的数据的其他方面
- 拆分训练数据和测试数据
- 将每个训练和测试数据拆分为输入和输出。通常一个问题会有很多输入和一些输出
- 重新调整数据,使其介于 0 和 1 之间(这将有助于网络消除高/低值偏差)
获取原始数据
在我们的例子中,在 python 中获取 MongoDb 的数据非常容易。鉴于我们的数据点集合,这行代码就可以了
client =MongoClient(host, port).weather.datapoints cursor =client.find( {'$and' :[ {'date' :{'$gte' :start_date}}, {'date' :{'$lte' :end_date}} ]} )data =list(cursor)..
数据清理
数据框中的空值被丢弃
dataframe =dataframe.dropna()
数据分组和数据增强
This is a very important step, the many small datapoins will be grouped into intervals of 6 hours. For each group several metrics will be calculated on each of the sensors (humidity, rain, temperature, light, pressure)
- min value
- max value
- mean
- 70, 90, 30, 10 percentiles
- nr of times there has been a rise in a sensor
- nr of times there has been a fall in a sensor
- nr of times there has been steady values in a sensor
All of these things will give the network information for a datapoint, so for each of the 6 hours intervals these things will be known.
From a dataframe that looks like this:
_id date humidity light pressure rain temperature 04_27_2017_03_08 2017-04-27 03:08:36 67.0 0.0 1007.0 0.0 11.004_27_2017_03_19 2017-04-27 03:19:05 66.0 0.0 1007.0 0.0 11.004_27_2017_03_29 2017-04-27 03:29:34 66.0 0.0 1007.0 0.0 11.0
And the transformation will be:"
_id date humidity_10percentile humidity_30percentile humidity_70percentile humidity_90percentile humidity_avg ... temperature_avg temperature_fall temperature_max temperature_min temperature_rise temperature_steady ... 04_27_2017_0 2017-04-27 03:08:36 59.6 60.8 63.2 66.0 62.294118 ... 10.058824 2 11.0 9.0 1 1404_27_2017_1 2017-04-27 06:06:50 40.3 42.0 60.0 62.0 50.735294 ... 14.647059 3 26.0 9.0 11 2004_27_2017_2 2017-04-27 12:00:59 36.0 37.0 39.8 42.0 38.314286 ... 22.114286 1 24.0 20.0 5 29
After this a new column named "has_rain" will be added. This will be the output (our predicted variable). Has rain will be 0 or 1 depending if the rain average is above a threshold (0.1). With pandas it's as simple as:
dataframe.insert(loc=1, column='has_rain', value=numpy.where(dataframe['rain_avg']> 0.1, 1, 0))
Data cleanup (again)
- we'll drop the date column because it's no use to us, and also remove datapoints where the minimum temperature is below 0 because our weather station it doesn't have a snow sensor, so we won't be able to measure if it snowed
dataframe =dataframe.drop(['date'], axis=1)dataframe =dataframe[dataframe['temperature_min']>=0]
Data enhancing
Because data in the past might influence our prediction of the rain, we need for each of the dataframe rows to add columns reference to the past rows. This is because each of the row will serve as a training point, and if we want the prediction of the rain to take into account previous datapoints that's exactly what we should do:add more columns for datapoints in the past ex:
_id has_rain humidity_10percentile humidity_30percentile humidity_70percentile humidity_90percentile ... temperature_steady_4 temperature_steady_5 temperature_steady_6 temperature_steady_7 temperature_steady_8 ... 04_27_2017_3 0 36.0 44.8 61.0 63.0 ... NaN NaN NaN NaN NaN04_28_2017_0 0 68.0 70.0 74.0 75.0 ... 14.0 NaN NaN NaN NaN04_28_2017_1 0 40.0 45.0 63.2 69.0 ... 20.0 14.0 NaN NaN NaN04_28_2017_2 0 34.0 35.9 40.0 41.0 ... 29.0 20.0 14.0 NaN NaN04_28_2017_3 0 36.1 40.6 52.0 54.0 ... 19.0 29.0 20.0 14.0 NaN04_29_2017_0 0 52.0 54.0 56.0 58.0 ... 26.0 19.0 29.0 20.0 14.004_29_2017_1 0 39.4 43.2 54.6 57.0 ... 18.0 26.0 19.0 29.0 20.004_29_2017_2 1 41.0 42.0 44.2 47.0 ... 28.0 18.0 26.0 19.0 29.0
So you see that for every sensor let's say temperature the following rows will be added:"temperature_1", "temperature_2".. meaning temperature on the previous datapoint, temperature on the previous two datapoints etc. I've experimented with this and I found that a optimum number for our 6 hour groupings in 8. That means 8 datapoints in the past (48 hours). So our network learned the best from datapoins spanning 48 hours in the past.
Data cleanup (again)
As you see, the first few columns has "NaN" values because there is nothing in front of them so they should be removed because they are incomplete.
Also data about current datapoint should be dropped, the only exception is "has_rain". the idea is that the system should be able to predict "has_rain" without knowing anything but previous data.
Splitting the data in train and test data
This is very easy due to Sklearn package:
from sklearn.model_selection import train_test_split ...main_data, test_data =train_test_split(dataframe, test_size=percent_test_data) ...
This will split the data randomly into two different sets
Split each of the train and test data into inputs and outputs
Presuming that our "has_rain" interest column is located first
X =main_data.iloc[:, 1:].valuesy =main_data.iloc[:, 0].values
Rescale the data so it's between 0 and 1
Again fairly easy because of sklearn
from sklearn.preprocessing import StandardScalerfrom sklearn.externals import joblib..scaler =StandardScaler()X =scaler.fit_transform(X) ...# of course we should be careful to save the scaled model for later reusejoblib.dump(scaler, 'model_file_name.save')
4. How the actual neural network wrapper API works (Keras)
Building a multi layer neural network with Keras is very easy:
from keras.models import Sequentialfrom keras.layers import Densefrom keras.layers import Dropout ...input_dimensions =X.shape[1] optimizer ='rmsprop'dropout =0.05model =Sequential()inner_nodes =int(input_dimensions / 2)model.add(Dense(inner_nodes, kernel_initializer='uniform', activation='relu', input_dim=input_dimensions))model.add(Dropout(rate=dropout))model.add(Dense(inner_nodes, kernel_initializer='uniform', activation='relu'))model.add(Dropout(rate=dropout))model.add(Dense(1, kernel_initializer='uniform', activation='sigmoid'))model.compile(optimizer=optimizer, loss='mean_absolute_error', metrics=['accuracy']) model.fit(X, y, batch_size=1, epochs=50)...# save the model for later useclassifier.save('file_model_name')
So what does this code mean? Here we're building a sequential model, that means sequentially all the layers will be evaluated.
a) we declare the input layer (Dense), here all the inputs from our dataset will be initializedm so the "input_dim" parameter must be equal to the row length
b) a Dropout layer is added. To understand the Dropout first we must understand what "overfitting" means:it's a state in which the network has learned too much particularities for a specific dataset and will perform badly when confronted to a new dataset. The dropout layer will disconnect randomly neurons at each iteration so the network won't overfit.
c) another layer of Dense is added
d) another Dropout
e) the last layer is added with one output dimension (it will predict only yes/no)
f) the model is "fitted" that means the learning process will begin, and the model will learn
Other parameters here:
- activation functions (sigmoid, relu). This are functions that dictate when the neuron will transmit it's impulse further in the network. There are many, but sigmoid and relu are the most common. Check out this link for more details:https://towardsdatascience.com/activation-function...
- kernel_initializer function (uniform). This means that all the weights are initialized with random uniform values
- loss function (mean_absolute_error). This function measures the error comparing the network predicted result versus the ground truth. There are many alternatives:https://keras.io/losses/
- metrics function (accuracy). It measures the performance of the model
- optimiser functions (rmsprop). It optimizes how the model learn through backpropagation.
- batch_size. Number of datapoints to take once by Keras before applying optimizer function
- epochs:how many times the process it's started from 0 (to learn better)
There is no best configuration for any network or dataset, all these parameters can an should be tuned for optimal performance and will make a big difference in prediction success.
5. Future improvements
Let's start from the weather station , I can see a lot of improving work to be done here:
- add a wind speed / direction sensor. This could be a very important sensor that i'm missing in my model
- experiment with UV rays, gas and particle sensors
- add at least two stations in the zone for better data (make some better averages)
- collect a few more years of data, i've experimented with just a year and a half
Some processing improvements:
- try to incorporate data from other sources into the model. You can start to import wind speed data and combine with the local station data for a better model. This website offers historical data:https://www.wunderground.com/history/
- optimize the Keras model better by adjusting:layers, nr of neurons in layers, dropout percents, metrics functions, optimiser functions, loss functions, batch size, learning epochs
- try other model architectures, for example i've experimented with LSTM (long short term memory) but it gived slightly poorer results)
To try different parameters on the learning model you can use
python train.py --days_behind 600 --test-file-percent 10 --datapoints-behind 6 --hour-granularity 6 --grid-search
This will search through different "batch_size", "epoch", "optimizer" and "dropout" values, evaluate all and print out the best combination for your data.
If you have some feedback on my work please share it, thanks for staying till the end of the tutorial!
Step 7:Bonus:Using an Official Weather Dataset
I was wondering if I can get better results with a more reliable weather station, so i've searched a bit, and i've came across "Darksky AP I" (https://darksky.net/dev), this is a great tool that provides current and historical weather data with many more sensor data:
- temperature
- humidity
- pressure
- wind speed
- wind gust
- ub index
- visibilitySo this beeing data from an official weather station, and having more parameters I thought it should perform better so i've gave it a try. To replicate my findings:
1.Download the data from darsky or import my MongoDb collection:
a) Download
- to download your self, first create an account in darsky and get the API key
- replace the API key in download_import/config.py
- also in the config replace the geographic coordonates for the location you want to predict the rain
- in a console activate "weather" anaconda environment and run:
python download_import/darksky.py -d 1000
- the free version of the API is limited to 1000 requests per day so if you want more data you need to wait for a longer time
b) Import my downloaded data for Bucharest city
- in a console run
mongoimport -d weather -c darksky --file sample_data/darksky.json
2. When you train the model specify that it should run on "darksy" dataset
python train.py -d 2000 -p 20 -dp 4 -hg 6 --data-source darksky
3. To see the results run predict batch script as before
python predict_batch.py -f sample_data/test_data.csv
You'll see that the overall prediction percent has gone from about 80% to 90%. Also the prediction accuracy when accounting only rainy days has gone up.
So yes, the dataset really matters.
代码
- 代码片段#2
- 代码片段 #5
- Code snippet #6
- Code snippet #10
- Code snippet #15
- Code snippet #16
- Code snippet #18
- Code snippet #22
- Code snippet #23
- Code snippet #25
- Code snippet #26
代码片段#2纯文本
#include "LowPower.h"
#include "SoftwareSerial.h"#include "Wire.h"#include "Adafruit_Sensor.h"#include "Adafruit_BME280.h"#include "BH1750.h"SoftwareSerial serialComm(4, 5); // RX, TXAdafruit_BME280 bme; BH1750 lightMeter;const byte rainPin =A0;byte sensorsCode =1;/** * voltage level that will pun the microcontroller in deep sleep instead of regular sleep */int voltageDeepSleepThreshold =4200; const byte peripherialsPowerPin =6;char buffer[] ={' ',' ',' ',' ',' ',' ',' '};struct sensorData { byte humidity; int temperature; byte rain; int pressure; long voltage; int light; };sensorData sensors;void setup() { Serial.begin(9600); serialComm.begin(9600); pinMode(peripherialsPowerPin, OUTPUT); digitalWrite(peripherialsPowerPin, HIGH);延迟(500); if (!bme.begin()) { Serial.println("Could not find a valid BME280 sensor, check wiring!"); while (1) { customSleep(100); } } Serial.println("Initialization finished succesfully");延迟(50); digitalWrite(peripherialsPowerPin, HIGH);}void loop() { updateSenzors(); transmitData(); customSleep(75); }void updateSenzors() { bme.begin(); lightMeter.begin();延迟(300); sensors.temperature =bme.readTemperature(); sensors.pressure =bme.readPressure() / 100.0F; sensors.humidity =bme.readHumidity(); sensors.light =lightMeter.readLightLevel(); sensors.voltage =readVcc(); sensors.rain =readRain();}void transmitData(){ emptyIncommingSerialBuffer(); Serial.print("Temp:");Serial.println(sensors.temperature); Serial.print("Humid:");Serial.println(sensors.humidity); Serial.print("Pressure:");Serial.println(sensors.pressure); Serial.print("Light:");Serial.println(sensors.light); Serial.print("Voltage:");Serial.println(sensors.voltage); Serial.print("Rain:");Serial.println(sensors.rain); transmitSenzorData("T", sensors.temperature); transmitSenzorData("H", sensors.humidity); transmitSenzorData("PS", sensors.pressure); transmitSenzorData("L", sensors.light); transmitSenzorData("V", sensors.voltage); transmitSenzorData("R", sensors.rain);}void emptyIncommingSerialBuffer(){ while (serialComm.available()> 0) { serialComm.read();延迟(5); }}void transmitSenzorData(String type, int value){ serialComm.print(type); serialComm.print(sensorsCode); serialComm.print(":"); serialComm.print(value); serialComm.print("|"); delay(50);}void customSleep(long eightSecondCycles){ if (sensors.voltage> voltageDeepSleepThreshold) { delay(eightSecondCycles * 8000);返回; } digitalWrite(peripherialsPowerPin, LOW); for (int i =0; i 代码片段 #5纯文本
cd weather-predict # create anaconda environment named "weather" with python 3.6.2conda create --name weather python=3.6.2 # activate environmentconda activate weather# install all packages pip install -r requirements.txt
Code snippet #6Plain text
mongodb ={ 'host':'localhost', 'port':27017}... Code snippet #10Plain text
conda activate weatherpython serial_listener.py# every 10 minutes you should see data from the weather station coming in :[Sensor:type(temperature), value(14.3)][Sensor:type(pressure), value(1056.0)]...
Code snippet #15Plain text
{ "_id" :"04_27_2017_06_17", "humidity" :65, "date" :ISODate("2017-04-27T06:17:18Z"), "pressure" :1007, "temperature" :9, "rain" :0, "light" :15} Code snippet #16Plain text
client =MongoClient(host, port).weather.datapoints cursor =client.find( {'$and' :[ {'date' :{'$gte' :start_date}}, {'date' :{'$lte' :end_date}} ]} )data =list(cursor).. Code snippet #18Plain text
_id date humidity light pressure rain temperature 04_27_2017_03_08 2017-04-27 03:08:36 67.0 0.0 1007.0 0.0 11.004_27_2017_03_19 2017-04-27 03:19:05 66.0 0.0 1007.0 0.0 11.004_27_2017_03_29 2017-04-27 03:29:34 66.0 0.0 1007.0 0.0 11.0
Code snippet #22Plain text
_id has_rain humidity_10percentile humidity_30percentile humidity_70percentile humidity_90percentile ... temperature_steady_4 temperature_steady_5 temperature_steady_6 temperature_steady_7 temperature_steady_8 ... 04_27_2017_3 0 36.0 44.8 61.0 63.0 ... NaN NaN NaN NaN NaN04_28_2017_0 0 68.0 70.0 74.0 75.0 ... 14.0 NaN NaN NaN NaN04_28_2017_1 0 40.0 45.0 63.2 69.0 ... 20.0 14.0 NaN NaN NaN04_28_2017_2 0 34.0 35.9 40.0 41.0 ... 29.0 20.0 14.0 NaN NaN04_28_2017_3 0 36.1 40.6 52.0 54.0 ... 19.0 29.0 20.0 14.0 NaN04_29_2017_0 0 52.0 54.0 56.0 58.0 ... 26.0 19.0 29.0 20.0 14.004_29_2017_1 0 39.4 43.2 54.6 57.0 ... 18.0 26.0 19.0 29.0 20.004_29_2017_2 1 41.0 42.0 44.2 47.0 ... 28.0 18.0 26.0 19.0 29.0
Code snippet #23Plain text
from sklearn.model_selection import train_test_split ...main_data, test_data =train_test_split(dataframe, test_size=percent_test_data) ...
Code snippet #25Plain text
from sklearn.preprocessing import StandardScalerfrom sklearn.externals import joblib..scaler =StandardScaler()X =scaler.fit_transform(X) ...# of course we should be careful to save the scaled model for later reusejoblib.dump(scaler, 'model_file_name.save')
Code snippet #26Plain text
from keras.models import Sequentialfrom keras.layers import Densefrom keras.layers import Dropout ...input_dimensions =X.shape[1] optimizer ='rmsprop'dropout =0.05model =Sequential()inner_nodes =int(input_dimensions / 2)model.add(Dense(inner_nodes, kernel_initializer='uniform', activation='relu', input_dim=input_dimensions))model.add(Dropout(rate=dropout))model.add(Dense(inner_nodes, kernel_initializer='uniform', activation='relu'))model.add(Dropout(rate=dropout))model.add(Dense(1, kernel_initializer='uniform', activation='sigmoid'))model.compile(optimizer=optimizer, loss='mean_absolute_error', metrics=['accuracy']) model.fit(X, y, batch_size=1, epochs=50)...# save the model for later useclassifier.save('file_model_name') Github
https://github.com/claws/BH1750https://github.com/claws/BH1750 Github
https://github.com/rocketscream/Low-Powerhttps://github.com/rocketscream/Low-Power Github
https://github.com/adafruit/Adafruit_Sensorhttps://github.com/adafruit/Adafruit_Sensor Github
https://github.com/adafruit/Adafruit_BME280_Libraryhttps://github.com/adafruit/Adafruit_BME280_Library Github
https://github.com/danionescu0/home-automationhttps://github.com/danionescu0/home-automation
示意图
sketch_KAtDa2VReF.fzz 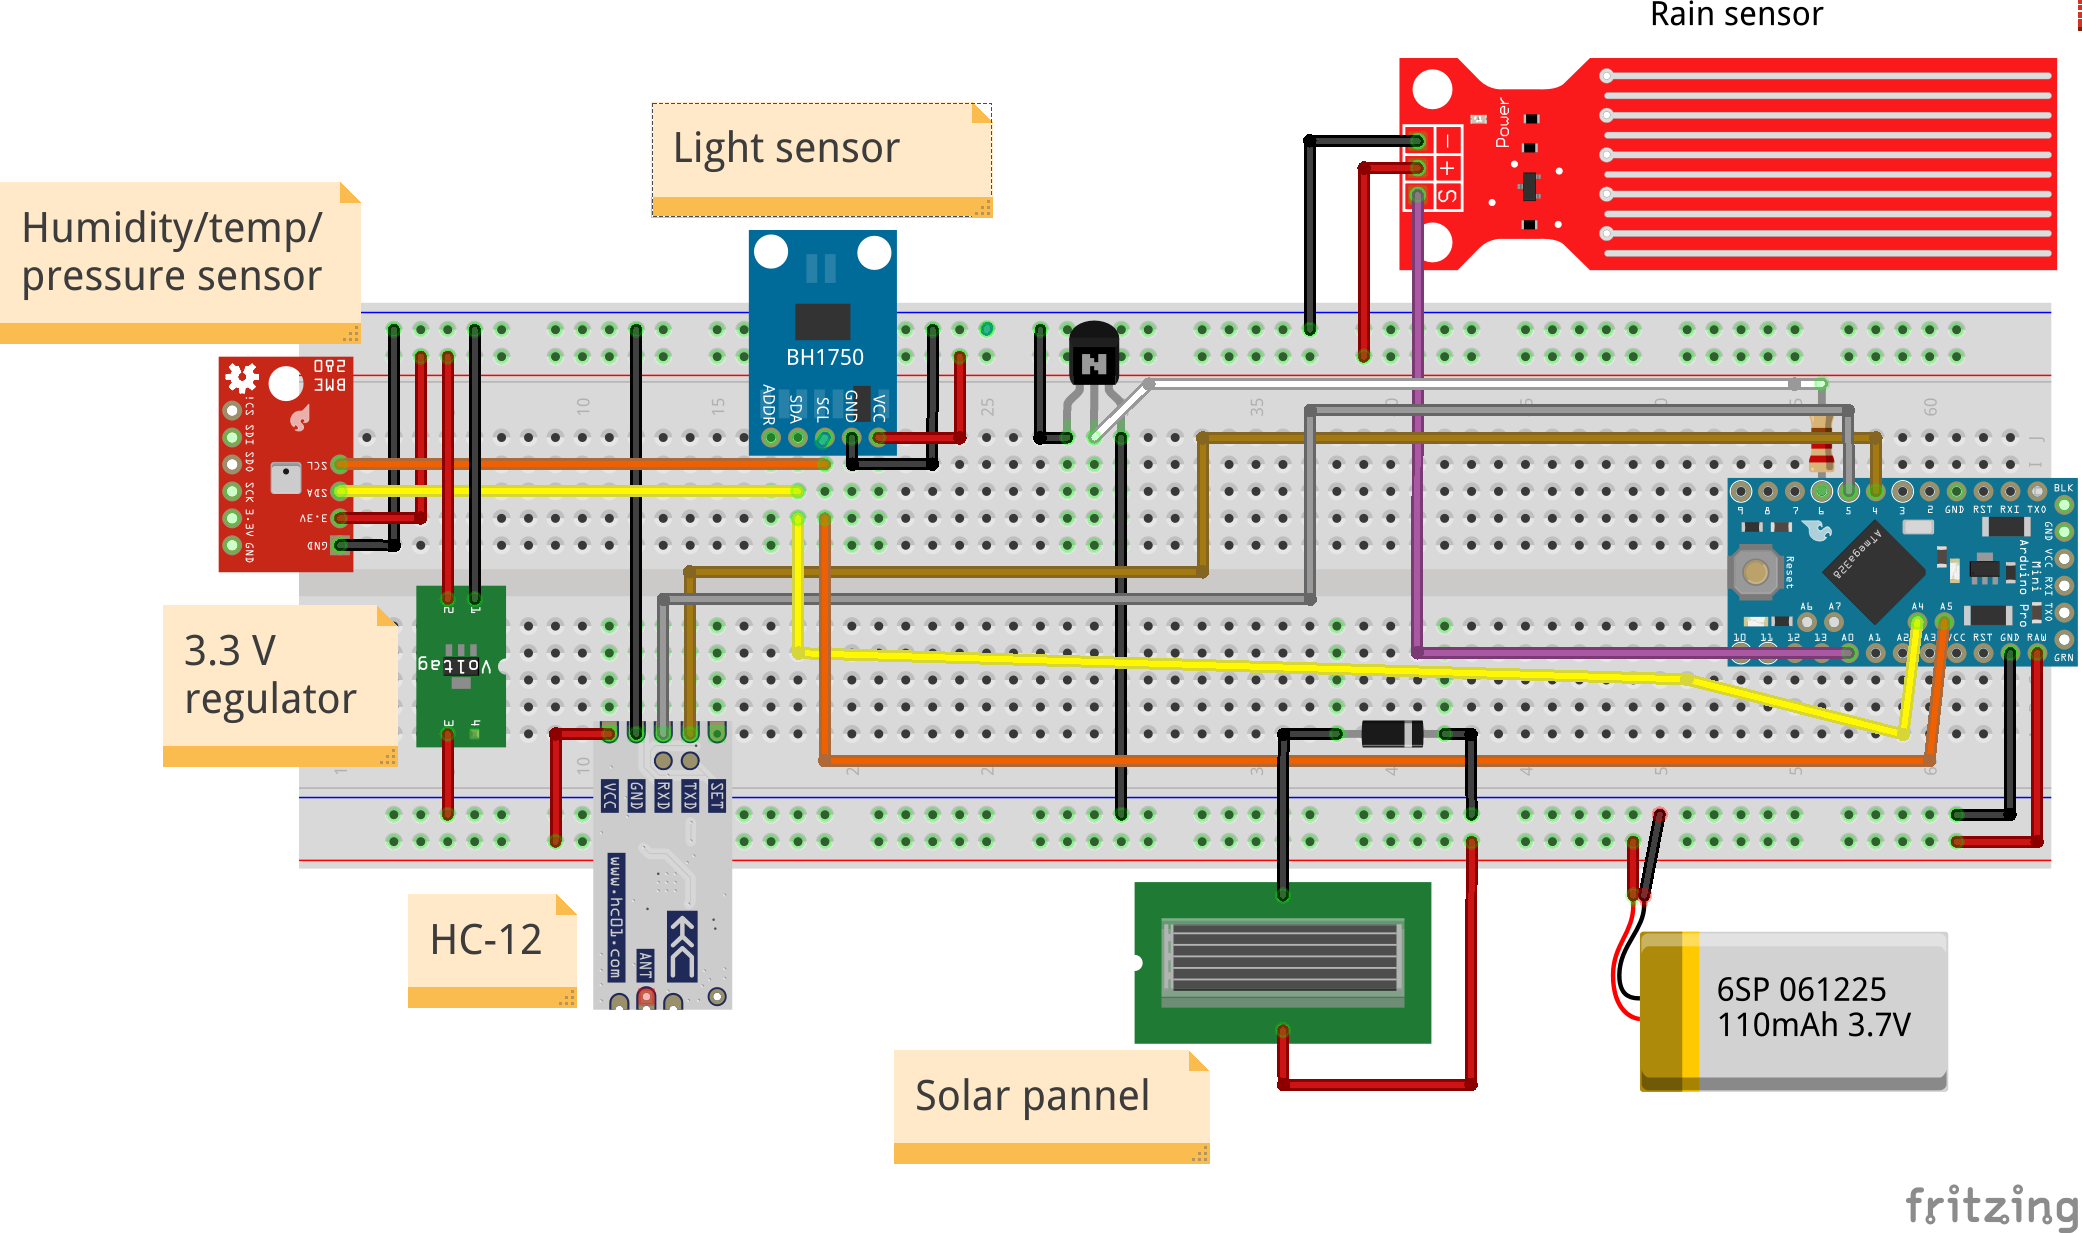
Weather station arduino sketch
https://github.com/danionescu0/home-automation/tree/master/arduino-sketches/weatherStation
制造工艺
-
Python 和 Raspberry Pi 温度传感器
-
使用 Arduino Nano RP 2040 的 DIY Photoshop 编辑控制台
-
Python 使用 os.rename() 重命名文件和目录
-
使用 Arduino 和 RFID 和 Python 的考勤系统
-
使用 Arduino、1Sheeld 和 Android 的通用远程控制
-
使用 Arduino 和智能手机的 DIY 电压表
-
使用 Arduino DIY 红外线心跳传感器
-
使用 Arduino 的频率和占空比测量
-
DIY 电压表与 Arduino 和诺基亚 5110 显示器
-
Sonar 使用 arduino 并在处理 IDE 上显示
-
使用 Bolt 和 Arduino 控制 LED 亮度
-
u-blox LEA-6H 02 GPS 模块,带有 Arduino 和 Python