

碳点作为纳米温度计的新一代材料:回顾
摘要
高灵敏度的非接触模式温度传感对于研究基本的化学反应、生物过程和医学诊断中的应用非常重要。基于纳米级的温度计保证了非侵入性探头,以亚细胞分辨率进行灵敏和精确的温度传感。基于荧光的温度传感器显示出巨大的能力,因为它们以“非接触”模式运行,并提供细胞成像和分子水平传感温度的双重功能。纳米材料和纳米技术的进步导致了新型传感器的发展,例如纳米温度计(在纳米尺度上具有高空间分辨率的新型温度传感材料)。这种纳米温度计是使用不同的平台开发的,例如荧光蛋白、有机化合物、金属纳米颗粒、稀土掺杂纳米颗粒和半导体量子点。碳点(CDs)由于具有强荧光性、抗光漂白性、化学稳定性、低成本前体、低毒性和生物相容性等突出特性,在许多研究领域引起了人们的兴趣。最近的报告显示了一些 CD 的热传感行为,使它们成为其他基于纳米材料的温度计的替代品。这种基于发光的温度计有望用于纳米腔温度传感和热成像,以更好地了解生物过程。由于 CD 作为热传感纳米级材料仍处于早期阶段,在这篇综述中,我们全面了解了这种新型纳米温度计、增强热灵敏度和分辨率的功能化方法以及热传感行为的机制。
温度是一个基本的热力学变量,对生物和化学系统有显着影响。由于其应用范围广泛,几乎在自然科学、工程、农业和医学的所有领域,精确测温具有重要意义[1, 2]。在医学应用中,温度测量用于早期检测各种疾病,例如中风、癌症或炎症,其初期症状之一是局部温度特性的出现。
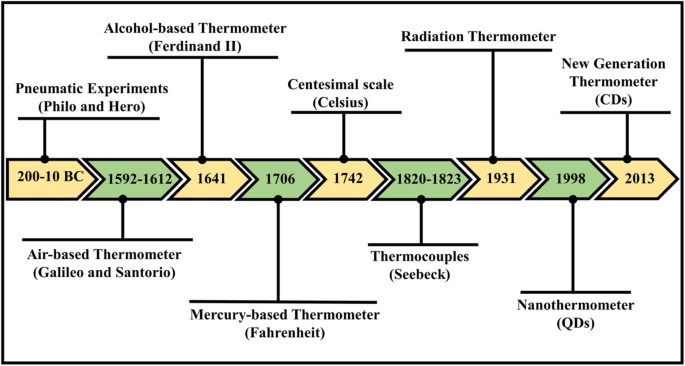
在历史上,最早的温度估计是建立在感觉或观察上的。在公元前 200-10 年的古代,气动实验(空气热膨胀)被指定为用于热量定量测量的最古老的公认参考文献。在与热膨胀空气相关的最原始著作中,拜占庭的 Philo 和亚历山大的 Hero(或 Heron)撰写的有关气动实验的著作 [3]。后来,在 1592 年到 1603 年之间,伽利略·伽利莱发明了一种测温仪,通过使用一根管子将空气包围在水柱上方,通过构建一个简单的装置,对空气受热膨胀进行实验,从而发明了测温仪。继伽利略之后,意大利的 Santorio 首次因将这种简单的仪器集成到发烧医学检查中而获得认可。费迪南德二世于 1641 年组装了第一个完全密封的玻璃液体温度计,即装有酒精的玻璃管。 与伽利略和圣托里奥的开放式温度计不同,他能够在没有气压的情况下测量温度。华氏在测温方面的实际工作出现于 1706 年;他开始喝酒,但后来因他的水银温度计而成为传奇。 1742 年,安德斯·摄氏 (AndersCelsius) 提出了百分制温标的认可,他预计水沸腾温度下的刻度为 0,水冻结温度下的刻度为 100。电子实验在 19 世纪进行,当时 Thomas Johann Seebeck 考虑了热电的概念。在 1820 年至 1823 年间进行的一系列实验中,他验证了当接头之间存在热差时两种不同金属的接合点处的电势。这后来被称为塞贝克效应,它作为热电偶的起源,被认为是最准确的温度测量 [3,4,5,6,7]。温度计的时间线示意图如图1所示。
温度计演变的时间线图
常规温度计可分为:
基于材料热膨胀的充液玻璃温度计
基于塞贝克效应的热电偶
光学传感器 [8]
此外,它们可分为接触式或非接触式温度计。接触模式,包括经典的充液玻璃、热电偶、热敏电阻和电阻温度检测器 (RTD),都需要电缆以及温度计和基板之间的直接接触。此模式不适用于电磁噪声强、火花可能危险、环境具有破坏性或部件快速移动的应用。此外,当空间分辨率降低到亚微米级时,传统温度计无法进行测量,例如,在细胞内温度变化以及映射微电路和微流体的温度时 [9]。同样,工程应用需要针对微型区域和恶劣环境采用先进的热敏策略 [10]。因此,对于纳米级领域,应该考虑其他方法和材料。
新型非接触式测温可以克服上述问题。例如,光学温度传感器(分子温度计)是更新一代的分析工具,由分子类别组成,这些分子类别使用发射光的测量来提取温度 [11, 12]。荧光温度敏感探针为纳米系统应用中的温度测量提供了一个有前景的领域。温度信息可以根据它们的荧光强度、带形状、斯托克斯位移或衰减寿命提取,如果正确校准,可以与温度相关[13, 14]。
分子温度计在诊断患病或致癌细胞方面具有巨大潜力,这些细胞的生理温度与普通细胞不同。在医学应用中,可能性范围从温度诱导的基因表达控制 [15] 和细胞代谢 [16] 到细胞选择性渗透和疾病治疗 [17] 以及改善集成热源的散热 [18] .近年来,半导体[19]、聚合物[10]、金属纳米粒子[20]等纳米材料已被用作具有亚微米热分辨率的热传感器(纳米温度计)。
可以在各种温度范围内解析亚度温度的温度计,也可以集成到生命系统中,可以为无数生物、物理和化学研究领域提供有影响力的新工具。因此,在这篇综述中,我们重点关注基于碳纳米材料(碳质材料)的“新一代”或“新型”纳米温度计。据我们所知,目前还没有关于碳点作为纳米温度计的评论文章。最近,碳点(碳量子点、石墨烯量子点)及其独特的特性显示出敏感的热特性,这使它们成为纳米尺度域测温行为的优秀候选者。在这里,回顾了碳点热敏行为的定义、优点和机制。最后,提出了这类新型热材料的未来展望。
“纳米测温”的意思是使用纳米级热敏材料来提供有关纳米或微米级区域局部环境的温度信息 [21, 22]。基于纳米粒子的热探针在广泛的传感应用中具有巨大的能力,并且最近报道了许多先进的所谓“纳米温度计”。此外,据报道,不同种类的常规纳米材料具有热敏发光特性,例如聚合物 [23, 24]、纳米晶体 [25]、稀土掺杂纳米粒子 [26, 27] 和金属纳米粒子 [28]。
因此,纳米温度传感器是非侵入性、非接触模式、精确的温度计,在纳米尺度上工作,具有高灵敏度分辨率 [9]。利用纳米材料的热传感可以通过操纵它们的光学特性来实现。荧光纳米测温法可以根据精确的参数分为几类,从这些参数中可以得出热测量值,包括信号强度、波段形状、荧光寿命、波段偏移、激发波长的偏振和光谱偏移。在第一种情况下,荧光随温度的不同而变化,可以检测到信号的绝对增加(或减少)[9, 29,30,31]。
非接触式发光纳米测温法使用具有温度依赖性发射的发光纳米材料,主要适用于生物应用 [32, 33]。这些发光纳米材料包括荧光聚合物 [24]、金属纳米粒子 [34]、稀土掺杂纳米粒子 [35] 和纳米金刚石 [36],它们在生理范围内具有热敏特性。这些开创性的工作能够提供单个电池的平均温度。基于有机染料(例如罗丹明 6G)和聚合物(例如聚(N) -异丙基丙烯酰胺))通常表现出较差的光稳定性和对氧气的明显交叉敏感性,这对于活细胞工作来说是不受欢迎的 [8]。此外,荧光团的寿命对 pH 值有很强的依赖性,这使得在不精确控制被调查环境的 pH 值的情况下难以使用 [37]。
已经报道了另一类基于纯半导体纳米晶体和掺杂半导体纳米晶体的纳米温度计,其中最突出的候选者有 CdSe、ZnS、InP 或 PbSe [19, 38,39,40]。半导体量子点 (SQD) 是纳米级温度计的候选材料,因为它们具有高量子产率、光漂白前的长寿命以及适当的表面改性后足够的生物相容性。此外,它们可以很容易地与蛋白质和 DNA 结合以进行传感和成像 [41]。这种类型的发光温度计面临的特殊挑战是在 T 下对亮度、光稳定性、灵敏度和精度的相关识别 =20–40 °C 探测亚细胞微环境时。 SQDs 在合成、理化性质、发光以及它们的潜在应用方面得到了广泛的审查。在这里,我们将读者的注意力引向这些众多引人注目的评论 [42,43,44,45,46]。与有机染料相比,SQD 具有出色的检测亮度、更宽的多路激发曲线以及更好的光稳定性以供长期研究使用。此外,作为温度传感器的 SQD 可以抵抗 pH 值和其他预期在细胞内普遍存在的环境变化 [47]。
通常,在 SQD 中,由于不同过程的组合,温度升高会导致荧光强度降低(猝灭),并伴有光谱偏移。可以假设这种转变在生物物理范围内是线性的。两种效应(发光猝灭和光谱位移)的大小在很大程度上取决于构成量子点的材料及其大小 [48]。
每组发光纳米材料都有使用限制及其优点。如上所述,SQDs 比荧光聚合物和有机染料更受欢迎。 SQDs 在光稳定性、量子效率和可调荧光方面都很好,但 QDs 不能用于追踪单个分子以进行长期监测,因为它们固有的闪烁 [49]。此外,量子点的主要缺陷是它们的毒性,这是由于它们含有重金属,包括镉等金属;这限制了它们的生物和环境应用。此外,自然界中前体元素的可用性相对较低,因此SQD被认为是昂贵的[50]。
为了克服非碳基纳米温度计带来的问题(正如我们在上一节中解释的那样),已经制备了碳基纳米材料并显示出独特的性质,例如低毒性、易于制备、低成本的前体、光稳定性, 和生物相容性。这些碳基纳米材料显示出灵敏的热传感特性。此外,由于此类有毒材料对生物应用的环境危害,无金属纳米粒子的改进是重要且紧迫的 [51, 52]。在碳基纳米材料家族中,荧光纳米金刚石首先被报道为纳米温度计 [53]。荧光纳米金刚石由于其化学稳定性和惰性表面而具有固有的生物相容性 [54]。其他纳米金刚石最近已用于以亚度精度进行细胞内热传感 [55, 56]。这些纳米金刚石的热敏感性基于所谓的氮空位色心,这是由氮原子取代晶格碳原子和附近空位晶格位点组成的点缺陷 [48, 57]。荧光纳米金刚石的氮空位中心得到了广泛的研究,并且因其光物理特性以及在生物应用中的应用而得到了很好的表征 [58]。基于氮空位的温度测量的工作原理取决于该色心的准确测量,该色心可以以高空间分辨率进行光学检测 [30, 59]。然而,荧光效率低、可控性差等问题极大地阻碍了荧光纳米金刚石的应用[36]。
一类较新的碳基纳米材料家族是高发光碳点 (CD),它具有异常明亮的光致发光、光化学稳定性、水溶性、良好的生物相容性和无毒 [60,61,62]。 CD 是直径小于 10 nm 的零维球形纳米粒子 [63, 64]。各种方法已用于制备不同类型的 CD,例如激光烧蚀 [65]、溶剂热 [66]、水热合成 [67]、微波辅助 [68]、电弧放电 [69]、酸性氧化 [70]、以及更多的化学和物理方法 [71, 72]。此外,CD 显示出各种应用的理想前景,例如生物成像 [73]、化学和生物传感 [74,75,76,77]、靶向药物递送 [78]、药物分析 [79] 和催化 [80, 81]。碳点在合成、物理化学性质及其潜在应用方面已得到广泛的审查。在这里,我们向读者推荐碳点的众多好评[72, 82,83,84,85,86,87,88]。
近年来,荧光CDs作为温度传感器引起了研究人员的广泛关注。原则上,有效的温度测量需要一些要求,例如碳纳米点在相关温度范围内的光致发光应该表现出明显的变化 [89]。光稳定性、pH稳定性和保质期是实际应用中应考虑的其他要求。
CD 是传统半导体量子点 (SQD) 的有前途的替代品。与量子点相比,CDs 显示出许多突出的优势,例如低成本、低毒性及其独特的强大光学/化学性质 [90] 此外,CDs 显示出非常少的光漂白。与其他荧光原材料相比,CDs 是由自然界中丰富的廉价碳源生产的 [91]。此外,有几种简单的方法可以修饰和功能化 CDs 的表面状态,可以根据实验要求调整 CDs 的溶解度、稳定性、物理化学性质和量子产率 [49, 92, 93]。
文献中报道的具有温度依赖性荧光的碳点文章很少,见表1。
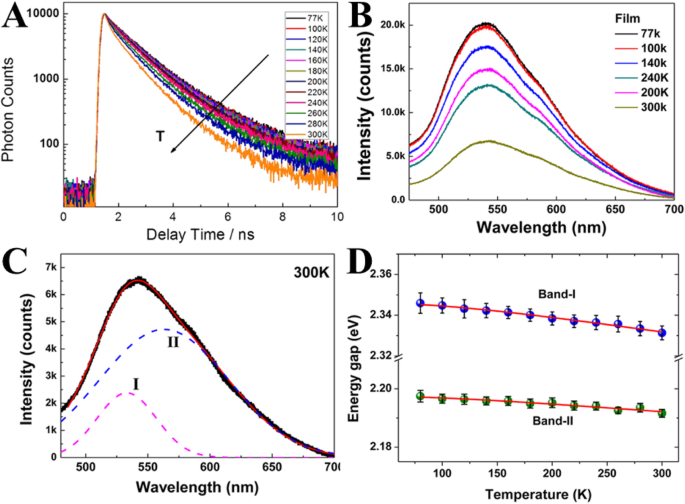
余等人。 [51] 于 2012 年首次研究了碳纳米点的温度依赖性荧光,并将它们与半导体和金属基纳米粒子进行了比较。他们依赖于通过时间相关单光子计数技术 (TCSPC) 测量温度相关的光致发光寿命。光致发光弛豫动力学在较高温度下变得更快(图 2a),这可以归因于非辐射衰减过程。进行了作为从低温到室温的温度函数的 CD 膜的荧光光谱的测量(图 2b)。随着温度的升高,荧光强度呈重复性降低。
一 作为温度函数的时间分辨光致发光测量。 b CD 膜的荧光光谱作为温度的函数。 c 由二高斯函数拟合的 300 K 下的荧光光谱。 d 作为温度函数的荧光带宽。 (转载自参考文献[51])
PL 光谱表现出不对称峰,因此每个温度下的 PL 光谱可以很好地由图 2c 所示的双高斯函数拟合。高能带,I 带;低能带,带II(图2d)。
此外,检查荧光的能隙(带宽)作为温度的函数(图 2d)。总带宽由温度无关(电子-电子散射)和温度相关(电子-声子和表面/缺陷散射)决定。带I和带II的带宽与温度无关,这表明电子-电子散射在CD中占主导地位。
因此,CD 中的微弱温度效应与主要相互作用机制涉及电子 - 电子相互作用而不是电子 - 声子耦合的事实一致。此外,即使在非常低的温度(77 K)下通常也能观察到宽的 PL 带(> 100 nm),这被称为强电子 - 电子相互作用(图 2c)。该结果类似于金属纳米团簇,而不同于半导体 QD。因此,Yu 及其同事推测 CD 中的 π 电子可以与金属纳米团簇中的自由电子类似。
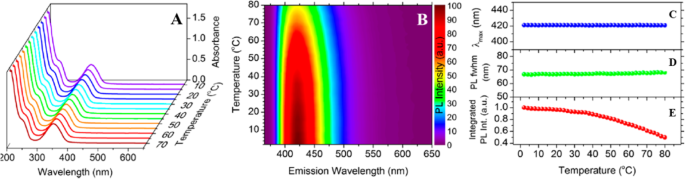
卡利丘克等人。 [89] 通过一步水热处理柠檬酸和 l-半胱氨酸合成了高度发光的水溶性 N, S-CDs。他们在很宽的温度范围内收集了稳态吸收光谱,以表征 CD 的温度依赖性 PL 特性。在 10 到 70°C 之间的温度下(每步增加 5°C)分散在水中的 N, S-CDs 的吸收光谱如图 3a 所示。与半导体纳米晶体不同,吸收带的位置和强度不随温度变化。先前报道了在谷胱甘肽存在下对葡萄糖进行水热处理合成的 CD 的类似结果 [1]。
一 在 10 到 70 °C 的温度范围内进行的温度相关吸收。 b 在 2 到 80 °C 的温度下,步长为 2 °C,激发波长为 355 nm 时,温度相关 PL 发射的归一化颜色图。 PL 峰值最大值 λmax (c ), PL fwhm (d ) 和积分 PL 强度 (e )。 (转载自参考文献[89])
在他们的工作中,他们展示了在 2 至 80°C 的温度范围内以 2°C 的步长获得的 N、S-CD 的 PL 光谱的彩色图(图 3b)。增加温度使 PL 发射强度降低了大约 2 倍,而 PL 发射没有任何可检测的变化 [89]。在研究温度下定量测定PL发射最大值的位置、PL半峰全宽(fwhm)和积分PL强度,分别将结果浓缩在图3c-e中。
N, S-CDs 的 PL 峰位置显示出较弱的温度依赖性,这与大多数半导体纳米晶体不同,其带隙随温度变化,导致 PL 发射偏移。此外,它们的 PL fwhm 在相同的温度范围内仅表现出微不足道的展宽(1.4 ± 1 nm)(图 3d),表明 N、S-CD 的 PL 峰显示出可忽略不计的热展宽。为了表征发生在 CD 中的非辐射弛豫过程,他们分析了作为温度函数的积分 PL 强度的淬灭。图 3e 显示了 N、S-CD 的温度相关积分 PL 强度图,将值归一化为 2°C 时的强度,表明强度在研究的温度范围内单调降低,在80 °C 约为 2 °C 时的一半。基于这些结果,使用 N、S-CD 的阿伦尼乌斯公式估计 CD 在 2 至 80 °C 之间的热猝灭活化能为 17.0 ± 0.7 meV,这与 Yu 报告的值接近等。 [51].
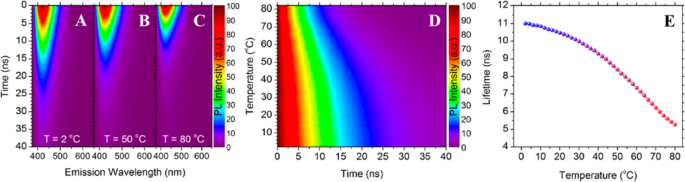
此外,Kalytchuk 等人。 [89] 研究了不同温度下 CD 的发射动力学。图 4a-c 显示了它们的时间分辨 PL 发射的强烈温度依赖性,显示了三种不同温度的时间分辨发射光谱数据。在 2、50 和 80°C 下,在 375 和 650 nm 之间的光谱区域中获得了 CD 的瞬态 PL 发射图,如图 4a-c 所示。随着温度的升高,PL 衰减明显下降,表明 CD 具有令人满意的基于 PL 寿命的温度传感特性。值得注意的是,在所有研究温度下,在点的发射剖面上都观察到了光谱均匀的单指数衰减,这表明重组是通过整个 CD 集合中非常相似且高发射的通道发生的。 CD 的 PL 动力学可以说是它们与温度传感应用相关的最有前途的品质。具体而言,CDs的温度敏感性使其成为PL寿命纳米温度计。
CD 的时间分辨温度依赖性 PL 发射。标准化颜色图显示 a 处 CD 的时间分辨 PL 发射图 2°C,b 50 °C 和 c 80℃。 d 在 PL 发射最大值 (λem =421 nm) 处时间分辨 PL 强度的归一化颜色图,温度介于 2 和 80 °C 之间。 e 提取的 PL 寿命绘制为 2–80 °C 范围内温度的函数。 (转载自参考文献[89])
已经彻底研究了 2 至 80 °C 温度下 CD PL 寿命的变化;图 4d、e 显示了在点的 PL 发射最大值处收集的时间分辨 PL 数据作为温度的函数。图 4d 显示了研究温度范围内瞬态 PL 的彩色图,表明温度升高会导致表观 PL 衰减的单调缩短。所有记录的衰减曲线都使用单指数函数拟合。提取的寿命数据如图 4e 所示。随着温度从 2°C 增加到 80°C,PL 寿命从 11.0 ns 单调减少到 5.3 ns。已证明这种 PL 寿命灵敏度的温度范围 (2–80 °C) 涵盖了许多电子设备的生理相关温度范围和典型工作温度。这种基于PL寿命CD的热探针的绝对伪线性灵敏度为0.08 ns K
-1
, 其最大相对灵敏度为 1.79% K
−1
在 62°C。在研究的温度范围内,基于 CD 的发光纳米探针的 PL 衰减的单指数拟合产生了一个参数,即 PL 寿命 (τ),可以使用校准曲线将其直接转换为温度单位。与典型的半导体量子点相比,这是一个重要的优势,典型的半导体量子点表现出多指数衰减,这限制了它们在涉及 PL 寿命测量的应用中的实用性。
他们还研究了磷酸盐缓冲盐水 (PBS) 和 Dulbecco 改良 Eagle 培养基 (DMEM) 中 CDs PL 寿命的温度依赖性,并表现出相似的行为。
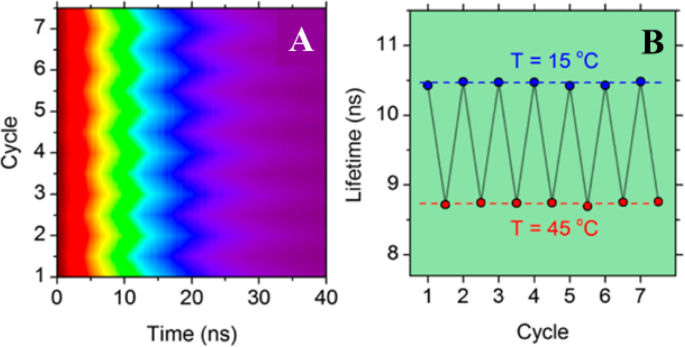
为了证明基于 CD 的发光温度计的可重复使用性,在 15 至 45 °C 的温度下,在七个连续的加热和冷却循环中测量了所选样品的 PL 衰减曲线(图 5a)。
一 PL 衰减可逆性在七个连续加热和冷却循环中的归一化颜色图。 b PL 寿命在 15 到 40 °C 之间的七个加热和冷却循环中的相应热稳定性。 (转载自参考文献[89])
在每个测量周期中,在 5 分钟热平衡后测量 PL 衰减。在加热和冷却循环过程中没有观察到热滞后现象,将由此产生的 PL 寿命变化绘制为时间的函数(图 5b),表明 CD 的 PL 寿命表现出优异的热稳定性。
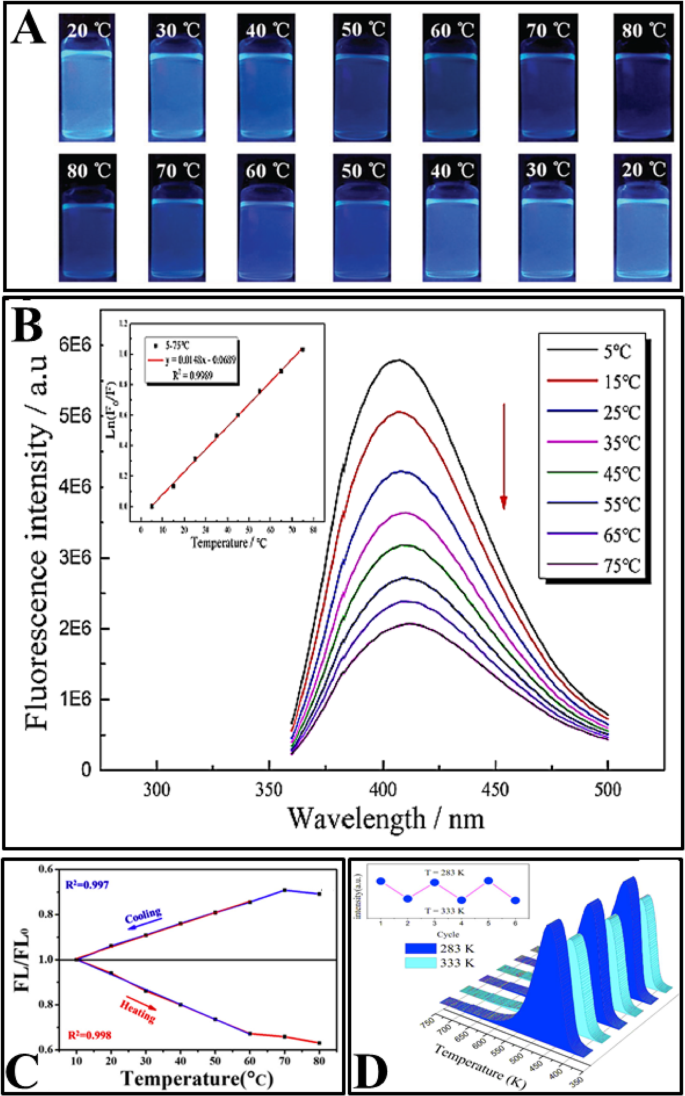
后来,使用各种合成方法制备了几种具有温度依赖性发射的 CD,例如水热和溶剂热处理 [2, 77, 92, 95, 97,98,99,100,101,102,103]、热回流 [94, 96] 和激光消融 [14] 如表 1 所示。制备的 CD 在生理范围内显示出线性温度依赖性荧光(如表 1 所示)。 CDs的荧光强度随着温度的升高而降低。此外,所有文章都研究了荧光强度的可逆性和可恢复性。图 6 显示了各种文章中研究的 CD 的一些常见特性。
一 N、S-CD 在加热(上)和冷却过程(下)期间在不同温度下在紫外光 (365 nm) 激发下的数字照片。 (转载自参考文献[96])。 b 在 340 nm 激发时,在 5–75 °C(从上到下)范围内测量的 N、S 共掺杂 CD 的荧光发射光谱,插图:温度与 Ln (F /F 0)。 (转载自参考文献[97])。 c MnOx-CDs 在冷却和加热过程中的 FL/FL0-温度图。 (转载自参考文献[103])。 d CDs 溶液的 PL 的可逆温度依赖性。 (转载自参考文献[102])
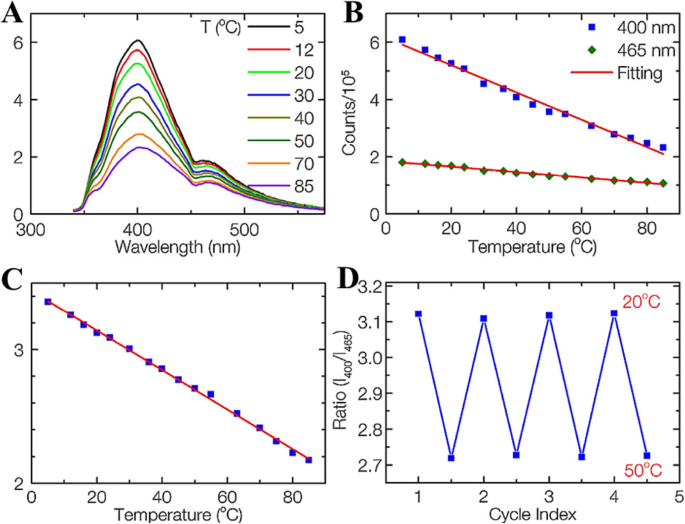
阮等人。 [14] 在乙二胺中使用飞秒激光烧蚀石墨粉合成碳点 (CD)。表面形成丰富的官能团,在表面位点形成多种表面态,导致CDs的多次发射。他们使用稳态荧光光谱研究了 CD 的荧光依赖性温度敏感性。 CD 在 320 nm 激发下的温度相关发射光谱如图 7a 所示。由于非辐射衰变途径的热激活,400 和 465 nm 峰的荧光强度都随着温度的升高而逐渐降低。峰值强度随温度范围从 5 到 85 °C 呈线性变化(图 7b)。对于 400 和 465 nm 峰,温度敏感 CD 的荧光强度变化分别为每°C 3.3% 和 2.1%。这表明CDs可以作为传统的高灵敏度的基于强度的温度传感器。
一 从 5 到 85 °C 记录的 CD 的发射光谱,在 320 nm 处激发。 b 400 和 465 nm 峰的荧光强度与温度的关系。 c 作为温度函数的 400 nm 与 465 nm 峰的比率。 d CD 在 20 到 50 °C 之间的温度可逆性研究。 (转载自参考文献[14])
值得注意的是,独特的多发射特性使 CD 成为用于比率荧光温度传感器的有前途的荧光团。 400 和 465 nm(320 nm 激发)处的两种荧光强度与温度的比率如图 5c 所示。 There is a very good linear relationship between the intensity ratio and temperature in a wide temperature range from 5 to 85 °C (R
2
=0.998). Thermal linearity is advantageous since it makes the correlation between the peak-intensity ratio and temperature straightforward and meanwhile provides a constant thermal sensitivity along with the entire dynamic range. The temperature-sensitivity of CDs is determined to be 1.48% °C
−1
, which is comparable with that of other materials. It should be noted that the temperature response range of CDs is much wider than those of other reports on dual-emission temperature sensors and covers both the physiological temperature for biology studies and the working temperature for many electronic devices. Besides 320 nm excitation, the CDs also work at other excitation wavelengths, such as 340 and 365 nm, with the same sensitivity. Thus, the CDs can be utilized for temperature sensing in many practical applications by selected different working wavelengths.
They have shown that the ratiometric temperature sensor was reversible between 20 and 50 °C, four cycles and photostable (when the intensity of the power source changed) as shown in Fig. 7d. This result suggests that the CDs sensing system is stable and robust with any changes in sample concentration, excitation, or detection efficiency.
Increasing temperature is not always accompanied by PL quenching; however, it could show enhancement of the PL as well. Macairan et al. [29] showed the PL enhancement of dual-fluorescent carbon dots with increasing temperature. They prepared biocompatible dual-fluorescing carbon dots CDs in a one-step microwave assisted-reaction using formamide and glutathione. They found that following excitation at 640 nm, the fluorescence intensity and PL integrated area increase over the range of 5–60 C by a factor of 3.5 observed over the entire analysis range and the temperature (Fig. 8a). As shown in Fig. 8b, a linear response (R
2
=0.999) is observed over the entire analysis range and the temperature sensitivity was determined to be as high as 3.71% C
−1
.
一 Excitation at 640 nm yields a 3.5-fold increase in fluorescence intensity and the corresponding integrated area is plotted in b showing a linear response over the range of 5–60 °C. c Changes in the fluorescence spectra of the CDs (λex =405 nm) as a function of temperature over the entire range. A 1.3-fold decrease is noted for the blue fluorescence in contrast to the 3-fold increase for the red counterpart. d The ratio of the integrated areas of the red and blue fluorescence components are plotted as a function of temperature showing a linear increase over the entire temperature range. (Reproduced from reference [29])
The temperature-dependent fluorescence was also studied following excitation at 405 nm. Interestingly, the blue and red fluorescence bands are not equally sensitive to the change in temperature. With increasing temperature, the fluorescence intensity (and the corresponding integrated area under the curve) of the blue component shows a very slight decrease in contrast to the red component, which significantly increases (Fig. 8c). These observations are noted over the range of 5–60 °C where the blue emission decreases by a factor of 1.3 in contrast to the red emission, which increases by a factor of 3.0.
As shown in Fig. 8d, the ratio of red to blue fluorescence increases with temperature, and a highly linear response is triplicate on 3 unique samples and the linear plot reflects the observed with an R
2
=0.998. These analyses were repeated in an average of these measurements, which have small deviations at each temperature. The thermal sensitivity of the CDs, over the entire temperature range, varied from 1.33 to 4.81% °C
−1
, which is an improvement over previously reported carbon dot nano-thermometry systems and other dual-emitting nanomaterials such as quantum dots and metal-organic frameworks-dye composites. The thermal resolution of the CDs was calculated to be 0.048 K
−1
indicating that it is indeed possible to measure small thermal changes.
Zhang et al. [98] synthesized CDs that have temperature-responsive characteristics in the range of 25–95 °C, and they have excellent sensitivity and remarkable reversibility/recoverability (Fig. 9a). CD/epoxy composites were further prepared by uniformly doping CDs into an epoxy resin. First, 5 μg of the CDs were dissolved in 50 μL of triethylenetetramine (TETA). Then, 350 μL epoxy resin was added to the mixed solution and fully mixed by high-speed stirring. The resulting composite showed significantly enhanced temperature response.
一 Temperature dependence of the CD emission. b CD/epoxy composites. c Temperature dependence of the emission of the CD/epoxy composites. (Reproduced from reference [98])
Epoxy resin is a common thermosetting resin and is widely used to package LED chips. Figure 9b shows optical micrographs of CD/epoxy composite discs of approximately 2 cm in diameter and 8–10 mm in thickness. The cured CD/epoxy composites are transparent, and their fluorescence emission spectra are shown in Fig. 9c. The emission peak of the CD/epoxy composite is blue-shifted by approximately 10 nm compared to that of the CDs’ solution. Notably, the temperature response of the composite is significantly improved. In the temperature range of 25–95 °C, the fluorescence intensity decreases by 35% with increasing temperature, which is more than twice that of the solution state, and the linear results are more stable. The linear equation satisfies I 0/I =0.0074 [°C] + 0.80454 (R
2
=0.99724), where I 0 and I are the fluorescence intensity of the CD/epoxy composite before and after the temperature rise, and the excitation wavelength is 360 nm. The blue shift of the emission peak and the enhancement of the temperature response characteristics may be due to changes in the dielectric constant of the environment in which the CDs are located. The composite has a wide temperature detection range, and its excellent sensitivity and stability make it suitable for use as a temperature sensor based on a fluorescent nanomaterial in a variety of environments.
Up to now, there is no well-established mechanism for explaining the thermo-sensing behavior of carbon dots. Some reports attribute the mechanism to the thermal activation of non-radiative channels of surface (trap/defect) states. The general picture is that the non-radiative channels were not activated at low temperatures, so the excited electrons could emit photons radiatively. On the contrary, as the temperature increases, more non-radiative channels became activated, and excited electrons got back to the ground state by non-radiative processes, leading to the decreasing fluorescence intensity [2, 95, 99, 100, 103]. The mechanism of CDs emissions with heating/cooling is shown in Fig. 10.
Schematic illustration of CDs responding to temperature changes
To better understand the thermodynamics of the CD emission processes, Kalytchuk et al. [89] correlated the radiative (\( {\tau}_r^{-1} \)) and nonradiative ( \( {\tau}_{nr}^{-1} \)) recombination rates of a CD sample with its PL quantum yield. The radiative rate is determined from the PL quantum yield (QY) and the measured recombination rate τ
−1
as \( {\tau}_r^{-1} \) =QY × τ
−1
. The nonradiative relaxation rate \( {\tau}_{nr}^{-1} \) is expressed as \( {\tau}_{nr}^{-1} \) =τ
−1
- \( {\tau}_r^{-1} \). The PL QY of CDs at various temperatures was calculated from their temperature-dependent absorption and integrated PL intensity together with the PL QY determined at room temperature. Both radiative and nonradiative recombination rates derived from time-resolved PL measurement data are plotted as functions of temperature in Fig. 11. The radiative recombination rate is greater than the correspondent nonradiative rate up to 70 °C and does not vary appreciably at temperatures between 2 and 80 °C, remaining in the range of (0.74–0.82) × 10
6
s
−1
. In contrast, there is a pronounced (almost 7-fold, from 0.16 × 10
6
to 1.12 × 10
6
s
−1
) monotonic increase in the rate of nonradiative recombination by increasing the temperature from 2 to 80 °C. Temperature-dependent crossover of the radiative and nonradiative rates occurs at 70 °C, at which temperature the PL QY is 50%. These results suggest that the temperature activation of PL quenching in their CDs is primarily caused by the activation of nonradiative relaxation channels [89].
Radiative (solid symbols, blue color) and nonradiative (hollow symbols, red color) recombination rates for CDs plotted against the temperature for temperatures of 2–80 °C. (Reproduced from supporting information of reference [89])
Guo et al. [102] ascribed the thermal-quenching of their prepared carbon dots not just to activation of the nonradiative decay process, but also to the occurrence of nonradiative trapping with increasing temperature. They measured the temperature-dependent decay lifetimes of the CDs and shown in Fig. 12a. The data were collected by monitoring emission maximum as a function of the temperature under the 320 nm laser excitation. The result shows that the PL lifetime drops from 15.03 to 11.70 ns with the temperature increasing from 283 to 343 K, which could be ascribed to the occurrence of nonradiative decay processes. Besides, the PL relaxation dynamics of the CDs reveal multi-exponential decay with temperature increasing, which suggests the photoexcited carriers following the complicated relaxation processes. The occurrence of non-radiative trapping will be increased with rising temperature, and this could be quantitatively analyzed by the Arrhenius plot of the integrated PL intensities as:
Temperature-dependent decay curves of CDs solution (a , λex =350 nm, λem =450 nm); the dependence of ln[(I 0/I T)-1] on 1/kT CDs solution (b )。 (Reproduced from reference [102])
其中 E a is the activation energy, k is the Boltzmann constant, and a is a constant. Figure 12a displays the plotting of the emission intensity with respect to 1/T , where the value of activation energy (E a) is calculated to be 0.329 ± 0.02 eV. In order to probe the reason for thermal quenching of CDs emission process, the radiative (V r) and nonradiative (V nr) recombination rates of CDs were determined from the lifetime (τ*) and quantum yield (QY) as:
The QY of CDs at various temperatures was calculated from their temperature-dependent absorption and integrated PL intensity with the QY determined at room temperature. They have noticed that the radiative rates have a slight decline when the temperature rises from 283 to 343 K; at the same time, the nonradiative recombination rates have gradually increased by about 2-fold. These results further indicate that the temperature-activated PL quenching in CDs is mainly due to the activation of nonradiative relaxation channels [102].
Other groups used microscopic and spectroscopic techniques to understand the mechanism of thermos-sensing of carbon dots.
Wang at el. used TEM and UV–Vis spectra to study the temperature-responsive PL behavior of prepared CDs. As shown in Fig. 13a, the CDs display no change in the UV–Vis spectra upon increasing the temperature from 20 to 80 °C. However, it was found that the average diameter of CDs increased from 2.6 ± 0.2 nm at room temperature to 4.4 ± 0.2 nm at 80 °C (Fig. 13b). Thus, increasing the temperature, the aggregation of as-prepared CDs occurred which caused the obvious fluorescence quenching [1].
一 UV–Vis absorption spectra of CDs in aqueous solution under 20 and 80 °C. b the TEM image of CDs in aqueous solution (a ) at room temperature, the average size was 2.6 ± 0.2 nm (b ) at 80 °C, and the size increased up to 4.4 ± 0.2 nm. (Reproduced from reference [1])
He et al. [101] reported that the hydration particle size of their CDs emerges as larger with the increase in the temperature (Fig. 14a), which indicates that the temperature rise gives rise to the aggregation of the CDs, eventually results in the fluorescence quenching. Nonetheless, with the decline in the temperature, the hydration particle size of CDs starts declining (Fig. 14b), which indicates that the cooling has the potential of causing CDs to depolymerize [101].
Change of hydrated particle size of carbon dots during heating (a ) and cooling (b )。 (Reproduced from reference [101])
Another group such as Cui et al. also attributed the fluorescence quenching to the aggregation of CDs. They also tried to apply the undoped CDs synthesized using only acrylic acid as a precursor in temperature sensors. Unfortunately, undoped CDs possessed weaker quenching effects under the same temperature elevation than doped CDs [92].
杨等人。 [94] in their work proposed two key factors concerning the temperature-dependent PL property of the N-CDs, including (i) surface functional groups and (ii) hydrogen-bonding interaction. To examine the effect of the first factor, the surface O-containing groups, another control experiment was conducted by treating N-CDs (4.0 mL) with a strong reducing agent NaBH4 (1.0 mL, 0.1 mol L
−1
) to remove C=O species on carbon dots surface. The obtained reduced N-CDs are denoted as r-N-CDs for brevity. Compared with N-CDs, the r-N-CDs exhibit weaker fluorescence intensity (Fig. 15a). Besides, the fluorescence intensity of r-N-CDs only decreases by 13% with temperature increasing from 20 to 80 °C (the inset in Fig. 15a) that gives a much lower temperature sensitivity, which is ascribed to the decreased O-containing groups [94].
一 PL spectra (excitation wavelength, 400 nm) of N-CDs (black trace) and r-N-CDs (red trace). The inset shows I /I 0−T of reduced N-CDs. b PL spectra (excitation wavelength, 400 nm) of N-CDs dispersed in C2H5OH at various temperatures. c A schematic mechanism for the temperature-dependent fluorescence intensity of N-CDs. (Reproduced from reference [94])
The second factor, the effect of hydrogen bonding with the solvent on fluorescent behavior of N-CDs was explored. N-CDs solution (1.0 mL) was dropped on a filter paper and left to dry in the air to obtain a solid sample, which still emits bright fluorescence. However, no obvious change of fluorescence intensity of the solid N-CDs with temperature increase was observed. They also measured the fluorescence of N-CDs dispersed in ethanol. The fluorescence intensity of N-CDs in C2H5OH is lower than that in water and little variation of the PL intensity is observed with temperature increasing from 20 to 80 °C (Fig. 15b). Hence, the strong hydrogen bonds play a key role in the temperature-dependent PL property of the N-CDs. Figure 15c is a schematic mechanism for the temperature-dependent fluorescence intensity of N-CDs [94].
However, our group used the same experimental strategy as Yang group; in both cases, the r-CDs and e-CDs emissions were quenched linearly with increasing temperature, in the same way as the original results of their CDs (Fig. 16). Thus, our results ruled out the synergistic effects of abundant oxygen-containing functional groups and hydrogen bonds [77].
一 , b Fluorescence spectra of reduced CDs (r-CDs) and CDs in ethanol (e-CDs) at temperatures (20 to 60 °C). c , d Linear correlation between fluorescence intensity and temperature (°C) for r-CDs and e-CDs respectively. (Reproduced from the supplementary information of reference [77])
In literature, only a few articles explored the temperature-responsive fluorescent properties of CDs in biological imaging. Prior to such experimentations, in vitro cytotoxicity analysis is crucial for CDs because they make it possible to estimate the CD’s toxicity in living subjects. In vitro cytotoxicity analysis evaluates the effect or influence of the nanomaterial on cultured cells [89].
杨等人。 [94] verified that the CDs could be used as an effective thermometer in living cells; HeLa cells were washed with PBS after treatment with CDs for 6 h. Bright-blue fluorescence of the CDs in HeLa cells is observed when the temperature is 25 °C as shown in Fig. 17a. With the temperature increasing to 37 °C, the blue fluorescence becomes weaker (Fig. 17b), the fluorescence of N-CDs is recovered when the temperature was decreased to 25 °C (Fig. 17c). As a thermos-imaging in vivo, the fluorescent images of mice were collected immediately after being injected with N-CDs at different temperatures. By setting the fluorescence intensity at 28 °C as the reference (I o), I /I o of the area where CDs were injected varies from 1.0 to 0.87 with the increase of temperature from 28 to 34 °C (Fig. 17d, e). With temperature further increasing to 43 °C, I /I o declines to 0.52 and the fluorescence becomes nearly undetectable (Fig. 17f). And I /I o can be reversibly enhanced back from 0.66 to 1.0 with the temperature decreases from 39 to 28 °C (Fig. 17g–i). All of these results indicated that N-CD could be used as an effective in vitro and in vivo nanothermometer [94].
a–c Fluorescent images of a single Hela cell at 25, 37, and 25 °C after treatment with N-CDs, respectively. d –f Fluorescent photographs of a mouse given an injection of N-CDs at increasing temperatures. g –我 Fluorescent photographs of a mouse given an injection of N-CDs at decreasing temperatures. ( Reproduced from reference [94])
In an exploratory experiment, Kalytchuk et al. tested the capacity of CDs for intracellular temperature monitoring in human cervical cancer HeLa cells. Figure 18 shows the measured intracellular temperatures of HeLa cells incubated with CDs (500 μg/mL). The CDs’ PL decay curves at each temperature were highly reproducible and could be fitted with a single-exponential function at all recorded temperatures. In Fig. 18a, the recorded PL decay curves for temperatures between 25 and 50 °C (with a step size of 5 °C) are indicated by symbols, while the corresponding single-exponential fits are represented by solid lines. They were able to confirm that the PL signal in these PL lifetime measurements was derived exclusively from the CDs for the CD concentration of ≥ 100 μg/mL. The intracellular temperature in each measurement was determined from the calibration curve between PL lifetimes as the temperature increases from 2 to 80 °C. The temperatures determined in this way (T meas) are plotted as functions of the PL lifetime in Fig. 18b. Independently, the temperature of the cell solution was determined using a calibrated reference thermometer (shown in Fig. 18b as Tset). The temperatures reported by the luminescent CD probe and the reference detector are in good agreement. These results show that the PL lifetime of nanoprobes based on CDs can be reliably used to measure intracellular temperatures [89].
In vitro intracellular PL lifetime thermal sensing using CDs. 一 PL emission decays of HeLa cells incubated with CDs (500 μg/mL) at different temperatures (T set). b Temperatures determined using the calibration (T meas) and set temperatures (T set) plotted against the PL lifetime. c –f Applicability of CDs for long-term remote intracellular temperature monitoring. c PL lifetimes extracted from PL transients recorded every 15 min for 24 h of HeLa cells incubated with CDs (500 μg/mL). d Temperatures determined using the calibration curve. e Temperatures measured with a reference thermometer (T ref). f Histogram showing the distribution of temperature differences between the obtained and reference temperatures; the solid line is the distribution curve. (Reproduced from reference [89])
To further evaluate the potential of luminescent CD nanoprobes for long-term real-time temperature monitoring, PL decay profiles of HeLa cells incubated with CDs (500 μg/mL) every 15 min for 24 h were recorded. The PL lifetimes extracted from the measured PL decay values during this period were then plotted as functions of time, as shown in Fig. 18c. Using these results, the temperature variation over time was calculated using the calibration curve, as shown in Fig. 18d. In addition, the sample’s temperature at each measurement point was determined using a reference thermometer with a temperature reproducibility of 60 mK. The temperature determined with the reference thermometer is plotted in Fig. 18e, which shows that there was excellent agreement between the measured and reference temperatures. The high accuracy of the PL-based temperature measurements is further demonstrated by statistical analysis of the differences between the measured and real (reference) temperatures (Fig. 18f). Using these data, the absolute average accuracy of temperature detection by the presented method was calculated to be 0.27 °C. This experiment confirms the potential of CD-based thermal probes in biological systems [89].
Macairan et al. [29] displayed that the prepared CDs can be used for thermal sensing inside cells using intensity and ratiometric approaches. HeLa cells treated with CDs were allowed to equilibrate at 32, 37, and 42 °C (Fig. 19). Excitation at 640 nm was used to selectively monitor the red fluorescence of the CDs in the cells. The thermal changes could be due to changes in intracellular concentration or not correlate with a change in intensity (λex + 640 nm). This could be due to changes in intracellular concentration or localization of the CDs at higher temperatures. Thus, simply relying on changes in fluorescence intensity leads to accurate intracellular thermal sensing.
Fluorescence microscopy images of CD-treated HeLa cells. Fluorescence signals from the CDs (λex =640 nm; left and 405 nm; right) fluorescence ratios are 1.8 at 32 °C, 2.0 at 37 °C, and 2.3 at 42 °C. The control shows untreated HeLa cells at 42 °C with no fluorescence signal as expected. (Reproduced from reference [29])
In contrast, these limitations are excluded using the ratiometric approach. The CDs maintain dual blue and red fluorescence in cells following excitation at 405 nm, as previously observed for the colloidal dispersions (Fig. 19). The red-to-blue ratio increases with increasing temperature, with values of 1.8 at 32 °C, 2.0 at 37 °C, and 2.3 at 42 °C. The ratiometric relationship of the red-to-blue fluorescence of the CDs highlights the advantage of ratiometric temperature sensing in the development of fluorescent nano-thermometry probes. The relative red-to-blue emission ratio remains unaffected, regardless of the amount of CDs taken up by the cells, which can be affected by various factors such as confluency and is not concentration-dependent. Lastly, the CDs have shown fluorescence reversibility with respect to changes in intracellular temperature. Following incubation in HeLa cells, they were subjected to a heating/cooling cycle from 32/42/32 °C. This emphasizes the robustness of the proposed CD-nanothermometer and these findings further demonstrate the fluorescence reversibility [29].
Confocal laser scanning microscopy was used to thermal image colon cancer cell HT-29 using N, S, and I-doped CDs, as shown in Fig. 20 [100]. The fluorescent spots were temperature-dependent as shown in Fig. 20g–i, as the most intense is at 15 °C, while the weakest point was at 35 °C. Interestingly, the fluorescence spots were reversible, and the spots were very photostable after 20 min of continuous excitation [100]. Shin et al. [96] also used confocal laser scanning microscopy for Hela cells, shown in Fig. 20e–g.
a–d Are confocal microscopy images of N, S, I-CDs-colon cancer cell HT-29 with corresponding fluorescence field at 15, 25, 35, and 15 °C, respectively. (Reproduced from reference [100]). e –g Confocal microscopy images of N, S-CDs-stained cells with corresponding fluorescence field at 25, 35, and 25 1C, respectively. (Reproduced from reference [96])
李等人。 103 prepared a nanocomposite composed of MnOx-CDs to be used as a nano thermos responsive fluorophore for biological environments. HepG2 cells were incubated with MnOx-CDs at different culture temperatures. As illustrated by confocal laser scanning microscopy (excited at 405 nm), the blue luminescence of the MnOx-CDs in the HepG2 cells is weak when the environmental temperature was 40 °C (Fig. 21a), and the blue luminescence of the MnOx-CDs in HepG2 cells enhances as the temperature decreased to 30 °C (Fig. 21b) even to 20 °C (Fig. 21c). Due to the temperature-responsive properties, the as-synthesized MnOx-CDs can be readily applied in the biomedical fields like bioimaging and photothermal therapy in cancer treatment [103].
Confocal laser scanning microscopy images (excited at 405 nm) of MnOx-CDs in HepG2 cells at 40 °C (a ), at 30 °C (b ), and 20 °C (c )。 (Reproduced from reference [103])
Carbon nanodots exhibit unique properties to be exploited for nanothermometry, such as thermal-sensitivity, low-cost, and photostability. Flexible surface modification and facile preparation will pave the way to establish an enormous number of thermal sensitive nanomaterials for a variety of applications. The overall trends in thermo-sensing nanomaterials are aimed at enhancing photostability and thermal-resolution with using low-cost and safe materials. CDs can be classified as a new generation of thermometer that can fulfill these requirements and can be used for biomedical thermometry applications, such as temperature monitoring during hyperthermia treatment. Facile-preparation protocols, biocompatibility, and easy functionalization of CDs are promising criteria which make the CDs alternative next-generation nanothermometer materials. More efforts are required to promote basic research in this field. Limitations should be overcome to produce carbon dot-based nanothermometers comprising enhancing thermal sensitivity, and working in a broader range of temperature. A better understanding of the fluorescence thermal-sensing mechanism is another key issue to be able to design and manipulate the structure of CDs and enhance thermal resolution. More experiments and theoretical modeling are necessary to understand the correlation between the methods of fabrication of CDs with their thermal behavior.介绍
纳米测温
碳点作为纳米温度计


Mechanism of Thermo-sensing


Bioimaging in Living Cells (Thermal Imaging)


Conclusions and Future Perspective
纳米材料