

COVID-19 和 PM10 级别!
组件和用品
 |
| × | 1 | |||
| × | 1 | ||||
| × | 1 | ||||
| × | 1 | ||||
| × | 1 | ||||
| × | 1 | ||||
| × | 1 | ||||
| |
| × | 1 | |||
 |
| × | 1 | |||
| × | 1 | ||||
 |
| × | 3 | |||
| × | 4 | ||||
| × | 1 | ||||
| × | 3 | ||||
| × | 3 | ||||
| × | 1 | ||||
| × | 1 | ||||
 |
| × | 1 |
必要的工具和机器
 |
| |||
 |
| |||
 |
| |||
 |
| |||
 |
|
应用和在线服务
 |
|
关于这个项目
摘要
实验研究表明,颗粒物可能作为 COVID-19 病毒感染传播的“载体”。
这意味着病毒可以通过悬浮在空气中的细颗粒携带更远的距离,并且可以在微小颗粒中存活数小时、数天甚至数周。因此,空气污染颗粒可能有助于冠状病毒在空气中传播得更远,从而增加感染人数。
在 意大利北部的封锁并没有显着减少颗粒物,因为除工厂和汽车外,集约化养殖场也大量获得颗粒物。因此,即使在封锁期间工厂关闭且汽车不流通,伦巴第(意大利)的颗粒物浓度在任何情况下仍然很高,因为位于其领土内的集约化养殖场继续生产粪便,因此污染空气,以及其他颗粒物。
科学家和研究人员表示,较高水平的颗粒污染可以解释意大利北部部分地区感染率较高的原因。
简介
几周前,我看了一个名为“报告”的意大利电视节目。这是意大利电视台在第三频道(RAI 3)播出的调查节目。
一篇有趣的文章引起了我的注意……它是关于污染的,特别是关于集约化畜牧业造成的一种污染。 (点此查看对应部分:27:25分至56:00分)
集约化畜牧业是指将大量动物(如牛、猪、火鸡或鸡)集中在相对较小的空间内的农业系统。目标是以尽可能低的成本生产大量的肉、蛋或牛奶。它们也被称为“工厂农场”。
在过度拥挤的工厂式农场饲养的动物会产生大量的动物粪便,如尿液和粪便。粪便通常储存在巨大的露天池塘中,通常有几个足球场那么大,容易泄漏和溢出,污染土壤并污染供水。动物粪便还会向大气排放有害气体(如氨、内毒素、硫化氢和甲烷)并释放大量颗粒物(PM10和PM2.5;PM10是“直径≤10微米的颗粒物”的缩写, PM2.5 是“直径 ≤ 2.5 µm 的颗粒物”的首字母缩写),造成环境问题。颗粒物包含微小的固体或液滴,它们非常小,可以被吸入并导致严重的健康问题。
当污水池达到饱和时,农民将未经处理的粪便作为肥料喷洒到周围的田地,从而将更多这些有害物质带入空气中。
未经处理的废物会以异味(臭味令人难以忍受)污染空气并造成健康问题,显着降低工人、附近和邻近社区的生活质量以及财产价值。研究表明,住在集约化养殖场附近的人患呼吸道疾病的风险要高得多,例如哮喘和慢性支气管炎。
在意大利,最密集的养殖场位于该国北部。伦巴第是集约化养殖场最集中的地区之一;因此,畜牧设施产生的粪便和动物粪便的数量非常多,并会产生大量的气体和颗粒物。
需要注意的是,在伦巴第,85% 的氨气是由粪便产生的:农场污染和汽车污染一样。
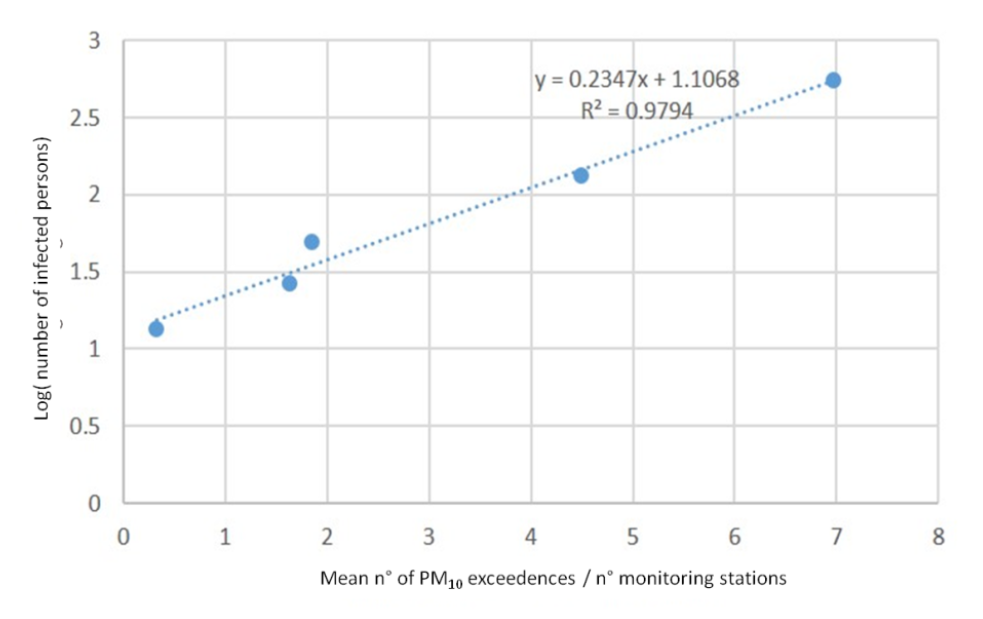
由意大利几所大学的研究人员进行并于去年 3 月发表的一项研究,标题为“颗粒物 (PM) 污染与 COVID-19 感染在意大利传播之间的潜在关系的评估 ”(在以下链接可以下载立场文件:https://www.simaonlus.it/?page_id=694,直接链接到英文 pdf http://www.simaonlus.it/wpsima/wp- content/uploads/2020/03/COVID_19_position-paper_ENG.pdf - 我推荐阅读它!)谈到颗粒物浓度水平与 COVID-19 感染人数之间可能存在的相关性(如下图所示) .
研究人员收集并分析了以下数据:
- PM10 每日浓度水平(数据由区域环境保护局 - ARPA - 提供并在意大利各地收集);
- 每日 PM10 限值超标;
- 每个选定省份的 COVID-19 感染人数,由民防部门通报并每日更新。
并注意到在研究期间(2020 年 2 月 10 日至 29 日)期间,每日 PM10 超标与 COVID-19 感染的传播之间存在显着关系,冠状病毒病例 在北部 意大利,尤其是波河谷,尤其是伦巴第大区,而在意大利南部,病毒的传播和致死率与北部地区相比明显较低。
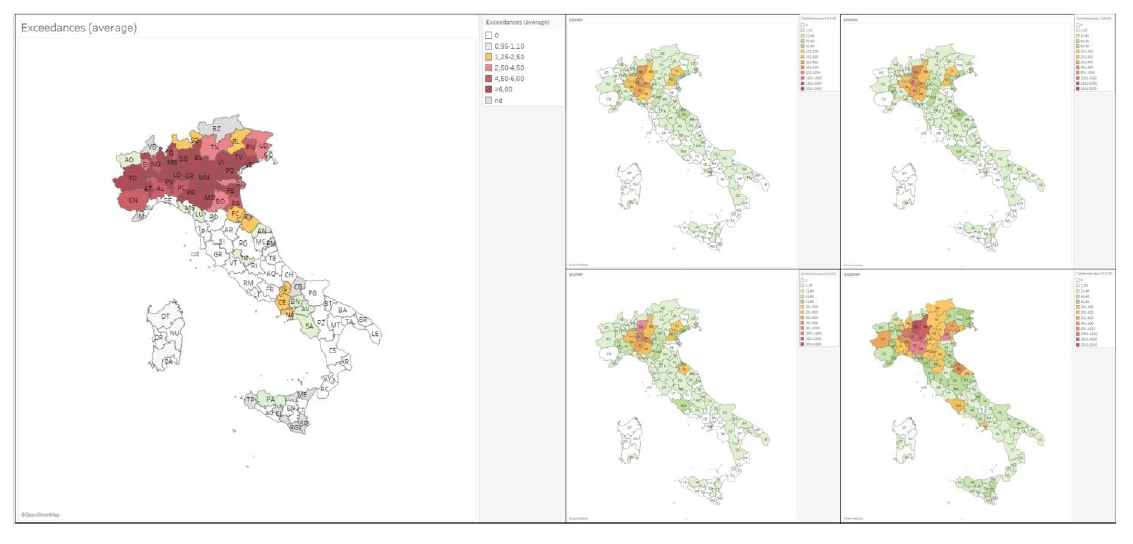
在这份立场文件中,可以阅读“有证据表明,Po Valley 通报了 COVID-19 暴发的集中程度,加强了 COVID-19 病例与 PM10 水平之间存在直接关系的假设 [在北部 意大利]高于意大利其他地区 ”(如下图所示,该图显示了意大利在 2 月 10 日至 2 月 29 日期间登记的 PM10 污染限值的超标情况,并且可以注意到 Po Valley 是意大利污染最严重的地区)。
值得注意的是,意大利的大多数冠状病毒病例都位于伦巴第大区,那里的集约化养殖场集中度非常高,因此产生的颗粒物数量巨大。
需要注意的是,即使在工厂完全关闭、汽车不流通的封锁期间,这种现象仍在继续。
根据这项研究,在意大利南部地区(污染较少),病毒传播的流行模式将通过人与人之间的接触发生(与基于典型传播模式“人与人接触”的流行模型一致),而在意大利北部地区(污染更严重),感染将以不同的方式传播,即通过载体(以悬浮在大气中的颗粒物为代表)。
与意大利中部和南部相比,以下感染扩展曲线突出了意大利北部在 COVID-19 感染传播方面的异常情况。
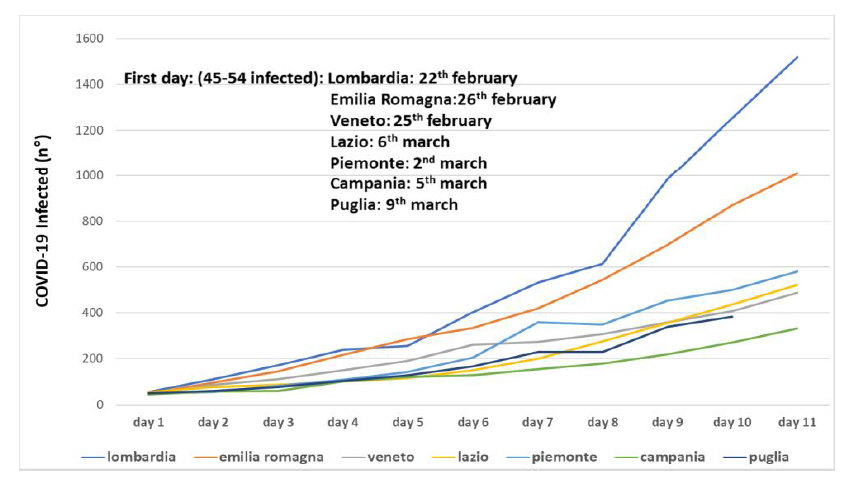
根据收集到的数据和观察到的关系,研究人员得出结论说,可以合理地假设,在 2020 年 2 月 10 日至 29 日期间,意大利北部特定地区记录的高 PM10 浓度水平对COVID-19 流行病的恶性传播,促进了 COVID-19 在暴露人群中的传播,这一现象在同期受污染影响的意大利其他地区未观察到。
其他研究表明,PM 会成为病毒的载体。事实上,病毒可能会附着在颗粒物上,这些颗粒物的小颗粒可以在气流中长距离传播,并在大气中停留数小时、数天甚至数周。
颗粒物也代表了一种基质,允许病毒在大气中保持活跃一段时间(数小时或数天)。环境因素对病毒在大气中的激活和持续存在起着重要作用:
- 高温和太阳辐射加速了不活动;
- 高相对湿度可能会促进扩散速度。
一项研究表明,当相对湿度保持在 50% 左右时,病毒在表面的存活率会降低,而当相对湿度值低于 40% 和高于 60% 时,病毒仍然保持活跃。
耶鲁大学的另一项研究表明,低湿度条件如何让受感染的颗粒更好地传播并存活更长时间(点击此处查看文章)。
我的解决方案
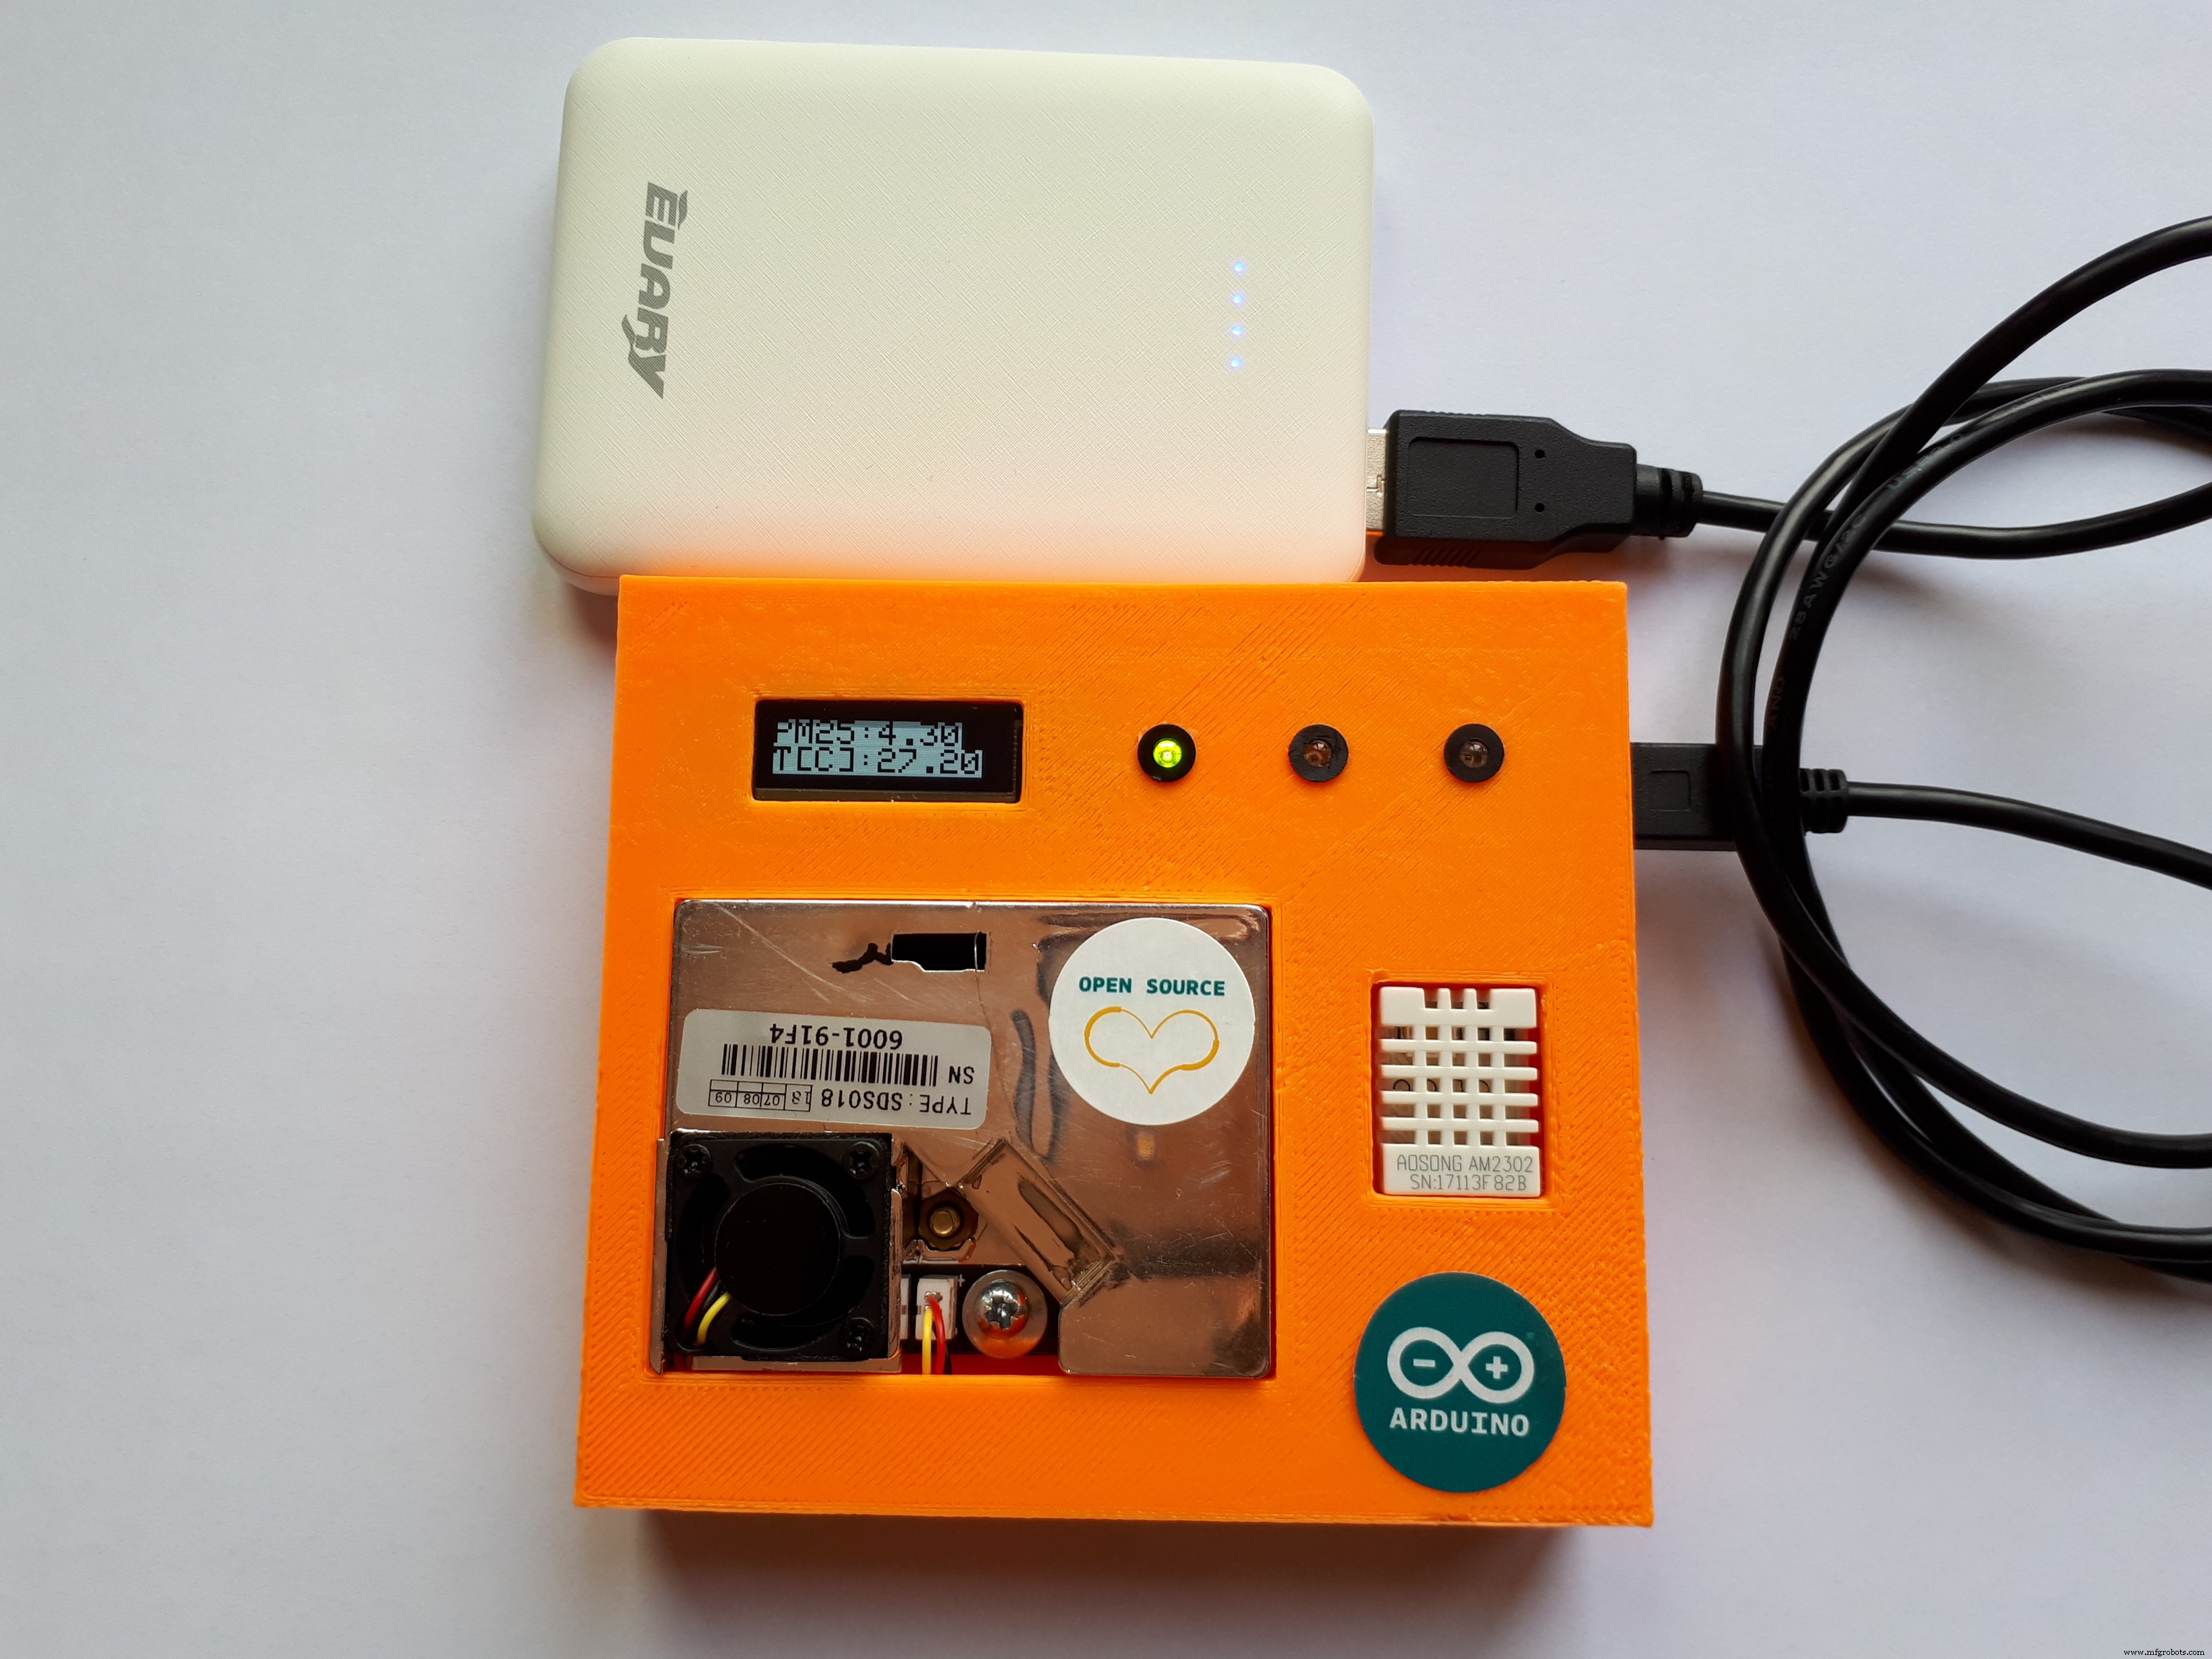
基于这些考虑,我想创建一种可复制、低成本且易于使用的设备,能够测量 PM10 浓度水平、温度和相对湿度(病毒感染传播所涉及的环境因素),以便在出现这些情况时向人们发出警告。值太高,对他们的健康有潜在危险,所以他们可以选择呆在家里不出去,或者,如果他们在外面,就回家,或者戴上口罩,即使人与人之间的距离远大于一米。
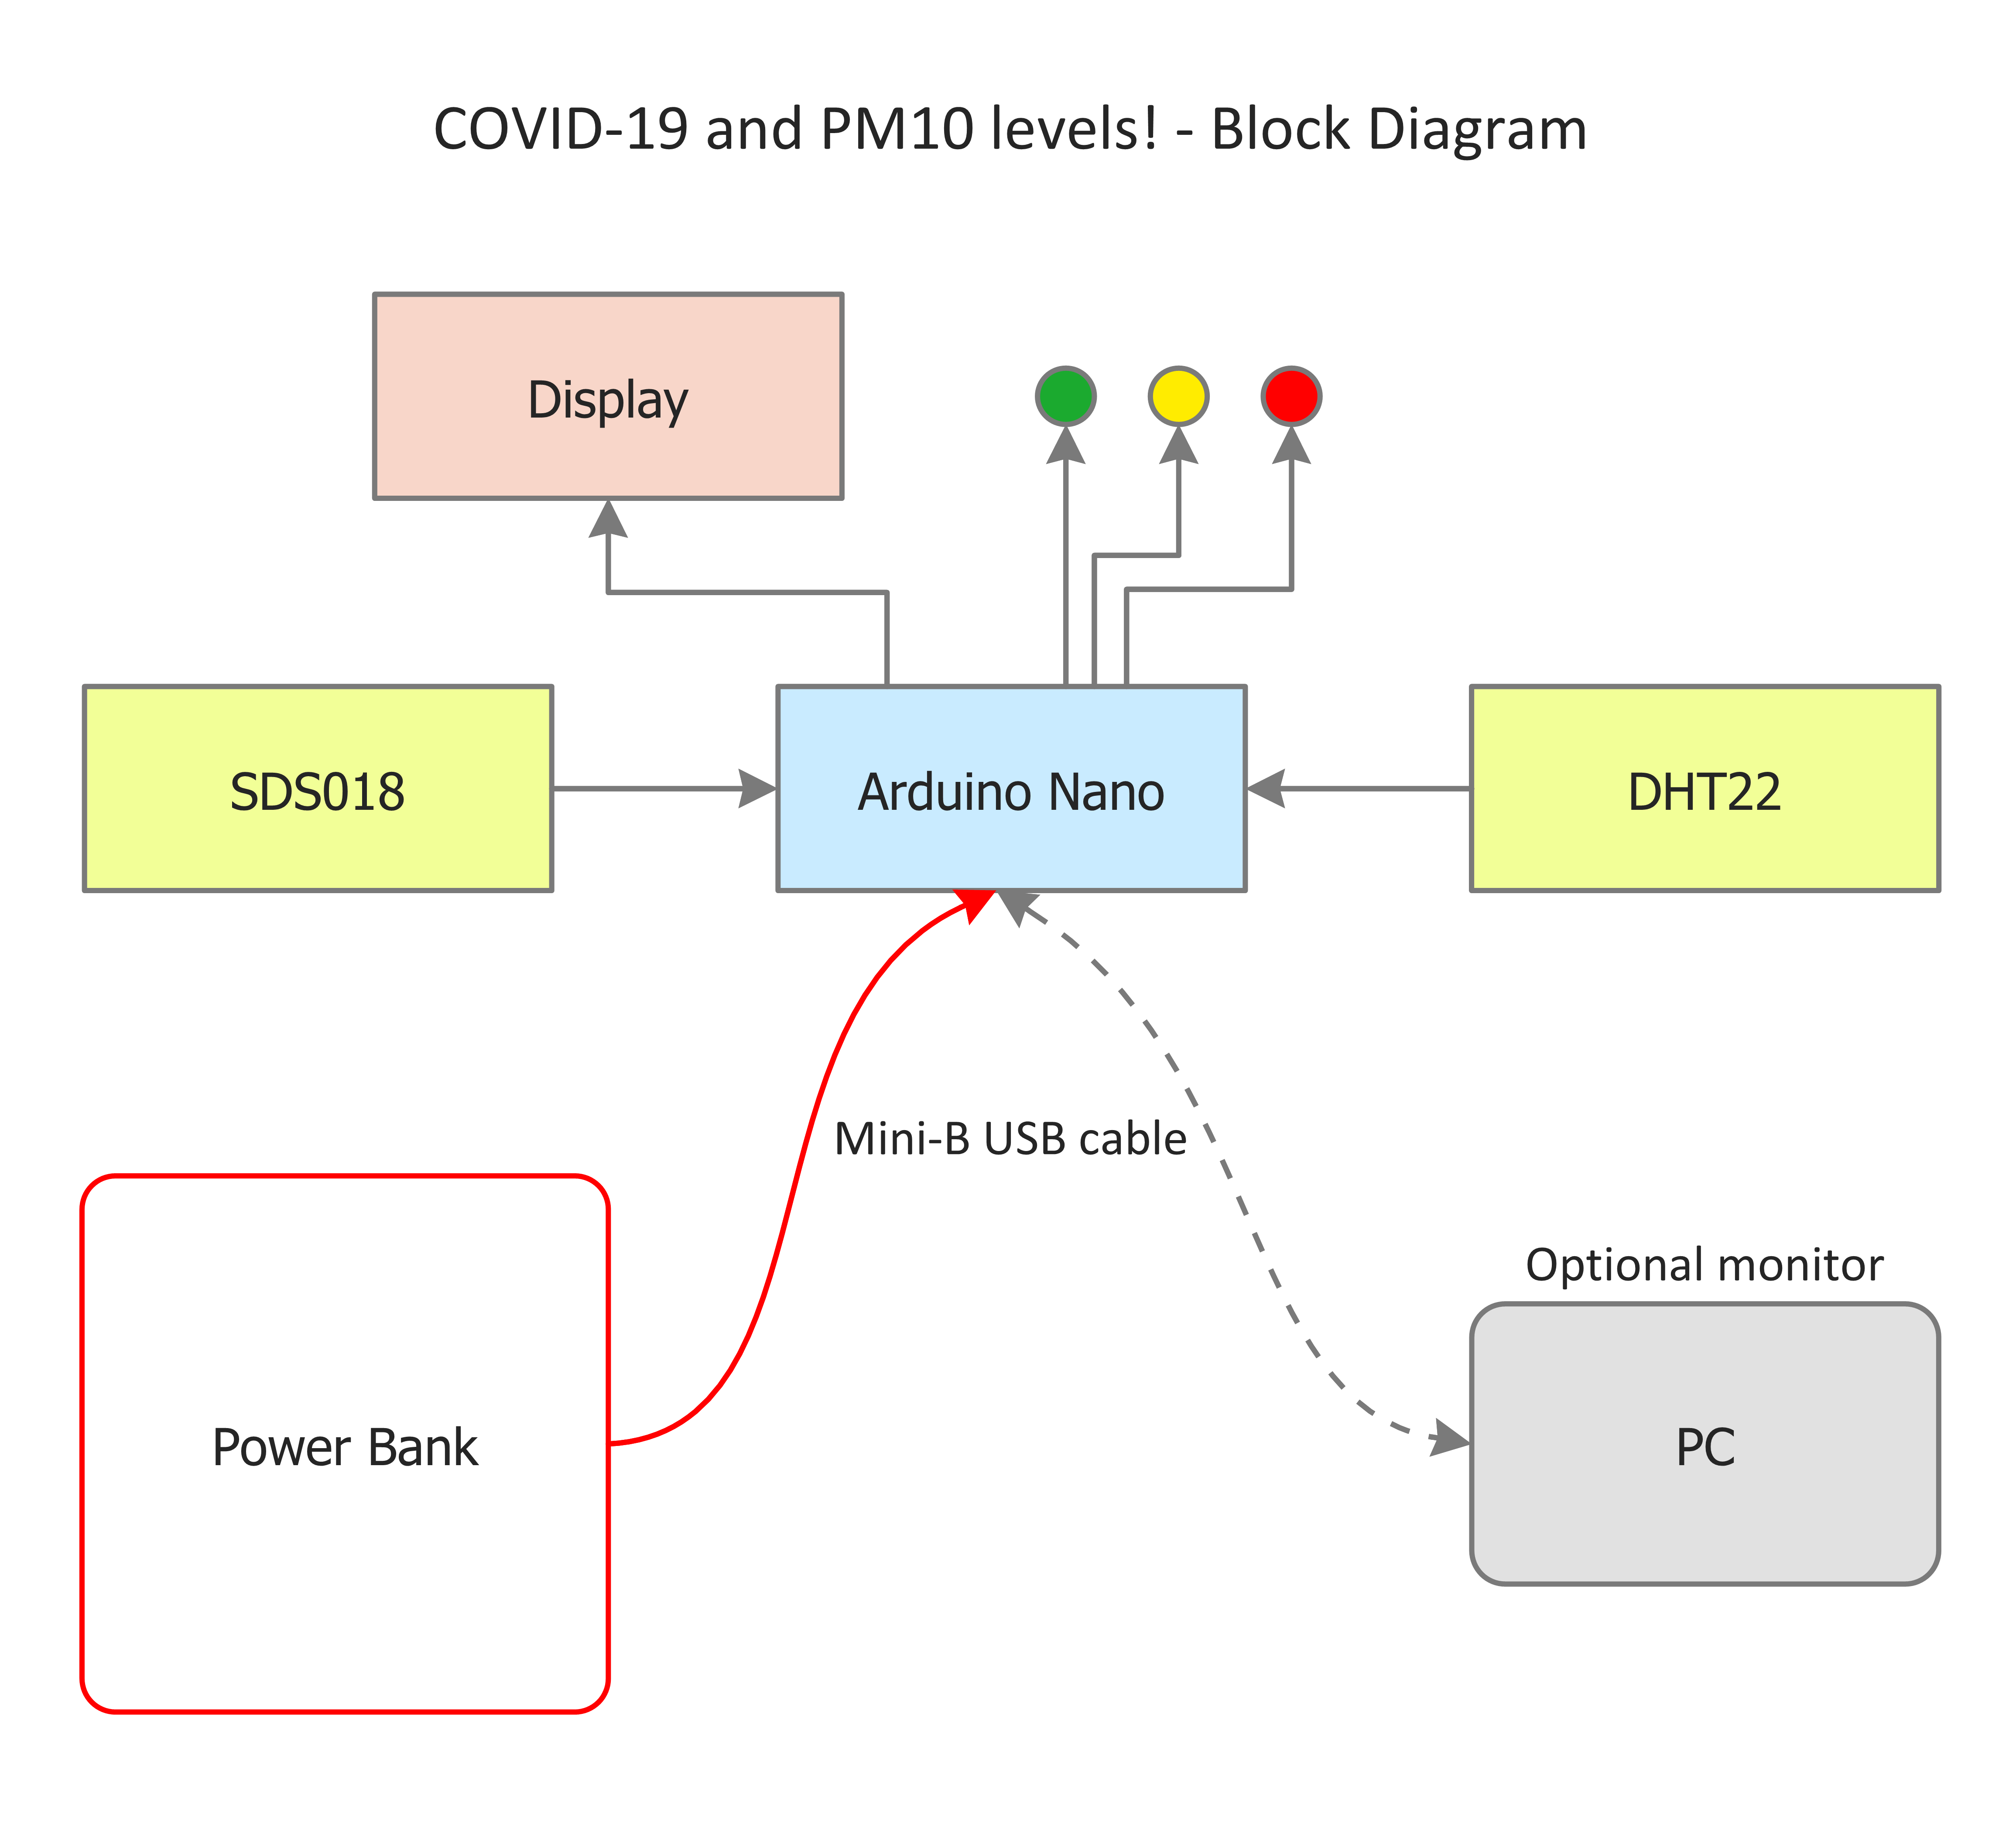
该设备由 PM10 传感器、温度和相对湿度传感器、显示器和三个 LED 组成,全部由 Arduino Nano 控制。传感器数据显示在显示屏上,LED 指示空气状况。
我已经确定了四种不同的情况:
1. 正常 – 颗粒物浓度为 0 至 25 µg/m3,湿度为 40% 至 60%;
2. 低 - 颗粒物浓度为 0 至 25 µg/m3,湿度 <40% 或> 60%;
3. 低 - 颗粒物浓度为 26 至 50 µg/m3,湿度为 40% 至 60%;
4. 警告 - 颗粒物浓度为 26 至 50 µg/m3,湿度 <40% 或> 60%;
5. 警告 - 颗粒物浓度> 51 µg/m3,湿度在 40% 到 60% 之间;
6. 报警 - 颗粒物浓度> 51 µg/m3 和湿度 <40% 或> 60%。
相关 LED:
- 正常:LED 关闭;
- 低:绿色 LED 亮起;
- 警告:绿色和黄色 LED 亮起;
- 警报:绿色、黄色和红色 LED 亮起。

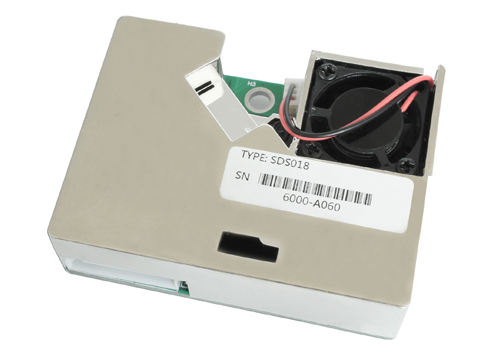
SDS018 - PM10 传感器
SDS018利用激光散射原理,可以获得空气中0.3~10μm的颗粒浓度。数字输出,内置风扇,稳定可靠。
- 准确可靠:激光检测,稳定,一致性好;
- 快速响应:场景变化时响应时间小于10秒;
- 易于集成:UART输出(或可定制IO输出),内置风扇;
- 高分辨率:0.3μg/m3 的分辨率;
- 认证:产品已通过 CE/FCC/RoHS 认证。
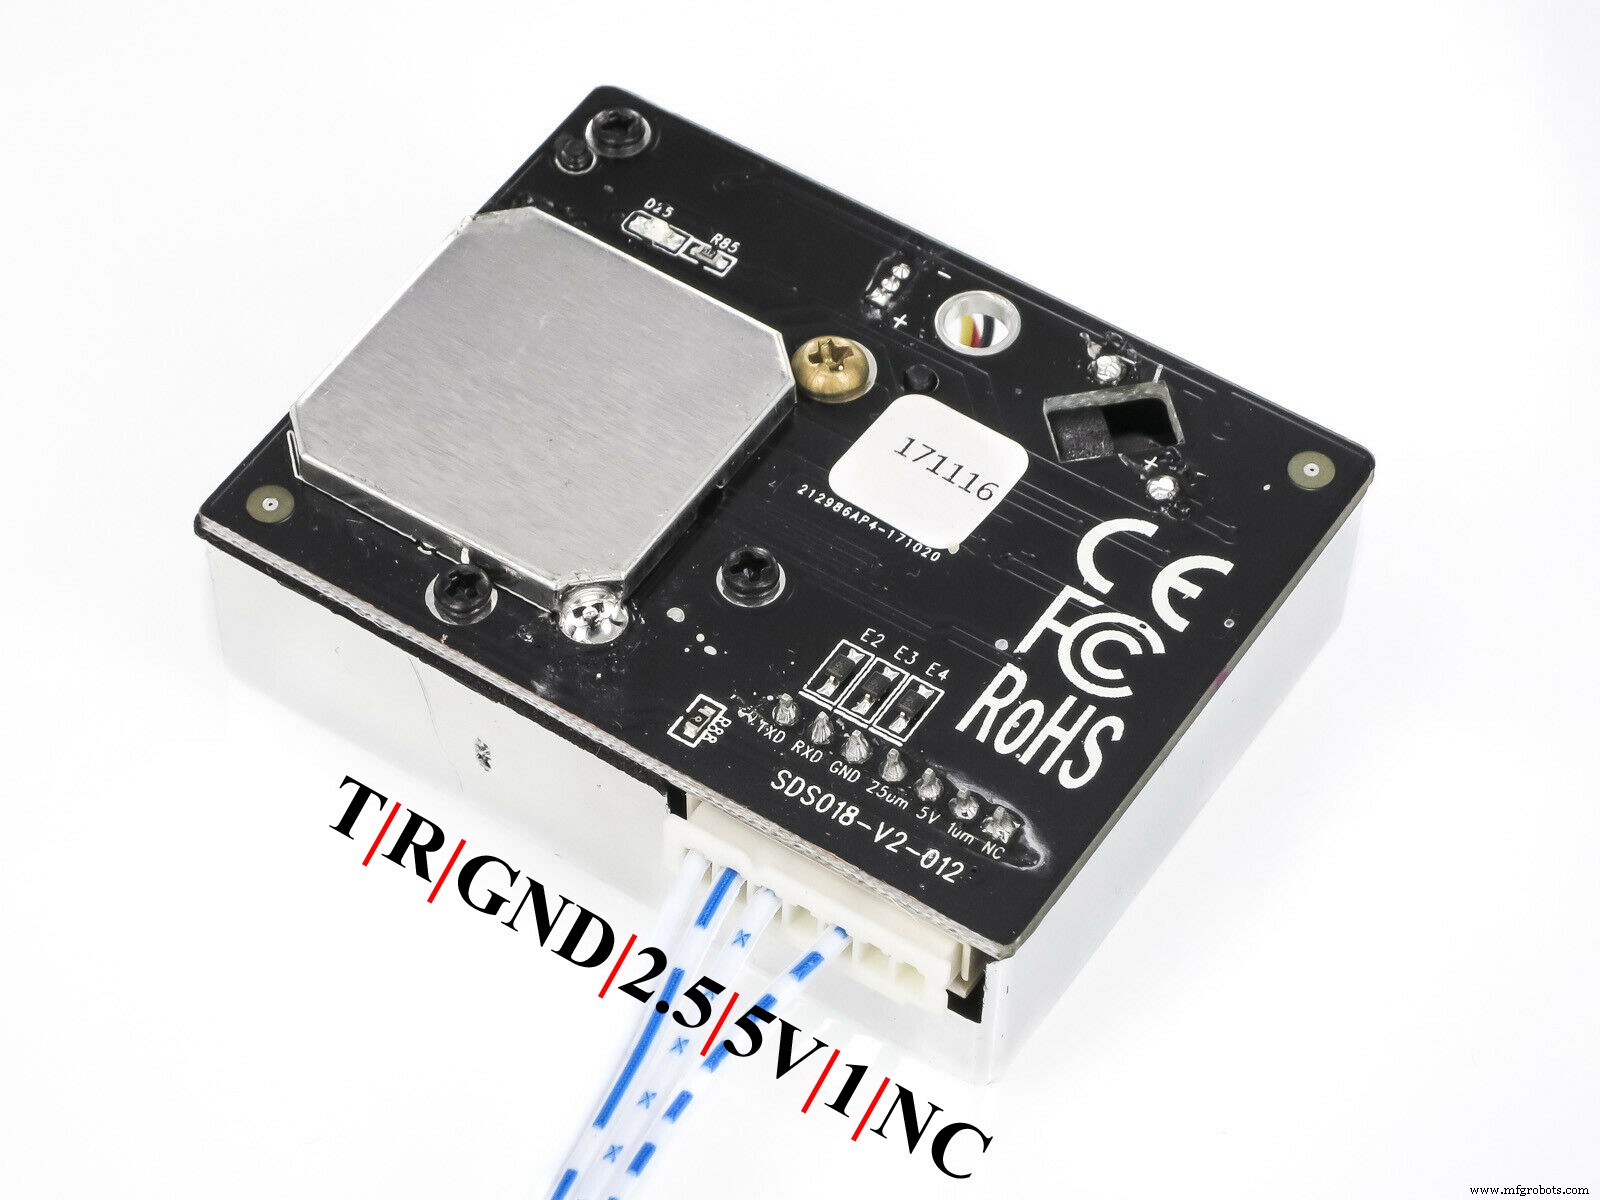
SDS018 传感器引脚:
- 1 - NC:未连接;
- 2 - 1um:PWM 输出;
- 3 - 5V:电源;
- 4 - 2.5um:PWM 输出;
- 5 - GND:接地,接负极;
- 6 - R:UART 的 RX (TTL);
- 7 - T:UART 的 TX (TTL)。
SDS018 传感器与 Arduino Nano 的连接
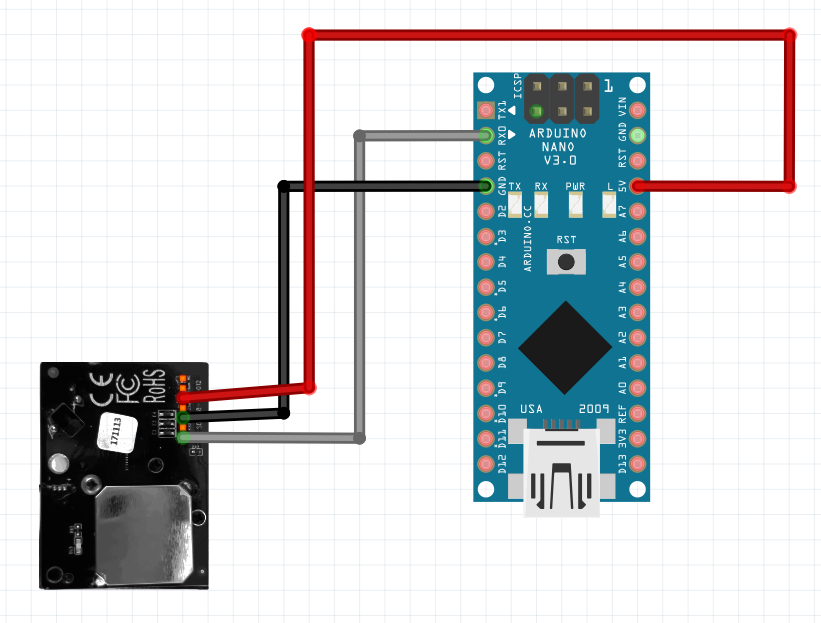
- SDS018 传感器的 5V (3) 引脚连接到 Arduino Nano 的 5V 引脚;
- SDS018传感器的GND(5)引脚连接到Arduino Nano的GND引脚;
- SDS018传感器的T(7)引脚连接到Arduino Nano的RX引脚;
DHT22传感器
DHT22 是数字温度和相对湿度传感器。主要特点是:
- 3 至 5V 电源和 I/O;
- 转换期间(请求数据时)使用的最大电流为 2.5mA;
- 0-100% 湿度读数,精度为 2-5%;
- -40 至 80°C 温度读数 ±0.5°C 精度;
- 0.5 Hz 采样率(每 2 秒一次)。
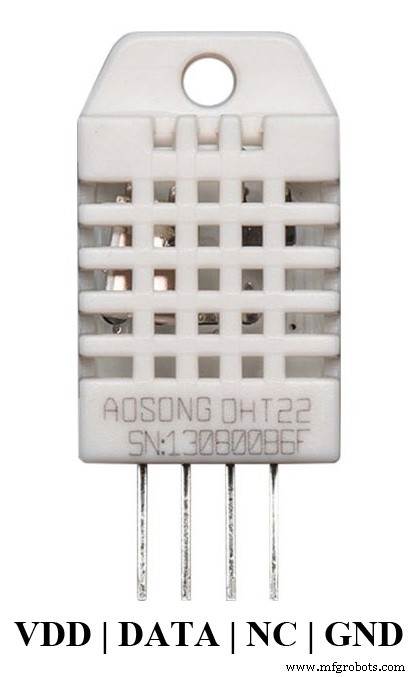
DHT22 传感器引脚:
- VDD:电源;
- DATA:信号数据输出;
- NC:未连接;
- GND:接地,接负极。
DHT22 传感器与 Arduino Nano 的连接
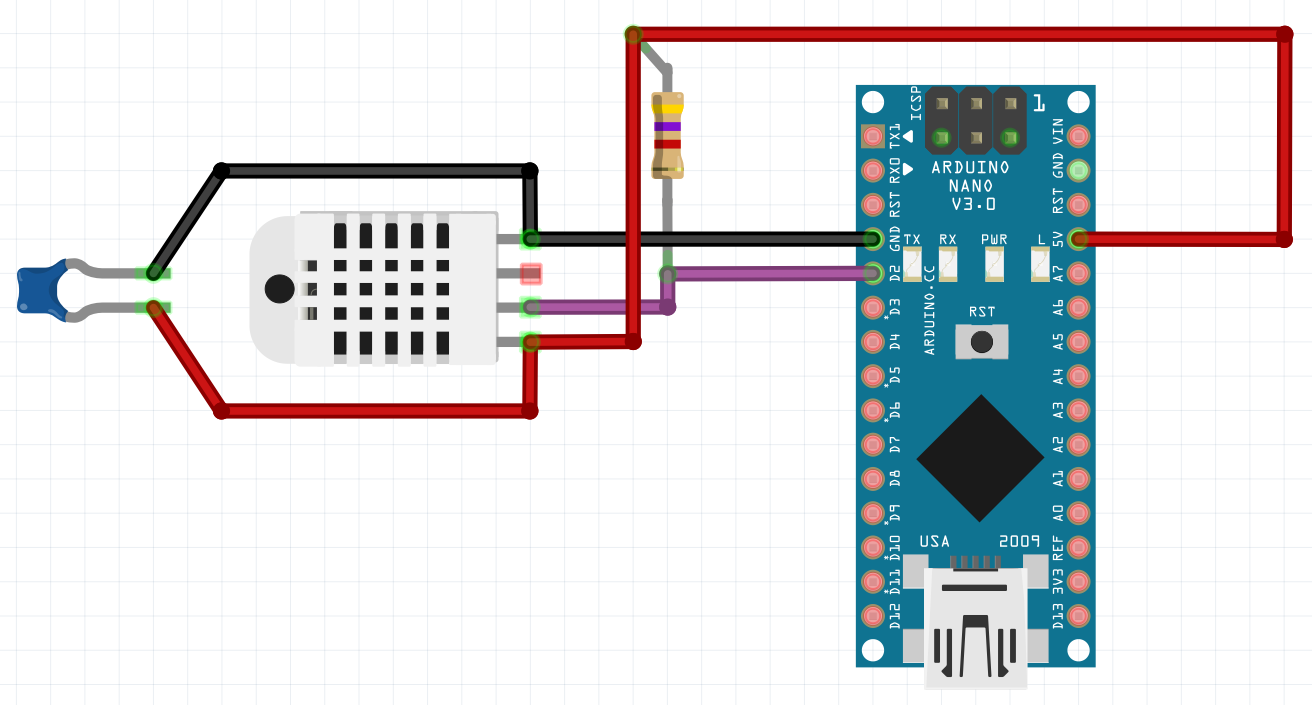
- DHT22 传感器的 VDD 引脚连接到 Arduino Nano 的 5V 引脚;
- DHT22 传感器的 GND 引脚连接到 Arduino Nano 的 GND 引脚;
- 在 DHT22 传感器的 VDD 和 GND 引脚之间插入了一个 100nF 的电容器;
- 在 DHT22 传感器的 DATA 和 VCC 引脚之间插入了一个 4.7k 上拉电阻;
- DHT22 传感器的 DATA 引脚连接到 Arduino Nano 的 D2 引脚。
Arduino IDE
我已经安装了 Adafruit 的 DHT 传感器库 - 版本 1.3.10
点阵 OLED 显示屏
- VCC:3.3-5V;
- 分辨率:128x32 像素;
- 黑底白字;
- 驱动程序:SSD1306;
- 接口:I2C。

OLED I2C 显示引脚:
- SDA:I2C 串行数据;
- SCL:I2C 串行时钟;
- VCC:电源;
- GND:接地,接负极。
OLED I2C 显示器与 Arduino Nano 的连接
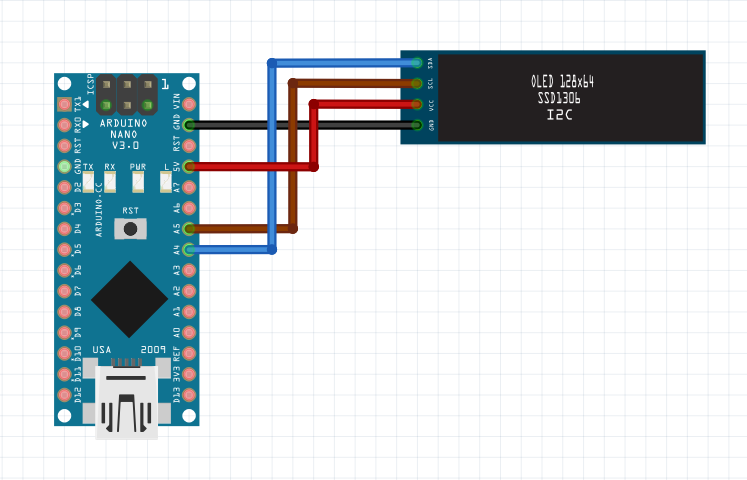
- 显示器的VCC引脚连接到Arduino Nano的5V引脚;
- 显示器的GND引脚连接到Arduino Nano的GND引脚;
- 显示器的SCL引脚连接到Arduino Nano的A5引脚;
- 显示器的 SDA 引脚连接到 Arduino Nano 的 A4 引脚。
Arduino IDE
我已经安装了 Adafruit 的 Adafruit SSD1306 库 - 版本 2.2.1
LED 连接
我使用了三个 3mm LED:红色、绿色和黄色。
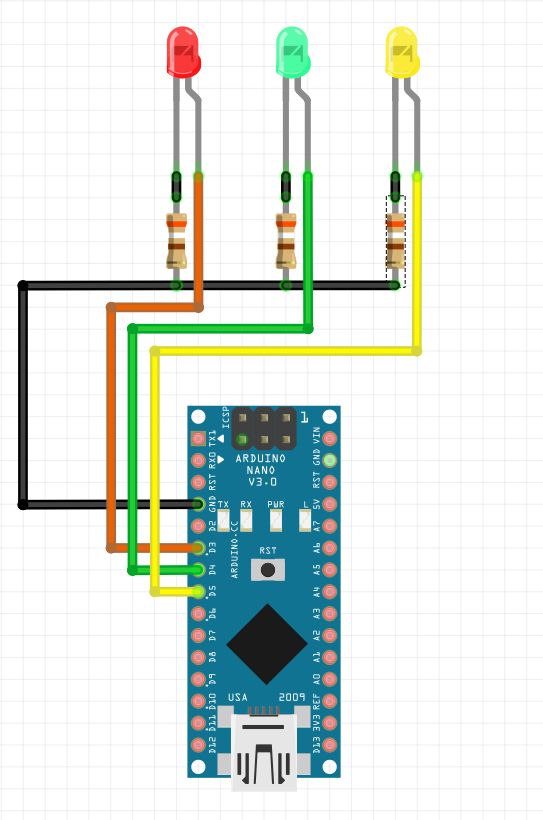
- 红色LED的阳极连接到Arduino Nano的D3引脚;
- 绿色LED的阳极连接到Arduino Nano的D4引脚;
- 黄色LED的阳极连接到Arduino Nano的D5引脚;
- 我将一个 390 欧姆电阻串联焊接到每个 LED 的阴极,并将电阻的另一个引脚连接到 Arduino Nano 的 GND。
Arduino nano - 硬件修改
为了读取 SDS018 的串行输出,我修改了 Arduino Nano。
下图红色箭头处的贴片电阻我已经拆掉了。
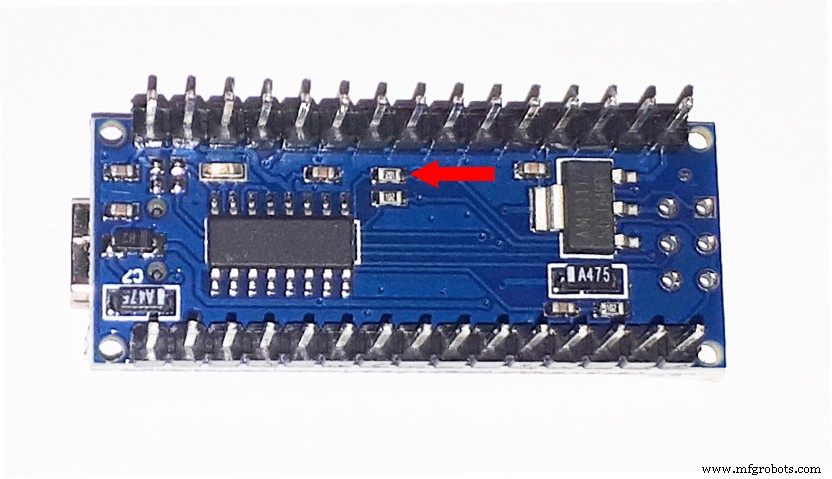
我已经垂直焊接了 SMD 电阻器,然后我将两根电线焊接到电阻器上。我在电线末端焊接了一个排针。
仅当我对 Arduino Nano 进行编程时,我才在引脚接头上插入了跳线。这样,当跳线被移除时,Arduino Nano 可以从 SDS018 传感器读取数据,同时它可以将数据发送到 Arduino IDE 串口监视器。
或者更简单地说,在对 Arduino Nano 板进行编程后,您可以永久移除电阻器,但这样将无法再对 Arduino Nano 板进行重新编程。
电源
Arduino Nano 可以通过两种不同的方式供电:
- USB;
- Vin 引脚(和 GND 引脚):7-12V。
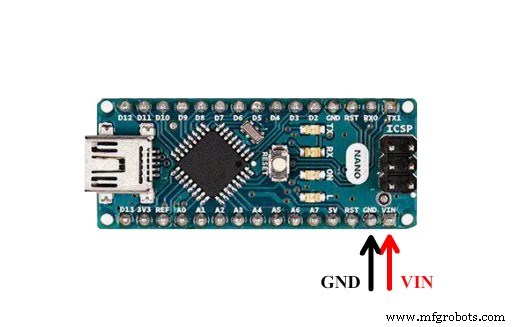
我通过移动电源通过 USB 为电路板供电。
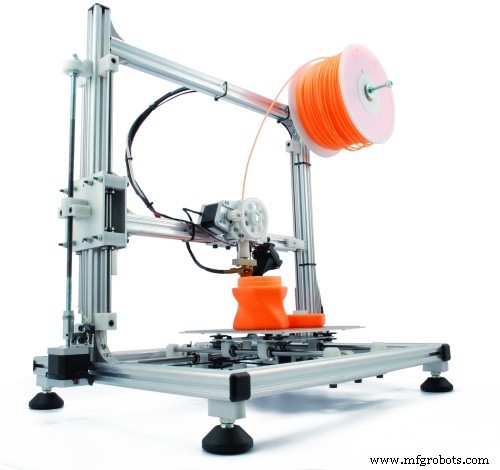
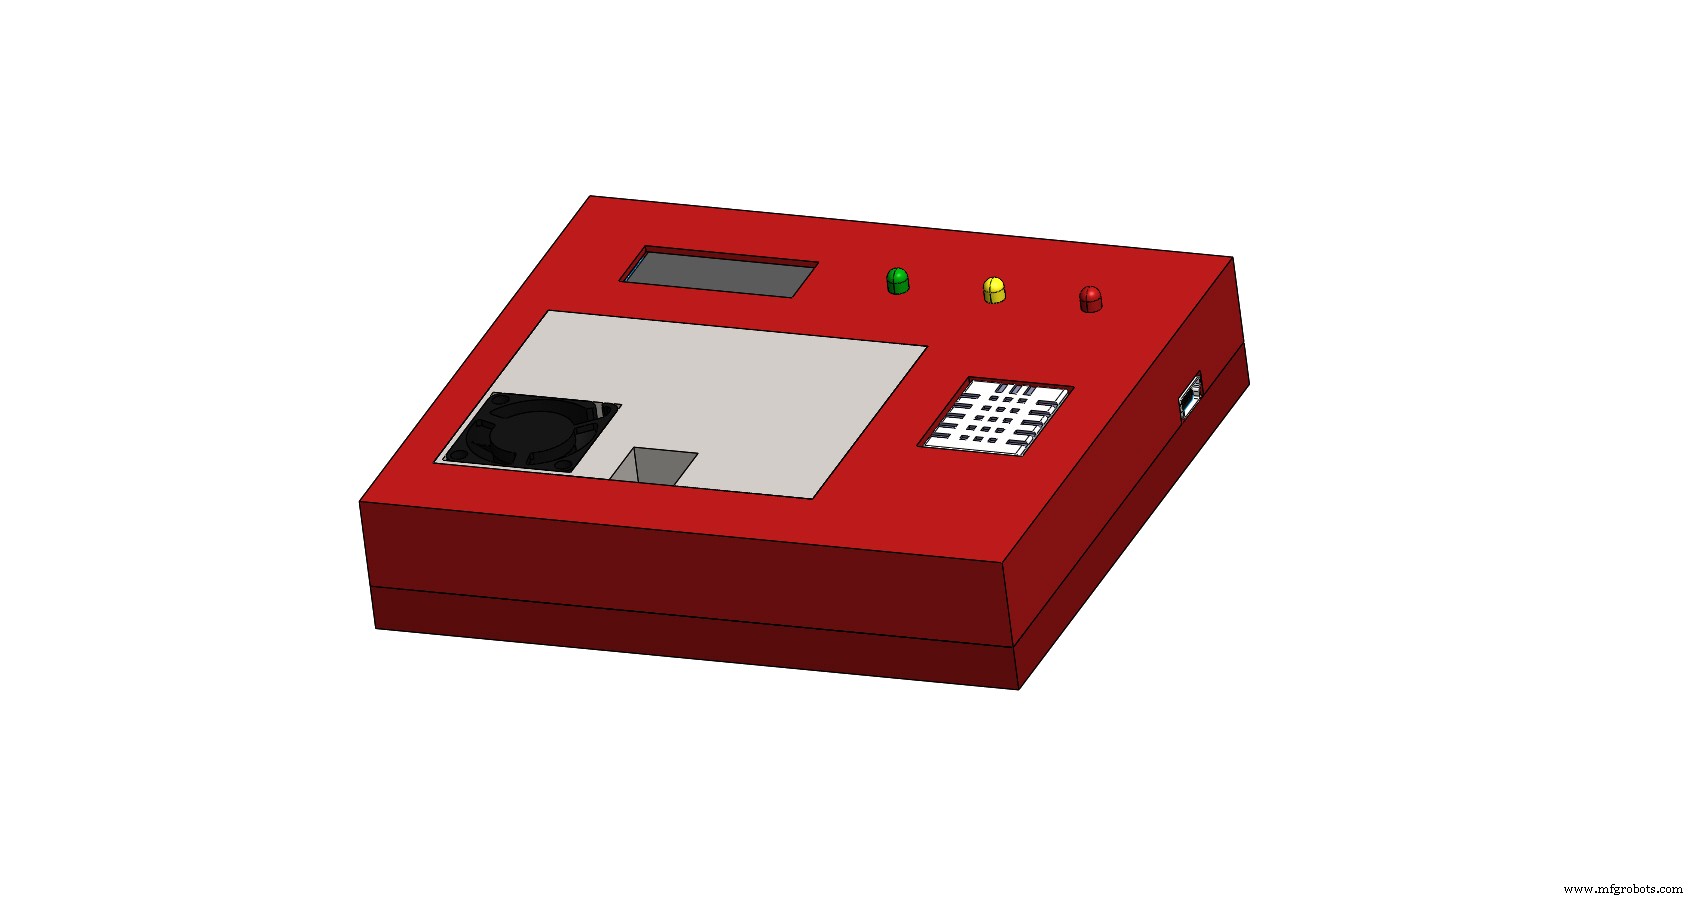
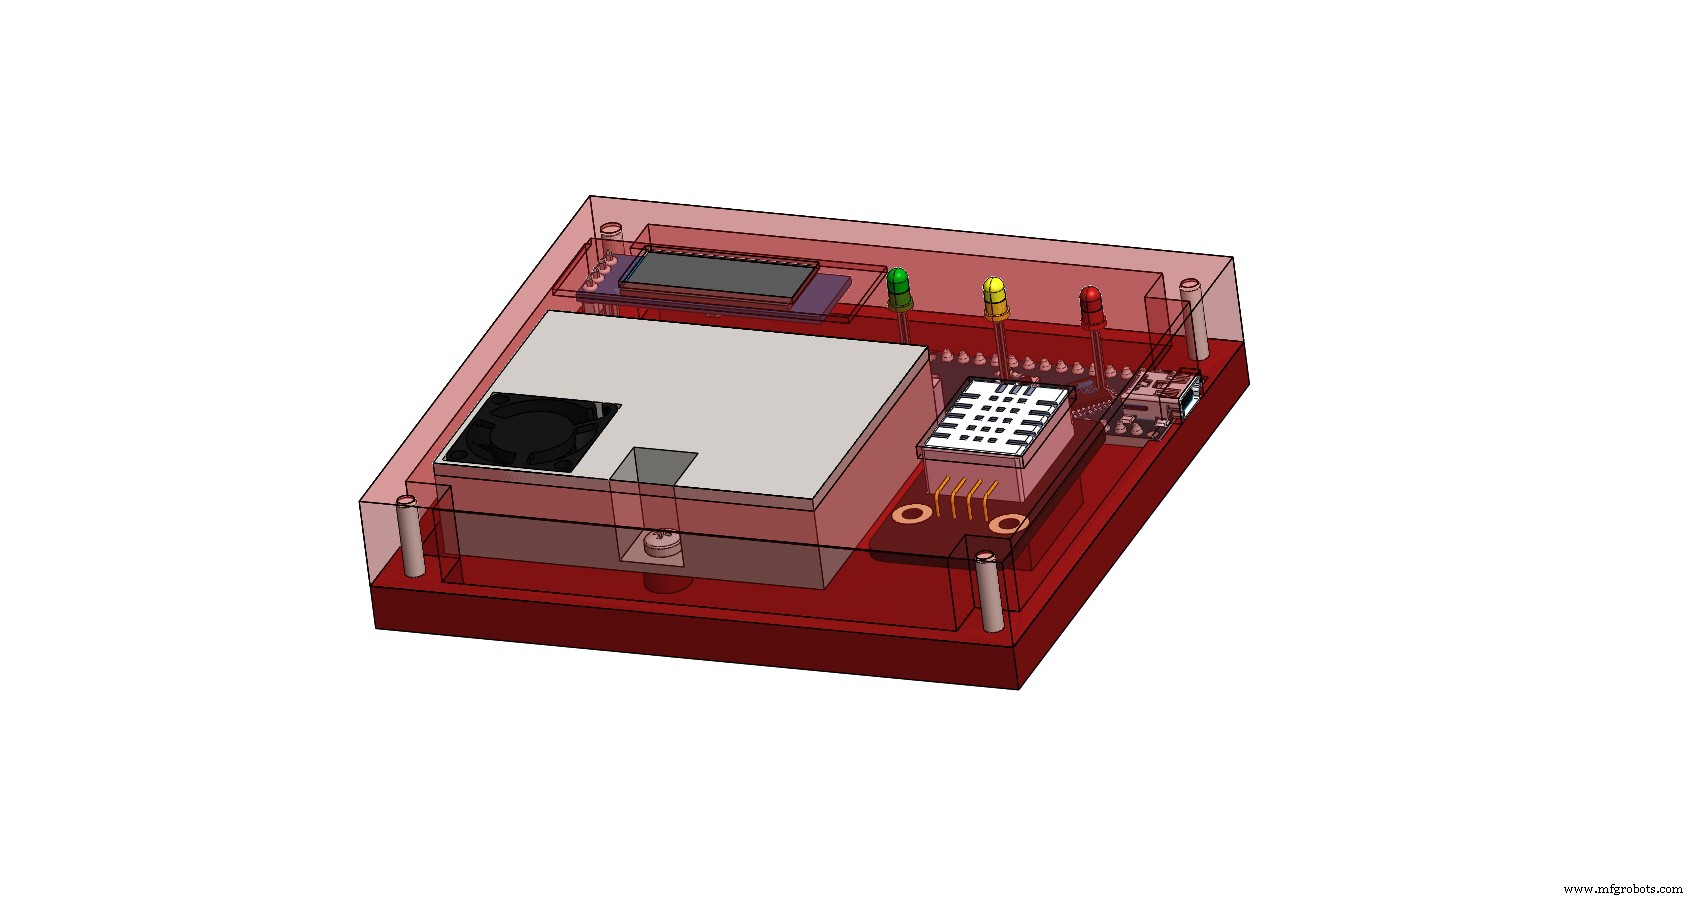
外壳和组装
我设计并用 3D 打印了一个橙色 PLA 外壳,以固定传感器、显示器、LED 和 Arduino Nano。外壳由两部分组成:下部,固定Arduino Nano和SDS018;上部固定 DHT22、显示器和 LED。在下部有一个用于 Mini-B USB 电缆的开口。在上部有三个孔,三个 LED 从中出来。如果需要,您可以使用 LED 安装硬件来固定 LED(只需将孔扩大至 5 毫米即可)。
在此附件中,您将找到您需要以 3D 方式打印案例的两个部分的两个文件。
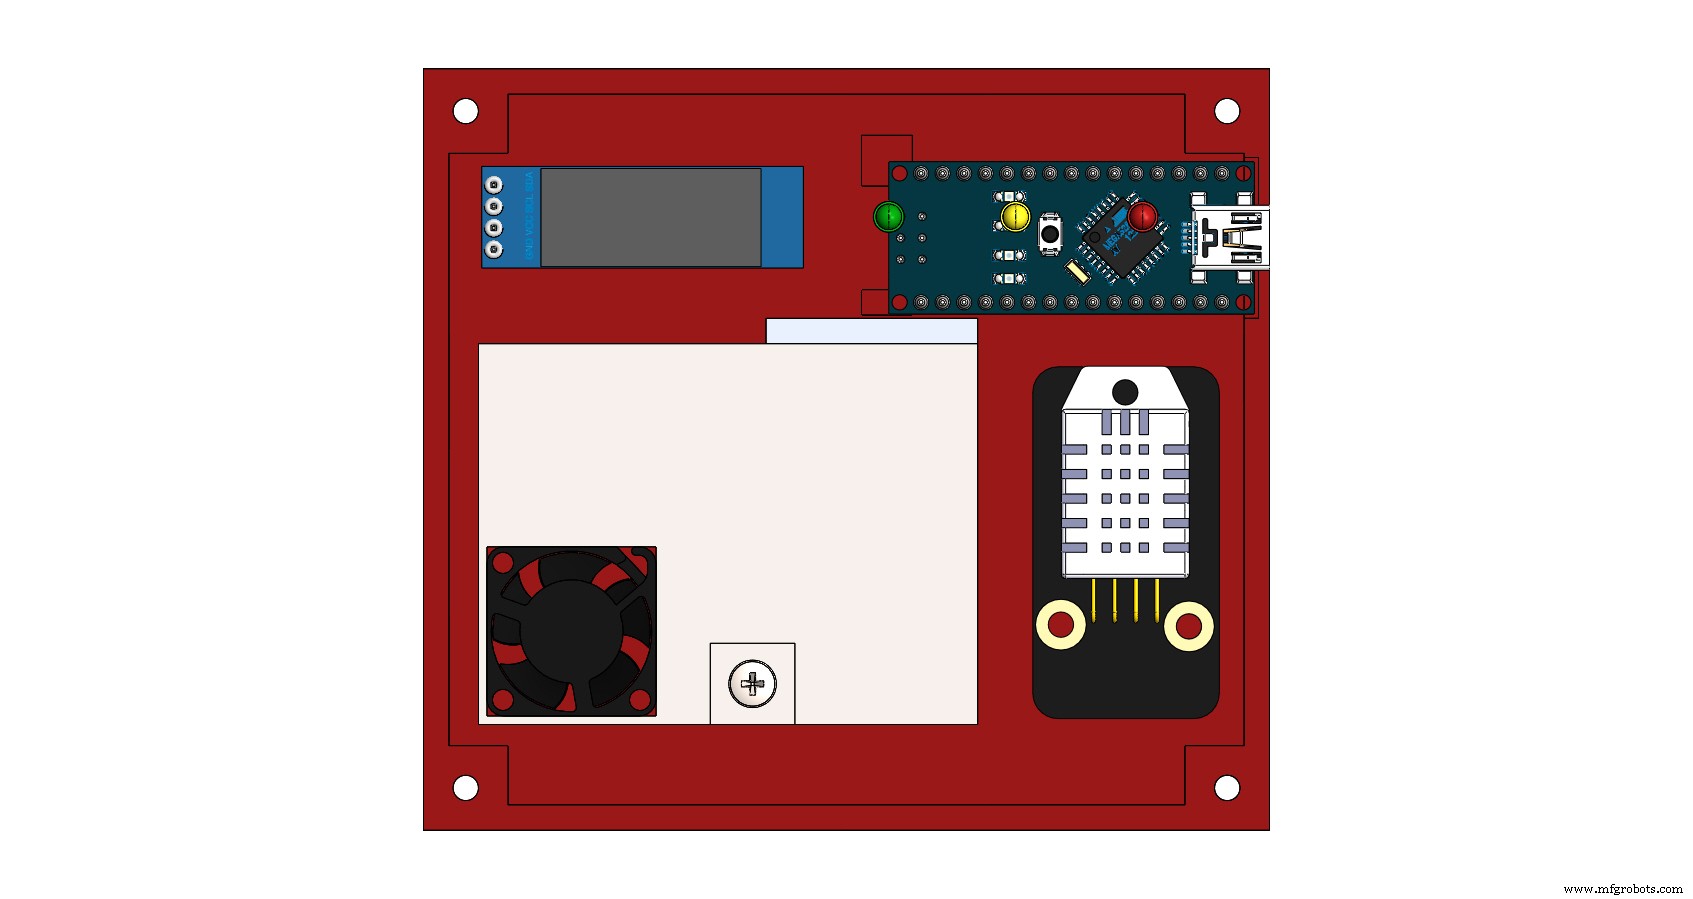
I have used hot glue to fix the Arduino Nano, the display, and the DHT22 in the case.
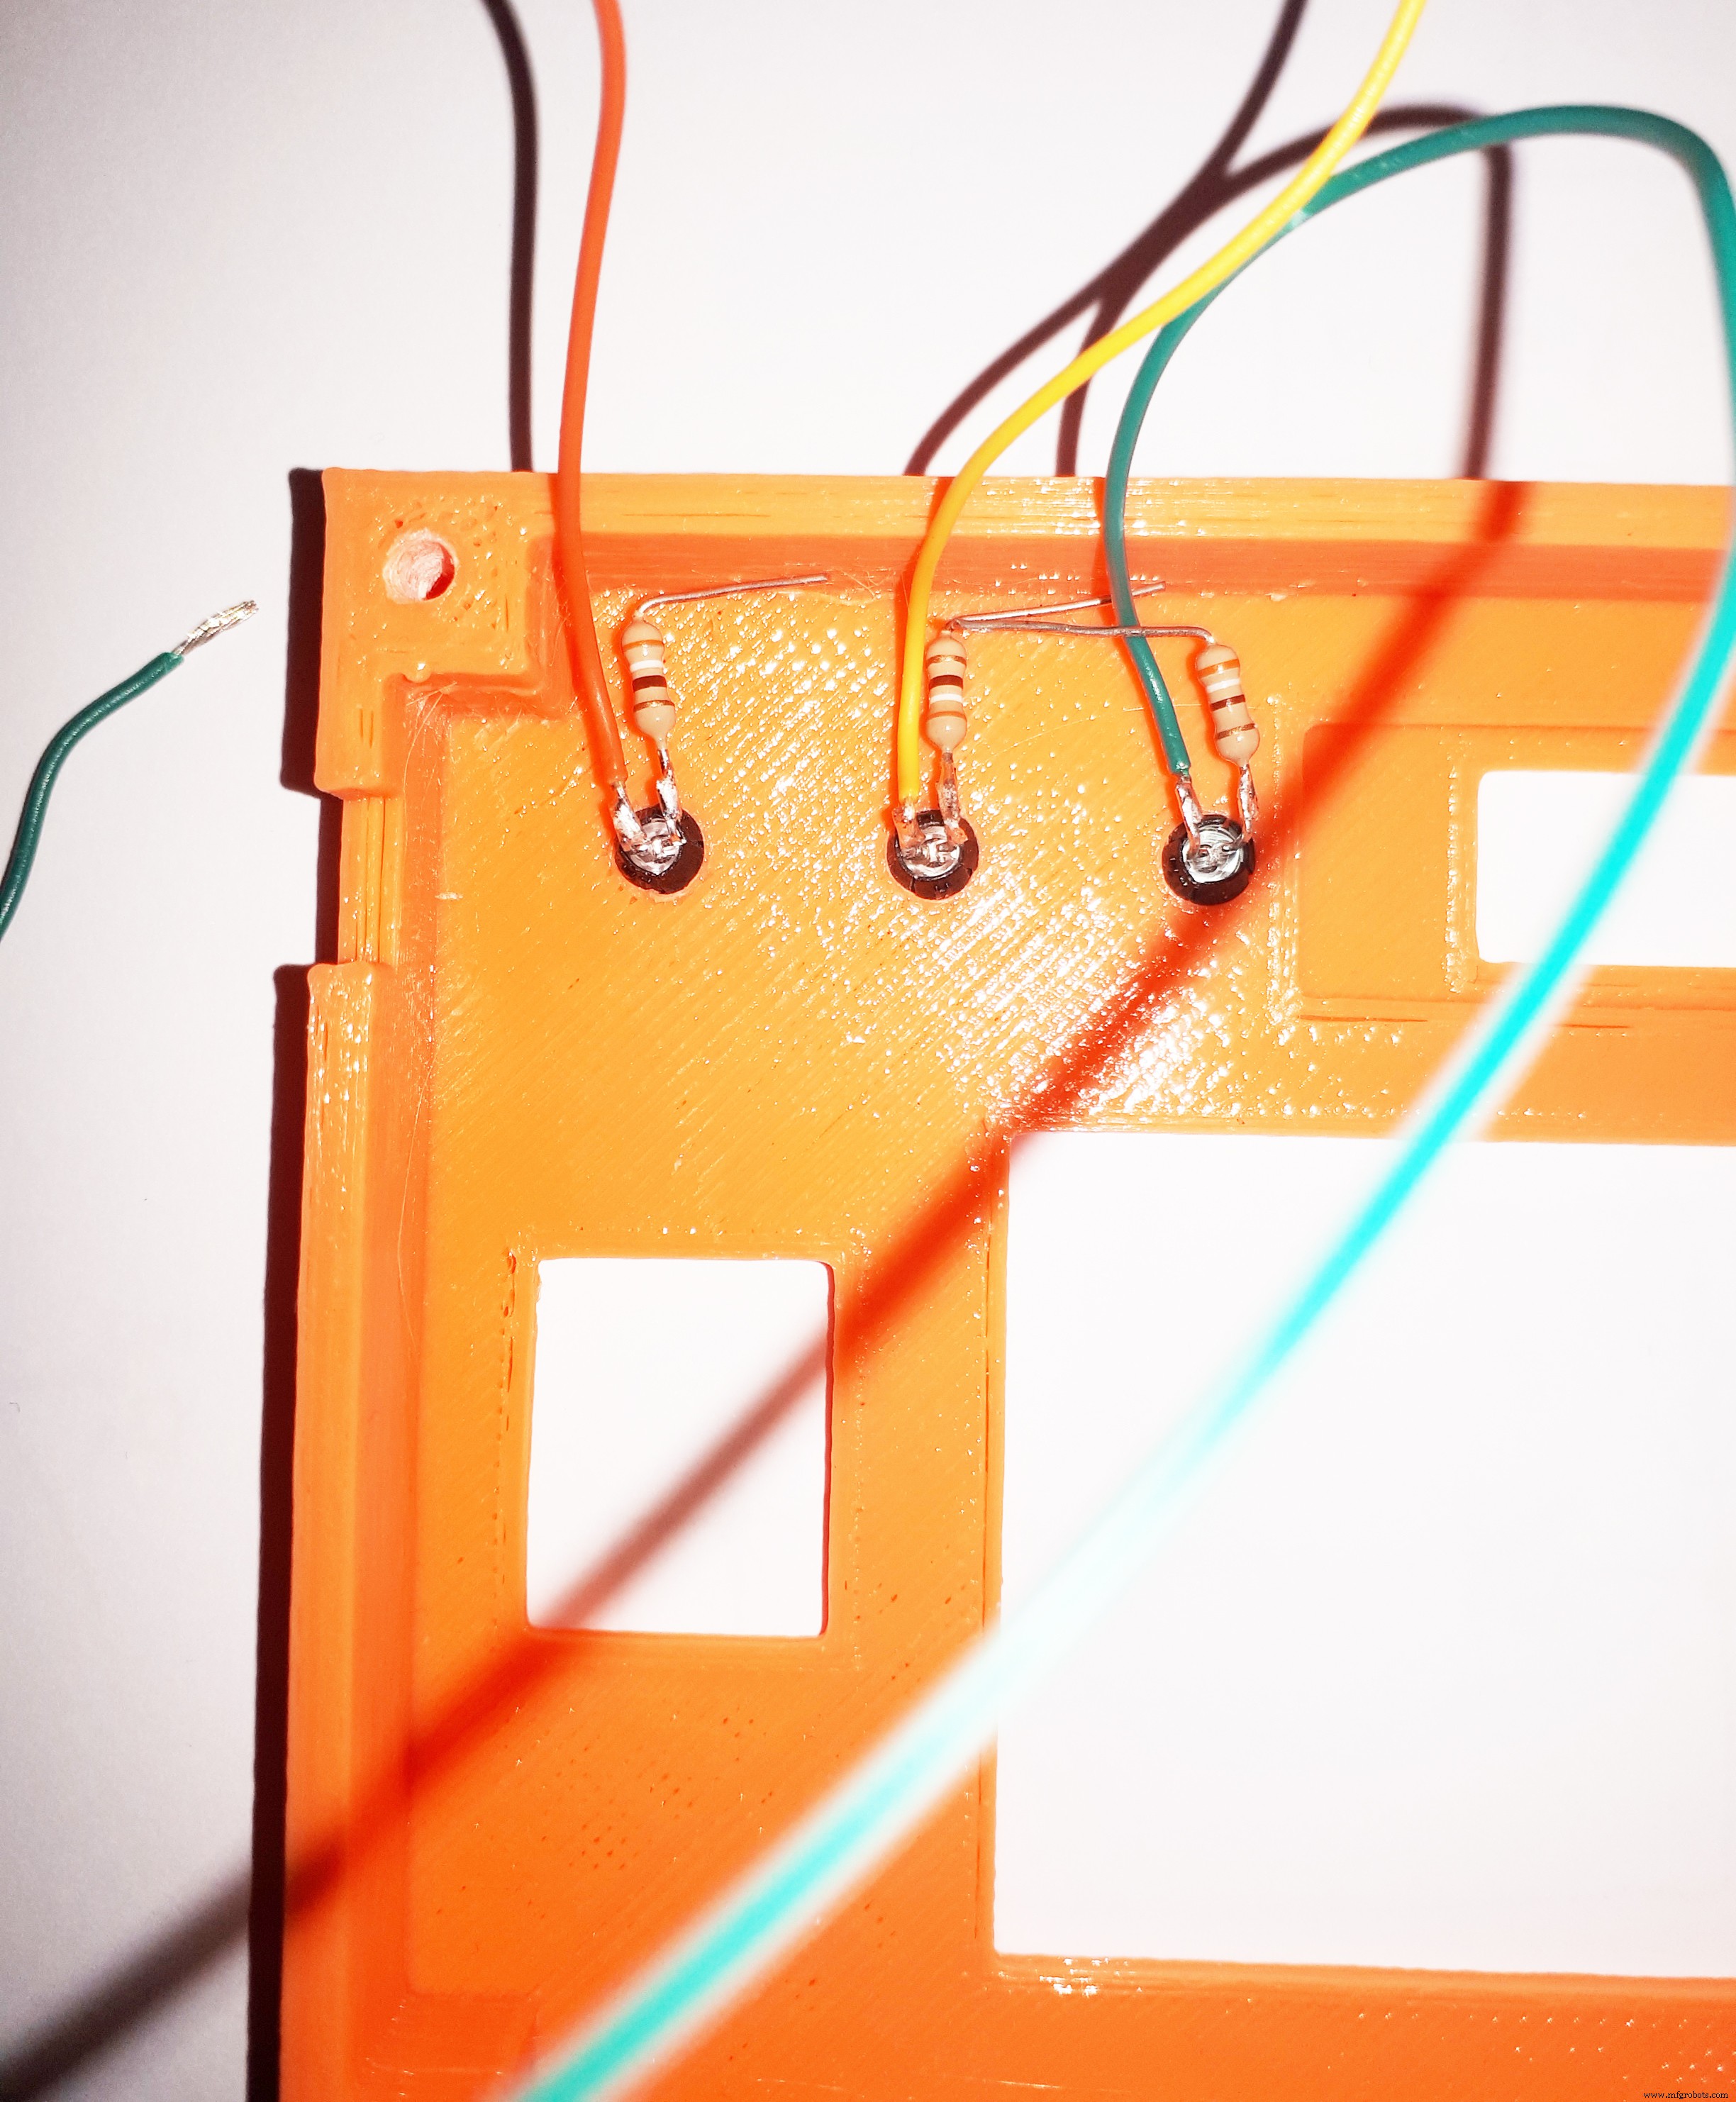
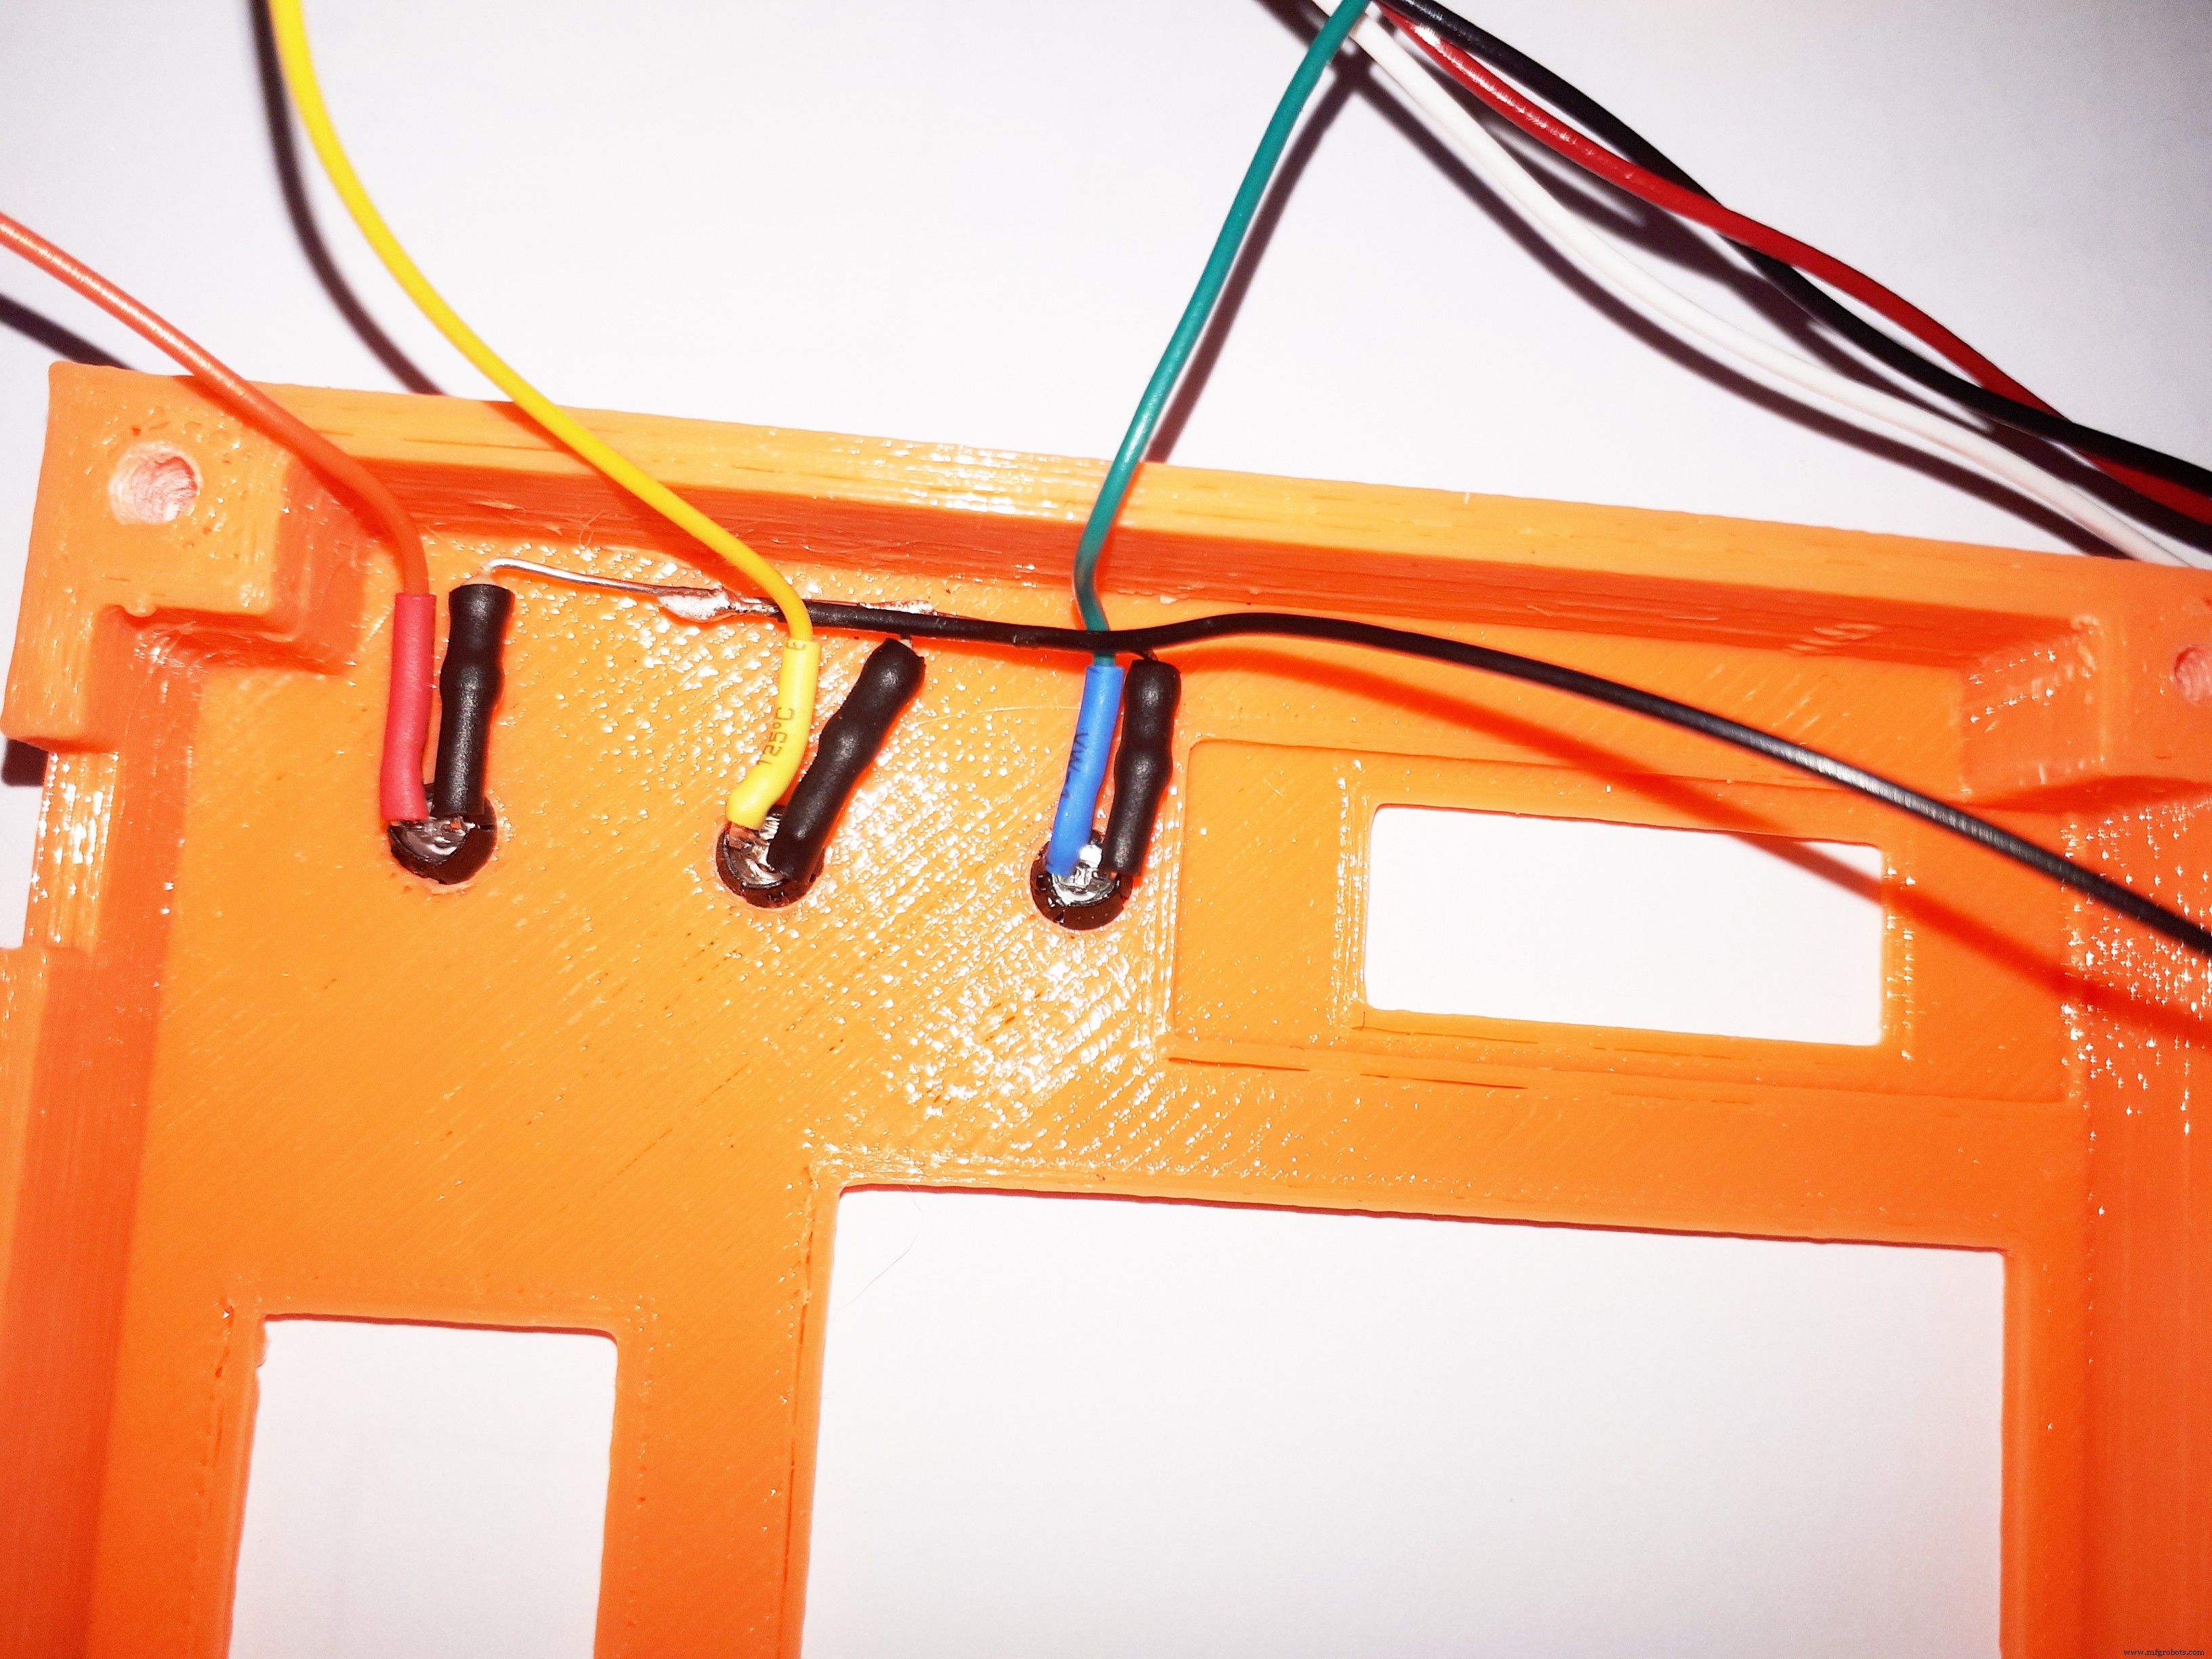
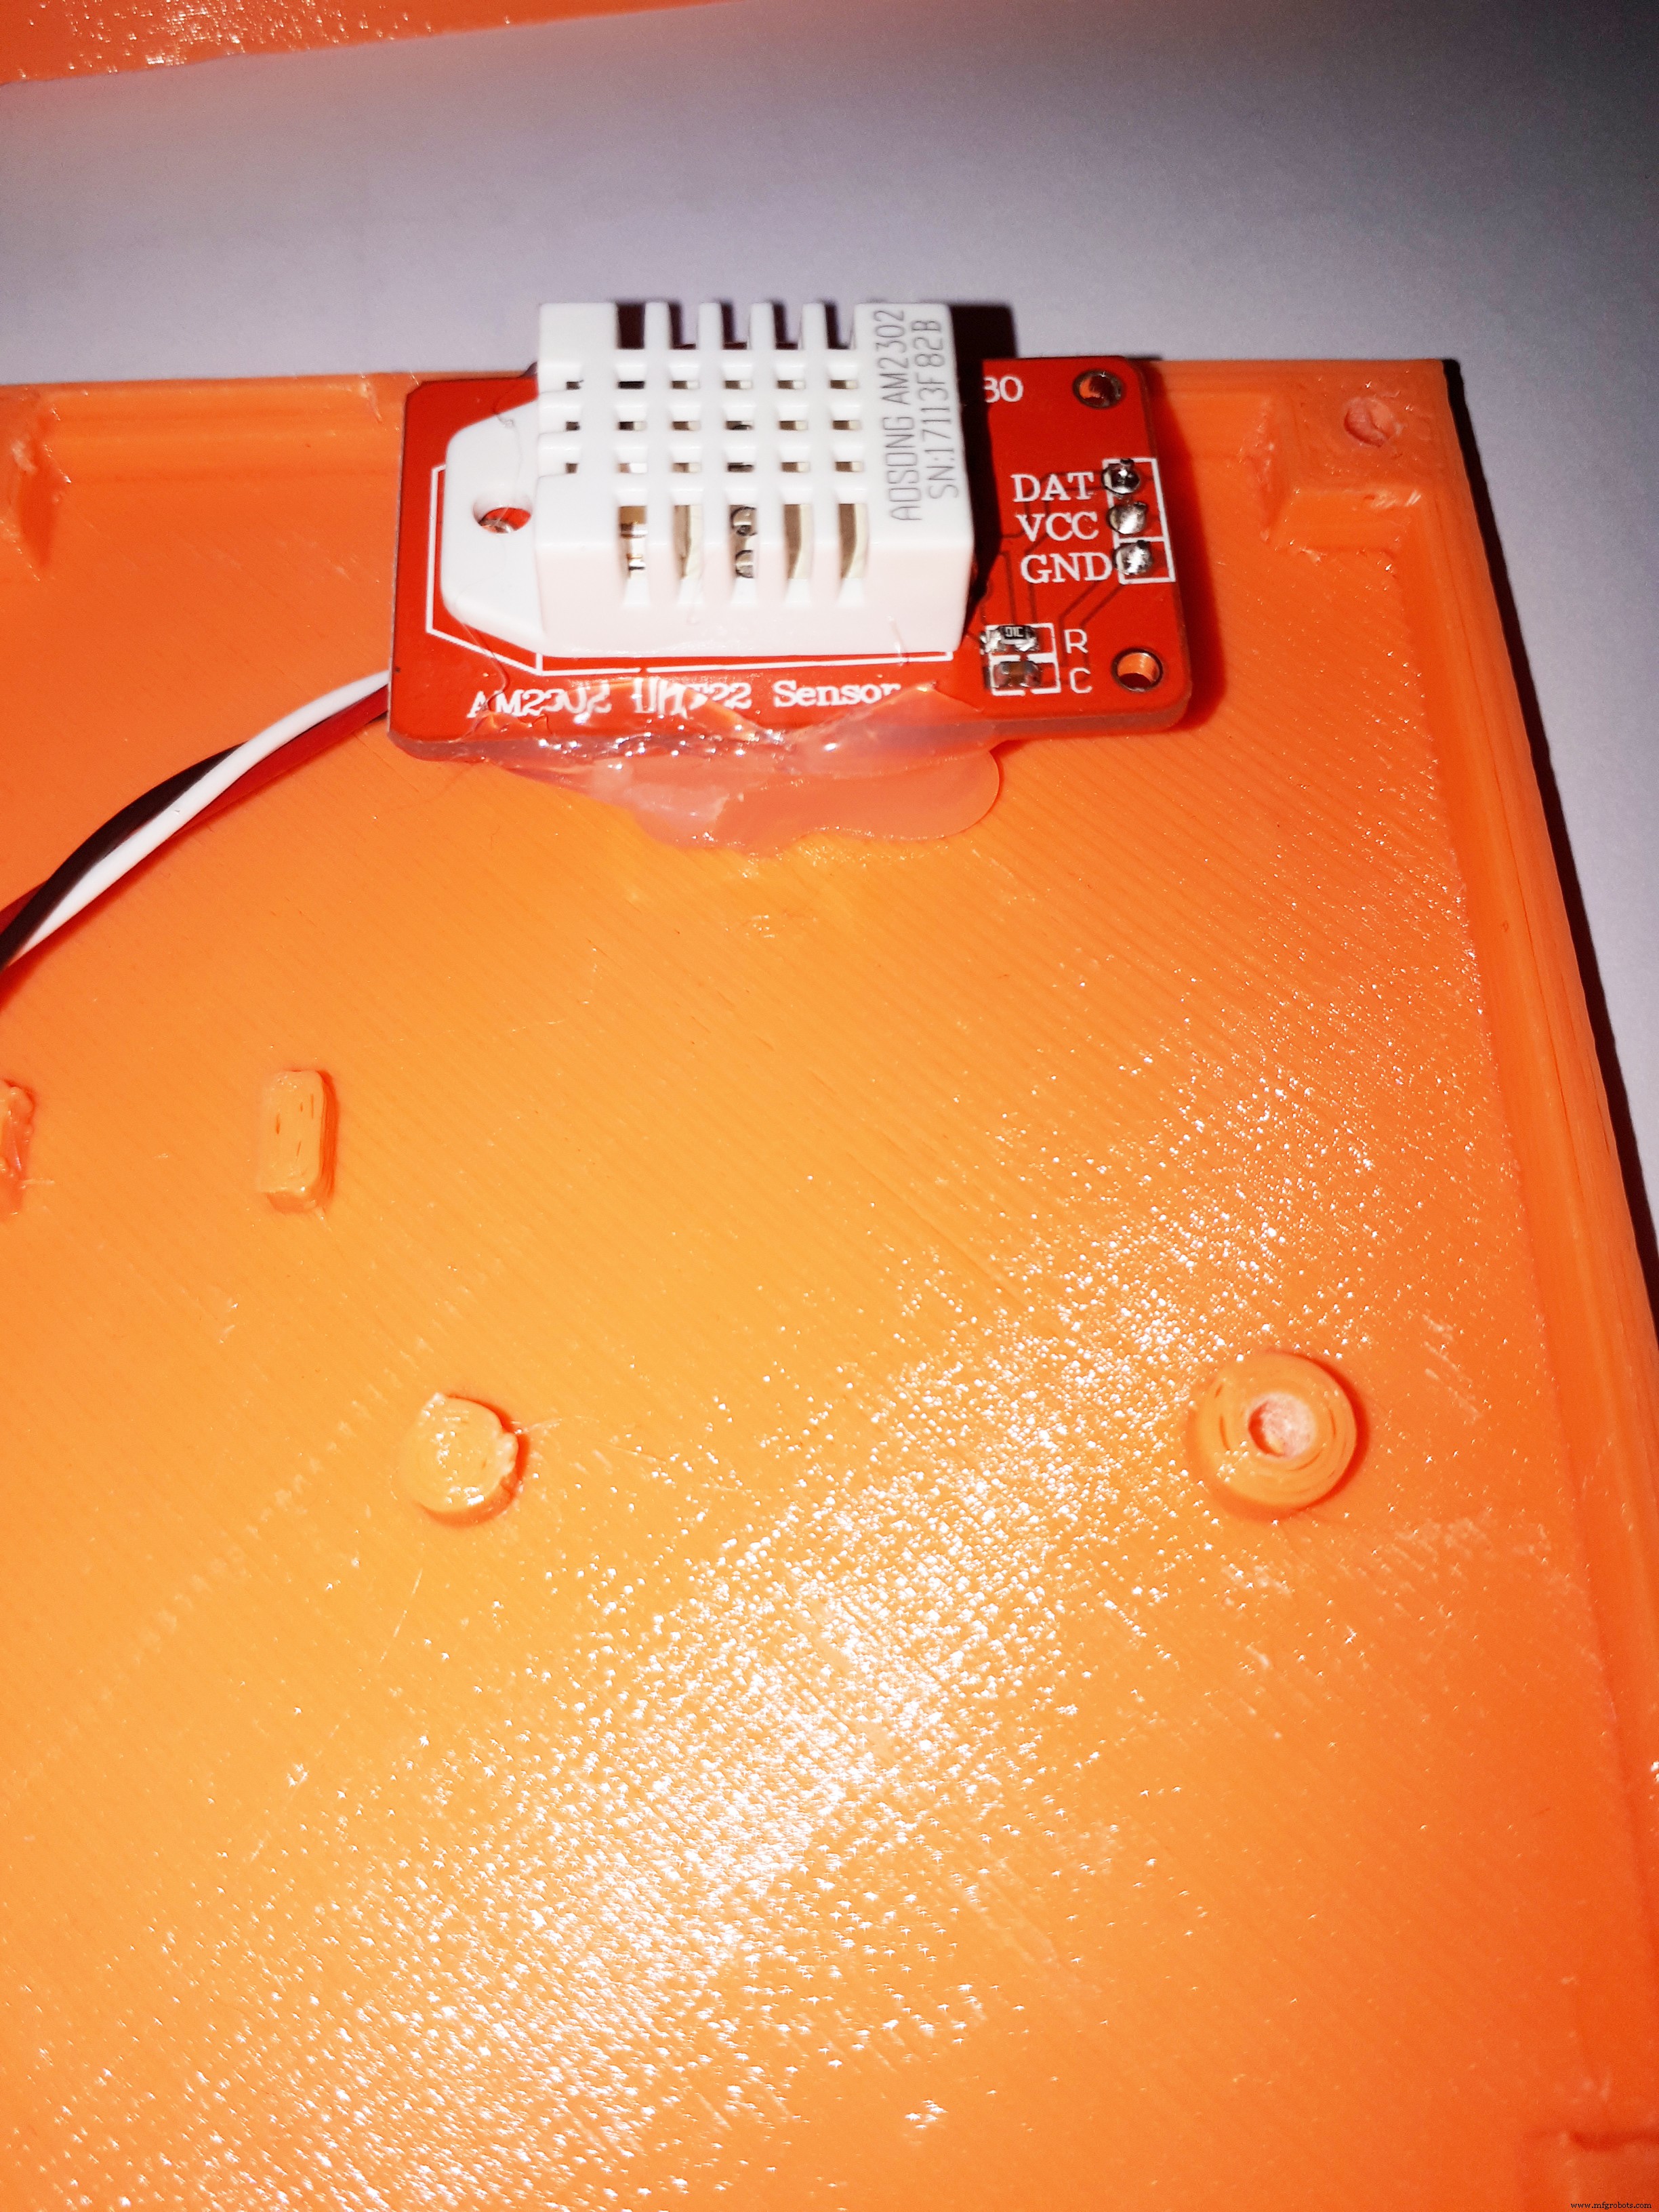
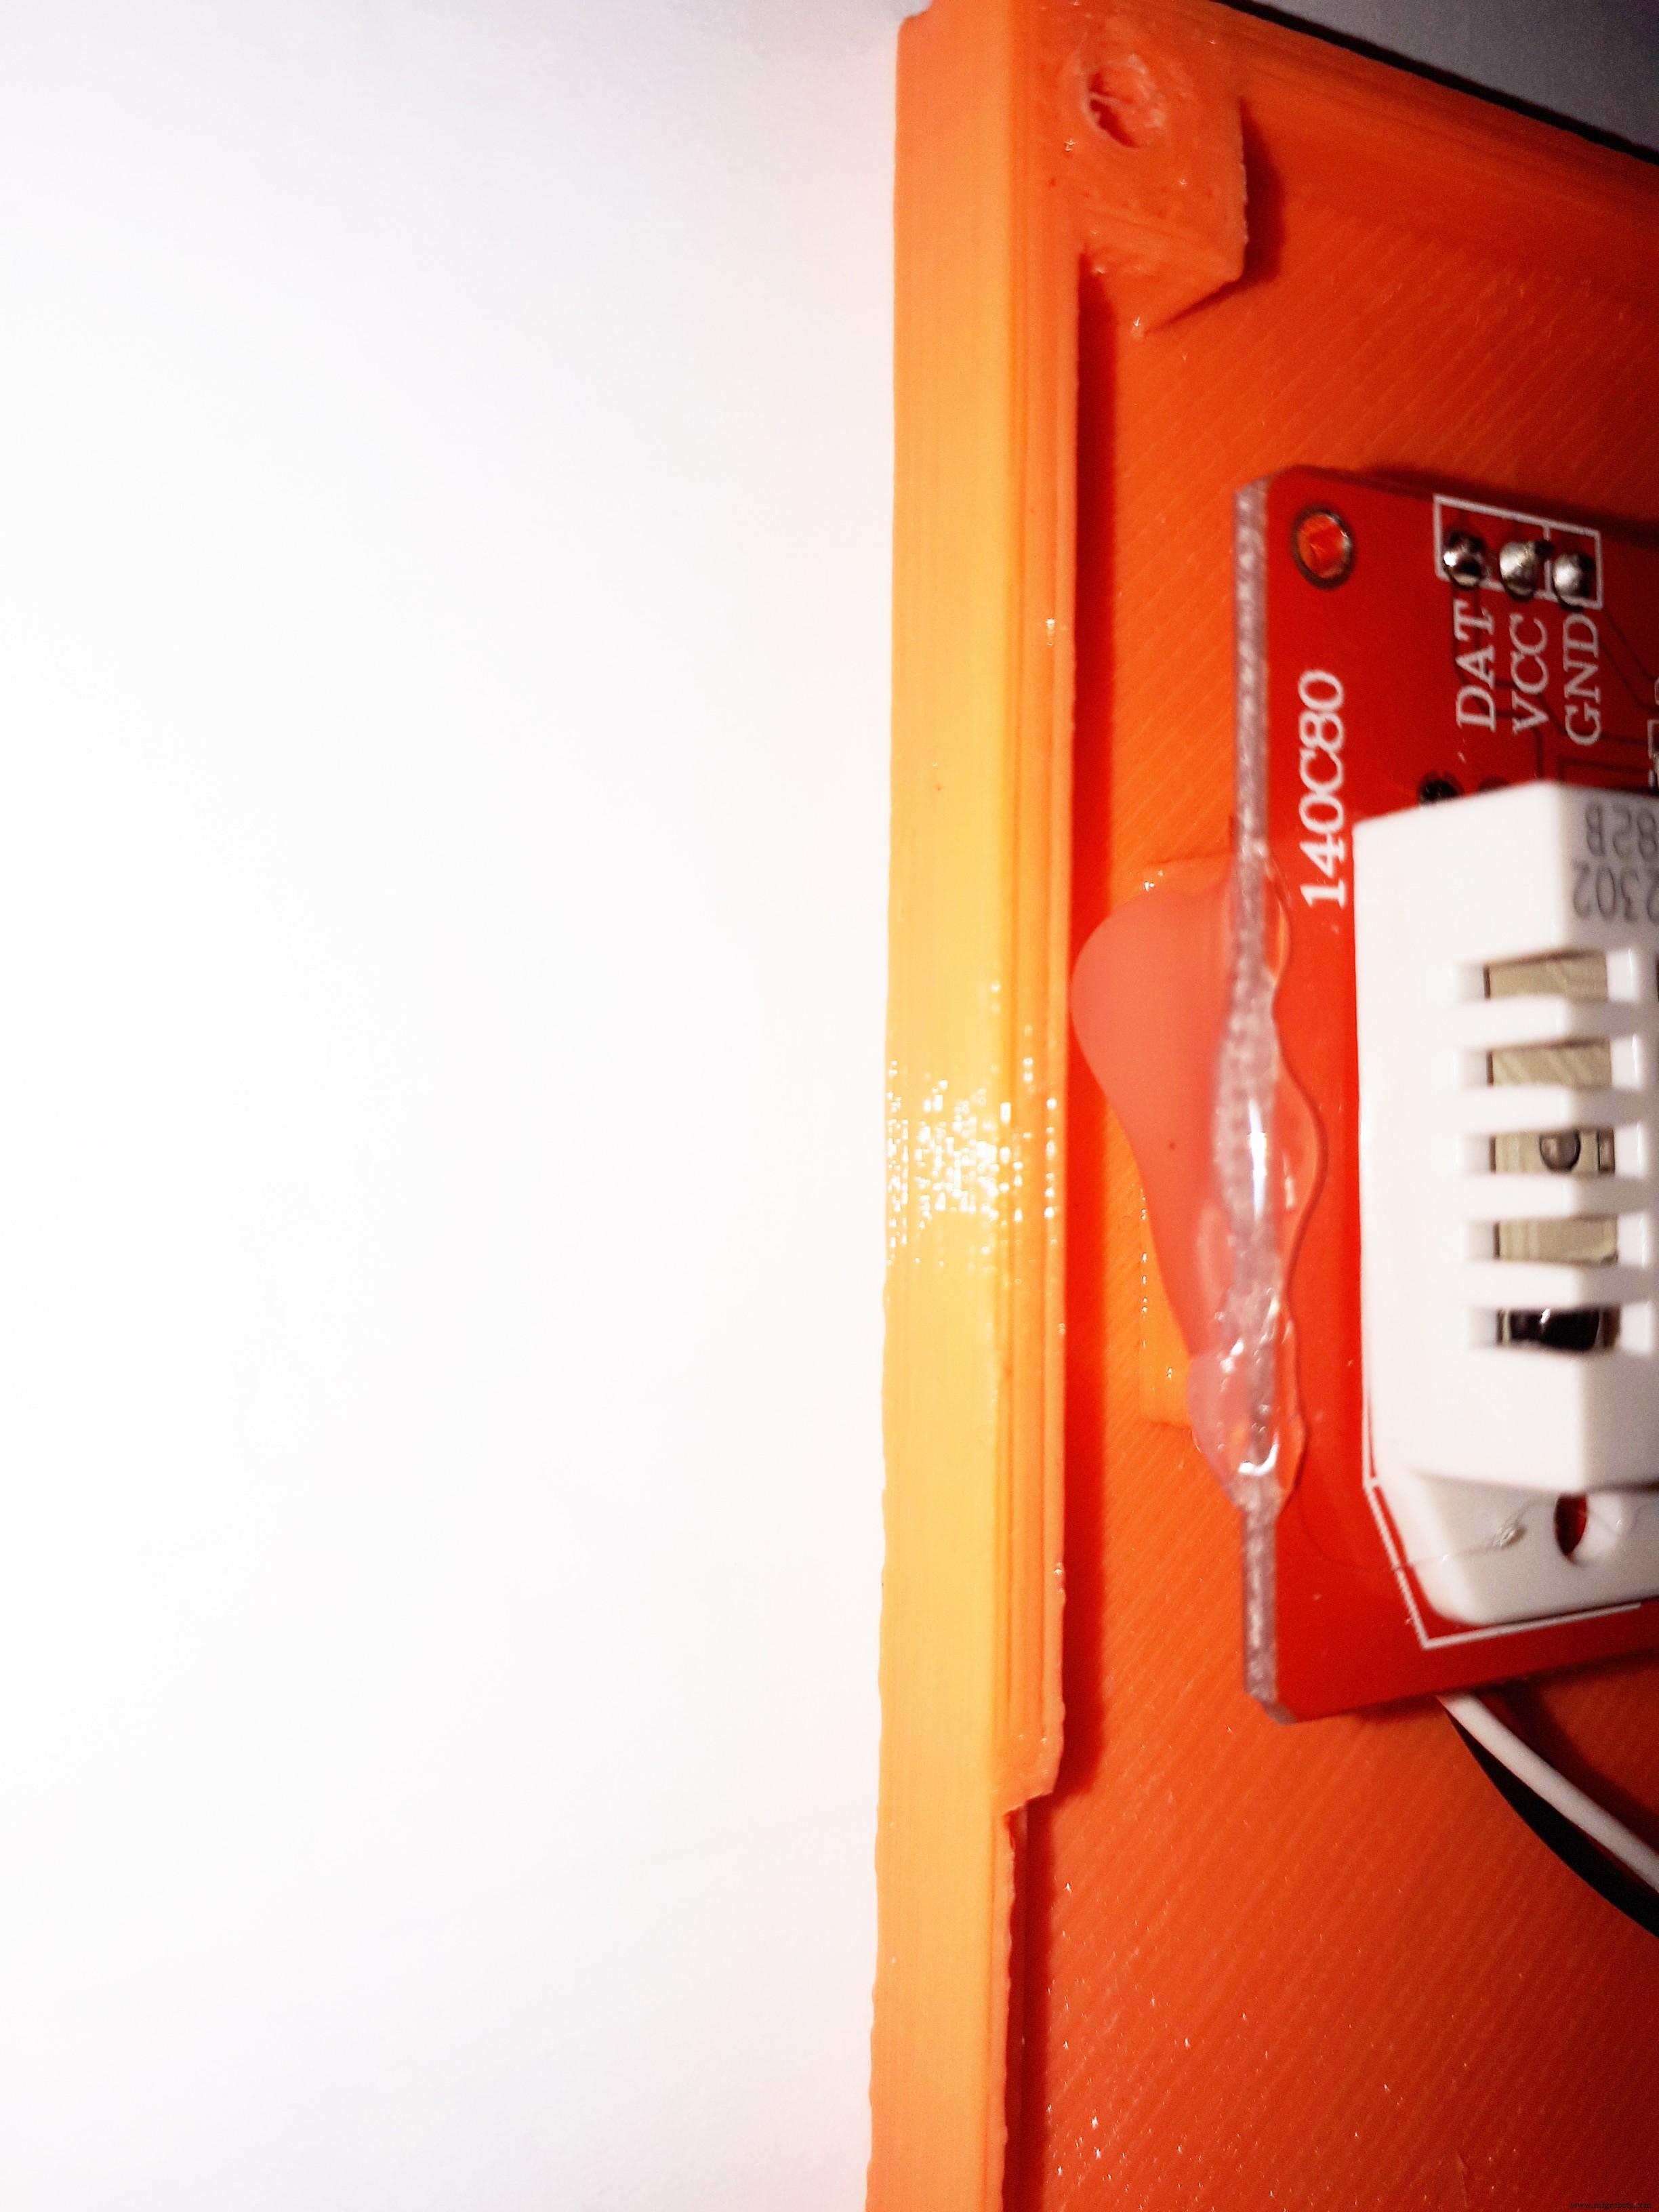
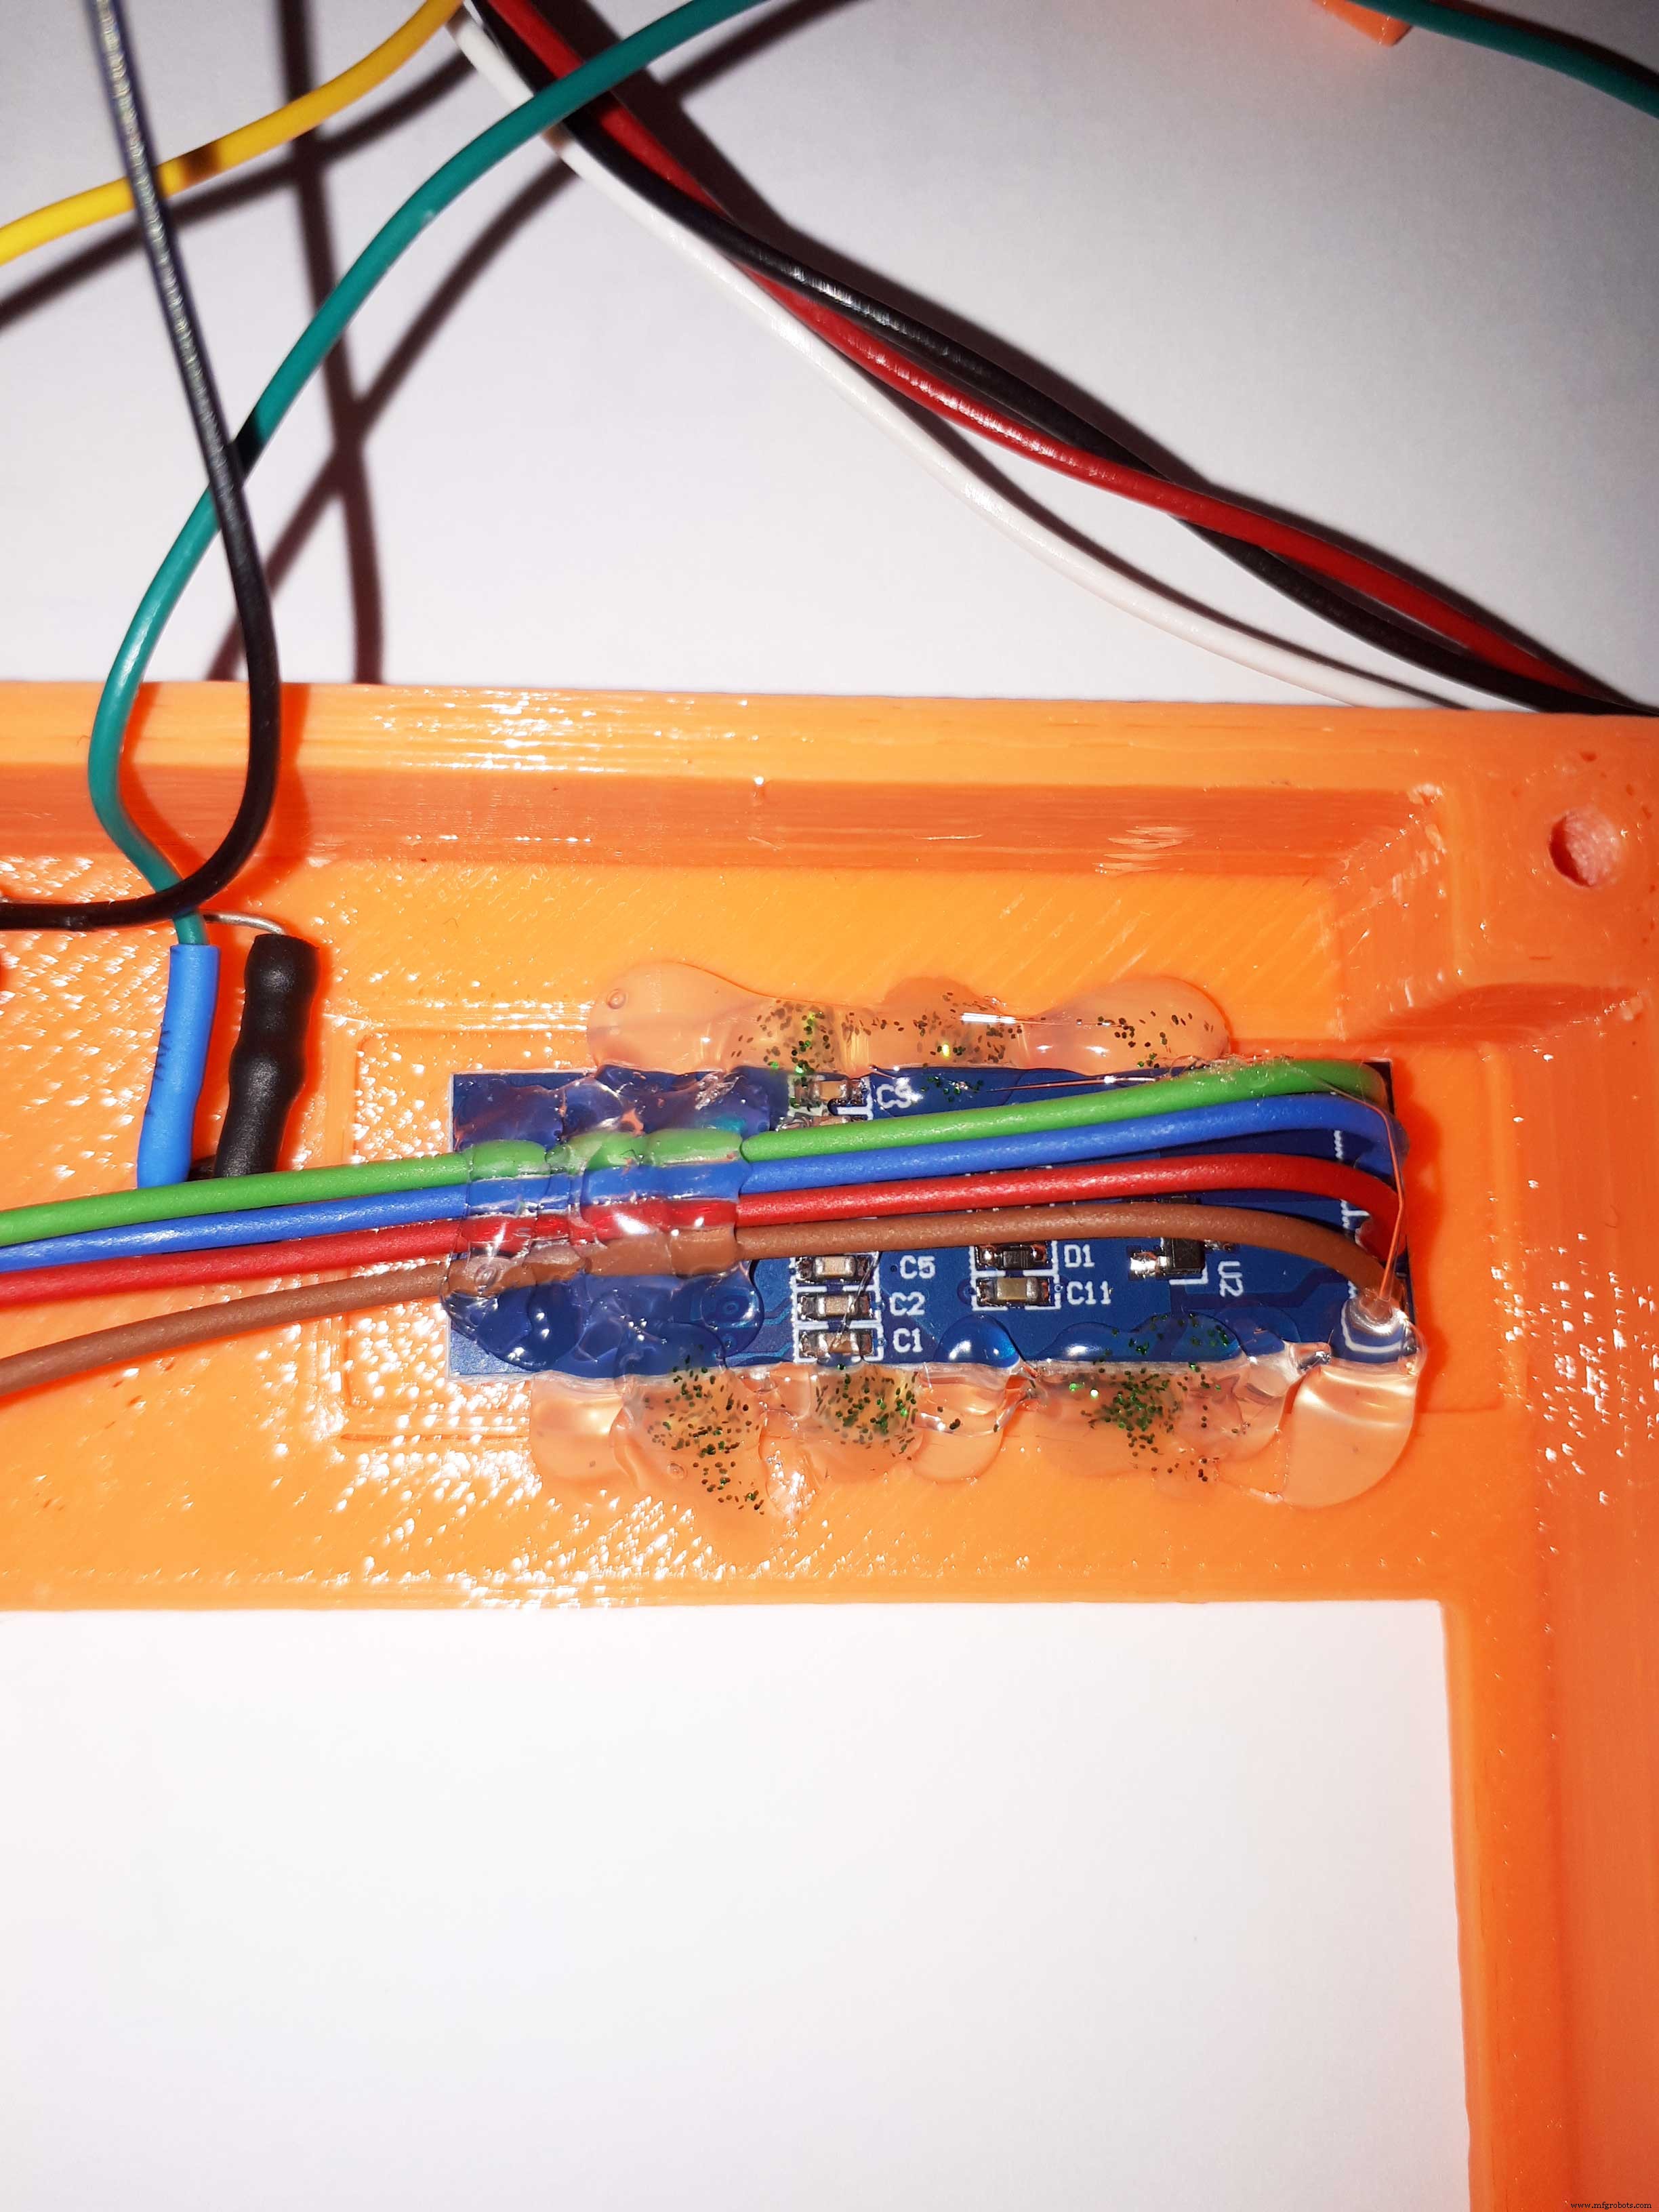
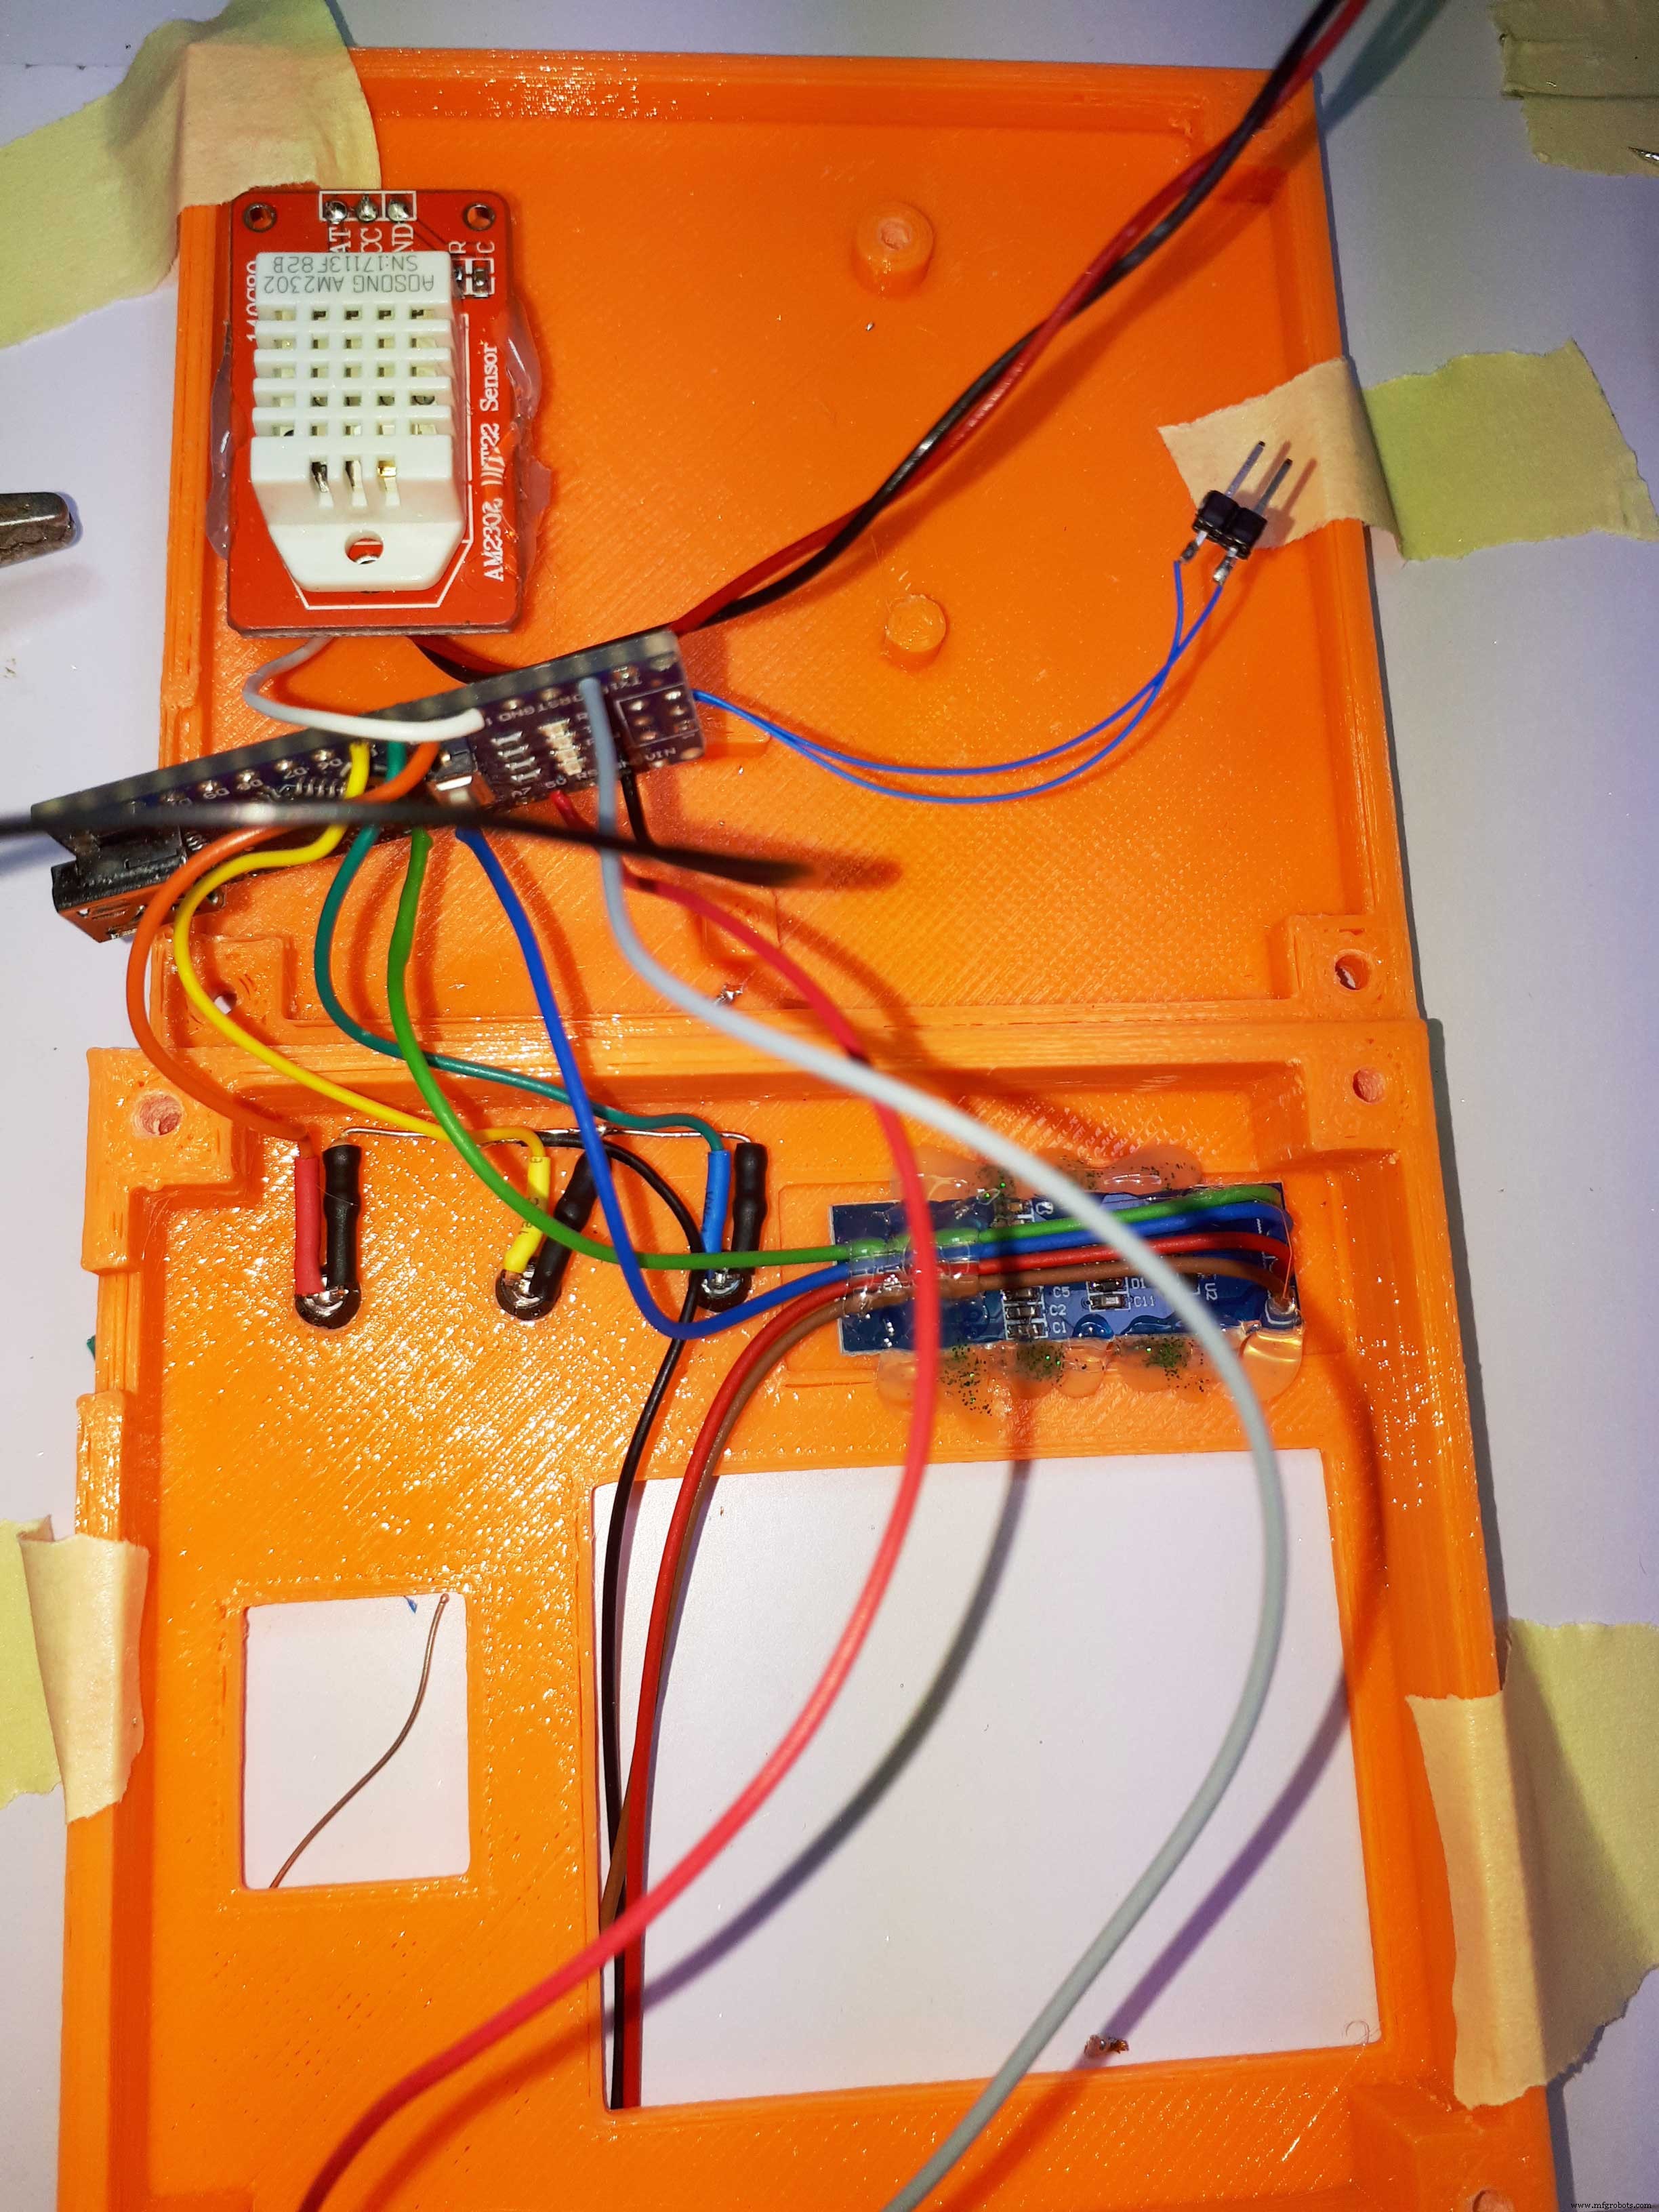
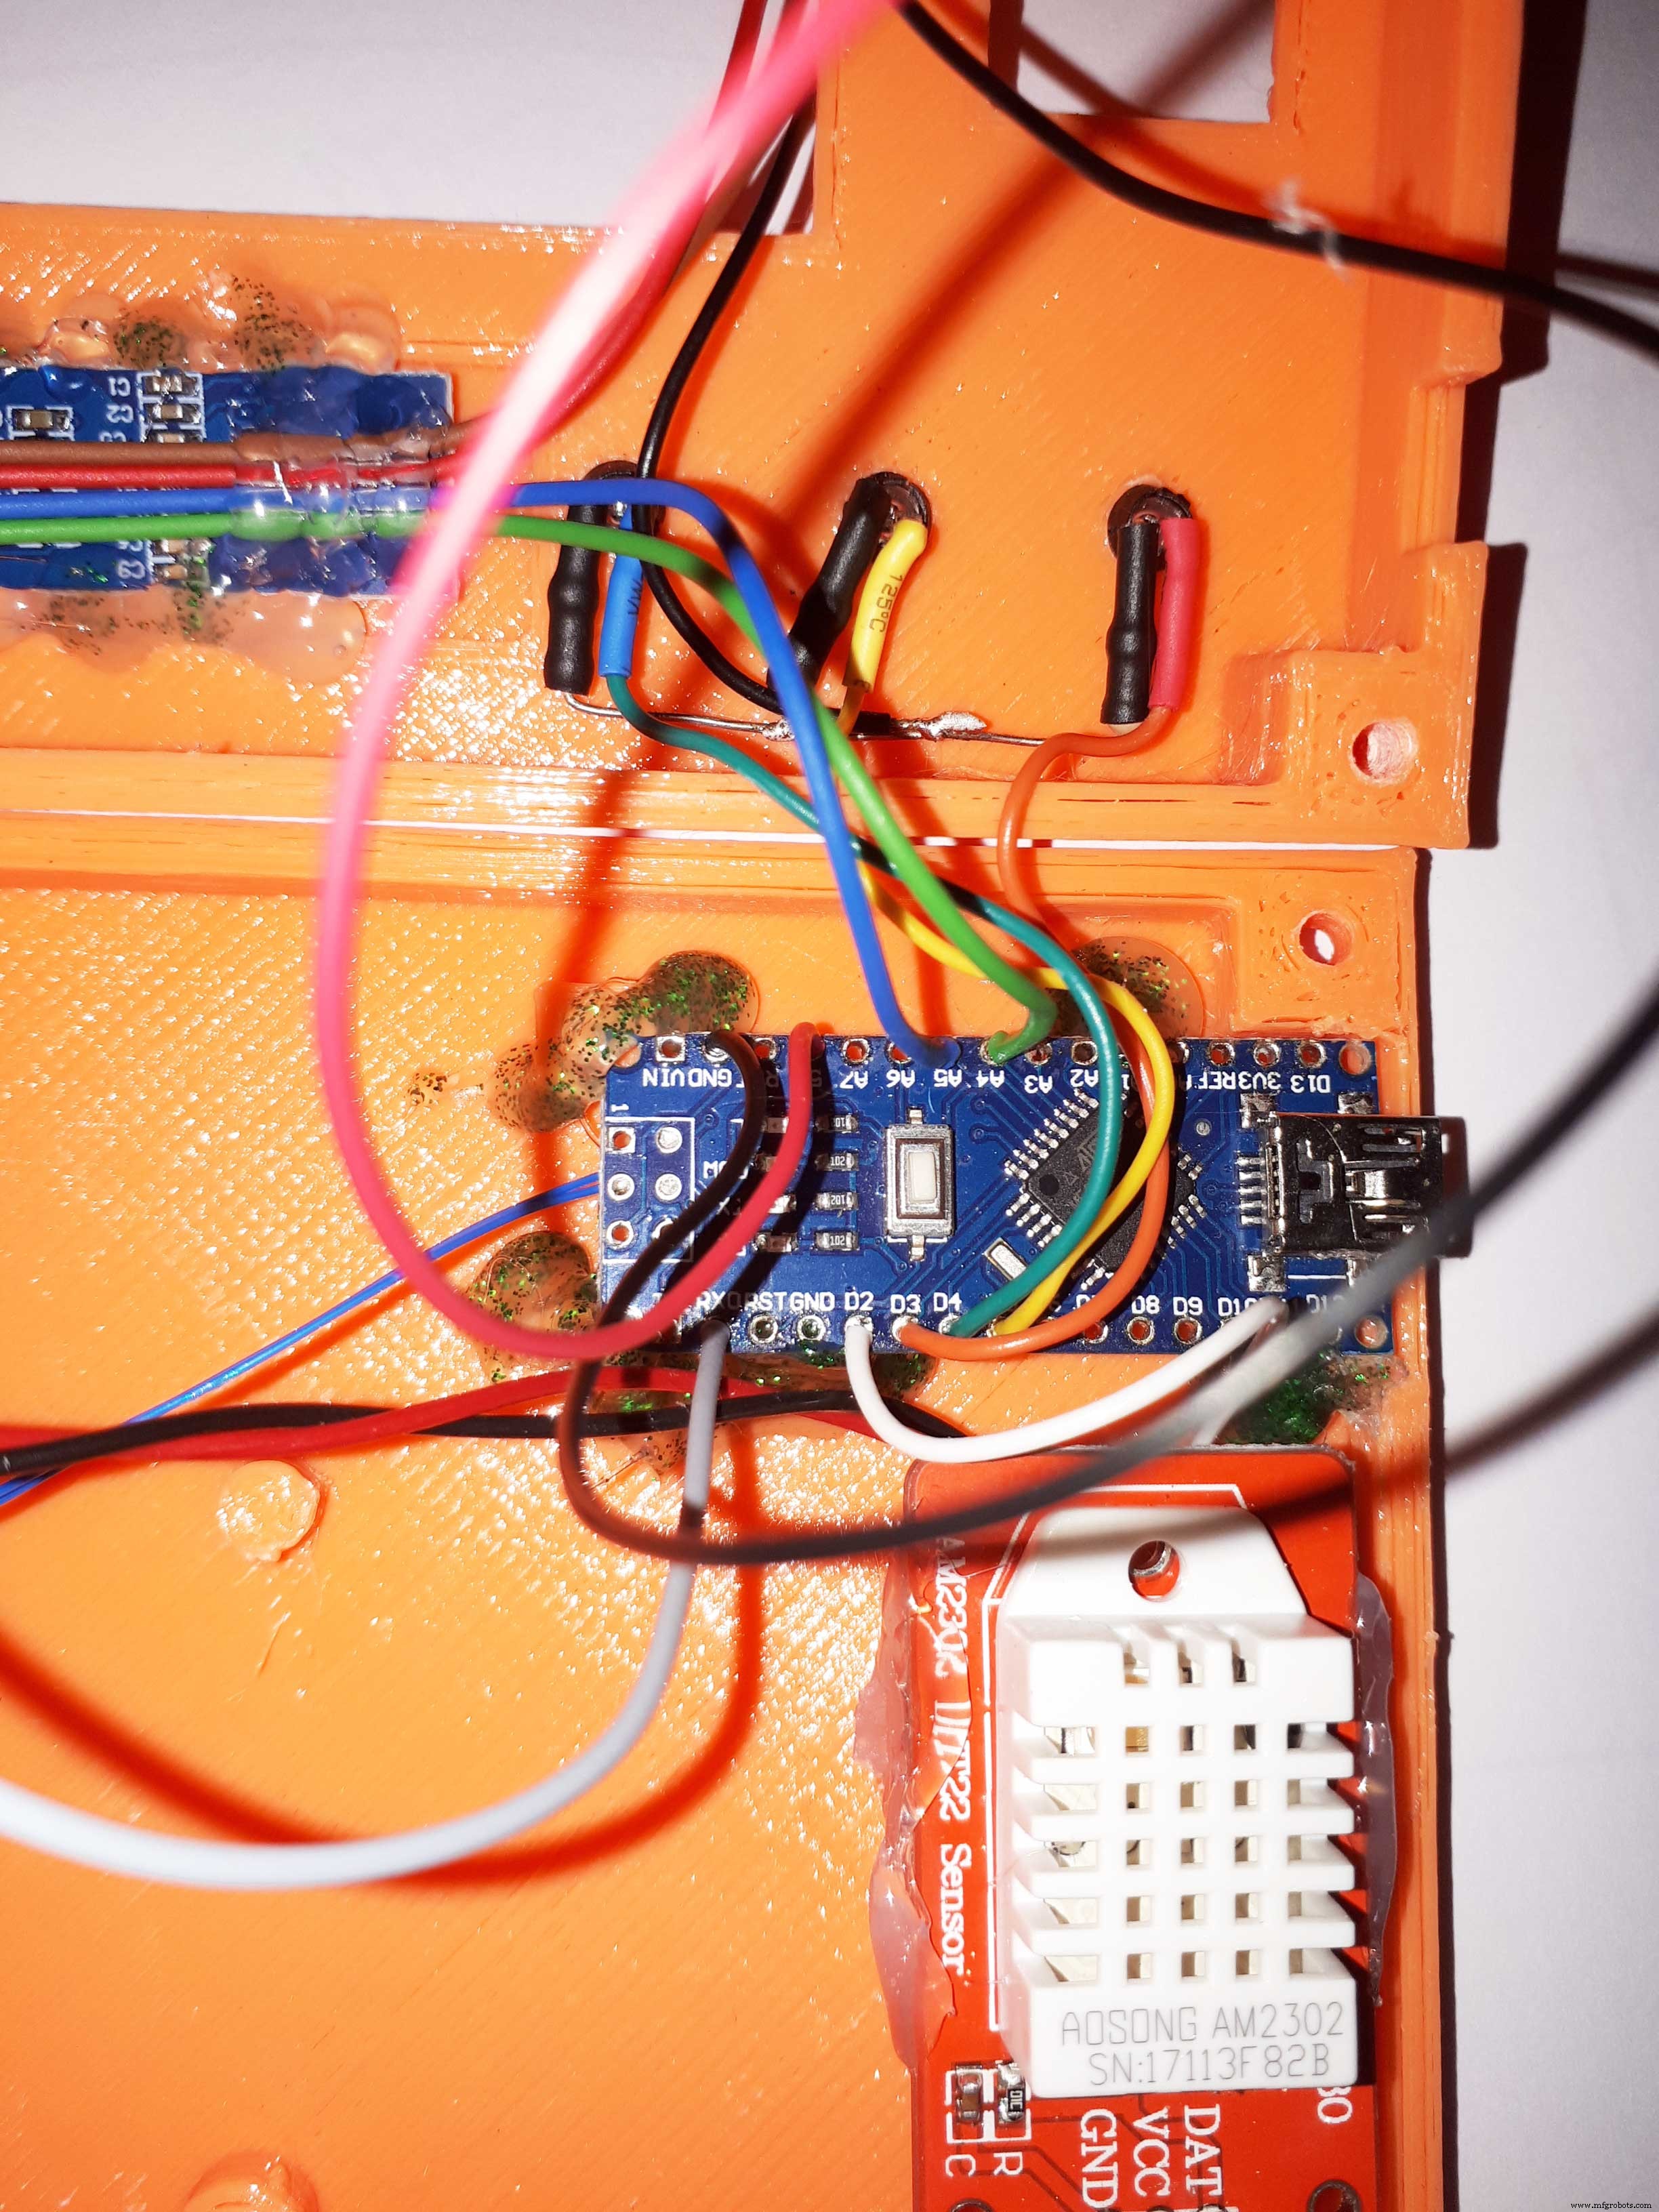
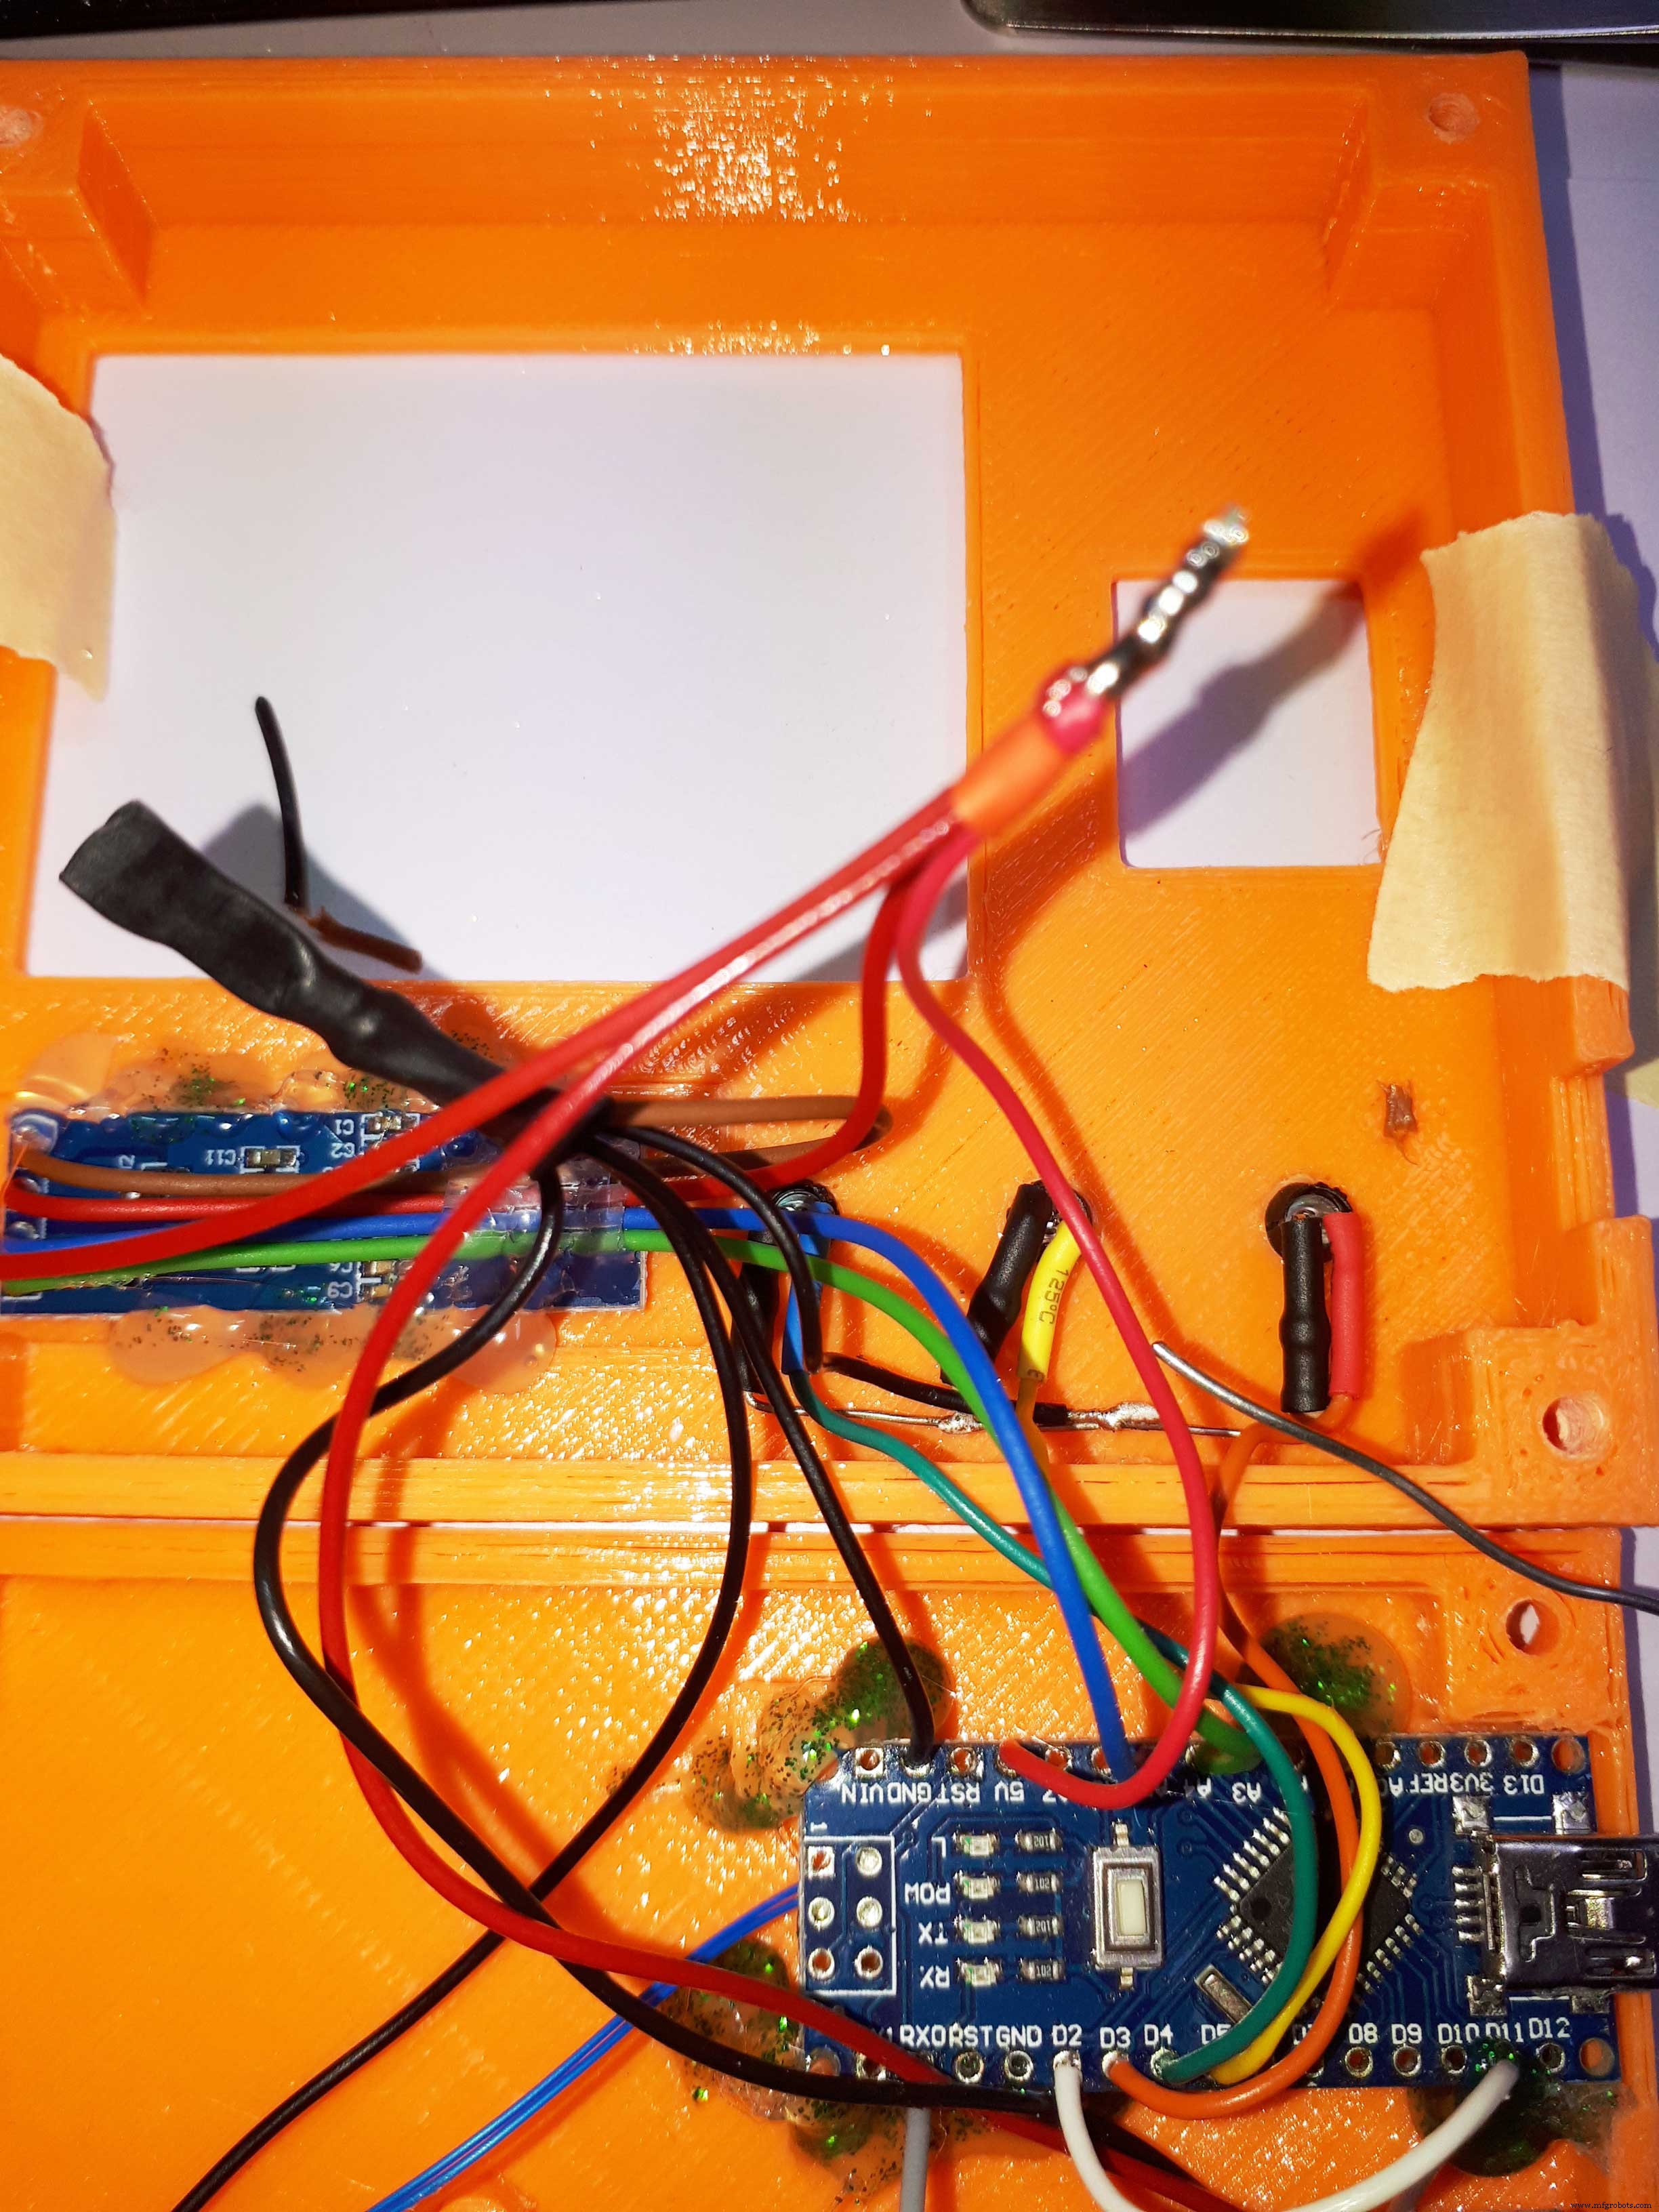
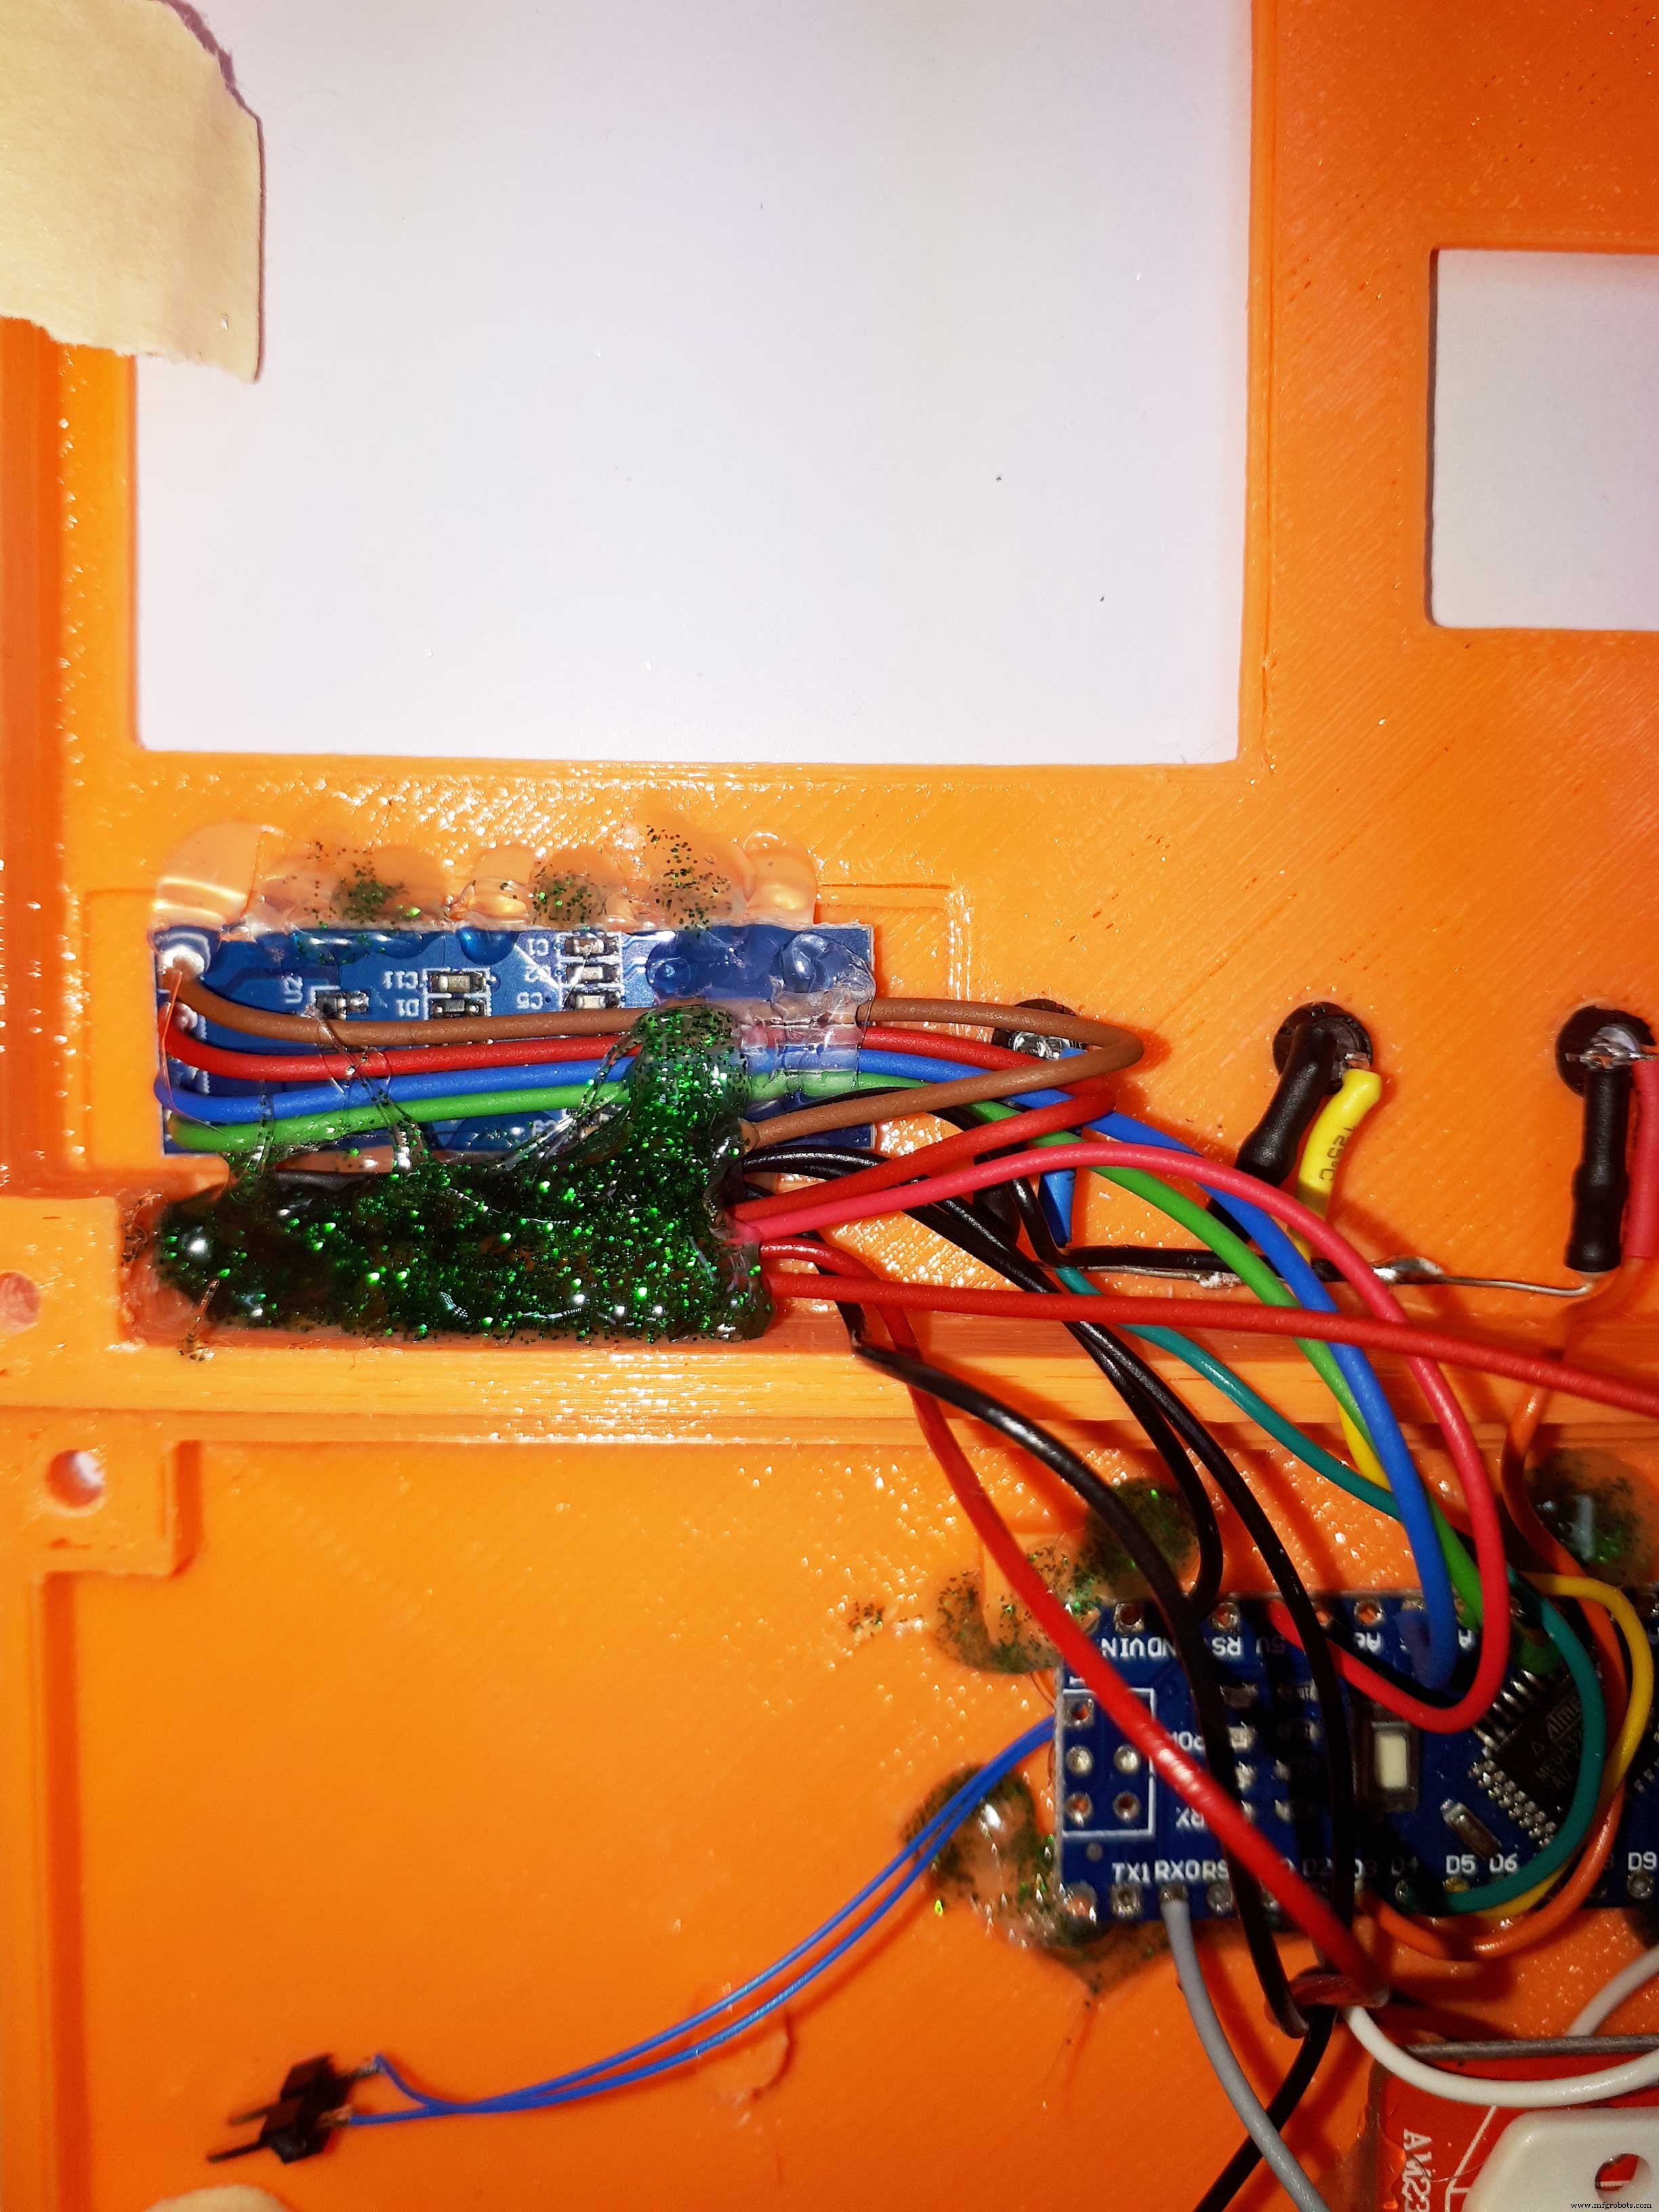
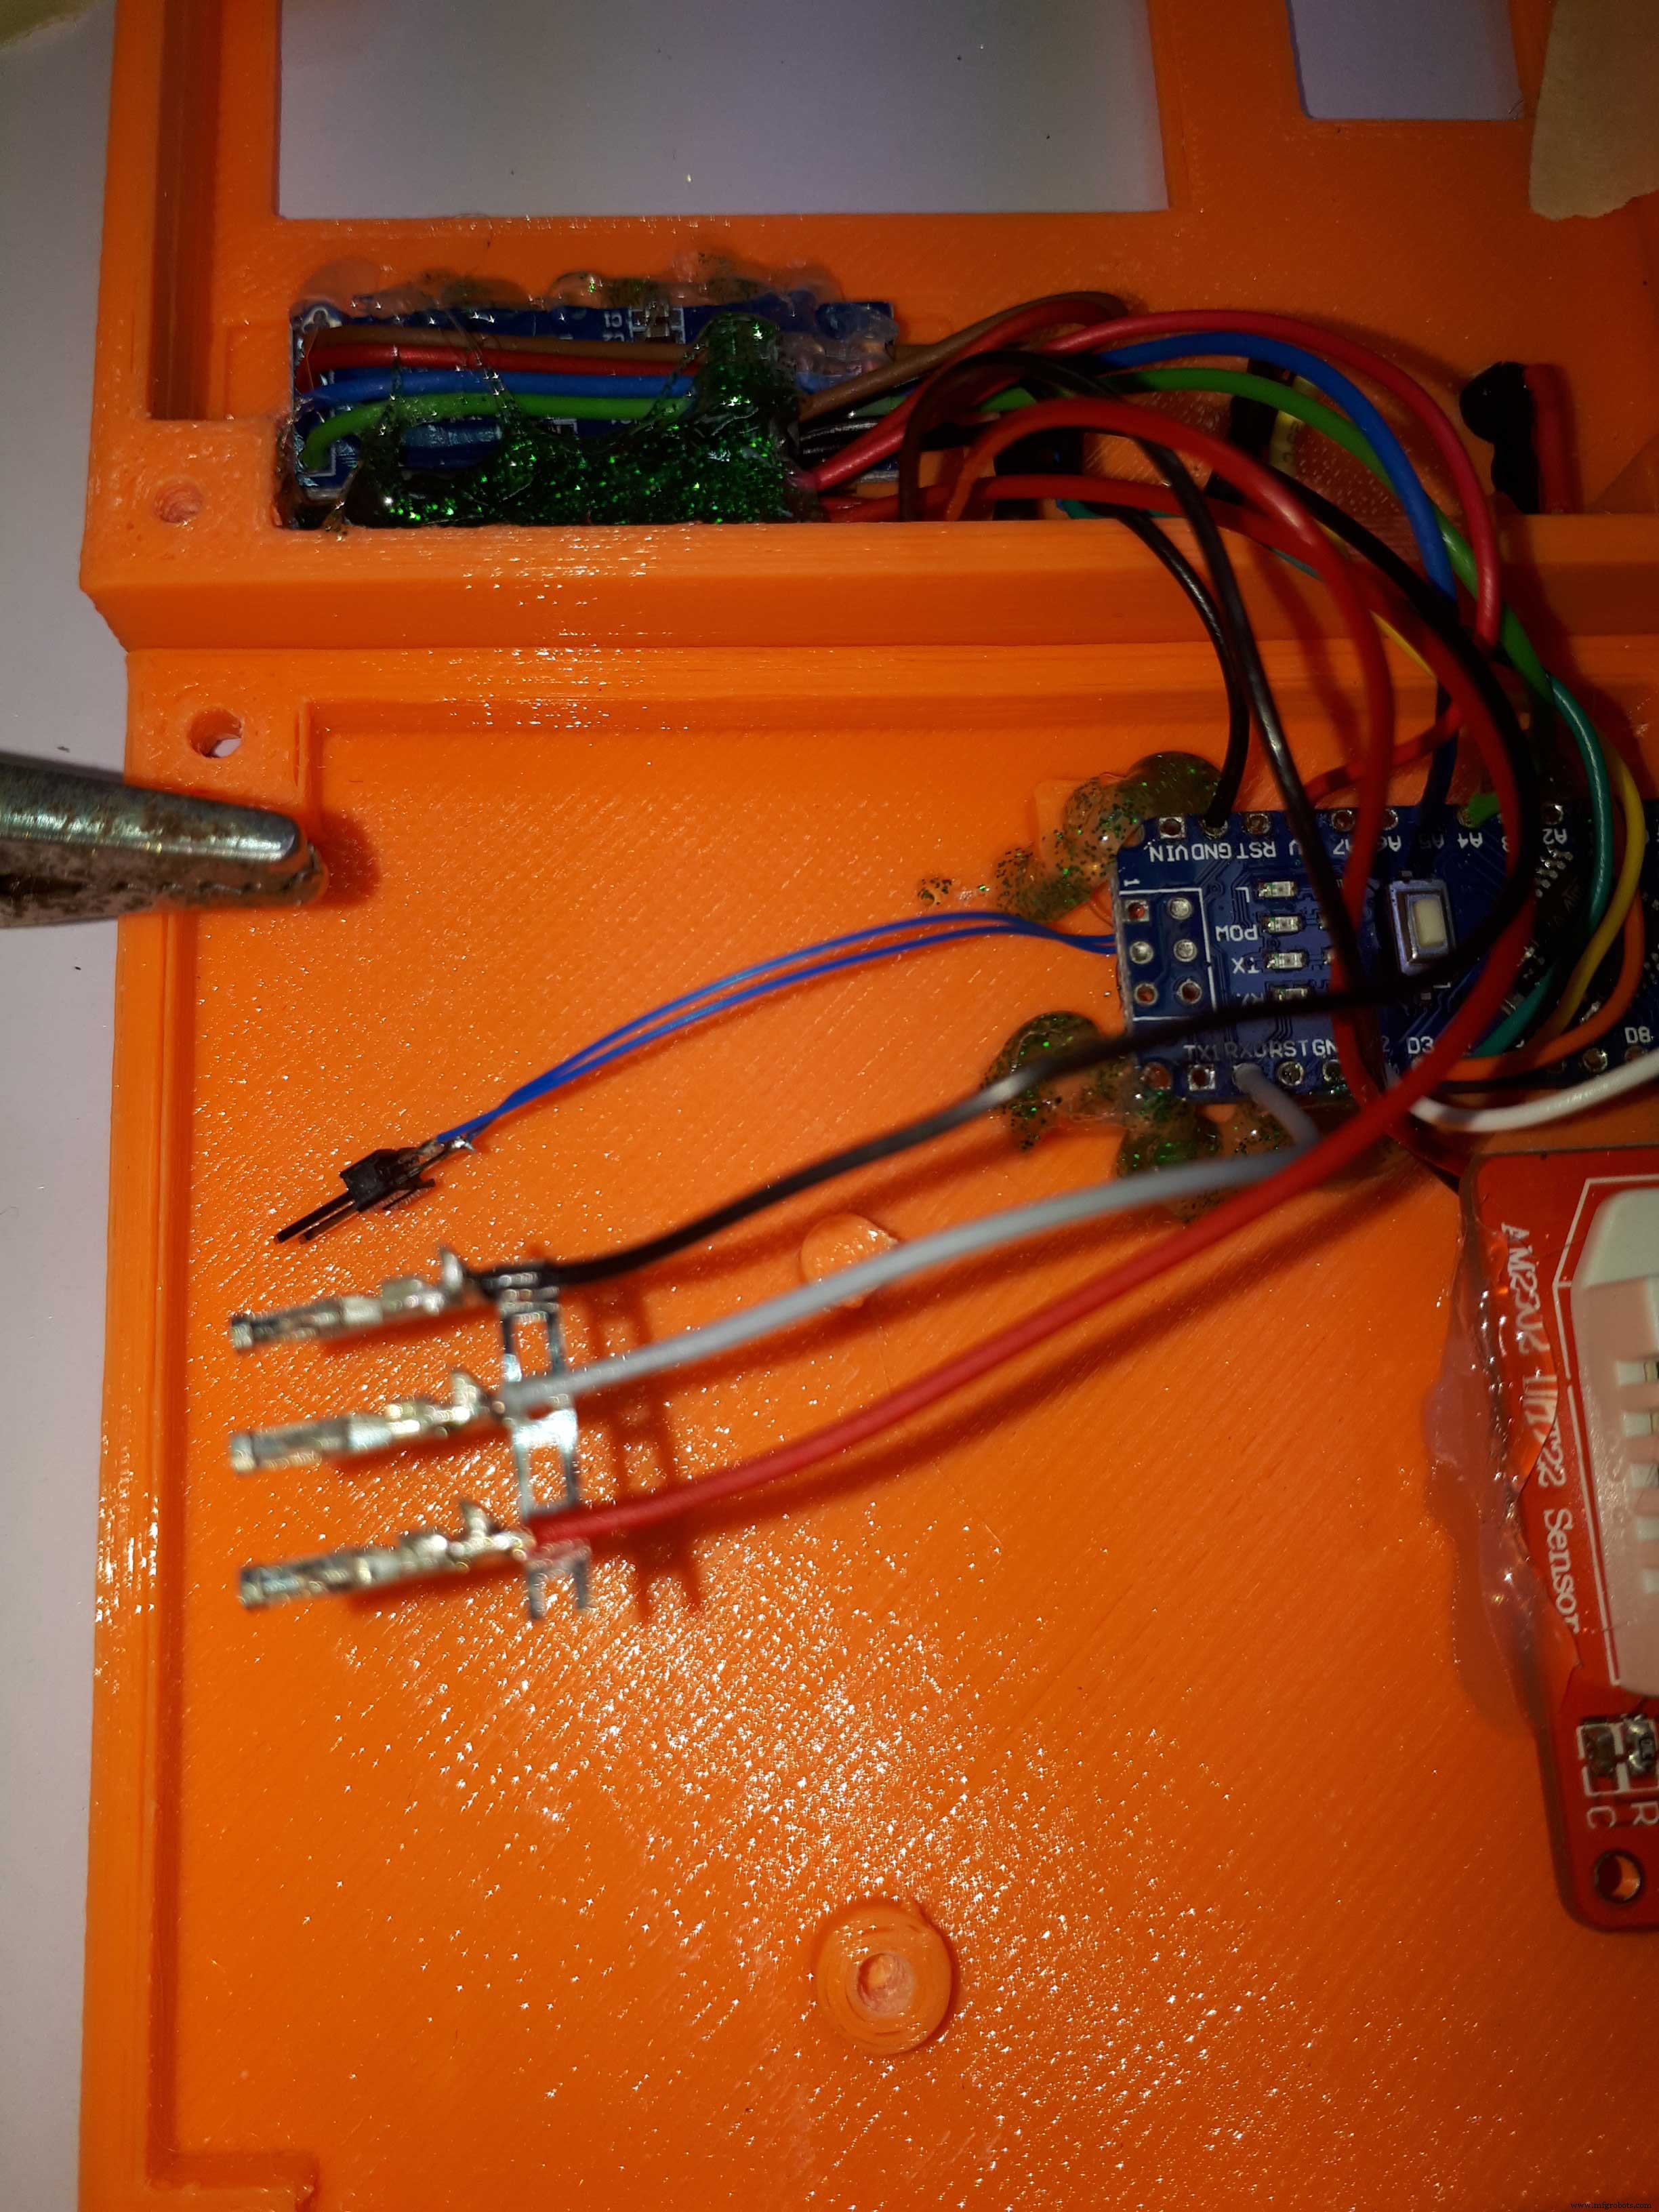
Figure 1 - I have soldered LEDs with their resistors and I have mounted them on the upper part of the case;
Figure 2 - I have inserted a heat-shrink tubing on each resistor and on each wire;
Figures 3/4 - I have fixed the DHT22 sensor module with hot glue;
Figure 5 - I have fixed the display module with hot glue;
Figure 6 - I have soldered all the wires to the Arduino Nano board;
Figure 7 - I have fixed the Arduino Nano board with hot glue;
Figure 8 - I have soldered all the positive wires (red) together and I have inserted the heat-shrink tubing; I have soldered all the negative wires (black) together and I have inserted the heat-shrink tubing;
Figure 9 - I have fixed the red and black wires with the glitter hot glue (I had finished the transparent one :) )
Figure 10 - I have soldered the three female jumpers on each wire in order to connect the SDS018 Sensor module;
Figure 11 - I have inserted a heat-shrink tubing on each female jumper and I have inserted them into the SDS018 sensor module;
Figure 12 - I have mounted the SDS018 sensor module in the lower part of the case with a machine screw M3x6;
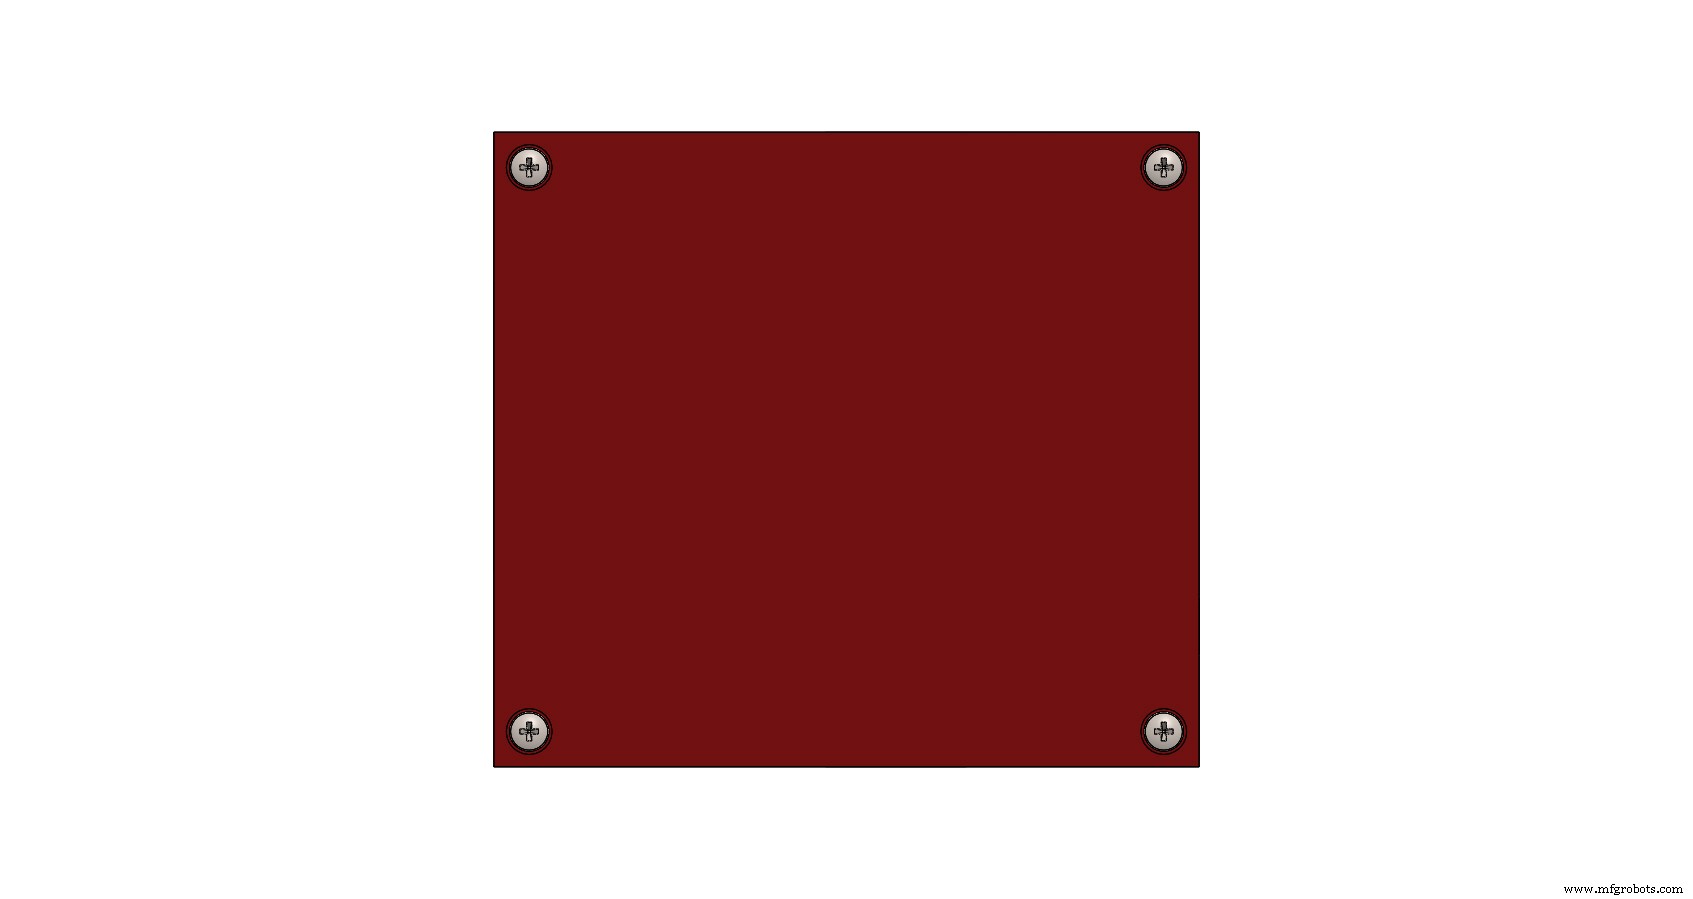
Figure 13 - I have closed the case with four machine screws M3x16.
Firmware
The firmware is an Arduino sketch . In the following figure you can see the simplified flow chart.
At start-up is executed the peripheral setup and the LEDs are checked.
Main loop:
- Only at the first loop (startup) there are 2 seconds delay;
- The DHT22 sensor is read;
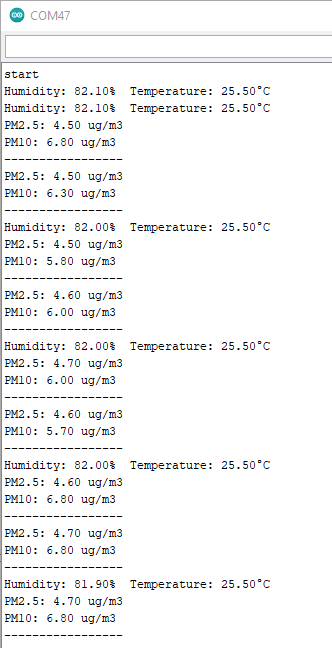
- Temperature and relative humidity are sent to Arduino IDE serial monitor (see the figure below);
- The SDS018 sensor is read;
- PM2.5 and PM10 are sent to Arduino IDE serial monitor (see the figure below);
- If particulate matter concentrations are from 0 to 25 µg/m3 and humidity is between 40% and 60% - Normal alarm state -, then all LEDs get OFF;
- If particulate matter concentrations are from 0 to 25 µg/m3 and humidity is <40% or> 60% or particulate matter concentrations are from 26 to 50 µg/m3 and humidity is between 40% and 60% (to simplify the code I have separated the conditions) - Low alarm state -, then only green LED gets ON;
- If particulate matter concentrations are from 26 to 50 µg/m3 and humidity is <40% or> 60% or particulate matter concentrations are> 51 µg/m3 and humidity is between 40% and 60% (to simplify the code I have separated the conditions) - Warning alarm state -, then green and yellow LEDs get ON;
- If particulate matter concentrations are> 51 µg/m3 and humidity is <40% or> 60% - Alarm state -, then all LEDs get ON;
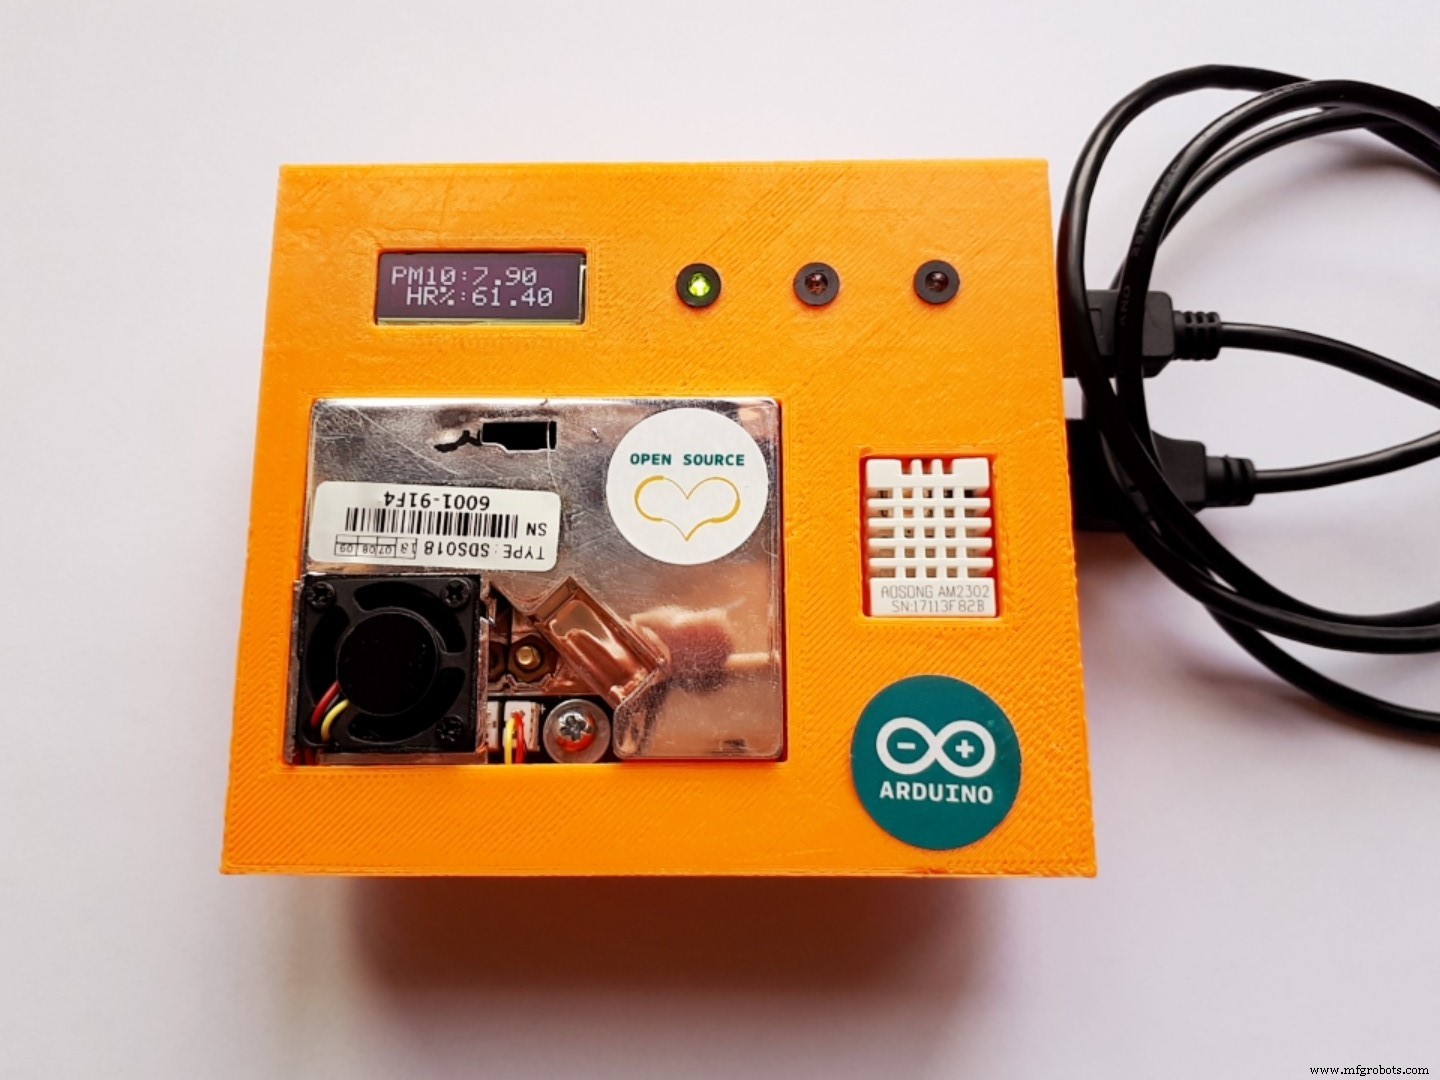
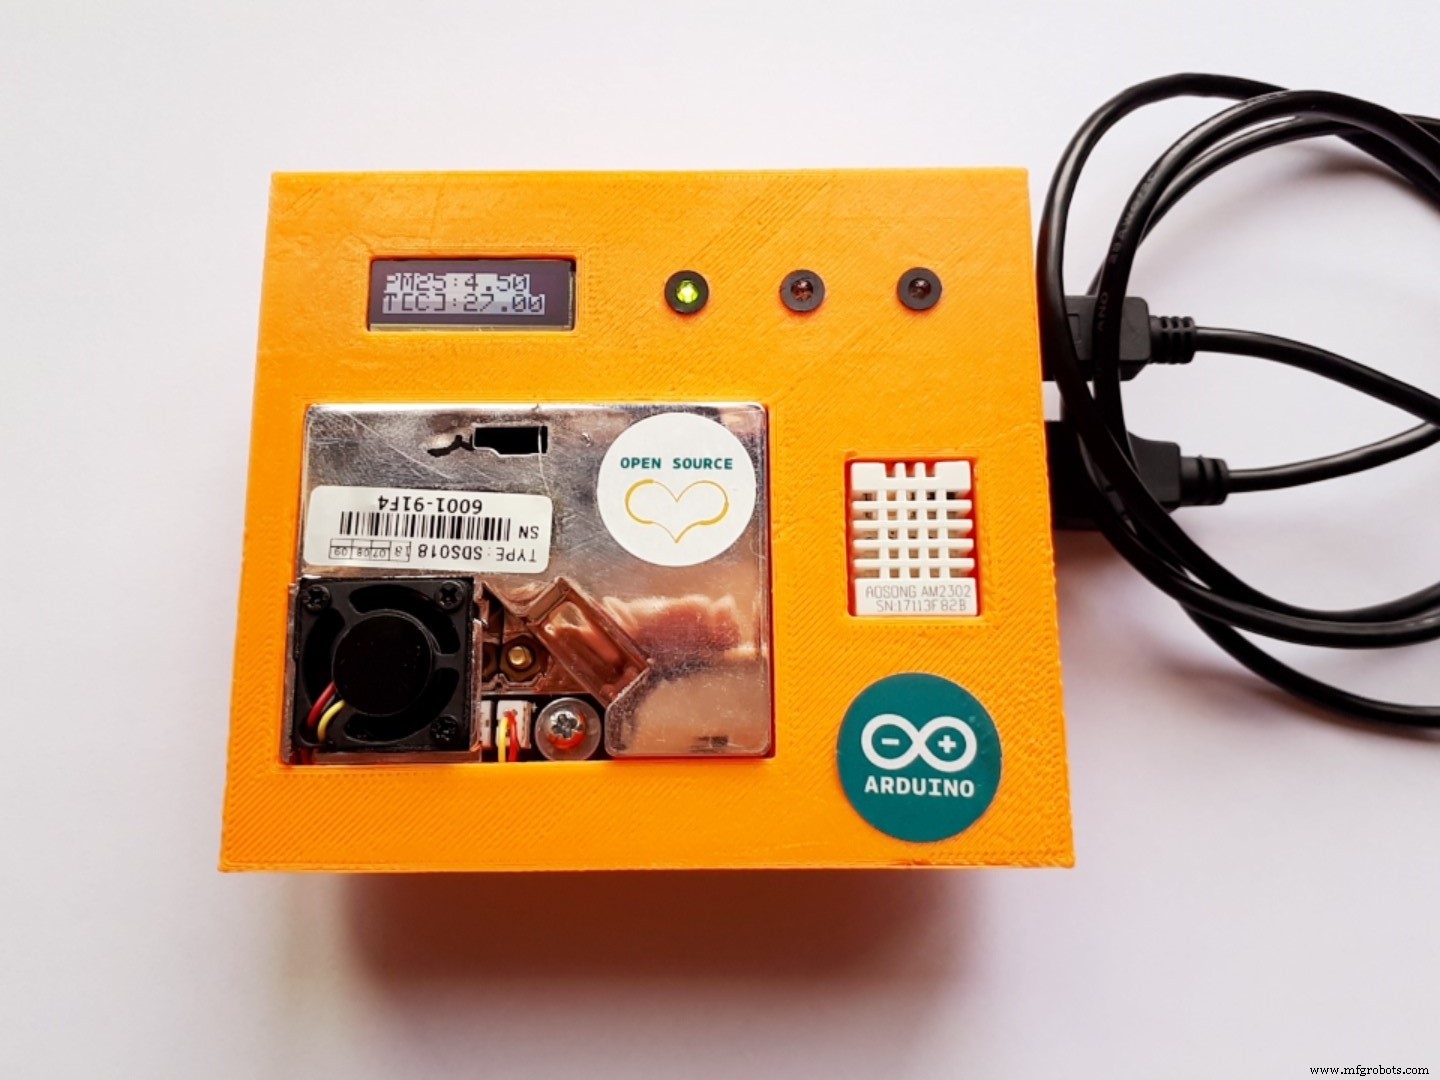
- If switchDisplay flag variable is equal to zero, then PM10 and humidity are visualized on display, otherwise are visualized PM2.5 and temperature in degrees Celsius; if there is an alarm state, instead of displaying PM10, it is visualized the word "Alarm!!!".
At the end of the loop I have inserted a 2 second-delay.
That's all!
If you have any questions or suggestions don't hesitate to leave a comment below. Thank you!
代码
- COVID-19 and PM10 levels! - Code
COVID-19 and PM10 levels! - CodeArduino
The firmware is an Arduino sketch.#include#define SCREEN_WIDTH 128 // OLED display width, in pixels#define SCREEN_HEIGHT 32 // OLED display height, in pixels// Declaration for an SSD1306 display connected to I2C (SDA, SCL pins)#define OLED_RESET 4 // Reset pin # (or -1 if sharing Arduino reset pin)Adafruit_SSD1306 display(SCREEN_WIDTH, SCREEN_HEIGHT, &Wire, OLED_RESET);#include "DHT.h"#define DHTPIN 2 // Digital pin connected to the DHT sensor #define DHTTYPE DHT22 // DHT22 (AM2302)DHT dht(DHTPIN, DHTTYPE);int startdhr22 =0; // Startup flag variable:waiting for the first measurement of DHT22int switchDisplay =0; // Flag variable for switch data on the displayconst int ledRed =3; // Number of Red LED pinconst int ledGreen =4; // Number of Green LED pinconst int ledYellow =5; // Number of Yellow LED pinvoid setup() { pinMode(LED_BUILTIN, OUTPUT); // On-board LED - initialize digital pin LED_BUILTIN as an output pinMode(ledRed, OUTPUT); // Initialize digital pin as an output pinMode(ledGreen, OUTPUT); // Initialize digital pin as an output pinMode(ledYellow, OUTPUT); // Initialize digital pin as an output dht.begin(); Serial.begin(9600); Serial.println("start"); // SSD1306_SWITCHCAPVCC =generate display voltage from 3.3V internally if(!display.begin(SSD1306_SWITCHCAPVCC, 0x3C)) { // Address 0x3C for 128x32 Serial.println(F("SSD1306 allocation failed")); for(;;); // Do not proceed, loop forever } display.clearDisplay(); // Clear the buffer display.setTextSize(2); // Draw 2X-scale text display.setTextColor(SSD1306_WHITE); // Startup:LEDs Test digitalWrite(ledGreen, HIGH); // Turn the LED ON delay(500); // Wait for 0,5 secondS digitalWrite(ledYellow, HIGH); // Turn the LED ON delay(500); // Wait for 0,5 secondS digitalWrite(ledRed, HIGH); // Turn the LED ON delay(500); // Wait for 0,5 secondS digitalWrite(ledGreen, LOW); // Turn the LED OFF digitalWrite(ledYellow, LOW); // Turn the LED OFF digitalWrite(ledRed, LOW); // Turn the LED OFF delay(500); // Wait for 0,5 secondS}void loop() { // ########################################################################### // DHT22 // 0.5 Hz sampling rate (once every 2 seconds). // ########################################################################### if(0 ==startdhr22) { delay(2000); // Startup:waiting for the first measurement of DHT22 startdhr22 =1; } float h =dht.readHumidity(); float t =dht.readTemperature(); // Read temperature as Celsius (default) // Check if any reads failed and exit early (to try again). if (isnan(h) || isnan(t)) { Serial.println(F("Failed to read from DHT sensor!"));返回; } Serial.print(F("Humidity:")); Serial.print(h); Serial.print(F("% Temperature:")); Serial.print(t); Serial.println(F("°C ")); // ########################################################################### // SDS018 // ########################################################################### uint8_t dataIN[10] ={0}; // Data array from SDS018 float pm25; float pm10; while(Serial.available()> 0) { for(int i=0; i<10; ++i) { // loop for acquire 10 bytes dataIN[i] =Serial.read(); // Save data in to dataIN array // Serial.println(dataIN[i], HEX); // Test:Prints data to the serial port (print as an ASCII-encoded hexadecimal) } if((0xAA ==dataIN[0]) &&(0xC0 ==dataIN[1]) &&(0xAB ==dataIN[9])) { // check if array contains dataIN[0]=0xAA and dataIN[1]=0xC0 and dataIN[1]=0xAB uint8_t cksum =0; for(int i=2; i<=7; ++i) { cksum +=dataIN[i]; // Calculation of check-sum } //Serial.print("check-sum:"); // Test:Serial monitor //Serial.println(cksum, HEX); if(cksum ==dataIN[8]) { digitalWrite(LED_BUILTIN, HIGH); // Turn the LED on (HIGH is the voltage level) uint8_t pm25Lo =dataIN[2]; // PM2.5 low byte uint8_t pm25Hi =dataIN[3]; // PM2.5 high byte uint8_t pm10Lo =dataIN[4]; // PM10 low byte uint8_t pm10Hi =dataIN[5]; // PM10 high byte pm25 =((pm25Hi * 256.0) + pm25Lo)/10.0; // Calculation of PM2.5 value pm10 =((pm10Hi * 256.0) + pm10Lo)/10.0; // Calculation of PM10 value Serial.print("PM2.5:"); // Serial monitor Serial.print(pm25); Serial.println(" ug/m3"); Serial.print("PM10:"); Serial.print(pm10); Serial.println(" ug/m3"); } Serial.println("-----------------"); } Serial.flush(); } // ########################################################################### // LEDs // ########################################################################### if((pm10 <=25) &&((h>=40) &&(h <=60))) // Normal – Particulate matter concentrations from 0 to 25 µg/m3 and humidity between 40% and 60%; { digitalWrite(ledGreen, LOW); // Turn the LED OFF digitalWrite(ledYellow, LOW); // Turn the LED OFF digitalWrite(ledRed, LOW); // Turn the LED OFF } else if((pm10 <=25) &&((h <40) || (h> 60))) // Low - Particulate matter concentrations from 0 to 25 µg/m3 and humidity <40% o> 60%; { digitalWrite(ledGreen, HIGH); // Turn the LED ON digitalWrite(ledYellow, LOW); // Turn the LED OFF digitalWrite(ledRed, LOW); // Turn the LED OFF } else if(((pm10> 25) &&(pm10 <=50)) &&((h>=40) &&(h <=60))) // Low - Particulate matter concentrations from 26 to 50 µg/m3 and humidity between 40% and 60%; { digitalWrite(ledGreen, HIGH); // Turn the LED ON digitalWrite(ledYellow, LOW); // Turn the LED OFF digitalWrite(ledRed, LOW); // Turn the LED OFF } else if(((pm10> 25) &&(pm10 <=50)) &&((h <40) || (h> 60))) // Warning - Particulate matter concentrations from 26 to 50 µg/m3 and humidity <40% o> 60%; { digitalWrite(ledGreen, HIGH); // Turn the LED ON digitalWrite(ledYellow, HIGH); // Turn the LED ON digitalWrite(ledRed, LOW); // Turn the LED OFF } else if((pm10> 50) &&((h>=40) &&(h <=60))) // Warning - Particulate matter concentrations> 51 µg/m3 and humidity between 40% and 60%; { digitalWrite(ledGreen, HIGH); // Turn the LED ON digitalWrite(ledYellow, HIGH); // Turn the LED ON digitalWrite(ledRed, LOW); // Turn the LED OFF } else // Alarm - Particulate matter concentrations> 51 µg/m3 and humidity <40% or> 60%. { digitalWrite(ledGreen, HIGH); // Turn the LED ON digitalWrite(ledYellow, HIGH); // Turn the LED ON digitalWrite(ledRed, HIGH); // Turn the LED ON } // ########################################################################### // Display // ########################################################################### if(0 ==switchDisplay) { display.clearDisplay(); display.setTextColor(SSD1306_WHITE); display.setCursor(0,0); // Set the cursor position (Width, Height) if(pm10> 50) // Visualize the word "Alarm" on display { display.print("Alarm!!!"); } else // Visualize the PM10 value on display { display.print("PM10:"); display.println(pm10); } display.print(" HR%:"); // Visualize the humidity value on display display.println(h);显示。显示(); switchDisplay =1; } else { display.clearDisplay(); display.setTextColor(SSD1306_BLACK, SSD1306_WHITE); // Draw 'inverse' text display.setCursor(0,0); // Set the cursor position (Width, Height) display.print("PM25:"); // Visualize the PM2.5 value on display display.println(pm25); display.print("T[C]:"); // Visualize the temperature value on display display.println(t);显示。显示(); switchDisplay =0; } delay(500); // Delay of 500ms digitalWrite(LED_BUILTIN, LOW); // TEST:turn the LED_BUILTIN OFF delay(1500); // Delay of 1500ms}
定制零件和外壳
Case - upper part
File of the 3D upper part of orange PLA casehttps://sketchfab.com/3d-models/case-upper-part-c6843c6613f84805a39e1a9384dd5e56
Case - lower part
File of the 3D lower part of orange PLA casehttps://sketchfab.com/3d-models/case-lower-part-covid-19-and-pm10-levels-9d4d2ef93e644065b627c5562c5cde1f
示意图
Electrical schematic of COVID-19 and PM10 levels!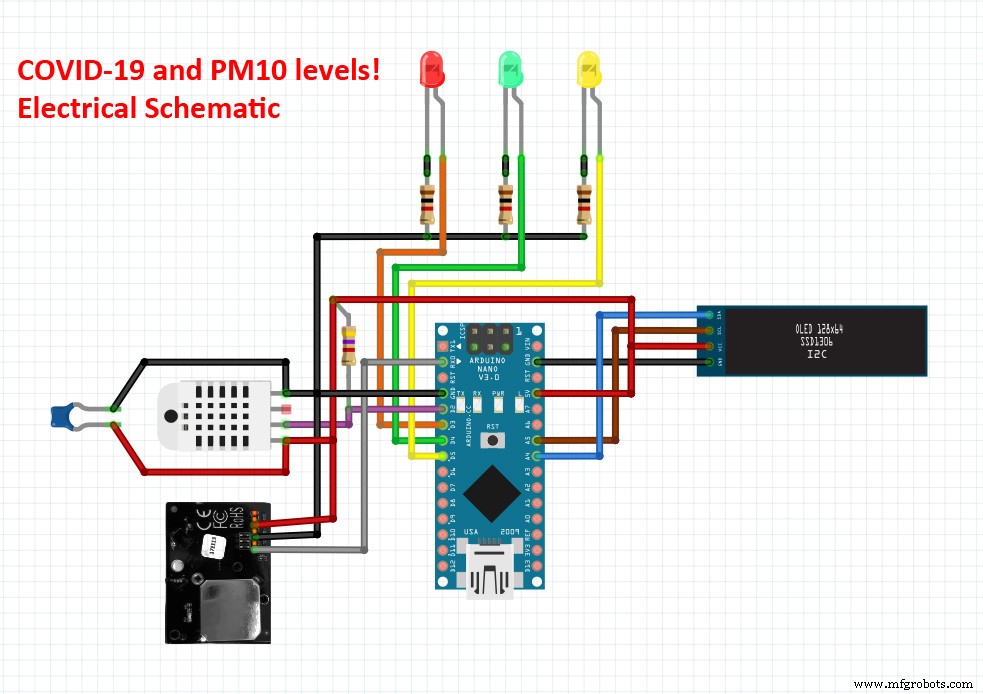
制造工艺