

聚合物纳米结构上 U2OS 细胞中肌动蛋白和焦点粘附组织的分析
摘要
背景
在这项工作中,我们探索了 U2OS 细胞如何受到在平面玻璃表面上制造的聚合物纳米柱阵列的影响。我们专注于描述肌动蛋白细胞骨架组织的变化以及粘着斑的位置、数量和形状。根据我们的研究结果,我们确定细胞可以根据它们在纳米柱上的扩散和粘附行为分为不同的状态。定量分析表明,接种在密集纳米柱阵列上的细胞悬浮在柱子顶部,与平坦表面或稀疏柱阵列相比,形成的粘着斑更靠近细胞外围。这种变化类似于接种在软基质上的细胞的类似反应。
结果
在这项工作中,我们探索了 U2OS 细胞如何受到在平面玻璃表面上制造的聚合物纳米柱阵列的影响。我们专注于描述肌动蛋白细胞骨架组织的变化以及粘着斑的位置、数量和形状。根据我们的研究结果,我们确定细胞可以根据它们在纳米柱上的扩散和粘附行为分为不同的状态。定量分析表明,接种在密集纳米柱阵列上的细胞悬浮在柱子顶部,与平坦表面或稀疏柱阵列相比,形成的粘着斑更靠近细胞外围。这种变化类似于接种在软基质上的细胞的类似反应。
结论
总的来说,我们展示了高通量纳米加工、先进的光学显微镜、分子生物学工具来可视化细胞过程和数据分析的组合可用于研究细胞如何与纳米结构表面相互作用,并将在未来帮助创建诱导特定的培养基质。细胞功能。
图形摘要
<图片>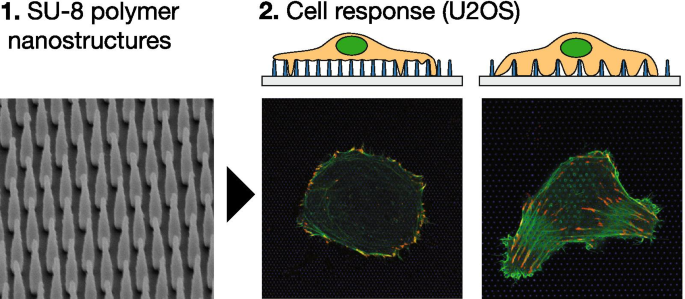
背景
在体内,细胞通常位于称为细胞外基质 (ECM) 的复杂 3D 环境中。 ECM 不仅作为细胞的结构支架,还是生物力学和生化信号的传递者,从而调节组织形态发生、稳态和分化等一系列过程。它由水、多糖和蛋白质组成[1,2,3,4],其组成因组织类型而异。
由于需要创建更好地代表体内条件的细胞培养模型,研究人员越来越多地开始研究 3D 矩阵和“半 3D”系统中的细胞行为。已经确定了平面基底和具有更高维度的系统之间细胞表型的许多差异 [5, 6]。例如,已知平面上的细胞和嵌入 3D 基质中的细胞的活力、增殖、分化和形态等特征不同 [3, 7]。
体内类基质的范围从“半 3D”/2.5D 基质(例如装饰有各种纳米结构的平坦表面)到“真正的 3D”系统(例如胶原凝胶或基质胶基质)[8,9,10,11]。此外,配体在表面上的受控定位可以为细胞如何与各种化学模式相互作用提供新的见解 [12,13,14]。此外,结构刚度甚至表面化学等机械因素已被证明会影响细胞功能 [15,16,17]。为此,已经开发了大量不同的细胞研究底物[3, 18,19,20,21,22]。
也有人认为 3D 培养系统可以更精确地预测药物的体内作用,因此这些系统可以在药物发现中找到应用 [16, 23, 24]。精确控制纳米级地形图案也可用于调节细胞形态。例如,皱纹和凹槽可用于重建心肌细胞的条纹排列,从而更好地代表生理相关条件以模拟各种疾病[25, 26]。
细胞的细胞骨架连接到 ECM 由粘着斑 (FA) 促进,粘着斑是一种多蛋白复合物,包括细胞表面整合素和支架蛋白。根据一组复杂的调节机制,FA 以向前运动所需的周转率形成和分解,例如在细胞迁移中。已知 FA 对 ECM 施加机械力,相反,已知 ECM 对细胞施加力会影响膜中的整合素亲和力和亲和力 [27]。
已知是 FA 组成部分的一种蛋白质是纽蛋白。它是参与将 F-肌动蛋白锚定到整联蛋白复合物的接头蛋白之一。缺乏纽蛋白会改变细胞形态、粘附和运动 [28],并削弱细胞将力传递到底物的能力 [29,30,31]。 Vinculin 不仅参与肌动蛋白细胞骨架与整联蛋白复合物的机械连接,它还具有交联和捆绑肌动蛋白丝的能力 [32,33,34],修饰现有的肌动蛋白束 [35],帽肌动蛋白丝,使新的肌动蛋白聚合位点成核 [36] 并招募肌动蛋白修饰剂 [37]。
细胞通过改变细胞-基质粘附的数量和类型来响应 3D 矩阵,并诱导细胞骨架空间组织的变化。这些变化反过来影响形成的粘连的分布、大小和动态 [4, 38,39,40,41]。这种重排可能导致细胞增殖、形态和运动的变化[42]。
为了了解复杂的 3D 环境对细胞的影响,需要开发新的模型系统,在其中可以研究细胞过程并将其与平面控制进行比较。由于已知细胞反应取决于培养基质的物理、机械和化学特性,因此需要制造具有精确控制特性的细胞基质 [43,44,45]。此外,如果可以使用已经建立的分析技术(例如光学显微镜)轻松研究细胞和基质,则非常有利。
最近受到关注的一种基材是用纳米柱或纳米线装饰的平面 [18, 21, 46,47,48,49,50,51,52,53]。与例如水凝胶相比,这些结构化表面不能模拟真正的 3D 环境,但具有明确定义的表面形貌。这些基板通常称为 2.5D。此类系统已被应用于促进将生物相关分子递送到细胞中 [54, 55]、监测酶活性 [56]、测试核力学 [57] 以及研究调节膜曲率如何影响各种细胞膜相关过程 [58,59,60]。通过在透明基板上制造纳米结构,可以将该方法与光学显微镜相结合。
不同细胞系、纳米结构类型和几何形状的可能组合数量很多,文献中的例子很多。李等人。描述了用随机定位的磷化镓纳米结构装饰的表面上的细胞行为,并量化了具有大 FA 的细胞比例 [61]。在具有各种面积密度的纳米线的表面上研究细胞和 FA 形态。结果表明,接种在低密度表面的细胞与基质接触并在细胞边缘周围形成大的 FA。在这些阵列的大部分细胞中检测到大 FA。对于高纳米线面密度,细胞悬浮在纳米线阵列的顶部,并观察到细胞下方的点状 FA。与表面具有低纳米线面积密度的细胞相比,这些阵列上较少比例的细胞显示出较大的 FA。
Buch-Månson 等人。研究了硅纳米柱阵列随机放置在硅衬底上的细胞纳米结构表面相互作用[62]。在使用的制造过程中,控制面密度而不是柱-柱距离。对 FA 的研究表明,具有中等面密度的阵列上的细胞具有最多的 FA,并且形状也最不对称。有人提出这些 FA 中的一些形成在纳米柱的侧壁上。这在具有低和高面纳米柱密度的表面上没有观察到。
在之前的工作中,我们描述了在平面玻璃表面制造 SU-8 聚合物纳米结构的详细方案 [63],并探索了这些表面上两种不同细胞系的细胞行为 [45, 48]。在这项工作中,我们使用电子束光刻 (EBL) 来制造装饰有垂直排列的 SU-8 聚合物结构的表面,以研究骨肉瘤上皮细胞系 U2OS 中肌动蛋白细胞骨架和 FA 组织的变化。我们对具有不同拓扑线索的表面引起的变化进行了定性和定量分析。
结果
使用先前建立的协议,我们制造了玻璃盖玻片,装饰有精确定义的垂直定向 SU-8 纳米柱 (NP) 阵列,具有可变分离和定义的几何形状 [63]。 NP 面密度为 456、205、115 和 29 NPs/100 μm 2 的表面 (对应于 500 纳米、750 纳米、1000 纳米和 2000 纳米的间距)被使用。首先,我们检查细胞形态、肌动蛋白细胞骨架结构和细胞-底物相互作用的一般趋势。我们通过对各种纳米结构基板和平板玻璃控制上的细胞和 FA 形态进行定量比较来遵循这一点。我们将高分辨率显微镜与高通量制造相结合,对每种表面类型至少对 \({\approx 100}\) 个细胞进行定性分析,并在 24 小时和 48 小时后成像。我们总共分析了> 400 张高分辨率图像和 20 个 3D 数据集。
图 7显示了 NP 阵列 (A、B) 和制造基板 (C、D) 的电子显微镜图像的示意图。含有纳米结构的载玻片使用石蜡安装在中空底部、35 毫米培养物下,结构朝上。图 1C、D 中显示的自上而下和有标题的侧视电子显微镜图像显示了间距和高度为 1000 nm 的纳米柱阵列。表 1 显示了这项工作中使用的阵列的几何参数、它们的分类以及相应的 NP 面积数密度。我们根据观察到的细胞粘附行为将 NP 阵列分为密集和稀疏(见下文)。
图 1 显示了在玻璃 (A) 和纳米结构表面 (B-F) 上培养 24 小时的代表性 U2OS 细胞。这些细胞已与 pCMV-LifeAct-GFP 和 pTAG-RFP-Vinculin 共转染,这允许通过分别产生荧光 LifeAct-TagGFP2(以下简称:LifeActGFP)和 TagRFP-vinculin 融合蛋白来可视化 F-肌动蛋白和纽蛋白。 FAs 中的 F-肌动蛋白网络和富含纽蛋白的区域被清楚地检测到。在细胞外围,LifeActGFP 信号非常靠近细胞膜,因此我们使用该信号来可视化细胞形态。来自 SU-8 NP 的信号以蓝色显示(参见“实验”部分)。
<图片>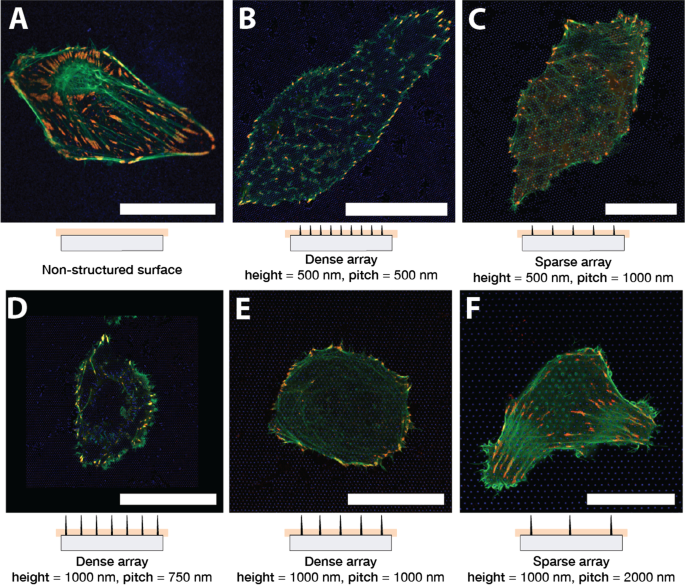
U2OS 在不同表面类型上表达荧光 LifeActGFP(绿色)和 TagRFP-纽蛋白(红色)。黄色表示来自 LifeActGFP 和 TagRFP-纽蛋白通道的重叠信号。在每张显微照片下方,显示了相应 NP 阵列的示意性侧视图,以及采集平面的大致位置。在 A 上成像的细胞 非结构化平面玻璃表面和具有不同阵列间距和结构高度的柱阵列:B 500 纳米间距和 500 纳米高度,C 1000 纳米间距和 500 纳米高度,D 750 纳米间距和 1000 纳米高度,E 1000 纳米间距和 1000 纳米高度,以及 F 2000 纳米间距和 1000 纳米高度。呈现的所有图像都是具有代表性的细胞。比例尺 25 微米。注意C 与其他图像的比例不同
使用转染细胞的初步测试表明,接种在玻璃和结构化表面上的细胞似乎在大约 6 小时后完全扩散。没有观察到不同表面之间细胞扩散的明显差异,目视检查没有发现由于此时或以后的实验中的柱阵列导致细胞活力降低的迹象。在以下实验中,细胞在接种后 6 小时转染,然后在转染后 24 小时、48 小时成像,对应于接种后 30 小时、54 小时的转染。下面这两个时间点以播种后的观察时间为单位,即24h、48h。
将细胞接种在高度为 500 nm、1000 nm 和间距为 750 nm、1000 nm、2000 nm 的 NP 阵列上。在初始铺展后,观察到细胞呈圆形或拉长状,类似于平面上的情况。发现这种一般形态在多次实验中是一致的。接种在稀疏 NP 阵列上的细胞通常具有与玻璃表面上的细胞相似的形状,参见图 1F,描绘了 2000 nm 间距阵列上的代表性细胞。 F-肌动蛋白纤维也存在于 NPs 的底部和玻璃表面附近,表明细胞能够进入靠近基板的区域。正如之前所观察到的 [45, 62, 64],密集阵列上的细胞通常似乎悬浮在 NP 的顶部(图 1B、D、E)。密集阵列上的细胞在靠近玻璃表面的地方似乎没有明显的 F-肌动蛋白,这表明肌动蛋白纤维没有在靠近基板的柱子之间形成。 NP 高度和分离之间的关系决定了细胞是粘附在基板上还是悬浮在 NP 阵列的顶部。这例如在图 1C 中说明,其中较短的 NPs 导致细胞接触基板,而较长的 NPs 阻碍接触,图 1E。这些对肌动蛋白纤维的观察得到了对某些表面进行的 z-stacks 的进一步证实,如图 2 所示。
为了更详细地了解细胞如何粘附到结构化和非结构化表面,我们评估了通过存在 TagRFP-纽蛋白融合蛋白而可视化的 FA 分布。平面上的细胞通常形成细长的 FA,分布在整个细胞体下方,如图 1A 所示。
在稀疏阵列上,U2OS 能够接触 NP 之间的玻璃表面,并与玻璃上的细胞类似地粘附,如图 1C、F 所示。对于这些 NP 阵列,在 NP 之间的玻璃上形成的 FA,以及 F-肌动蛋白信号在靠近 NPs 底部获得的图像中也检测到了。这表明细胞能够弯曲纳米结构周围的膜。然而,更密集阵列上的细胞,例如 750 nm、1000 nm 间隔和 1000 nm 高度,明显阻碍了粘附在纳米结构之间的基底上,如图 1D、E 所示,该图像是在靠近基底底部获得的NP。然而,在外围周围,细胞通常能够附着在形成 FA 的纳米结构之间的基底上,通常由下面的柱阵列的对称性决定。
细胞在长度较短且柱间距为 1000 nm 的 NP 阵列上扩散,形成了朝向外围和细胞体下方的粘附。 F-肌动蛋白纤维取向由底层阵列的对称性决定,如图1C所示。然而,含有 FAs 的 vinculin 的位置和方向没有表现出任何清晰的模式,FA 在 NPs 之间形成。
如图 1B 所示,与平面表面相比,500 nm 柱上的 U2OS 细胞与柱间距离为 500 nm 通常形成更少和更小的粘附。对于接种在该阵列上的细胞,主要在靠近玻璃表面的位置观察到肌动蛋白纤维,在这些位置它们终止于 FAs。同样,这是肌动蛋白网络与表面接触受阻的迹象,因此假定细胞悬浮在阵列的顶部。然而,细胞似乎在柱子上方形成了更完整的 F-肌动蛋白网络。在柱子之间观察到的部分肌动蛋白网络似乎与底层 NP 阵列中的结构一致。这可以在图 1B 中看到,因为 F-肌动蛋白纤维和 FA 主要沿晶格方向之一形成,即平行于柱阵列的开放“线”。
在密集和稀疏阵列上,我们观察到在 NP 周围形成的“环状”F-肌动蛋白结构,向上突出到细胞体中。 F-肌动蛋白环结构在稀疏阵列上显得更为突出,如图1E、F所示。
<图片>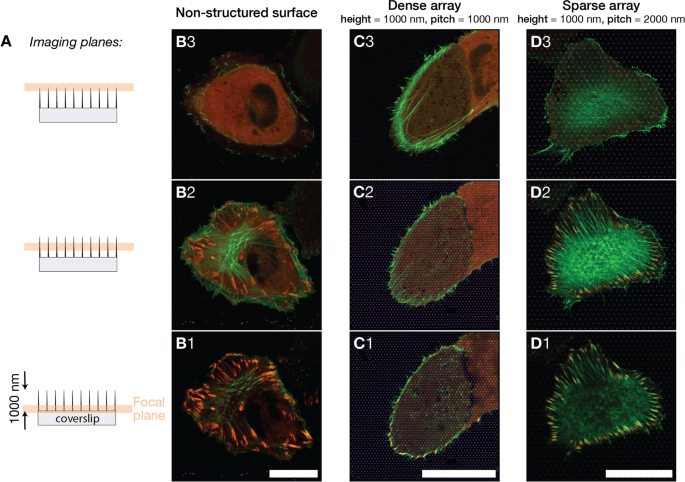
A 在三个指定的焦平面上获取不同表面上的 U2OS 细胞图像。图像是在靠近支柱底部、大约半支柱高度和靠近支柱顶点处获得的。成像平面位于距平板玻璃表面 0.0 μm、0.4 μm、0.8 μm 处。 B –D ) 合并的荧光图像显示 U2OS 在不同表面类型上表达荧光 LifeActGFP(绿色)和 TagRFP-vinculin(红色),黄色表示 LifeActGFP 和 TagRFP-vinculin 重叠。成像表面为B 非结构化玻璃表面,C 1000 纳米间距柱阵列,D 2000 纳米间距柱阵列。呈现的图像代表每种表面类型上的细胞。每种表面类型的焦平面之间的垂直距离约为 400 纳米。比例尺 25 μm
基于上述结果,我们选择了三个表面来对细胞形态和 FA 进行更详细和定量的描述。我们研究密集阵列(间距 1000 纳米,长度 1000 纳米)、稀疏阵列(间距 2000 纳米,长度 1000 纳米)上的细胞,并将结果与用作对照的平板玻璃表面上的细胞进行比较。
通过将 Airyscan 检测器与专用图像后处理结合使用,我们能够以约 140 nm 的 xy 分辨率和约 400 nm 的 z 分辨率进行成像 [65]。图 2 显示了三个表面上的细胞图像,成像平面相距约 400 纳米。不同z下F-肌动蛋白束的研究 .平面上的细胞在同一焦平面或 FA 正上方具有清晰可见的 F-肌动蛋白网络(见图 2-B2)。对于密集阵列上的细胞,与与玻璃支持物接触的 FA 平面相比,在细胞内更高的焦平面上发现了 F-肌动蛋白网络(图 2-C1 和 C2/C3)。对于稀疏阵列上的细胞,情况与玻璃对照上的细胞相似,肌动蛋白网络和 FA 在相同高度检测到(图 2-D2)。该数据支持了初步观察,即稀疏阵列上的细胞附着在结构之间的表面,而密集阵列上的细胞主要能够粘附在细胞外围周围的表面。
为了分析和量化三个选定表面的 FA 和细胞形态的差异,使用了基于 Python 的图像分析脚本(参见“实验”)。对于定量分析,分析了 300 多张高分辨率图像。在这些图像中,鉴定了> 400 个细胞和> 7700 个 FA,表 2 列出了分析中包含的三种表面类型的检测到的细胞和 FA 的数量。对于所有表面,在转染后 24 小时和 48 小时对细胞进行成像。在以下分析中,比较了 3 种表面类型和 24 小时后、48 小时后细胞的几何参数,例如表面积、圆形度和纵横比。其他分析可以在补充信息中找到。细胞的表面积、圆形度和纵横比如图 3 所示,FA 数量、每个细胞的组合 FA 面积和 FA 面积与细胞的比例如图 4 所示。几何参数的定义如“实验”中所述部分。
<图片>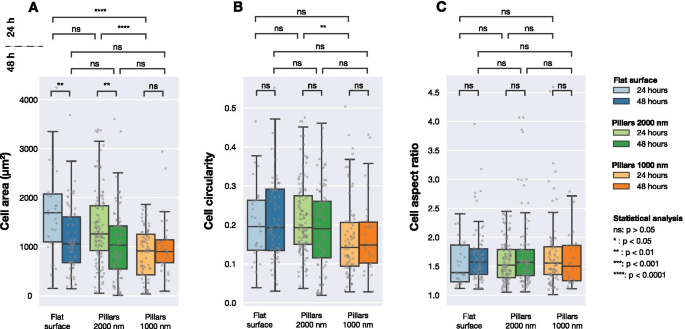
在转染后 24 小时和 48 小时成像的不同表面上表达荧光 LifeActGFP 和 TagRFP-纽蛋白融合蛋白的 U2OS 细胞的计算细胞面积、细胞圆形度和细胞纵横比。基于 LifeActGFP 信号的强度进行图像检测。每个灰点对应一个单元格,箱线图显示中值 (Q 2) 以及第一个 (Q 1) 和第三个四分位数 (Q 3)。使用 Mann-Whitney 非参数检验评估分布之间的统计差异
图 3 总结了为平面和结构化表面收集的数据。如图 3A 所示,在细胞培养 24 小时后观察到细胞面积的显着差异。然而,48 小时后,研究表面的平均细胞面积之间没有显着差异。在考虑细胞圆形度时(图 3B),除了接种在 24 小时后成像的密集和稀疏柱子上的细胞之间之外,在不同表面之间没有检测到显着差异。所有三个表面上的细胞具有相同的平均纵横比,如图 3C 所示。
<图片>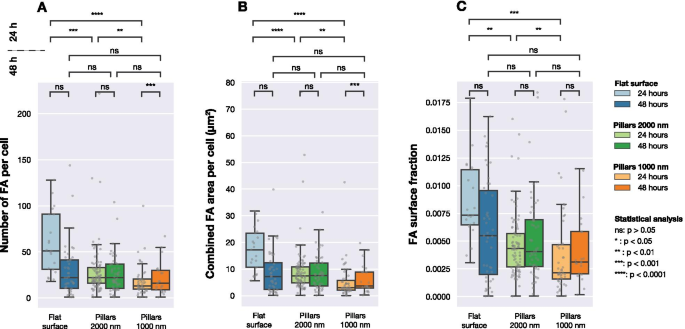
在三种不同表面类型(间距为 1000 nm 和 2000 nm 的平面和柱状阵列)上成像的细胞的 FA 数量、每个细胞的组合 FA 面积以及 FA 面积与细胞面积的比例。每个灰点对应于一个单元格的观察。使用 Mann-Whitneys 非参数检验确定分布之间的统计显着性
图 4 显示了每个细胞中检测到的 FA 数量的分布、每个细胞中 FA 的总表面积以及 FA 面积与细胞面积的比率。 24 小时后,三个不同表面上的细胞形成的 FA 数量显着不同。如图 4B 所示,对于接种在平坦和结构化表面上的细胞,每个细胞的总 FA 表面积是不同的。比较不同表面的 FAs 的相对量(检测到的 FAs 的总面积除以总细胞面积)时也可以看到相同的结果,如图 4C 所示。
然而,培养 48 小时后,不再观察到细胞群之间的显着差异。当考虑每个细胞的 FA 数量、每个细胞的组合 FA 面积或 FA 表面分数时,三个表面之间没有发现差异。
<图片>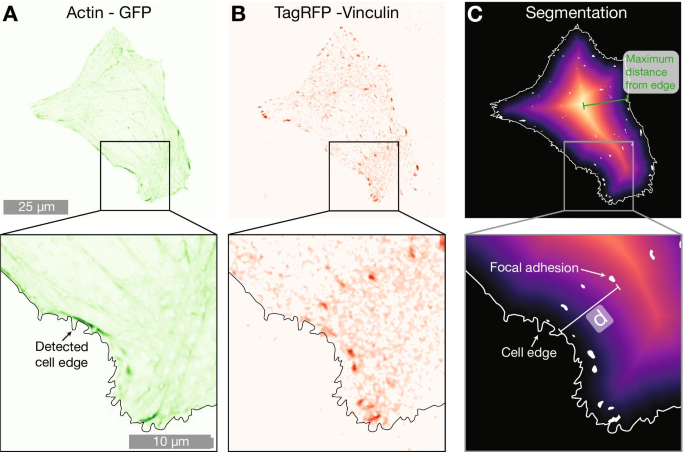
表示 A 的 2000 纳米柱阵列上的示例细胞 LifeActGFP(绿色)和B TagRFP-纽蛋白(红色)。叠加在两张图上的是检测到的细胞边缘,通过使用来自 LifeActGFP 表达的信号确定(如A )。 C 显示与检测到的单元格边缘以及检测到的 FA 的距离图。最短距离(用d表示 图中)从每个分割的纽蛋白点(白色区域)到细胞外围(用白色实线表示)计算图像中的所有 FAs
为了了解 NP 的存在是否影响 FA 在细胞中的定位,我们使用 FA 的位置进行了进一步分析。显微镜数据表明,密集 NP 阵列上的细胞中的 FA 位于更靠近细胞外围的位置,如图 1 和图 2 所示。 1 和 2。为了量化这种趋势,我们计算了从每个 FA 到单元边缘的最短距离。这如图 5 所示进行。F-肌动蛋白用于确定外围的位置,并通过构建距离图,计算检测到的 FA 的每个中心与细胞外围之间的距离。为了解决单元格大小的差异,我们将检测到的单元格边缘和 FA 之间的距离归一化为每个单元格从边缘到几何中心的最大距离(该距离相当于圆形单元格的半径)。通过最大距离归一化的数据如图 6 和表 3 所示。对于平面上的细胞,FAs 更靠近细胞中心分布,而在稀疏的 2000 nm 阵列和密集的 1000 nm 阵列上,FAs位于更靠近细胞外围。这种效果在间距为 1000 纳米的密集阵列中最为显着。另一种归一化方法的结果,其中 FA 位置按细胞表面积归一化,包含在补充信息中。该数据显示了与图 6 中每个单元格中到边缘的最大距离归一化的数据相同的定性趋势。
<图片>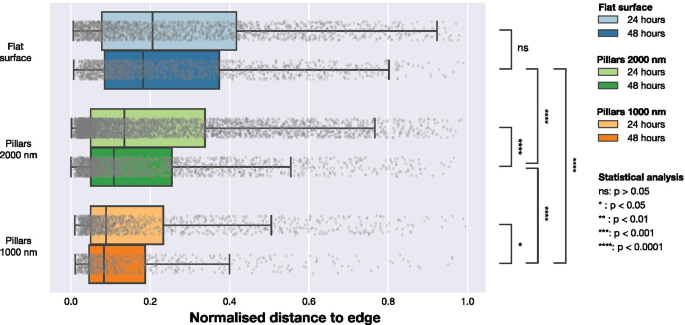
FA 位置相对于最近单元边缘的分布,由单元几何中心到边缘的最大距离归一化。通过计算从每个观察到的 FA 到 LifeActGFP 信号定义的细胞边缘的距离来获得距离,并在 24 小时和 48 小时绘制三种表面类型。灰点代表 FA 的个别观察结果,它们的分布在箱线图中进行了总结。为了检验来自不同表面和时间点的 FAs 来自同一分布的可能性,对所有分布进行了 Mann-Whitney 检验,显着性水平如图所示
讨论
肌动蛋白细胞骨架的组织和粘连的形成是在平坦表面上广泛研究的过程。本研究旨在调查和量化纳米柱阵列上肌动蛋白细胞骨架和粘着斑组织的变化。在这项研究中,我们没有研究纳米柱阵列如何影响细胞迁移。然而,我们预计密集阵列上的细胞可能具有更高的运动性,正如之前在小鼠胚胎成纤维细胞的相同柱阵列上观察到的那样 [45]。
允许细胞在较长时间内扩散并粘附在表面上,可以观察肌动蛋白细胞骨架组织和完全成熟的 FA 的存在。接种后 24 小时,我们观察到接种在表面的细胞在细胞面积、圆形度和纵横比方面存在显着差异。然而,48 小时后未检测到显着差异,表明 24 小时后的细胞尚未完全粘附到表面,纳米结构在完全成熟之前主要影响 FA 组织。 24 小时后和 48 小时后均未观察到 NP 顶部或侧面的任何 FA 形成。
肌动蛋白细胞骨架组织的变化也与细胞如何与周围环境相互作用有关。例如,应力纤维和 FA 在受到拉伸时都会生长,并且似乎在功能上相互依赖 [66]。其他人报告说,对于接种在柔软或柔顺表面上的细胞,经常观察到更圆的细胞和边缘周围的 FA 定位 [67]。在我们的结果中,我们观察到类似的趋势。密集阵列上的细胞倾向于显示细胞边缘周围的纤维,如图 2 和图 3 所示。 1E 或 2B。这些细胞的 FA 似乎靠近细胞边缘形成。我们推测,当细胞缺乏平坦表面时,例如当细胞悬浮在柱子顶部时,FAs 的分布类似于软基质上的 FAs,例如 Prager-Khoutorsky 及其同事使用的 [67]。
从我们的结果中,我们观察到悬浮在柱子顶部的细胞似乎在柱子上方具有发达的肌动蛋白网络,但在柱子本身上没有形成 FA。然而,对于稀疏阵列上的细胞,细胞似乎受 NPs 的影响较小,肌动蛋白网络和 FAs 都显得更“平坦”。
FAs 和肌动蛋白细胞骨架之间的相互作用是复杂的,仍然没有完全表征。 FA 将肌动蛋白细胞骨架与 ECM 连接起来,作为牵引点并促进细胞中应力纤维的形成。相反,肌动蛋白纤维再次影响 FA 的组织和成熟。许多研究描述了细胞如何倾向于悬浮在密集 NP 阵列的顶部 [61, 62, 68] 以及细胞膜如何与单个 NP 相互作用 [69,70,71]。这些观察结果得到了理论研究的证实 [64] 并且细胞在柱子上的行为得到了很好的理解。
FAs 形成和附着在密集阵列上的细胞边缘周围的基板背后的机制仍不清楚。在这方面,与软基板上的细胞进行比较特别有趣。对于软底物,肌动蛋白纤维在细胞边缘附近以环状方式组织,FAs 在细胞外围形成 [67]。 On the nanopillar arrays similar type of architecture is observed, but the actin fibres are typically shorter. Similar qualitative trends in terms of actin organisation and FA formation were observed by Li et al. for cells seeded on random nanowire arrays made from gallium phosphide [61].
In our studies we also observed formation of F-actin rings around NPs. The formation of F-actin rings around NP has previously been described for fibroblasts on similar surfaces [45] and for U2OS cells on nanostructures with a range of structure sizes [58].
Contrasting our results to other studies highlight an important aspect of studies on cellular response to NP arrays:cellular response may vary considerably depending on cell type, NP material, NP geometry and as well as other parameters. For example, Buch-Månson et al. studied fibroblasts and investigations of FAs showed that cells suspended on arrays with intermediate NP density had the highest number of FAs. In our results we do not see a similar trend. However, these studies cannot be directly compared as Buch-Månson et al. studied another cell line using a system with different array geometry, surface porosity and NPs length [62].
There are also studies describing the effect FAs placement has on cells [41]. By modelling cells on planar substrates Stolarska et al. suggest that the cells can control intra-cellular stresses by three mechanisms:FA position, FA size and attachment strength. FAs around the periphery allows the cells to be more sensitive to changes in the micro-environment. This could also be an underlying mechanisms for cells on NPs. Yet, it is not obvious that the results for the planar substrate are directly transferable to NP decorated surfaces.
Cell-interactions with the surrounding environment, for flat substrate, NPs arrays or in vivo ECM, are regulated by a complex set of relations between actin organisation, membrane mechanics, cell dynamics and contact with FAs. To further explore these relations, applying flat surfaces structured with NPs could be one promising approach. Such surfaces may also aid in exploring discrepancies in the cellular response to environmental cues between different cell lines.
Conclusions
In order to create more physiologically relevant systems for cellular studies, a plethora of 3D and 2.5D approaches have been proposed. One approach is to use flat-surfaces decorated with vertically aligned nanostructures as a simple model system. High resolution live cell imaging of co-transfected U2OS cells expressing pCMV-LifeAct-GFP and pTAGRFP-Vinculin have been used to study the influence of nanopillar arrays on actin cytoskeleton focal adhesion organisation. Our present results indicate that the U2OS cells spreading on surfaces decorated with nanopillars can be categorised into three different regimes by how they respond to the nano-structures. These observed changes are quantified by analysing more than 400 high-resolution images, and indicate that tuning geometrical properties of the nanostructured surface can be used to direct cell behaviour.
More specifically, the U2OS cells were found to either contact the substrate, attach preferably around the cell edge, or be fully suspended on top of the vertical NP arrays. In the latter case, we hypothesise that the resulting reorganisation of FA and cytoskeleton is an effect analogous to what is seen for softer substrates.
Increased understanding of how cells behave on nano-structured surfaces, such as pillar arrays, could help us discover more details about complex cellular processes. For example, it is still poorly understood how changes in the actin cytoskeleton and its architecture influence cell signalling. By studying the cell response on nanostructured surfaces in a systematic way, the potential connection between actin cytoskeleton, cell adhesions and a plethora of biochemical signalling pathways could be further explored. We therefore envision that further development of the presented platform and analysis could have implications for advanced in vitro applications or for development of smarter in vivo biointerfaces.
Methods
Fabrication of Nanostructures and Sample Mounting
SU-8 nanostructures were fabricated as previously explained [63]. Briefly, 24 mm by 24 mm glass cover slips (#1.5, Menzel-Gläser, thickness 170 μm) were cleaned by immersion in acetone, isopropyl alcohol, rinsed in de-ionised water and dried. The cover slips were then oxygen plasma treated for 2 min (Diener Femto plasma cleaner, power 100 W, base pressure 0.3 torr), followed by dehydration for 10 min on a 150 °C hot plate. Samples were then placed in a desiccator containing an open vial of Hexamethyldisilazane (HMDS, Sigma Aldrich product no:440191). HMDS was applied by vapour deposition, the desiccator was pumped to low vacuum using a diaphragm pump for 5 min and the samples were kept in HMDS atmosphere for 60 min.
Substrates for EBL were prepared directly after HMDS treatment by spin coating SU-8 2001 (Microchem Corp.) to a desired thickness of 500 nm and 1000 nm. SU-8 was made fluorescent by adding either Oxazine 170 perchlorate, Rhodamine 800 or Coumarin 102 (all Sigma Aldrich) to a final concentration of 100 μg mL −1 resist. After spin coating samples were dehydrated on a hot plate at 95 °C. To mitigate charging during EBL exposure samples were then covered by a layer of conductive polymer AR-PC 5091 Electra 92 (AllResist GmbH) by spin coating at 2000 rpm for 60 s to thickness of 50 nm.
An Elionix ELS-G100 100 kV EBL-system was used to fabricate SU-8 nanopillars (NPs) with processing parameters as described in our previous work [63]. Table 1 summarise the arrays fabricated for this work. Pillar arrays were exposed using the Elionix dot-pattern generator where each pillar is exposed in a single exposure. Arrays were exposed over an area of 2000 μm by 4000 μm, with a current of 500 pA in write fields of 500 μm by 500 μm. NPs had a tip diameter of about 100 nm as a base diameter of 150 nm and 200 nm for structures of length 500 nm and 1000 nm respectively.
After EBL exposure, the samples were rinsed in DI-water to remove the conductive polymer, then post exposure baked for 2.3 min at 95 °C and developed twice in mr-Dev 600 (Micro Resist Technology GmbH) developer for 20 s, rinsed in isopropyl alcohol and dried. Samples were then treated with oxygen plasma (Diener Femto plasma cleaner, power 50 W, base pressure 0.3 torr) for 30 s to render SU-8 hydrophilic and to give it similar surface chemistry as glass by oxidising surface epoxy-groups to hydroxyl.
Fabricated structures were imaged using Scanning electron microscopy (SEM) and samples sputter coated with 5 nm Platinum/Palladium alloy deposited with a 208 HR B sputter coater (Cressington Scientific Instruments UK). SEM was performed with a FEI Apreo SEM, at 5 kV and 0.2 nA with sample 45° pre-titled stage and with additional tilting of 30°.

A Side view schematic representation of nano-structured surface mounted in petri dish. Glass slides are mounted using paraffin such that structures are pointing upwards. B Tilted schematic representation of nano-pillar array on flat surface, and two important parameters for the nano-pillar arrays (height and pitch). These figures are not drawn to scale. C , D Overview of the nanopillar arrays employed in this work. Top-down and tilted side-view scanning electron micrographs of fabricated nano-pillar array with pillars of height 1000 nm and pitch 1000 nm. Scalebars 2000 nm
When exposing the pillars, an indexing system was also exposed to make navigation during live-cell imaging more reliable. Arrays were optically inspected after fabrication to ensure free and standing pillars. The short Oxygen plasma treatment to render the SU-8 structures did not lead to any optically visible change to the structures. Lastly, the samples were mounted underneath 35 mm diameter dishes (Cellvis, Mountain View, CA, USA) with 14 mm holes and nano-structures pointing upwards, as indicated schematically in Fig. 7. As flat surfaces, areas outside the structured part of the same samples were used. Before usage, all dishes were disinfected with 70% ethanol twice and dried.
Cell Culture and Transfection
U2OS-cells (ATCC) were cultivated in Dulbecco’s modified Eagle’s Medium (DMEM Prod. 41965039, Fischer Scientific) with 10% fetal bovine serum (FBS) and kept at 5% CO2 and 37 °C. Before detachment, cells were washed with PBS and detached with Trypsin-ethylenediaminetetraacetic acid (trypsin-EDTA) and seeded on nanostrucutred or flat surfaces. For the diameter 14 mm glass wells 15,000 cells were seeded.
For the standard transfection experiments, cells were allowed 6 h for adhering to surfaces before transfection. U2OS cells were transiently transfected using Lipofectamine 2000 (Invitrogen, Fischer Scientific) by adapting the manufacturer protocol to our system. Briefly, 2 μL Lipofectamine 2000 was added to 50 μL Opti-MEM I Reduced Serum Media (Prod. 11058021, Gibco , Fischer Scientific) and incubated for 5 min at room temperature. Plasmid DNA coding for fluorescent LifeAct-TagGFP2 and TagRFP-vinculin fusion proteins were co-transfected by using 0.5 μg plasmid DNA (vinculin-pTagRFP and pCMVLifeAct plasmids) was diluted in 50 μL Opti-MEM I and incubated at room temperature for 5 min. For co-transfection of TagRFP-vinculin and pCMVLifeAct 0.5 μg of each plasmid was used.
The diluted DNA was added to the diluted Lipofectamine 2000 in a 1:1 ratio, and left to incubate for 20 min at room temperature. 40 μL of the combined transfection complex was then added to each well. After 18 h, 1.5 mL DMEM (Prod. 41965039) supplemented with 10% FBS and 1% 10000U/mL Penicillin-Streptomycin was added to each dish.
For reverse transfection experiments, the same amounts of reactants were used, but the transfection complex was added to a suspension of U2OS cells, and the suspension was then added to the wells.
Microscopy
Live cell imaging was performed usin g a Zeiss LSM 800 Airyscan with an inverted Axio Observer Z1 stand connect to a PeCon compact incubator. Imaging was performed in an humidified environment at 37 °C, with 5% CO2 flow. High resolution imaging was performed using a Zeiss Plan-Apochromat 63x/1.4NA DIC M27 oil objective with Cargille Immersion Oil Type 37 (n =1.51) suited for use at 37 °C. All images were taken using the system optimised pixel size both in-plane (typically 34 nm) and for stacks in the vertical axis (typically 180 nm).
To minimise imaging bias, imaging was performed in a standardised manner where each pillar array was raster scanned and cells expressing both LifeActGFP and Vinculin RFP were imaged. The high resolution images were then processed using a Zeiss algorithm for reconstruction of AiryScan images and exported as CZI-files for further manual and automatised image processing.
Image Analysis
For all cells, cell shape was based on the expression LifeActGFP fusion protein and expression of TagRFP-vinculin was used to identify FAs. Segmentation of images was performed using a script written in Python 3 [72] using CZIfile [73] (version 2017.09.12) for reading the microscopy images in Zeiss-format. The python packages Scipy [74] and Scikit-image [75] were used for multi-dimensional image processing and image segmentation respectively.
To reduce the influence from fluorescence cross-talk from pillars (due to Oxazine 170 perchlorate, Rhodamine 800 or Coumarin 102), the pillar/surface channel was used as a background and subtracted from the TagRFP-vinculin imaging channel. A median filter (size:10 pixels) was applied to remove noise from the TagRFP-vinculin channel, followed by classification of the image into regions based on their intensity value using a Multi-Otsu approach. Multi-Otsu thresholding with three classes was applied. The first class was typically the background, the second class constituted the cytosolic vinculin, whereas vinculin rich areas in FAs appeared brighter and could be classified into a third class. The quality of the image segmentation was briefly assessed by comparison to manual segmentation.
Area of cells and vinculin rich regions were described by counting pixel numbers and from this the actual area was found by correcting for the pixel size. Shape geometries were described by fitting each region with an ellipse with the same second-moment as the segmented region. In order to describe the cell area geometry, three measures were used:(1) Aspect ratio defined as the ratio of the ellipse major axis to the minor axis. (2) Circularity given as,
$$\begin{aligned} C =\frac{4\pi *\text{Area}}{\text{Perimeter}^2}, \end{aligned}$$ (1)and roundness given as,
$$\begin{aligned} R =\frac{4*\text{Area}}{\pi *\text{MajorAxis}^2}. \end{aligned}$$ (2)Segmented vinculin areas with a fitted ellipse that were too round (aspect ratio \(\le 1.5\)) or too elongated (aspect ratio \(\ge 8.5\)) were rejected. In addition, vinculin areas smaller than 0.05 μm 2 were filtered out. In order to find the distance between each vinculin area and the cell edge, the shortest euclidean distance between each centroid (the centre of the fitted ellipse for each vinculin area) and the cell edge was calculated.
Statistical Analysis
Statistical comparisons of distributions were performed by using the non-parametric two-tailed Mann-Whitney test neither assuming normal distribution nor equal standard deviation. P -values \(\ge {0.05}\) were considered to represent a non-significant (ns) difference between the two populations. Significant values were denoted with * for p in 0.01 to 0.05, ** for p in 0.001 to 0.01, *** for p in 0.0001 to 0.001 and lastly **** for p \(\le {0.0001}\).
缩写
- DMEM:
-
Dulbecco’s Modified Eagle’s Medium
- EBL:
-
Electron Beam Lithography
- ECM:
-
Extracellular Matrix
- EDTA:
-
Ethylenediaminetetraacetic Acid
- FA:
-
Focal Adhesion
- FBS:
-
Fetal Bovine Serum
- GFP:
-
Green Fluorescent Protein
- HMDS:
-
Hexamethyldisilazane
- NP:
-
Nanopillar
- RFP:
-
Red Fluorescent Protein
- SEM:
-
Scanning Electron Microscopy
纳米材料