

囊泡和细胞的调频波介电泳:以交叉频率周期性 U 形转弯
摘要
我们已经制定了在应用调频 (FM) 电场时施加在微/纳米颗粒上的介电泳力。通过调整FM波的频率范围以覆盖交叉频率f X 在 Clausius-Mossotti 因子的实部中,我们的理论预测了每次瞬时频率周期性地穿过 f 时介电泳力的逆转 X .事实上,我们观察到经历 FM 波介电泳 (FM-DEP) 的囊泡、白血病细胞和红细胞的周期性 U 形转弯。我们的理论还表明,由于 FM-DEP 的 U 形转弯的视频跟踪可用于 f 的敏捷和准确测量 X . FM-DEP 方法持续时间短,小于 30 s,同时应用 FM 波观察几个 U 形转弯,并且测量 f 的敏捷性 X 不仅对咸性细胞悬液而且对纳米颗粒都有很大用处,因为尽可能地抑制了电场诱导的溶剂流动。 f 的准确度 X 已经使用两种类型的实验进行了验证。首先,我们测量了在各种频率的正弦电场下施加在经历交流电介电泳 (AC-DEP) 的单个囊泡上的吸引力。介电泳力的频率依赖性产生 f X 作为力消失的特征频率。比较f的AC-DEP结果 X 与从 FM-DEP 方法获得的结果,f 的两个结果 X 发现彼此一致。其次,我们研究了 f 的电导依赖性 X 三种电池通过改变周围的电解质。根据实验结果,我们使用生物细胞单壳模型的详细理论同时评估了细胞质电导率和膜电容。虽然这些细胞的细胞质电导率略低于先前报道的范围,但获得的膜电容与先前文献报道的一致。
背景
电表型的极化率主要是由于细胞膜和取决于外加电场频率的细胞质电特性。因此,可以使用非侵入性电技术通过介电光谱的差异来识别单个细胞。电技术目前能够从未知样品中分离具有有用表型的细胞 [1-15]。与其他分离方法相比,这些方法的主要优点是不需要抗体对细胞进行修饰或粘附外来物质,从而避免了这些探针对细胞造成损伤或激活的可能性[1-16]。细胞介电特性的表征主要使用阻抗谱 [10, 12, 13] 或交流 (AC) 电动学,如介电泳 (DEP)、行波 DEP (twDEP) 和电旋转 [1, 9, 15]。其中,我们重点扩展了 AC-DEP 方法,以开发一种使用调频 (FM) 波代替交流场进行介电表征的新方法。
通常,DEP 发生在电场梯度中,该梯度会在任何可极化物体(带电或中性)上产生电动力,其方向不仅由梯度矢量确定,还由 Clausius-Mossotti 的实部确定( CM) 因子 [1–15, 17–21]。例如,我们考虑由交流电场 E 引起的 DEP 力 AC(r ,t ) 其时空依赖性表示为 E AC(r ,t )=A (r ) cosθ AC(r ,t ) 使用幅度矢量 A (r ) 和相位 θ AC(r ,t )。 AC-DEP 力由振幅的空间梯度(即 ∇A ) 乘以 CM 因子的实部,如上所述,而相位的空间梯度(即 ∇θ AC) 乘以 CM 因子的虚部产生 twDEP 或电旋转的力,因此在介电特性方面为 AC-DEP 方法提供了补充信息 [9, 15, 20, 21]。
在这封信中,我们旨在制定由 FM 场引起的 DEP 力并比较 AC-DEP 和 FM-DEP 方法,以便 AC 和 FM 场均不考虑相位的空间依赖性;因此,我们将设置 θ AC(t )=2π f ACt 与应用频率成正比 f 交流电。 AC-DEP 的一个显着特征是力的方向及其强度取决于 f 交流电。最值得注意的是,力的方向在交叉频率 f 处反转 AC=f X 由于 CM 因子实部符号的变化,这已被发现可用于使用 AC-DEP 进行介电表征 [1-15]。
AC-DEP 力的频率依赖性也使以下操作成为可能 [1-15, 22-31]:胶体粒子的电可控捕获、聚焦和平移,以及活体和/或生物体的分离和表征。死细胞。用于介电泳组装和/或操作胶体粒子的传统系统通常使用微制造电极,在这些电极之间已将交流电场应用于胶体悬浮液,这得益于集成半导体器件制造的最新进展 [24-30] .这项提供非接触式操作的技术目前正在与各种芯片实验室系统集成,这些系统具有准确和可重复处理的优势。然而,与可以在光学操作中自由定位的激光焦点相比,在交流场中产生高强度点的片上电极无法独立于样品架改变其位置。由于片上系统的局限性,以前的 DEP 方法在执行适合光镊的操作类型时存在一些困难和复杂性。克服这些困难的一种候选方法是光学图像驱动的 DEP [32]。
在这里,我们采用了一种电子镊子技术 [22, 23, 33-38] 作为一种更简单的替代方法,用于在没有光学设备的情况下进行按需介电泳组装和/或操作(见图 1)。从图 1 中可以看出,我们的插入式系统使用一对由显微操纵器控制的微电极针,用于在胶体悬浮液中施加外部电场。由于其插入式,电极探针不是固定的,而是在胶体悬浮液中可移动。然而,对于介电特性的实际应用,仍然存在一个重要的要求:将电场施加到被含盐电解质包围的电池的持续时间应该最小化。例如,AC-DEP 方法涉及使用嵌入微流体系统中的交叉梳状电极,以便可以在细胞悬液中同时应用各种频率的交流场 [24-30]。虽然已经发现这种精细的片上系统与介电特性相关,但多电极对技术不适用于电子镊子技术中经常使用的单电极对系统 [22, 23, 33-38] .
<图片>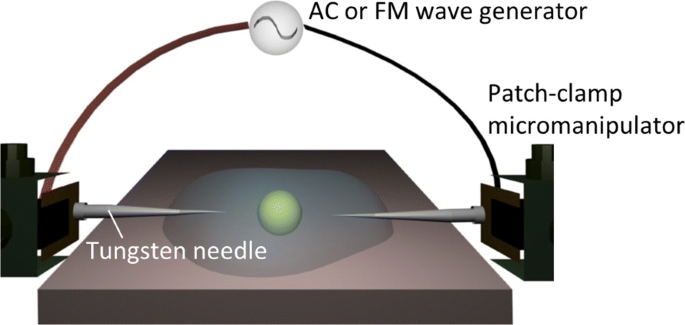
实验装置。介电泳操作系统示意图,说明通过膜片钳微操作器控制的一对电极针施加到目标粒子的 AC 或 FM 电场
为了使用单电极对系统(图 1)完成同步多频测量,应研究外加电场的变化。在这封信中,我们解决了由于以下形式的 FM 波 (FM-DEP) 而导致的时变 DEP 的可用性:
$$ \boldsymbol{E}(\boldsymbol{r},t) =\boldsymbol{A}(\boldsymbol{r})\cos\theta(t), $$ (1)其中相位 θ (t ) 的 FM 波与瞬时频率 f 有关 (t ) 作为 2π f (t )=d θ (t )/d t 和
$$ f(t)=f_{c}+\Delta f\cos\left(2\pi f_{m}t \right), $$ (2)与 f 米 表示调制频率。我们使用满足Δ的宽带FM f /f 米 ≫1,使得f的条件 米 /f (t ), f 米 /f c , f 米 /Δ f 在下面给出的理论公式中,≪1 将被称为宽带极限(WBL)。
在这封信中,特别注意了f的特征频率之间的关系 X 和 FM-DEP 的轨迹。在下一节中,我们将描述用于诱导 FM-DEP 的插件系统的使用材料和详细信息。第三部分提供了由四个部分组成的结果和讨论。首先,我们通过量化往复轨迹来研究单个白血病细胞重复 U 形转弯的细节,其周期性由调制频率 f 解释 米 , 或者 f 的周期性振荡 (t ) 由方程给出。 (2).接下来,我们通过推导根据瞬时频率f调制的时变介电泳力,从理论上解释往复轨迹 (t ) 满足 WBL 条件的 FM 场。所获得的介电泳力形式提供了确定 f 的方程 X 从观察到的 U 形转弯。第三,我们测量了由于 AC-DEP 的吸引力而附着在电极针上的多层囊泡 (MLV) 上的介电泳力的大小。使用从 CM 因子的实部确定的谱方程拟合力的频率依赖性,使得 f X 被确定为由 AC-DEP 引起的吸引力消失的特征频率。因为FM-DEP方法也给f X 通过分析 MLV 的往复轨迹,我们评估了从 AC-DEP 和 FM-DEP 评估的交叉频率之间的重合程度。最后,从f评价了三种细胞的细胞质电导率和膜电容。 X 作为溶液电导率的增函数,所得值与文献报道的值进行比较。
方法
材料
为了制备多层囊泡 (MLV),我们使用 1,2-dioleoyl-sn-glycero-3-phosphatidylcholine (DOPC) 作为脂质,从 Avanti Polar Lipids 购买。 MLV通过以下程序获得。 DOPC (1 mL, 20 mM) 溶解在氯仿/甲醇 (2:1 v /v ) 用 N2 气干燥,并在真空下完全去除溶剂 12 小时以上。由于蒸发而沉积在玻璃小瓶上的薄膜使用去离子水再水化,并在 25 °C 下孵育数小时。
实验中使用的两种细胞系是人 T 细胞白血病 (TL) 系的 JKT-beta-del 和人 B 细胞白血病 (BL) 系的 CCRF-SB。两种TL和BL细胞均在含5%的加湿培养箱中孵育1周后使用 CO2 在 37,使我们的细胞浓度在 0.5×10 6 范围内 到 1×10 6 细胞/毫升。用于细胞培养的 RPMI 1640 培养基补充有 10% 胎牛血清和 100 mM 丙酮酸钠。细胞以 370g 离心沉淀 3 分钟两次,以便在移液前将细胞完全重悬在 1 ml RPMI 1640 培养基中。将得到的细胞悬液用等渗的200mM蔗糖溶液进一步稀释,以制备具有所需电导率的溶剂。
我们还使用了分散在以下悬浮液中的人红血 (RB) 细胞。新鲜抽取的全血样本来自二十出头的健康志愿者。将悬浮在RPMI 1640培养基和3.1%血细胞比容的混合物中的细胞用等渗200mM蔗糖溶液稀释,以制备具有所需电导率的溶剂以及上述白血病细胞。所有使用人RB细胞的介电泳实验均在抽取全血样本后10分钟内完成。
实验设置
使用电导仪(SevenMulti, Mettler-Toledo, Columbus, OH, USA)测量细胞悬浮液的电导率。使用的插入式系统的示意图如图 1 所示。通过任意波形发生器(Agilent 33220A,Agilent Technologies,Santa Clara,CA,USA)施加具有 AC 或 FM 波的外部电场,并带有电流连接插入式微电极的放大器(F30PV,FLC Electronics,Partille,Sweden)。微电极包括尖端直径为 0.5 μ 的钨针 m 由两组膜片钳显微操作器(NMN-21,Narishige,世田谷区,东京,日本)独立控制。在接下来的所有实验中,我们将针尖间距保持在 100 μ m 当对上述悬浮液施加外场时,最大幅度设置为 0.5 kV/cm。将针对插入安装在倒置光学显微镜(TE2000-U,Nikon,Minato-ku,Tokyo,Japan)上的样品滴中,使用 CCD 相机(Retiga Exi,QImaging,Surrey,英国)获得光学显微照片哥伦比亚,加拿大),帧速率为 25 fps;顺便说一下,已确认由于帧速率导致的 FM 波的频率分辨率始终在每个数据的误差条内。 A 50- μ 将l滴悬浮液置于倒置光学显微镜的样品台上,使用热控制器将样品台温度保持在25℃。
插件技术允许简单的系统对单个细胞执行各种非接触式操作,例如将其推入狭窄的通道而不进行任何接触并将其定向到所需的方向。尽管通常需要在等渗溶液中用盐处理细胞,但最容易对被去离子水包围的细胞进行上述 DEP 操作。在附加文件 1:电影 S1 到 S3 中,插件系统诱导了悬浮在去离子水中的硅藻细胞的 AC-DEP。我们可以从附加文件 1:电影 S1 到 S3 中看到,分散在无盐水中的各向异性硅藻细胞像便利贴一样被一对微电极操纵,其间施加了交流电场 (1 kV/cm) .非接触式操作包括三个步骤:(i)首先通过以 30 kHz 的频率偶极对齐和每个微电极的位置变化(附加文件 1:电影 S1 ),(ii) 我们随后将频率更改为 100 kHz,以将其推向墙壁,以静电方式将带负电荷的请求单元固定在玻璃表面上(附加文件 1:电影 S2),以及 (iii) 交流频率已调整到 20 MHz 以在相反方向诱导 AC-DEP,以便可以拉出静电附着的细胞(附加文件 1:电影 S3)。
结果与讨论
白血病细胞经历 FM-DEP 的实验观察
我们的插入式微电极(见图 1)允许将电场施加到漂浮在样品基底上方的颗粒上,这对于选择合适的细胞具有实际用途。例如,附加文件 1:电影 S4 显示微电极对被控制以接近浮动三角形硅藻细胞,我们对其施加了交流电场,其频率在 100 到 500 kHz 之间以 0.5 秒的间隔跳跃。在附加文件 1:电影 S4 中,我们看到三角形细胞由于频率跳跃而在微电极上弹跳,这是在使用 FM-DEP 进行以下操作之前的初步结果。
附加文件 1:电影 S5 和 S6 显示了几个经历 FM-DEP 的 TL 细胞的典型行为,这类似于使用单电极 AC-DEP 的电子镊子操纵的哺乳动物细胞的行为 [36]。图 2 使用 (x ,y ) 沿着 t 轴,其中 (x 的相对坐标 ,y ) 分配给临时细胞位置,原点 (0, 0) 位于微电极针上的特定点,用于提取细胞 - 电极配置。而 x 轴表示 (0, 0) 处电极表面的切线,y 垂直于切线的轴主要反映了下面解释的周期性 U 形转弯的投影。在图 2 中,我们选择了一个浮动 TL 单元,我们对其施加了调制频率 f 的 FM 电场 米 设置为 f 米 =0.25 Hz 在 200 kHz ≤f 范围内 (t )≤ 3 MHz。因为我们有 Δ f /f 米 , f (t )/f 米 <10 −5 ,WBL 条件实际上成立,如等式之后提到的。 (2).
<图片>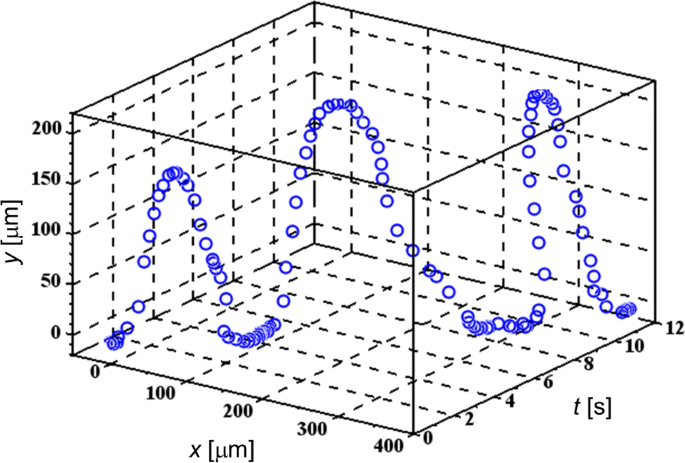
目标 TL 细胞的 3D 轨迹。对于经历 FM-DEP 的 TL 单元,证明了由于频率调制导致的周期性 U 形转弯
从附加文件1:电影S5和S6以及图2中发现,周期轨迹由离开、接近和停留在微电极上的三个部分构成:(i)细胞离开微电极,(ii)它在 U 形转弯后接近微电极,并且 (iii) 它停留在微电极表面。由于溶剂流动,细胞通常无法返回到微电极表面上的相同位置,这不仅在附加文件 1:电影 S6 中观察到,而且还由 U 形转弯表示,细胞在 <我> x 图 2 中的方向。尽管有溶剂流动的干扰,但可以区分细胞开始离开微电极表面的时刻,并分别在周期性轨迹中进行 U 形转弯。因此,我们可以从图 2 中看到,这些 U 形转弯以 4 秒的间隔重复,与 0.25 Hz 的调制频率或瞬时频率 f 的 4 秒周期一致 (t ).
FM-DEP的理论研究
为了解释实验轨迹,包括周期性 U 形转弯,我们将球形物体视为单个细胞的简化模型,其中任意时变电场 E (r ,t ) 被申请;被应用。图 3 显示了作用在球形物体上的随时间变化的 DEP 力的示意图 [9]。如图3所示,球形物体内部的介电常数和电导率用ε表示 在和σ 分别是in和下标“out”,例如ε 输出和σ out,表示外面。一般来说,F DEP(r ,t ) 与感应偶极矩 p 有关 (r ,t ) 如 [17–19]
$$\begin{array}{@{}rcl@{}} \boldsymbol{F}_{\text{DEP}}(\boldsymbol{r},t)&=&\left\{\boldsymbol{p} (\boldsymbol{r},t)\cdot \nabla\right\}\boldsymbol{E}(\boldsymbol{r},t), \end{array} $$ (3)
理论模型。 FM-DEP 力施加在单元上的示意图,该单元被建模为具有 ε 的介电常数和电导率的均质球模型 在和σ 在,分别。球体被电解质介质包围,其介电常数和电导率为 ε 输出和σ 分别出。均质球模型是球状单壳模型的简化,将细胞视为被膜包围的涂抹的细胞质[9]
$$\begin{array}{@{}rcl@{}} \boldsymbol{p}(\boldsymbol{r},t)&=&4\pi R^{3}\epsilon_{\text{out}}K_ {H}\left\{\boldsymbol{E}(\boldsymbol{r},t)+\frac{\tau}{\Delta\tau} \widetilde{\boldsymbol{E}}(\boldsymbol{r}, t)\right\}, \end{array} $$ (4) $$\begin{array}{@{}rcl@{}} \widetilde{\boldsymbol{E}}(\boldsymbol{r},t )&=&\frac{1}{\tau}\int_{0}^{tds}\,\boldsymbol{E}(\boldsymbol{r},ts)e^{-s/\tau}, \end {数组} $$ (5)其中 K H 和Δ τ 定义如下:K H =(ε in−ε 出)/(ε in+2ε out) 和 \(\Delta \tau ^{-1}=\tau _{0}^{-1}-\tau ^{-1}\) 使用半径 R 球体和τ的两个特征时间 0=(ε in−ε 出)/(σ in−σ out) 和 τ =(ε in+2ε 出)/(σ in+2σ 出)。
代替交流电场E AC(r ,t )=A (r ) cos(2π f ACt ) 进入方程。 (3)到(5),我们得到平均DEP力<F DEP(r ,t )> 已在 AC 场 [9, 15, 20] 的循环中求平均值:
$$\begin{array}{@{}rcl@{}} \left<\boldsymbol{F}_{\text{DEP}}\right>&=&4\pi R^{3}\epsilon_{\text {out}}K_{H}\left[ \left<\boldsymbol{E}\cdot \nabla\boldsymbol{E}\right>+\frac{\tau}{\Delta\tau}\left<\widetilde{ \boldsymbol{E}}\cdot \nabla\boldsymbol{E}\right>\right]\\ &=&\chi(f_{\text{AC}})\nabla\boldsymbol{A}^{2}_ {\text{RMS}}, \end{array} $$ (6)其中 A RMS 表示均方根 (RMS) 向量满足 \(\boldsymbol {A}_{\text {RMS}}^{2}=\boldsymbol {A}^{2}/2\) 和 χ (f AC)≡2π R 3 ε outRe[K (f AC)] 取决于施加的频率 f 由于 Re[K (f AC)],CM因子的实部[9,15,20]:
$$\begin{array}{@{}rcl@{}} \chi(f_{\text{AC}})=\frac{2\pi R^{3}\epsilon_{\text{out}}} {1+(2\pi f_{\text{AC}}\tau)^{2}} \left\{ K_{L}+(2\pi f_{\text{AC}}\tau)^{2 }K_{H} \right\}, \end{array} $$ (7)其中 K L =(σ in−σ 出)/(σ in+2σ out) 和 K H ,如上定义,分别对应于低频和高频极限中的真实 CM 值,这些极限值 K L 和 K H , 需要有相反的符号,以便 f X 由 χ 定义 (f X )=0 可能存在 [9, 15, 20]。
方程 (6) 和 (7) 表明交流电场产生 DEP 力,其方向取决于施加的频率 f AC 到 χ (f AC) 由方程给出。 (7),它解释了附加文件 1:电影 S4 中的弹跳硅藻细胞,如下所示(另请参见图 3)。当应用频率提供 CM 因子实部的加号(即 χ (f AC)>0),我们可以观察到细胞被吸引到电极针尖端(正 DEP),通过一对电极针施加的 AC 场强度最大。实际 CM 因子的符号可以在 f 处反转为负 X ,真实 CM 因子的消失频率(即 χ (f X )=0),其中我们有从方程发现的零介电泳力。 (6).在 CM 因子的负号(即 χ (f AC)<0),单个胶体被电极针对(负 DEP)排斥。附加文件 1:电影 S2 中的三角形硅藻细胞反弹是因为 AC 场诱导的 AC-DEP 方向相反,其频率为 100 和 500 kHz;结合方程。 (6) 和观察到的介电泳方向,我们发现χ (100 kHz)>0 和 χ (500 kHz)<0.
接下来,我们通过插入方程给出的相位来考虑 FM-DEP。 (1) 和 (2) 转化为方程。 (3) 至 (5)。正如附加文件 2 中所证明的那样,FM 波的 WBL 条件验证了方程 1 中积分的近似形式。 (5),从而提供
$$ \left<\widetilde{\boldsymbol{E}}\cdot \nabla\boldsymbol{E}\right>=\frac{1}{1+\{2\pi f(t)\tau\}^{ 2}}\left(\frac{\nabla\boldsymbol{A}^{2}_{\text{RMS}}}{2} \right), $$ (8)当时间相关频率 f (t ) 替换为 f 的恒定频率 交流电。因此我们得到了平均 DEP 力的极限形式 <F DEP(r ,t )> 已在 θ 的循环上取平均值 (t ) 在 FM 字段中(参见附加文件 2 中的方程(A1)、(A13)和(A14)):
$$\begin{array}{@{}rcl@{}} \left<\boldsymbol{F}_{\text{DEP}}(\boldsymbol{r},t)\right>=\chi\{f (t)\}\nabla\boldsymbol{A}^{2}_{\text{RMS}}, \end{array} $$ (9)与 Eq 的形式相似。 (6) 对于AC-DEP。区别在于χ的系数是否 {f (t )} 取决于 t 通过 f (t ),它根据频率调制以 T 为周期循环变化 米 =1/f 米 .
基于 FM-DEP 的简单表达式(9),我们用图 4 说明了由于 FM 波引起的上述 U 形转弯的机制。图 4 为当范围 f 时 WBL 中 FM 波引起的 DEP 示意图 (t ) 覆盖交叉频率 f X 使得 f c -Δ f ≤f X ≤f c +Δ f .假设在图 4 中,CM 因子实部的频率依赖性,或 χ {f (t )},提供如下替代符号变化:减号 (χ {f (t )}<0) 对于 f (t )<f X 和加号 (χ {f (t )}>0) 对于 f (t )>f X ,这就是我们的实验。前一个时期满足f (t )<f X 有持续时间,而后者 f (t )>f X 其余时间保留:一个周期分为两个周期,分别用红色和蓝色标记,见图4。
<图片>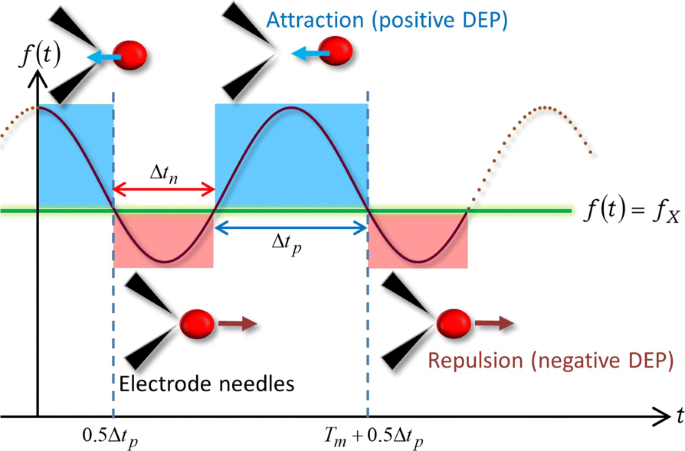
与频率调制相关的力方向。由于 FM 波的时间相关频率为 f 导致的周期性 U 形转弯图示 (t ) 覆盖交叉频率 f X
类似于 AC-DEP,方程。 (9) 意味着减号 (χ {f (t )}<0) 在细胞和微电极之间产生排斥 DEP 力,同时满足 f (t )<f X .结果,细胞离开微电极针尖周围的区域,在该区域之间电场的幅度最大:细胞在 Δ 的红色期间经历负 DEP t n 在图 4. 在时刻 t X 作为 f 的解决方案 (t X )=f X , χ (f ) 消失,然后符号变为 χ (f )>0 而 f (t )>f X ,相应地,DEP 力在 t 处切换为吸引力 X .在 t 掉头后 X 由于 DEP 力的方向逆转,目标细胞开始接近以相反方向迁移的微电极,最终被困在电极针的尖端之间或附着在电极之一上:细胞在过程中经历正 DEP Δ的蓝色周期 t p 图4. 图4表示微电极上的离开、接近和停留的循环应以T的调制周期重复进行 米 ,与图2一致:Δ t n +Δ t p =T 米 .因此,图 4 中描绘的介电泳机制可以解释在附加文件 1:电影 S5 和 S6 以及图 2 中观察到的周期性 U 形转弯。
让我们考虑方程的周期解,f (t X )=f X .从图 4 可以看出,t X 表示为 t X =n T 米 +0.5Δ t p =n T 米 +0.5(T 米 -Δ t n ) 使用 n 的整数 =0, ±1, ±2,⋯,进一步读作
$$ 2\pi f_{m} t_{X}=(2n+1)\pi-\pi f_{m}\Delta t_{n}。 $$ (10)代入方程。 (10) 转化为方程。 (2), 我们有 n =0
$$ f_{X}=f_{c}-\Delta f\cos\left(\pi f_{m}\Delta t_{n}\right), $$ (11)澄清如果持续时间 Δ FM-DEP 方法确定交叉频率 t n 从离开微电极到掉头都可以精确测量。
比较由 FM-DEP 和 AC-DEP 确定的单个 MLV 的交叉频率
我们研究了方程的实验准确性。 (11)。实验上,通常需要将生物细胞分散在电解质中。但是,对于 MLV,在再水化和稀释的制备过程中允许使用去离子水。因此,我们使用无盐 MLV 悬浮液来比较从 AC-DEP 和 FM-DEP 确定的交叉频率。
调频波在 10 kHz ≤f 范围内诱导靶向 MLV 的介电泳 U 形转弯 (t )≤ 50 kHz (即 f c =30 kHz 和 Δ f =20 kHz) 设置为 f 米 =0.1 Hz,相应地 FM-DEP 具有 10 秒的周期。在实验中,观察目标 MLV 从离开到接近微电极的几个 U 形转弯需要不到 30 s。从轨迹上,我们得到了\(\overline {\Delta t_{n}}=5.8\pm 0.2\) s 的平均离开时间。因为 WBL 条件适用于本实验满足 f 米 /Δ f /f 米 , f ,米 /f (t )<10 −5 ,交叉频率被评估为 f X =35±1 kHz 将 \(\overline {\Delta t_{n}}=5.8\pm 0.2\) s 代入方程。 (11).
For comparison, we made use of the programmable manipulator in the AC-DEP method that tries to evaluate the crossover frequency of the same targeted MLV to which the sinusoidal electric field with a frequency in the range of 30 to 100 kHz was applied via the electrode needle pair for inducing the AC-DEP. Because the programmable manipulator carries the electrode needle pair at a constant speed in one direction, we can measure the dielectrophoretic force similarly to the laser-trapping experiments [39]. Attaching the MLV on an electrode tip that undergoes uniform linear motion, not only the AC-DEP force but also the hydrodynamic force caused by the one-dimensional motion are exerted on the MLV. With the gradual increase of electrode velocity, F DEP eventually becomes smaller than the hydrodynamic force. As a result, the MLV initially attached to the moving electrode, owing to the DEP attraction, is desorbed by the hydrodynamic force. Defining the critical value, v c , by the maximum velocity value of the microelectrode pair prior to the desorption, the force balance equation between the DEP and hydrodynamic forces reads [39]
$$ F_{\text{DEP}}(f_{\text{AC}})=6\pi\eta R v_{c}, $$ (12)where F DEP(f AC)e ≡<F DEP> with the unit vector e defined by \(\boldsymbol {e}=\nabla {\boldsymbol {A}}^{2}_{\text {RMS}}/|\nabla {\boldsymbol {A}}^{2}_{\text {RMS}}|\), η the water viscosity at 25 °C and 2R the diameter of the MLV.
Additional file 1:Movies S7 and S8 demonstrates the force measurement using the above AC-DEP method at the applied frequency of f AC=60 kHz. In Additional file 1:Movie S7, the velocity of the electrode pair controlled by the programmed manipulator is 110 μ m/s, which is lower than v c; therefore, the MLV remains attached to one part of the electrode pair owing to the dielectrophoretic attraction. Additional file 1:Movie S8, on the other hand, shows the higher electrode speed of 120 μ m/s, under which the dielectrophoretic force becomes smaller than the hydrodynamic force that is exerted on the MLV, thereby desorbing the MLV from the electrode. Accordingly, v c is evaluated to be 110 μ m/s ≤v c ≤ 120 μ m/s, and we can calculate F DEP(60 kHz) using Eq. (12).
We can determine f X from the experimental results of F DEP at various external frequencies. Figure 5 shows the frequency dependence of F DEP, indicating that the DEP force experienced by the MLVs was reduced by lowering the applied frequency. It is found from Eqs. (6) and (7) that the fitting function of F DEP(f AC) can be expressed as
$$ F_{\text{DEP}}(f_{\text{AC}})=\frac{L+(2\pi f_{\text{AC}}\tau)^{2}H}{1+(2\pi f_{\text{AC}}\tau)^{2}}, $$ (13)
Frequency dependence of F 发展部The FM-DEP force (F DEP) as a function of external frequency (f AC) of applied AC field where F DEP has been evaluated from Eq. (12), the balance equation between the FM-DEP and hydrodynamic forces exerted on a single MLV. It can be seen that F DEP is increased and saturated as f AC is higher, reflecting a typical behavior of the relaxation spectrum of the real CM factor. The solid line represents the best-fit result of Eq. (13)
implying that
$$ f_{X}=\frac{1}{2\pi\tau}\sqrt{-\frac{L}{H}}. $$ (14)Equation (13) is depicted by the solid line in Fig. 5 that has been fitted to the experimental data using the best-fit results of three parameters:L =−21.02 pN, H =19.03 pN, and τ =4.9 μ s。 Substituting these results into Eq. (14), we evaluate that f X =34.15 kHz, which coincides with the result of f X =35±1 kHz evaluated from the FM-DEP method. The FM-DEP method is thus validated in terms of the consistency with the direct force measurement using the AC-DEP method.
Conductivity Dependencies of the Crossover Frequencies for Biological Cells
Let us return to the dielectrophoretic U-turns of biological cells mentioned in Fig. 2 to assess the practical reliability of the crossover frequencies when the FM-DEP method is applied to cell suspensions. Recently, an elaborate theory [40] has investigated, in more detail than before, the relationship between the homogeneous sphere model (see Fig. 3) and the single-shell model where the inner structure of cell is represented by a smeared-out cytoplasm surrounded by a membrane. As a result, the relation between f X and the suspension conductivity σ out has been formulated using radius R of a cell, membrane capacitance C 米 , and cytoplasmic conductivity σ cyt [40]:
$$ f_{X}=\frac{1}{\sqrt{2}\pi {RC}_{m}}\left(\sigma_{\text{out}}-\frac{1}{2\sigma_{\text{cyt}}} \sigma_{\text{out}}^{2} \right)+f_{X0}, $$ (15)其中 f X 0 is the extrapolated value to the crossover frequency at σ =0 mS/m and will be treated as a fitting parameter herein. The elaborate treatment adds the squared term, the second term on the right hand side of Eq. (15), to the conventional linear relation which has mainly been used for evaluating C 米 from f X [40–45]. Theoretically, it has still been claimed [40] that Eq. (15) is valid within a lower range of σ out such that σ out<10 mS/m; however, it should be better to include the squared term in the evaluation of C 米 , considering that our range of σ out is relatively high compared with previous results in the range of 10 mS/m ≤σ out≤ 100 mS/m [40–45]. Hence, we determined σ cyt as well as C 米 from fitting Eq. (15) to the experimental results of f X as an increasing function of σ out.
There are three kinds of biological cell used:TL and BL cells of human leukemia and RB cells of three human volunteers. In all the experiments using any species of cell, the conductivities were within the range of 60 to 160 mS/m, and the modulation frequency was set to be 0.25 Hz. Regarding the instantaneous frequency, most of the experiments adopted the range from 100 to 1.5 MHz (i.e., f c =800 kHz and Δ f =700 kHz); exceptionally for leukemia cells, the frequency range was extended to 50 kHz ≤f (t )≤1550 kHz (i.e., f c =800 kHz and Δ f X =750 kHz) in the conductivity range of 60 mS/m≤σ ≤80 mS/cm because f X in this σ -range has been found to be lower than 100 kHz, and we were unable to observe the DEP U-turns in the range of 100 kHz ≤f (t )≤1500 kHz. Both of these frequency sets satisfy the WBL condition of Δ f /f 米 , f (t )/f 米 <10 −5 as before.
Each time we measured the leaving times of cells dispersed in a suspension, we looked for an appropriate spot at which a few cells having a similar size could simultaneously experience the FM-DEP above the substrate, and the microelectrode tips were placed at the measurable position using the micromanipulator. We continued such scanning inside the cell suspensions until the FM-DEP trajectories of 10 cells were collected in total at a couple of appropriate positions. For each kind of cell, the measurement of 10 cells was repeated twice using different drops of the same cell suspension. As mentioned, it is indispensable for the implementation of the FM-DEP measurement at each spot to suppress the electrically induced solvent flows as much as possible. Hence, we traced only two cycles of the U-turn path so that the duration time of applying the electric field could be adjusted to be less than 10 s, and, correspondingly, the leaving time of each cell is given as the average of each trajectory, including the two U-turns. The mean leaving time \(\overline {\Delta t_{n}}\) of each cell suspension is thus obtained from averaging the leaving times of 20 cells. Particularly for human RB cells, we further averaged three sets of the mean crossover frequencies obtained for three RB cell suspensions of three human beings, supposing that cells of the same species are similar in C 米 和 σ cyt as well as in R . The two-step averaging of Δ t n will be denoted by \(\left <\overline {\Delta t_{n}}\right>\). Substituting into Eq. (10) the experimental data of either \(\overline {\Delta t_{n}}\) or \(\left <\overline {\Delta t_{n}}\right>\), the mean crossover frequency <f X> was obtained.
Figure 6 shows the σ out-dependencies of <f X> measured for the above three kinds of biological cells using the FM-DEP method. The solid lines in Fig. 6 depict the best-fit results of Eq. (15). We evaluated C 米 和 σ cyt from the best fitting of Eq. (15) into which the observed radii (R obs) were inserted. Table 1 lists the fitting results of C 米 和 σ cyt, where we used the observed radii of 10 μ 米 ≤ 2R obs≤ 15 μ m for TL and BL cells, and 7.5 μ 米 ≤ 2R obs≤ 10 μ m for RB cells in evaluating C 米 . It is to be noted from Table 1 that different species have different membrane capacitances, which are in good agreement with those reported in the literature [40–47]; the C 米 values of RB cells with stationary whole blood samples from normal (healthy) donors are in excellent agreement with our value [46, 47], but are substantially higher than those of washed RB cells in isotonic buffered saline as noted in [47]. The best-fit results simultaneously provided cytoplasmic conductivities, which were consistently similar as seen from Table 1, but were slightly lower than the range of previous reports that 0.2 S/m ≤σ cyt≤1 S/m [40, 45, 48–51]. These results support that the FM-DEP method retains the practical reliability needed for the treatment of living cells.

Conductivity dependences of crossover frequencies. Mean crossover frequency, <f X>, of TL cells (blue triangles), BL cells (green diamonds), and RB cells (red circles) varying with increase of solution conductivity σ 出去。 The best-fit results of Eq. (15) are delineated by the solid lines
结论
Our theoretical treatment of the FM-DEP has mainly focused on the WBL condition. In this limit, we have proved theoretically that the direction of the FM-DEP force switches each time when the instantaneous frequency of the FM wave traverses the crossover frequency, thereby implying the periodic U-turns of micro/nanoparticles that undergo the FM-DEP. Two kinds of experiment have demonstrated the accuracy and reliability of f X obtained from the observed trajectories of MLVs and cells using our formulation of the FM-DEP (Eqs. (9) and (11)):While the f X evaluated from the FM-DEP of a single MLV coincides with that obtained from the force measurement of the same MLV experiencing AC-DEP, the conductivity dependencies of f X provide the membrane capacitances of various cells that are in close agreement with the literature values. In other words, it has been validated theoretically and experimentally that the FM-DEP in the WBL limit can be mimicked by the time-varying AC-DEP induced by the AC wave with its frequency changing continuously according to the periodic function of f (t )。 The simple view applies to other electrokinetics, including the twDEP and the electrorotation by applying the FM wave that has the spatial dependence of the phase as well as the magnitude. The AC- and FM-DEPs are associated with the real part of the dielectric spectra (or the CM factor), whereas the electrokinetics due to the spatial gradient of the phase reflect the imaginary part of the CM factor as mentioned before. Therefore, the application of the FM wave to either twDEP or electrorotation will be required for completing the dielectric characterization (the dielectric spectroscopy, in general) using the electrokinetics.
We have treated microparticles such as MLVs and cells for the precise tracking of particle trajectories. In these experiments, sedimented particles as well as floating ones have been observed; we need to increase the magnitude of electric field for inducing the DEP of the sedimented particles which are likely to be aggregated. Accordingly, we have used the plug-in system for applying the FM wave to a targeted particle floating above the substrate.
It is promising to further develop the FM-DEP method for smaller particles with their sizes of submicron to nanoscale, such as dispersed carbon nanotubes, thereby opening up the possibility of real-time spectroscopy using the FM-DEP as described below. When we apply the FM wave to the smaller colloids using the on-chip systems whose electrode configuration is designed to create a constant gradient of the applied electric field, the time-varying velocity vector v (t ) of the FM-DEP caused by the time dependence of the FM-DEP force is ascribed to the variation in χ (f ) (or the real part of the CM factor):it is found from Eqs. (9) and (12) that
$$ \boldsymbol{v}(t)=\frac{\nabla\boldsymbol{A}^{2}_{\text{RMS}}}{6\pi\eta R}\chi\{f(t)\}. $$ (16)Hence, measuring the velocity vector v (t ) of a submicron to nanoparticle could provide the frequency dependence of the real part of the CM factor directly, which would be nothing but the electrokinetic FM spectroscopy.
缩写
- AC:
-
Alternating current
- BL:
-
B cell leukemia
- CM:
-
Clausius-Mossotti
- DEP:
-
Dielectrophoresis
- DOPC:
-
1,2-Dioleoyl-sn-glycero-3-phosphatidylcholine
- FM:
-
Frequency modulated
- MLV:
-
Multilamellar vesicle
- RB:
-
Red blood
- RMS:
-
Root mean squared
- TL:
-
T cell leukemia
- twDEP:
-
Traveling wave dielectrophoresis
- WBL:
-
Wide band limit
纳米材料
- 频率和相位测量
- 评估物联网和 5G 的影响
- TiO2 中金纳米粒子分布对染料敏化太阳能电池光学和电学特性的影响
- ZnO 纳米晶体的合成及其在倒置聚合物太阳能电池中的应用
- 探测 Ag n V (n =1-12) 簇的结构、电子和磁特性
- CoFe/C 核壳结构纳米复合材料的制备和高效电磁波吸收性能
- 通过多元醇介导工艺制备和表征 ZnO 纳米夹
- 嵌入TiO2致密层的不同尺寸和浓度的Ag纳米颗粒对钙钛矿太阳能电池转换效率的影响
- 基材对 LSP 耦合波长和强度的影响
- 纳米材料和纳米技术在废水处理中的作用:文献计量分析
- 机器人、协作机器人和自动化:大流行是否正在推动制造业变革浪潮?
- 4 种库存控制系统类型:永久与定期库存控制以及支持它们的库存管理系统