

基于新型 Ag 掺杂介孔 α–Fe2O3 的高灵敏度乙醇化学传感器,通过改进的溶胶-凝胶工艺制备
摘要
在 Pluronic (F-127) 三嵌段共聚物作为结构导向剂存在下,通过简单的溶胶-凝胶程序合成了介孔 α-Fe2O3。通过光化学还原方法将银 (Ag) 纳米粒子沉积在 α-Fe2O3 基质上。形态学分析表明,在具有 <50 nm 半球形的 α-Fe2O3 介孔结构上形成了小尺寸 <20 nm 的 Ag 纳米粒子。 XRD、FTIR、拉曼、UV-vis、PL 和 N2 吸附等温线研究证实了合成产物的高结晶度、介孔率和光学特性。通过循环伏安法(CV ) 和电流电位 (I-V ) 技术,并将获得的结果与裸 GCE 或纯 α-Fe2O3 进行比较。发现介孔 Ag/α-Fe2O3 可以大大提高传感器的灵敏度,并且在低浓度乙醇的精确检测过程中表现出优异的传感特性。 41.27 μAmM − 1 的高且可重现的灵敏度 cm − 2 在较低乙醇浓度区域(0.05 至 0.8 mM)和 2.93 μAmM − 1 cm − 2 在较高浓度区(0.8 至 15 mM),已达到 15.4 μM 的检测限 (LOD)。对反应动力学的研究揭示了混合表面和扩散控制过程的特征行为。详细的传感研究还表明,对乙醇的敏感性高于对甲醇或异丙醇的敏感性。随着合成和制造方法的进一步努力,当前提出的协议有可能被适当地利用,以制造更好的传感器设备性能。
背景
由于化学传感器在诊断和药物发现、安全相关问题、食品工业、环境监测和农业分析领域的广泛技术应用中的重要性,化学传感器的研究领域在过去十年中显着扩大 [1, 2]。根据要确定的物理特性,化学传感器可分为光学、电、热或质量传感器,它们适用于检测气态、液态或固态的目标分析物 [3]。在目前可用的传感器中,电化学传感器因其卓越的灵敏度、预期的快速响应时间、实验设置的简单性和较低的成本而特别有吸引力[4]。在电化学传感器中,工作电极基本上是用活性传感材料改性的。活性材料的物理化学性质极大地影响了传感器的性能及其操作稳定性[5]。因此,潜在活性材料的研究和开发在制造灵敏、高效、可靠的传感设备方面起着决定性的作用。此外,借助纳米技术,现在可以合成各种具有特定形状和形态的新型纳米材料,从而产生独特的物理化学特性 [6,7,8]。特别是,金属氧化物半导体是一类独特的纳米材料,由于它们具有良好的传感性能,除了具有吸引力外,还可以促进电子转移动力学 [9,10,11,12,13]特性,例如易于制造、控制尺寸和形态的能力、易于修饰表面、良好的化学稳定性和催化性能 [14]。它们对目标分子的吸附也表现出很强的亲和力 [15,16,17,18]。已经成功合成了各种不同形貌的金属氧化物半导体;纳米粒子、纳米线、纳米棒、纳米管、纳米片、纳米带和量子点,使用各种合成途径,如水热/溶剂热 [19,20,21]、溶胶-凝胶 [22、23]、在水溶液中生长 [24]、化学沉积 [25]、电化学技术 [26] 以及化学和物理气相沉积 [27, 28]。然而,开发用于化学传感器应用的新型、有效的金属氧化物半导体仍然是一个现有的挑战,需要对材料进行适当的操作和优化,并仔细选择合适的工作电极。
作为 n 型半导体,α-Fe2O3(氧化铁的赤铁矿相)是一种非常有前途的氧化物类别,其特点是稳定性高、耐腐蚀、无毒,并且已发现广泛用作气体和化学传感材料 [29,30,31] ,作为颜料和磁记录介质,光催化,以及水分解中的光阳极 [32,33,34]。例如,基于 α-Fe2O3 纳米颗粒的化学传感器已经制造出具有高电阻变化的 CH3SH 气体检测,室温范围为 20-80 ppm [35]。在另一份报告中,Ag 掺杂的 Fe2O3 作为核-壳纳米复合材料显示出对 NO2 气体的良好敏感性,可以检测低至 0.5 ppm 的 NO2 [36]。还通过化学还原和水热法合成了 Ag-Fe2O3-rGO 的三级纳米复合材料,并成功用作非酶促 H2O2 传感器 [37]。具有不同 Fe2O3 含量的 α-Fe2O3-GO 纳米复合材料已被设计并用于增强对乙醇气体的传感性能 [38]。在这项贡献中,使用 Pluronic (F-127) 三嵌段共聚物作为结构导向剂,然后通过光还原方法沉积 Ag 纳米粒子,通过简单的、改进的溶胶-凝胶程序合成了一种新型的 Ag/α-Fe2O3 混合纳米结构。新开发的介孔 Ag/α-Fe2O3 作为一种灵敏的化学传感器,通过循环伏安法和电流电位(四 ) 技术。据我们所知,目前提出的混合细观结构尚未用于乙醇的电化学检测。
方法/实验
材料
嵌段共聚物表面活性剂 EO106–PO70EO106 (F-127, EO = –CH2CH2O–, PO = –CH2(CH3)CHO–), MW 12600 g/mol)、硝酸铁 Fe(NO3)3.9H2O、乙醇 C2H5OH、硝酸银 AgNO3 购自 Sigma-Aldrich,无需进一步纯化即可直接使用。
介孔α-Fe2O3的合成
使用 F-127 作为模板导向剂,通过溶胶-凝胶法合成了介孔 α-Fe2O3 纳米晶体。采用以下起始前体的摩尔比:Fe(NO3)3.9H2O/F127/C2H5OH/HCl/CH3COOH =1:0.02:50:2.25:3.75。在典型的合成运行中,在搅拌下将 1.6 g F127 添加到 30 mL 乙醇中,直到获得澄清溶液。随后将 2.3 mL CH3COOH、0.74 mL HCl 和 4.4 g 硝酸铁加入上述溶液中,剧烈搅拌 60 分钟,最后转移到培养皿中进行凝胶化步骤。将合成的中间相干燥并在 40°C 和 40% 湿度下老化 12 小时,然后在 65°C 下进一步老化 24 小时。进行煅烧步骤并在 450°C 下以 1°C/min 的加热速率和 1°C/min 的冷却速率适应 4 小时,以获得介孔 α-Fe2O3 纳米晶体。
Ag 离子光化学还原到介孔 α–Fe2O3
根据以下程序通过银离子的光化学还原将 Ag 沉积到介孔 α-Fe2O3 上:含有 1.0 g 介孔 α-Fe2O3 和 9.4 × 10 - 5 的悬浮溶液 mol AgNO3 在 100 mL 甲醇水溶液(1% (v /v ) 甲醇/H2O)。使用飞利浦汞灯 UV(A) 光(强度 =2.0 mWcm - 2 )照射溶液 ) 12 小时。将生成的 Ag/α-Fe2O3 离心分离,用去离子水和乙醇洗涤,110°C 干燥 12 小时。
材料表征
X 射线衍射图 (XRD) 通过 PANalytical X' 端口衍射仪使用 Cu Kα1/2、λα1 =154.060 pm、λα2 =154.439 pm 辐射测量。在 400 到 4000 cm − 1 范围内收集傅里叶变换红外光谱仪 (FT-IR) 光谱 使用 BRUKER FRA 106 光谱仪使用标准 KBr 颗粒程序。拉曼光谱使用 Perkin Elmer Raman Station 400 测量。紫外-可见分光光度计(λ 950 Perkin Elmer)用于室温下 200-800 nm 范围内的紫外-可见光吸收光谱测量。在荧光分光光度计(RF-5301 PC,日本,SHIMADZU,400 W,50/60 Hz)上使用 150 W 氙灯在 315 nm 激发波长下收集室温光致发光 (PL) 光谱。通过场发射二次电子显微镜 (FE-SEM) 和配备 EDS 分析的 FE 扫描电子显微分析仪 (JEOL-6300F, 5 kV) 研究表面形态。对于在 300°C 下真空干燥 3 小时的样品,Quantachrome NOVA 站 A 用于获得 77 K 下的氮气吸附/解吸等温线。应用Halsey方程的Barrett-Joyner-Halenda(BJH)模型计算吸附数据[39]。
水溶液中乙醇的电化学检测
表面积为 0.071 cm 2 的玻碳电极 (GCE) (Bio-Logic SAS) 最初分别用 1 和 0.05 微米抛光金刚石和氧化铝浆料抛光,用去离子水洗涤,在乙醇、水中超声,最后自然干燥。随后使用丁基卡必醇乙酸酯和乙酸乙酯作为导电粘合剂,用 Ag/α-Fe2O3 活性材料涂覆 GCE。然后将修饰的 GCE 在 65°C 下干燥过夜。具有工作电极(改进的 GCE)和对电极(Pt 线)的典型双电极电化学电池连接到德国 ZahnerZennium 的电化学工作站。使用 Ag/AgCl 参比电极的三电极电池也用于循环伏安法研究。由 Na 2 HPO 4 和 NaH 2 PO 4 制备 0.1 M 浓度的 pH 为 7 的 PBS(磷酸盐缓冲溶液),并用作支持电解质。本研究中应用了 0.05 至 15 mM 的各种乙醇浓度。 I-V (电流-电位)特性是在连续搅拌下、室温下、在 0 到 1.5 V 的电位窗口内以 50 mV/s 扫描速率在阳极方向上测量的。根据电流与乙醇浓度的相应校准曲线的斜率除以 GCE 表面积来估计传感器灵敏度。 LOD(检测限)是在 S 计算的 /N =3(信噪比)。图 1 描述了用电化学检测乙醇合成 Ag/α-Fe2O3 的示意图。
<图片>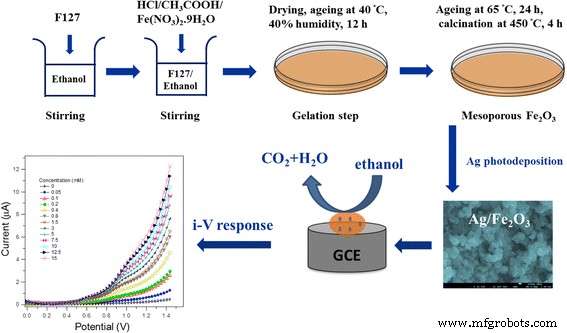
Ag/α-Fe2O3修饰GCE的合成及乙醇电化学检测示意图
结果与讨论
介孔 Ag/α–Fe2O3 的结构、光学和形态研究
首先通过 XRD 检查合成材料的相和结晶度。从图 1 可以看出,溶胶-凝胶衍生的 α-Fe2O3 的 XRD 谱与纯 α − Fe2O3 的标准模式一致。所有峰都可以完美地归于 α–Fe2O3 的结晶相,(JCPDS-01-086-0550)。此外,XRD 图没有显示任何与其他相 β、γ 或 δ-Fe2O3 相关的衍射峰。此外,没有明显的峰归属于 Ag,这可能归因于制备的样品中的少量 Ag 含量。另一个原因可能是由于 Ag 完全掺杂到主晶格中,即离子扩散到主晶格或离子迁移到表面。由于 Ag 的离子半径 (1.15 Å) 明显高于相应的 Fe 3+ (0.635 Å),因此考虑 Ag 粒子迁移到 α-Fe2O3 表面是合理的 [35]。
<图片>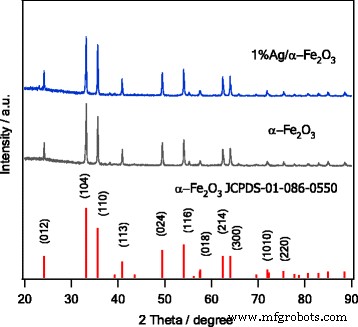
合成后的 α-Fe2O3 和 1%Ag/α-Fe2O3 的 XRD 图。还显示了纯α-Fe2O3的标准图案
可以通过傅里叶变换红外 (FTIR) 光谱检查吸附在合成的 α-Fe2O3 颗粒表面上的官能团的存在。如图 2a 所示,在 ~ 3350 cm − 1 处观察到的带 在 ~ 1630 cm − 1 处有一个小的 被分配到水分子的伸缩振动,表明样品上吸附了少量水。 ~ 566 cm − 1 处的低频段 指赤铁矿八面体和四面体位点的 Fe-O 变形,进一步证明 α-Fe2O3 的形成与上述 XRD 结果非常一致。 2900 cm − 1 处的弱峰 与 C-H 伸缩带有关,这意味着一些有机化合物在煅烧后并未完全从样品中去除 [40,41,42]。陈等人。 [43] 通过简单的醇-热反应制备了六方α-Fe2O3 纳米结构。他们在 3413 cm − 1 处观察到了宽带 在 ~ 2900 cm − 1 处的弱带 ,分别分配给 –OH 和 C–H 模式的伸缩振动。 1629 和 1420 cm − 1 处的两个弱峰 对应于羧酸根基团的不对称和对称振动,表明乙酸根阴离子中的氧原子以单齿模式与铁原子发生化学配位 [43]。此外,他们在 400-700 cm − 1 范围内观察到强烈而广泛的吸收 (440、530、570 和 650 厘米 − 1 )。这些吸收带源于 α-Fe2O3 的固有晶格振动 [43],与目前的工作非常吻合。另一方面,Tang 等人。 [44] 展示了一种开发基于化学功能化核壳 Fe3O4@Ag 磁性纳米粒子的高级免疫传感器的新方法。纯 Fe3O4 的 FTIR 光谱显示了 Fe-O 键在 423 和 572 cm − 1 的伸缩振动模式 ,而对于镀银的 Fe3O4,峰值在 572 cm − 1 移至 589 cm − 1 以及 423 cm − 1 处的峰值 完全消失,表明 Fe3O4 颗粒被 Ag 包覆。
<图片>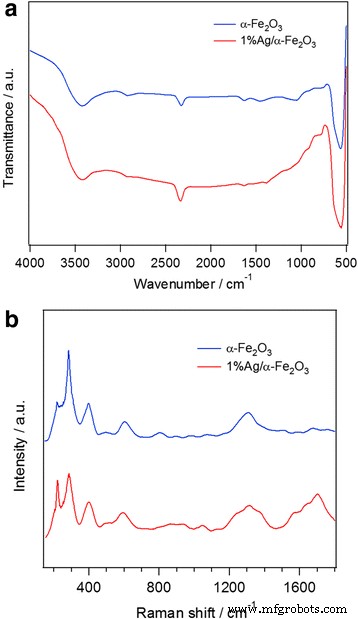
一 FTIR 和 b α-Fe2O3和1%Ag/α-Fe2O3的拉曼光谱
未掺杂和掺杂 Ag 的 α-Fe2O3 样品的拉曼光谱如图 2b 所示。纯 α-Fe2O3 的特征光谱峰出现在 221、290、405、495、609 和 1315 cm − 1 .位于 221 和 495 cm − 1 处的峰 对应于 A1g 模式和 290、410 和 611 cm − 1 的峰值 归因于 Eg 模式 [43,44,45]。通常,α-Fe2O3 属于\( {D}_{3d}^6 \) 晶体空间群,具有七个拉曼主动振动模式,两个 A1g 模式(225 和 498 cm − 1 ) 和五种 Eg 模式(247、293、299、412 和 613 cm − 1 ) [45],与目前的工作非常吻合。尖峰出现在~1315 cm − 1 与两个磁振子散射有关,该散射是由在反平行紧密自旋位点上产生的两个磁振子相互作用引起的 [43, 46]。布山等人。 [46] 在 666、820、1050 和 1103 cm − 1 处观察到另外四个拉曼峰 仅在高 Ag 掺杂的 α-Fe2O3 中高度结晶的 α-Fe2O3 中。目前的工作展示了其中一些峰,证实了所制备样品的高结晶性。在图 2b 中观察到小程度的拉曼位移,这可能是由于颗粒的形态和尺寸和/或应力的差异。在 1%Ag/α–Fe2O3 样品的情况下,Ag 纳米粒子的确认由位于 1370 和 1683 cm − 1 的谱带证明 [47, 48]。 α-Fe2O3 的拉曼峰强度小于 1%Ag/α-Fe2O3 的拉曼峰的相对强度,这可以通过局部表面等离子体共振 (SPR) 诱导的电场 (EF) 增强来解释。银纳米粒子 [49]。由于 Ag 的 SPR 激发而导致的大局部 EF 相关的电磁效应 (EME) 和 Ag 与 α-Fe2O3 之间电子相互作用的化学效应 (CE) 被认为是表面增强拉曼光谱中两种本质不同的控制机制散射 (SERS) 现象。 EM 贡献被理解为比化学增强值高几个数量级,SPR 基本上是局部表面等离子体,与沿 Ag 表面传播的表面等离子体相反。因此,Ag微结构的SPR在SERS增强效果中起主要作用[50]。
图 3a 显示了 α-Fe2O3 和 1%Ag/α-Fe2O3 样品的 UV-vis 光谱。在紫外区(200-400 nm),在 270-320 nm 附近观察到两个吸收峰。第一个与Fe-O的电子传输有关O2 − 的直接电荷跃迁的贡献机制 2p → Fe 3+ 3d,第二个可能是由于颗粒形状和尺寸的变化[51]。在可见光区 (400–800 nm),560 nm 附近的窄吸收源于 Fe 3+ 的间接电荷跃迁 3d → 3d [52, 53]。此外,宽吸收峰从 424 到 450 nm 峰的偏移是由于 Ag 纳米颗粒的表面等离子体共振效应,即,它表明 α-Fe2O3 上存在 Ag 纳米颗粒 [54]。纯α − Fe2O3 的吸收峰强度高于1%Ag/α-Fe2O3 样品,这可能是由于Fe-O 共振减弱所致;氧在 Ag 表面的吸附可能导致表面氧化物的形成,并可能在混合样品中形成 Fe-Ag 相互作用的物种 [55]。周等人。 [51] 研究了通过改进的溶胶-凝胶技术合成的 Fe2O3 薄膜的光学特性。 Fe2O3 薄膜的光学透射光谱在 500 nm 处有一个肩峰,在 400 nm 处有一个峰。肩峰归因于 Fe 3 + 的 3d 非键电子的跃迁 离子到导带与目前的工作非常一致,而峰值归因于 O 2 ̶ 的 2p 键合电子的跃迁 离子到导带[51]。
<图片>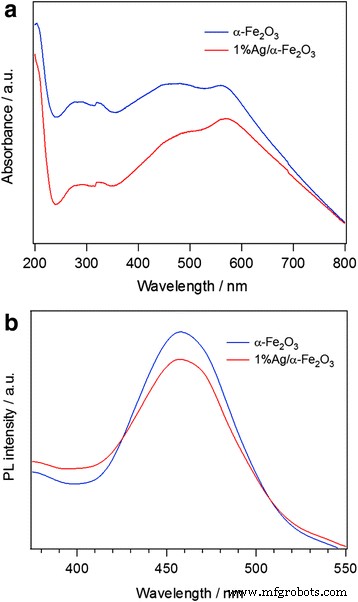
一 在去离子水和 b 中测量的紫外-可见光吸收光谱 在激发波长 315 nm 处测得的 α-Fe2O3 和 1%Ag/α-Fe2O3 的 PL 光谱
为了研究光致电子-空穴对的复合过程,采用了光致发光 (PL) 光谱分析。纯 α-Fe2O3 和 1%Ag/α-Fe2O3 混合结构的 PL 光谱如图 3b 所示。 PL 光谱在 460 nm 波长处显示出 α-Fe2O3 和 1%Ag/α-Fe2O3 的独特发射带。该峰的强度随着掺杂 Ag 的 α-Fe2O3 样品而显着降低,与上述拉曼峰非常吻合,表明由于强电子 - Ag 纳米粒子的转移能力 [55,56,57,58]。卡马利等人。 [59] 观察到两个 PL 峰;第一个位于 710 nm 处,宽而强烈。第二个是 590 nm 处的肩峰。他们认为这些峰是由于 α-Fe2O3 纳米粒子的带边发射 [59]。最近,Thomas 等人在 532、567、646 和 697 nm 处观察到 PL 发射峰值。 [60]。由于量子限制效应,这些峰与不同的光带边缘有关。
图 4 显示了制备的 α–Fe2O3 和 1%Ag/α − Fe2O3 杂化结构的形态以及相应的 EDS 化学分析。可以看出,纯 α − Fe2O3 样品(图(a))表现出类似半球形的形态,粒径在 25-70 nm 范围内。此外,由于掺入了银纳米颗粒,颗粒形状没有得到显着改变; SEM 图像 (b)。 EDS光谱图证实了所开发的混合纳米结构中存在Ag纳米颗粒,Ag负载量与实验相匹配。
<图片>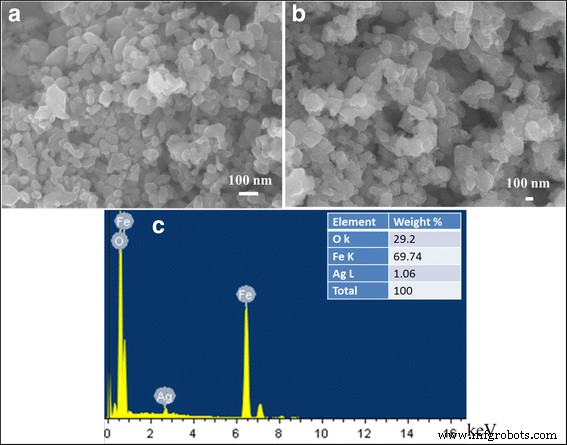
a 的 SEM 图像 α-Fe2O3,b 1%Ag/α−Fe2O3 和 c 1%Ag/α-Fe2O3样品的EDS分析
使用 TEM 进行详细的形态学分析。图 5 显示了 1%Ag/α − Fe2O3 的 TEM 图像和相应的 HR-TEM 图像以及选区电子衍射 (SAED)。 TEM 图像 (a) 证实了 Ag 纳米粒子对主体 Fe2O3 基质表面的攻击,粒径 <20 nm。主要的 α-Fe2O3 基质显示出 10-30 nm 范围内的非常细的球形纳米粒子,一些较大的球体形成壳状结构并将这些小纳米粒子收集在内部。制备的掺杂样品的 HR-TEM 图像 (b) 清楚地显示了 α-Fe2O3 基体的晶格条纹,以及对应于 Ag 纳米颗粒的晶格条纹。测得的面间距分别为 0.37 和 0.23 nm,分别对应于六方 α-Fe2O3 晶格和立方 Ag 的 (012) 和 (111) 平面,再次证实合成的混合纳米结构中存在 Ag。从 SAED 图像 (b) 的插图中可以看出,衍射图显示了对应于 d 的 012、104、113 和 024 六方立方 α-Fe2O3 的不同平面 值分别为 3.73、2.70、2.24 和 1.81 Å。
<图片>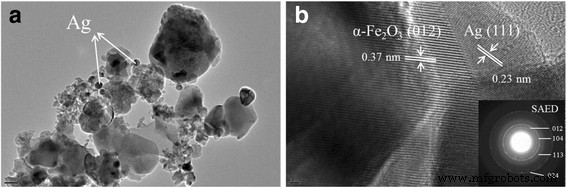
a 的 TEM 图像 1%Ag/α−Fe2O3 和 b 以SAED图案为插图的相应HR-TEM图像
测量 77 K 下的 N2 吸附-解吸等温线以检查合成材料的结构特性,如图 6a 所示。正如所揭示的,α-Fe2O3 和 Ag/α-Fe2O3 都显示出典型的 IV 型剖面,具有 H1 磁滞回线,对应于具有高孔径均匀性和易连通性的圆柱孔几何形状 [61]。在 P/P0 大于 0.8 时检测到吸附的 N2 的吸附体积急剧增加,这基本上与毛细管冷凝有关,表明样品均匀和孔径小。 α–Fe2O3 的比表面积和总孔体积为 3.55 m 2 /g 和 0.004 cm 3 /g,而 1%Ag/α–Fe2O3 的对应值为 3.74 m 2 /g 和 0.006 cm 3 /G。可以注意到,在 Ag 沉积后,结构特性的变化可以忽略不计。此外,孔径分布如图 7b 所示。 α-Fe2O3 具有多种孔径,主要孔为 8 nm,其他小孔为 4 nm 和 13 nm。 8 nm 处的主要孔径可能与 Pluronic F-127 三嵌段共聚物模板最初形成的孔有关。在银沉积后观察到非常相似的孔径分布,除了在~ 4 nm处检测到主要孔,可能是由于银纳米团簇的形成。
<图片>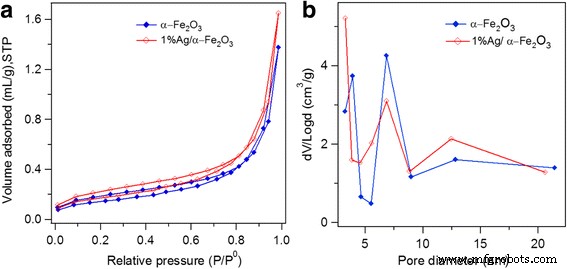
一 N2 吸附等温线和 b α-Fe2O3和1%Ag/α-Fe2O3的BJH孔径分布图
<图片>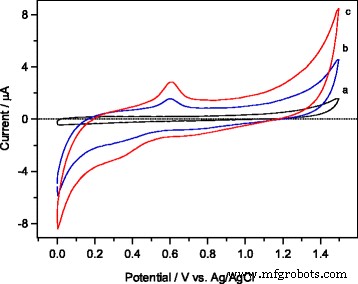
在 0.1 M PBS (pH 7) 中以 50 mVs − 1 扫描速率测量的循环伏安图 在 a 上存在 5 mM 乙醇时 裸 GCE,b 介孔 Fe2O3 修饰的 GCE 和 c 介孔 1 wt.% Ag/Fe2O3 改性 GCE
改性电极的电化学行为
为了了解工作电极的电催化行为,首先将循环伏安法 (CV) 技术应用于 0.1 M PBS (pH 7) 的缓冲溶液中,扫描速率为 50 mVs − 1 在裸 GCE、介孔 α-Fe2O3 修饰的 GCE 和介孔 1wt.%Ag/α-Fe2O3 修饰的 GCE 上使用固定浓度的 5 mM 乙醇。 CV 曲线如图 7 所示。从图 7a 的 CV 图中可以看出,在使用裸 GCE 的情况下检测到小的阳极电流。同时,与裸 GCE(图 a)相比,在介孔 α-Fe2O3 修饰的 GCE(图 b)和介孔 1%Ag/α-Fe2O3 修饰的 GCE(图 c)中观察到阳极电流显着增加,表明修饰电极的电催化活性增强。为了比较两种修改后的电极,有人注意到最大阳极电流为 (I =4.5 μA,图 b) 对于纯 α–Fe2O3 修饰的 GCE,而 1wt.%Ag/α–Fe2O3 修饰的 GCE(图 c)通常会产生最大电流(I =8.4 μA),电流大约是纯 α-Fe2O3 改性 GCE 的两倍。此外,在反向扫描期间,阴极电流可能归因于水的减少,并且发现这些电流值以 1wt.%Ag/α-Fe2O3> 纯 α-Fe2O3> 裸 GCE 的顺序增加。阳极电流的显着增加表明电子转移反应更快,因此可以通过 1 wt.% Ag/α-Fe2O3 改性 GCE 的氧化有效检测乙醇。
然后采用电化学阻抗谱 (EIS) 来研究修饰电极的界面特性。图 8 显示了使用裸 GCE、α-Fe2O3 和 Ag/α-Fe2O3 修饰的 GCE 在 PBS 溶液中的频率范围 (0.1 Hz–100 kHz) 内记录的波特图。与 α-Fe2O3 或 Ag/ α-Fe2O3 修饰的 GCE,裸露的、未修饰的 GCE 表现出相对较大的阻抗响应。检测到两个修饰电极的阻抗降低,表明电化学活性增强。 Ag掺杂的α-Fe2O3修饰电极的阻抗最低,电子转移趋势较高。
<图片>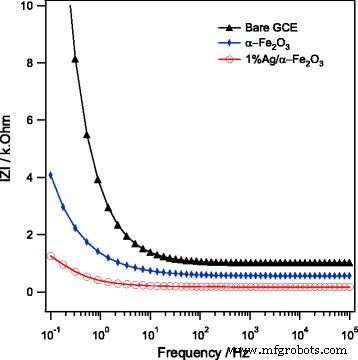
在 0.1 M PBS 中使用裸 GCE、α-Fe2O3 和 1%Ag/α-Fe2O3 修饰的 GCE 在 5mV 电位幅度、0.0V 与 Ag/AgCl 的频率范围内测量的 EIS 波特图,频率范围为 0.1Hz–100kHz
Ag/α–Fe2O3 改性 GCE 中乙醇的电化学传感
一个简单的电流电位 (I-V) 此处采用技术来检查和评估乙醇在改性活性电极上的电化学传感行为。 I-V 在 50 mVs − 1 下在 1wt.%Ag/α–Fe2O3 改性的 GCE 上测量的响应 图 9a 中收集了使用不同浓度乙醇(0.05 至 15 mM)在 0.1 M PBS(pH 7)中的溶液。可以看出,阳极电流随着乙醇浓度的增加而逐渐增加。这种电化学行为可能与电解 PBS 缓冲溶液的离子强度随乙醇浓度的增加有关 [62]。溶液中更多的离子可以为电极表面提供更多的电子,从而提高 1wt.%Ag/α-Fe2O3 修饰电极的电导率 [63]。换句话说,在较高的乙醇浓度下,预计乙醇分子的化学吸附程度会更大,这反过来又会导致电极-电解质界面处的电子状态发生相当大的变化,从而增强了电流响应 [64]。从以上数据 (I-V ) 响应 图 9a,使用平均电流值计算校准图,所得结果如图 9b 所示。正如所揭示的,校准图显示了与两个线性区域相关的两个不同斜率。这种不同的线性区域对应于两个不同的乙醇浓度范围:(i) 0.05 至 0.8 mM 的较低浓度和 (ii) 0.8 至 15 mM 的较高浓度乙醇。 For higher ethanol concentration > 0.8 mM, the anodic current exhibits a linear behavior with ethanol concentration but with appreciable decrease in sensitivity (the slope of linear zone). The sensitivity decline observed at higher ethanol concentration is likely related to the saturation of the electrode active sites with ethanol target molecules. For both concentration zones, two fitted linear Eqs. (1) and (2) could be generated as follows:
$$ \mathrm{at}\ \mathrm{lower}\ \mathrm{concentration}\ \left({R}^2=0.9623\right):\kern3em I\left(\upmu \mathrm{A}\right)=2.9301\ \left[\mathrm{ethanol}\right]\ \left(\upmu \mathrm{A}\right)+0.83308 $$ (1) $$ \mathrm{at}\ \mathrm{higher}\ \mathrm{concentration}\ \left({R}^2=0.9876\right):\kern3em I\left(\upmu \mathrm{A}\right)=0.20793\ \left[\mathrm{ethanol}\right]\ \left(\upmu \mathrm{A}\right)+3.0807 $$ (2)
一 Typical I-V characteristics of mesoporous 1wt.%Ag/Fe2O3-modified GCE toward various concentrations of ethanol (from 0.05 to 15 mM), measured in 0.1 M PBS solution (pH = 7) and b the corresponding calibration plot
The sensitivity of the Ag/α–Fe2O3-modified GCE was then calculated from the ratio of the slope of the calibration plots, Fig. 9b, and the active surface area of working electrode; the sensitivity values were found to be 41.27 μAmM − 1 cm − 2 at the lower ethanol concentration zone and 2.93 μAmM − 1 cm − 2 at the higher ethanol concentration zone. It is worthy to mention that similar research findings of a two sensitivity regions (two different slopes) at different concentrations have been previously observed for ethanol detection using a polypropylene carbonate/silica-modified electrode [65] and for the Pd/ZnO nanocomposite-modified GCE [66]. It has been postulated that the phenomenon of two sensitivity regions can be explained according to the different adsorption modes of ethanol onto the sensor surface; a physisorption process occurs at the lower concentration region leading to higher sensor sensitivity and a chemisorption mode takes place within the higher concentration region giving a saturation to the sensor surface and consequently reducing the sensitivity [65]. Such a two different linear zones obtained with different sensitivities have been also recognized during the electrochemical detection of hydrazine on modified GCE and was discussed in terms of changes in diffusion coefficient of hydrazine due to the evolution of nitrogen gas at higher concentration of target molecule [67]. In the current sensor-modified electrode with Ag/α–Fe2O3, it was observed that by increasing the ethanol concentration above 15 mM, a saturation of recorded anodic current is achieved, leading finally to a sensing limitation region. The limit of detection (LOD) using the current sensor design was estimated by applying the below Eq. (3) [68], taking into consideration the signal-to-noise ratio of (S /N = 3).
$$ \mathrm{LOD}=3{S}_b/m $$ (3)As indicated above in (Eq. 1), the slop of the calibration graph at lower concentration zone m = 2.9301 μAmM − 1 and the value of (S b = 0.015 μA) is the standard deviation calculated for a blank sample after five current measurements. The LOD is accordingly estimated as 15.4 μM.
With an objective to examine the sensing response of current modified electrode toward other alcohols, similar I-V experiments have been conducted for both methanol and isopropanol in liquid phase. Table 1 collects the average oxidation currents in microampere, along with the estimated electrode sensitivity in μAmM − 1 cm − 2 using different alcoholic solutions at 0.05, 0.1, 0.2, and 0.8 mM concentrations. As revealed, the Ag/α–Fe2O3-modified electrode exhibits the highest current response and sensitivity toward ethanol compared to other two-tested alcohols. The order of sensor response is ethanol> methanol> isopropanol.
The kinetics of the electrochemical reaction taking place at the electrode surface during ethanol detection was further investigated by cyclic voltammetry technique through the variation of the potential scan rate within the range (25–500 mV/s) and measuring the corresponding anodic currents. Figure 10a collects the cyclic voltammograms recorded at the Ag/α–Fe2O3-modified GCE in 0.1 M PBS solution (pH = 7) containing 0.2 mM ethanol at various scan rates of 25, 50, 75, 100, 125, 150, 175, 200, 225, 250, 275, 300, 325, 350, 375, 400, 450, and 500 mV/s. As could be revealed, a gradual increase in the anodic peak currents with the scan rate is notably detected, simultaneously in the reverse scan direction, the cathodic currents increase also with the scan rate. Figure 10b exhibits a good linear relation between the anodic peak currents and the scan rate, with a correlation coefficient (R 2 = 0.9950), indicating a surface-controlled kinetic process. Furthermore, in Fig. 10c, the peak currents show a linear dependence on the square root of the scan rate giving R 2 = 0.9954, which is a characteristic feature for a diffusion-controlled reaction. Such kinetics study suggests that the oxidation of ethanol on the current mesoporous 1wt.%Ag/α–Fe2O3-modified GCE likely proceeds via a mixed surface reaction and diffusion-controlled kinetics.

一 Cyclic voltammograms of mesoporous 1wt.%Ag/Fe2O3-modified GCE measured in 0.1 M PBS solution (pH = 7) containing 0.2 mM ethanol at various scan rates of 25, 50, 75, 100, 125, 150, 175, 200, 225, 250, 275, 300, 325, 350, 375, 400, 450, and 500 mV/s. Plot of anodic peak current versus scan rate (b ) and versus square root of scan rate (c )
Table 2 shows a comparison of previously reported results of various modified electrodes during the ethanol sensing using the I-V 技术。 The sensitivity observed herein using the current sensor electrode is significantly higher as compared to the recently reported sensitivities particularly at the lower concentration regime [62, 65, 66, 69,70,71,72,73,74,75].
An important piece of information remains regarding how the sensing mechanism would proceed in the current modified electrode based-system. In general, it has been proposed that the chemisorbed oxygen species (O − , O2 − , or O2 2− ) will cover the surface of the modified electrode [76]. A space-charge region is accordingly originated via electrons withdraw from the surface of sensor electrode. A surface reaction between oxygen species and adsorbed ethanol molecules takes place, releasing electrons to the conduction band of α–Fe2O3 material, Eq. (4) [72], and thus the conductivity and sensor response were enhanced.
$$ {\mathrm{C}}_2{\mathrm{H}}_5\hbox{--} {\mathrm{O}\mathrm{H}}_{\left(\mathrm{ads}.\right)}+6\ {{\mathrm{O}}^{\hbox{--}}}_{\left(\mathrm{ads}.\right)}=2{\mathrm{C}\mathrm{O}}_2+3{\mathrm{H}}_2\mathrm{O}+6{e}^{\hbox{--} } $$ (4)The metallic Ag and metal oxide α–Fe2O3 would have different surface catalytic active sites with electrochemical behavior that would promote the adsorption and diffusion processes of ethanol molecules onto the working electrode. Therefore, the superior sensing performance obtained here with the newly developed mesoporous Ag/α–Fe2O3-modified GCE is likely related to the mesoporosity of α–Fe2O3, small particle size of Ag nanoparticles with catalytic function, chemical, and electronic sensitization effect, all of which would provide enormous adsorption sites for ethanol molecules and promote the diffusion process. Via doping the α–Fe2O3 by Ag nanoparticles, the current sensor-based-modified electrode exhibited extremely high sensitivity toward ethanol detection as 41.27 μAmM − 1 cm − 2 with a very low LOD of 15.4 μM at (S/N = 3) at room temperature.
For the sake of sensor practicability, the storage and operational stability along with repeatability, and reproducibility of modified electrodes were evaluated. Using three different active, modified GCEs, the cyclic voltammograms recorded in 5 mM ethanol gave a relative standard deviation (RSD) ~ 4%, which implies good reproducibility. Five successive cyclic tests in the same ethanol solution yielded < 5% RSD, indicating good electrode repeatability. A proper operational stability of the modified electrode was observed during its continuous testing for 45 min in ethanol solution with a minor reduction in current response. Finally, no special care is required for electrode storage; the present Ag/α–Fe2O3-modified GCE showed unique storage stability for 5 weeks with almost no surface deterioration or reduction in sensitivity.
结论
In summary, an efficient ethanol electrochemical sensor based on mesoporous Ag/α–Fe2O3 synthesized by a facile sol-gel and photo-reduction procedures has been described. The mesoporous α–Fe2O3-modified GCE exhibited good electrocatalytic activity during the detection of ethanol in phosphate buffer solutions. Doping the active material α–Fe2O3 by Ag nanoparticles led to superior sensing performance at room temperature. An extremely high sensitivity of 41.27 μAmM − 1 cm − 2 at low ethanol concentration (0.05 to 0.8 mM) with a very low LOD 15.4 μM at (S/N = 3) was obtained. Additionally, the sensing response and electrode sensitivity was found to be much higher for ethanol as comparted to either methanol or isopropanol. Such extraordinary sensing performance was likely related to mesoporosity of α–Fe2O3 matrix, along with the small particle size of Ag nanoparticles. The unique sensing characteristics obtained in this study reveal that the current-developed mesoporous Ag/α–Fe2O3 would represent a potential sensing material for further fabricating high-performance electrochemical sensors for the detection of ethanol or similar alcohols in aqueous solutions.
缩写
- Ag:
-
Silver
- CV :
-
循环伏安法
- EIS:
-
电化学阻抗谱
- F-127:
-
Pluronic triblock copolymer
- GCE:
-
Glassy carbon electrode
- I-V :
-
Current versus potential
- LOD:
-
Limit of detection
- m :
-
Slop of the calibration graph
- PBS:
-
Phosphate buffer solution
- R 2 :
-
Correlation coefficient
- S /N :
-
Signal-to-noise ratio
- S b :
-
标准差
- α–Fe2O3 :
-
Hematite (iron oxide)
纳米材料
- 通过溶胶-凝胶工艺制备的纳米结构二氧化硅/金-纤维素-键合氨基-POSS 混合复合材料
- 通过改良的反溶剂工艺实现稳定钙钛矿薄膜的全覆盖
- 用贵金属纳米粒子装饰的电纺聚合物纳米纤维用于化学传感
- 基于固态纳米孔内表面改性的过氧化氢传感
- 大面积、高灵敏度 SERS 基板,采用微升级溶液工艺涂覆银纳米线薄膜
- 基于介电纳米棱镜的等离子体传感器
- 用于超灵敏葡萄糖传感的介孔氧化镍 (NiO) 纳米瓣
- 基于空心多孔氧化镍的灵敏非酶电化学葡萄糖检测
- 基于柔性聚(偏二氟乙烯)压电薄膜的超灵敏应变传感器
- 基于 CdSe 量子点和 g-C3N4 纳米片之间的 Förster 共振能量转移的 Hg2+ 的高选择性和灵敏检测
- 接近量子极限的化学传感芯片
- 可印刷化学纳米传感器