

从仿生纳米孔中的水自扩散性对溶剂化生物分子或纳米颗粒进行纳米计量
摘要
从硅藻藻壳的结构中汲取灵感,并出于对水中新兴纳米污染物的新检测策略的需求,我们分析了纳米多孔二氧化硅片作为测量水中生物分子或纳米粒子浓度的计量装置的潜力。该概念依赖于水分子在体积和纳米限制条件下(例如,在纳米孔中)表现出的不同扩散行为。在后一种情况下,水的自扩散系数根据孔的几何形状和表面特性以及孔中悬浮生物分子或纳米粒子的浓度而降低,如先前研究中广泛证明的那样。因此,对于给定的孔隙-液体系统,水在充满生物分子或纳米颗粒的纳米孔中的自扩散性提供了对其浓度的间接测量。使用分子动力学和之前文献中的结果,我们证明了二氧化硅纳米孔中水的自扩散系数与其中包含的蛋白质或纳米粒子的浓度之间的相关性。最后,我们估计纳米颗粒填充纳米孔所需的时间,以评估整个纳米计量协议的实际可行性。结果表明,所提出的方法可能代表了一种评估水中某些类别纳米污染物或生物分子浓度的替代方法。
背景
对水质监测技术的需求由来已久[1]。在古罗马,水源经常受到来自人和动物尸体的生物污染物或沐浴废水的污染,以及铅等非生物污染物的污染[2],导致严重的疾病和精神问题。几个世纪以来的持续研究和进步使今天世界上的大多数人口都能获得安全饮用的自来水;然而,仍有超过 8.5 亿人无法获得清洁用水 [3]。
由于可以污染水的污染物的不同性质,通常是低浓度的,准确的质量监测是一项具有挑战性的任务。特别是,大量新出现的痕量污染物,例如药物、化学品或纳米材料,通常不会被现有的水处理厂监测和去除 [4],尽管它们可能对环境和人类健康产生不利影响[5].
在过去的几十年里,纳米技术的出现使得设计定制的分子传感器能够检测水中的不同污染物,如病原体、有机和无机化学物质 [6]。在最基本的版本中,这些传感器由纳米结构材料、用于识别的解析元件和传递获取信息的主动机制组成 [7]。如果没有获得定量信息,则这些系统被称为纳米探针 [8],并且还依赖于功能化材料来选择性地检测化学物质。
在生物医学领域,低浓度生物分子的检测对于提高诊断的准确性以及根据患者的需求定制医疗和药物至关重要。为此,人们开发了超灵敏识别方法,依靠广泛的各种物理和化学现象,放大低浓度生物分子的检测信号[9-11]。
在此框架下,纳米多孔材料因其独特的结构,以空隙和通道为特征而受到极大关注,这使得它们特别适用于许多纳米技术应用,如催化 [12]、吸附蓄热 [13]、分子筛分[14]、选择性转运(膜)[15]、纳米运动[16]、药物递送[17]和生物吸附[18]。
大自然极大地激发了这些应用的发展,因为它提供了具有特定功能的高效分层多孔结构的杰出例子 [19, 20]。计算机优化和适当设计的合成可以克服可能的限制,例如稳定性低和对所需应用的恶劣环境抵抗力很小[21, 22]。
从硅藻 [23] 的外骨骼(硅藻壳)中汲取灵感,在这项工作中,我们将纳米多孔计量片概念化,用于在水中浓缩某些类别的生物分子和纳米颗粒。关键思想是依赖于水分子在体积和纳米限制条件下(例如,在二氧化硅纳米孔中)显示的不同自扩散系数。当确实受到纳米限制时,水分子的流动性会降低,从而减少了扩散空间。除了孔的大小和几何形状之外,分子溶质(例如纳米颗粒或生物分子)的存在进一步降低了流动性,这取决于其大小和性质。这种行为可以通过先前在文献 [24] 中引入的比例定律准确地恢复,因此证明纳米孔中水的自扩散系数允许间接量化其中包含的生物分子或纳米粒子的浓度。通过分子动力学对二氧化硅纳米孔中不同浓度的蛋白质和氧化铁纳米粒子获得的结果表明,所提出的概念可以清楚地了解它们的浓度,并具有令人满意的准确度。
假设陈述
仿生纳米计量概念
硅藻是生活在无处不在的水环境中的单细胞微生物(真核藻类)。它们的细胞分为两半,封闭在二氧化硅壳(硅藻壳)中。这种多孔基质(外骨骼)允许活细胞与外部环境相互作用,通过亲水表面和高表面积体积比优化纳米颗粒和活性生物分子的附着 [23]。多孔基质的纳米孔和狭缝及其化学性质可用于多种纳米技术器件的仿生设计,用于不同的应用[25]。
基于硅藻的结构,我们在这里将纳米二氧化硅片概念化为水中某些类别的纳米颗粒和生物分子。图 1a 显示了中心硅藻 Thalassiosira pseudonana 的扫描电子显微镜 [26]。该阀门由一个以通道为特征的多孔结构组成,其直径范围在几纳米的数量级,在这种情况下特别是大约 10 nm(参见插图中的详细视图)。一种这样的规则多孔结构代表了大于孔径的分子的天然筛网,但它允许较小的分子侵入,为我们的纳米计量概念提供了一个可利用的限制环境。
<图片>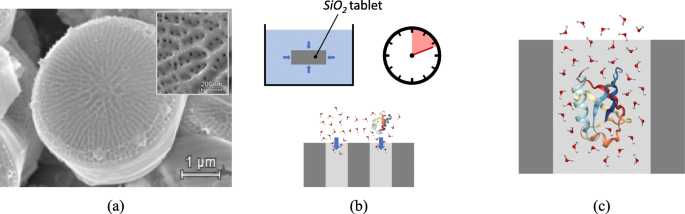
纳米计量二氧化硅片的仿生概念化。 一 Thalassiosira pseudonana的扫描电镜 ,显示了整个阀门和插入物中多孔纳米通道的细节。图片改编自 [26] 并在 CC BY 4.0 许可下使用。 b 从最初是空的纳米孔开始,水分子和溶剂化蛋白质倾向于以特征填充时间侵入二氧化硅纳米片。 c 泛素(1UBQ)侵入二氧化硅纳米孔的细节,由于与蛋白质和纳米孔表面的静电相互作用导致水分子的迁移率降低
如果将硅藻多孔结构或通过人工合成获得的类似结构 [27] 浸入含有悬浮污染物的水样中,则后者会被毛细管作用和浓度梯度驱动进入多孔通道,见图 1b,直到达到平衡到达。在纳米孔内部,由于孔表面提供的纳米限制和侵入的纳米粒子,水分子的流动性降低。因此,纳米孔中水的自扩散系数相对于本体的自扩散系数降低,见图 1c。纳米孔中后一种自扩散系数的知识,例如可以通过扩散磁共振成像 (D-MRI) [28, 29] 或准弹性中子散射 (QENS) 技术 [30, 31] 获得],允许通过下一节中解释的程序推断污染物的浓度。
来自水自扩散性的粒子浓度
在固体表面附近,水分子受到范德华力和库仑相互作用的影响;因此,它们在体积条件下表现出不同的行为 [32, 33]。特别是,这些固液相互作用导致水分子靠近固体表面分层,这降低了它们的流动性,从而降低了相对于体积条件的自扩散系数。
已经以 [24]
形式提出了一种用于预测包含这种效应的水自扩散系数的标度律 $$\begin{array}{*{20}l} D =D_{B} \left[ 1 + \left(\frac{D_{C}}{D_{B}} - 1 \right) \theta \右], \end{array} $$ (1)其中 D B 和 D C 分别是体积和完全纳米限制条件下水的自扩散系数。在方程式中。 (1)、θ 是受固体表面的几何形状和化学特性影响的缩放参数,是所考虑配置中纳米限制水体积与总水体积之间的比率,即 θ =V c/V 总。特别是,给定一个特定的配置,其中水是纳米限制的,V c 表示流动性因固液相互作用而显着改变的水的体积,V 总水可进入的总体积。纳米封闭水体积V c 可以定义为 i 的总和 溶剂可及表面S A S 我 在给定的系统乘以平均特征距离 \(\bar {\delta }_{i}\) 低于该距离时,水分子会受到 i 产生的势阱的显着影响 th固体表面,即:
$$\begin{array}{*{20}l} V_{\text{c}} =\sum_{i=1}^{N} \text{SAS}_{i} \, \bar{\delta }_{i} \,, \end{array} $$ (2)N 系统中不同固液界面的数量。一旦已知表面的几何和化学特性,就可以通过原子模拟轻松估计由某个固体表面施加的水纳米限制的平均特征长度 \(\bar {\delta }_{i}\) [24, 34 ]。请注意, 如果存在多个固液界面, 例如, 在填充有纳米粒子的纳米孔的情况下, 可能会发生纳米限制水体积的部分重叠。在这种情况下,缩放参数θ 在方程式中(1) 只是表面现象,可能取大于 1 的值,因此高估了纳米封闭水的实际比例。这种效应可以通过连续渗流理论(CPT)[35] 来考虑,它提供了有效体积分数为 [24]
$$\begin{array}{*{20}l} \theta^{*}=1 - \exp(-\theta)。 \end{array} $$ (3)因此,在限制体积之间存在较大重叠的情况下,可以通过 θ 获得对水纳米限制的更准确估计 * ,因此,应该更好地用于等式。 (1) 代替θ .显然,θ * ≈θ 对于 θ →0.
如果溶剂化纳米颗粒(或生物分子)的溶剂可及表面等于 S A S 我 , 方程(2) 可用于获得每个纳米颗粒(或生物分子)的平均纳米封闭水体积为 \(V_{\text {c}_{\text {i}}}={SAS}_{i} \, \条 {\delta }_{i}\)。这直接得出悬浮纳米粒子的数量为 \(\phantom {\dot {i}\!}n_{i} =V_{\text {c}} / V_{\text {c}_{\text {i} }}\),因此,它们的数量集中。最终,可以通过所考虑物种的摩尔质量获得质量浓度。
方程 1 首先从原子模拟中获得,并针对磁共振成像 (MRI) 实验进行了验证 [24];随后,它也得到了 QENS 测量的验证 [30, 31] 并应用于解释水在固-液界面的不同性质 [32, 36]。
分子动力学
进行模拟以证明等式的有效性。 (1) 给定其中水的自扩散系数,推断水合纳米孔中的纳米颗粒或生物分子浓度。开源软件 GROMACS [37] 用于分子动力学 (MD) 模拟。为了分析体积和纳米限制条件下水的不同流动性,分析了两种不同的几何布局。对于体条件,采用三次计算框,其中沿三个笛卡尔轴应用周期性。对于纳米限制条件,采用纳米计量二氧化硅片中孔的简化表示,由单个圆柱形纳米孔组成(见图 1c)。为简单起见,但不失一般性,假设孔隙形状/尺寸分布规则,因此,沿轴应用周期性。
所考虑的蛋白质(泛素 - 1UBQ;鸡蛋清溶菌酶 - 1AKI)的几何文件是从蛋白质数据库 [38] 数据库中获得的,而二氧化硅纳米孔和磁铁矿纳米粒子都可以从之前的研究中获得 [24]。二氧化硅纳米孔和氧化铁纳米粒子中的分子内键合相互作用通过谐波拉伸和角电位建模,如 [24] 中详述。它们的非键相互作用由 12-6 Lennard-Jones 和静电势建模,也如 [24] 中所报道。蛋白质的键合和非键合相互作用取自 GROMOS96 43a2 [39]。请注意,在平衡过程中,蛋白质中的所有键都使用 LINCS(线性约束求解器)算法 [40] 保持刚性。在所有情况下均采用具有刚性键合相互作用的 SPC/E 水模型 [41],因为它准确地恢复了室温下水的最相关性质 [42]。
在体量和纳米限制配置中,系统首先是能量最小化、溶剂化(水密度约等于 1.00 g/cm 3 ) 并且,对于蛋白质,净电荷通过离子添加中和。具体来说,模拟盒中引入氯离子来中和溶菌酶的净正电荷,而泛素是中性的,因此不需要添加任何离子。接下来,水合系统在足够长的时间内松弛到其能量最小值。然后通过在 NVT 系综中模拟 100 ps (T =300 K,Nosé-Hoover 恒温器)以在模拟配置中实现势能的收敛(平衡值周围约 ± 1% 的波动,参见附加文件 1:图 S1c)。之后,体积配置也在 NPT 集合中平衡 100 ps (T =300 K,Nosé-Hoover 恒温器; p =1 bar,Parrinello-Rahman 恒压器)以在模拟设置中实现水密度的收敛(平衡值周围大约有 ± 2% 的波动,参见附加文件 1:图 S1a)。最终在 NVT 集成 (T =300 K,Nosé-Hoover 恒温器)。在所有模拟情况下,当自扩散系数(每 100 ps 评估一次)趋于渐近值(即围绕移动平均线的 ± 10% 波动,参见附加文件 1:图 S1b 和d)。由于这通常是在块体配置 ≈ 500 ps 或纳米限制配置 ≈ 1000 ps 之后实现的,因此前者持续到 1 ns,后者持续到 2 ns 以获得更好的统计数据。在所有运行中,使用时间步长为 0.001 ps 的跳跃算法,而范德华相互作用采用 1.2 nm 截止距离,静电相互作用采用粒子网格 Ewald (PME) 方法(网格间距) 0.16 纳米)。固体纳米物体的溶剂可及表面从生产运行中获得并送入专用程序(参见[24]中的补充软件),该程序根据采用的力场计算纳米限制的平均特征长度\ (\bar {\delta }_{i}\) 每个 i 装置中的固液界面。
检验假设
不同系统的水自扩散
等式中标度律的有效性。 (1) 已首先考虑文献(14 种配置)和新模拟(9 种配置)的结果进行测试。特别是,从文献中获取的配置是直径 d 的水合二氧化硅纳米孔 P =8.13 或 11.04 nm(参见 [24] 中的补充表 S1);直径d的唯一磁铁矿纳米颗粒 p =1.27 或 1.97 nm 分别浸入 6 或 7 nm 边长的立方水箱中(参见 [24] 中的补充表 S4);单独的 1AKI 或 1UBQ 蛋白分别浸入边长为 7.03 或 6.32 nm 的立方水箱中(参见 [24] 中的补充表 S10);直径d的水合二氧化硅纳米孔 P =8.13 nm 填充有 2、4、8 或 16 个直径 d 的磁铁矿纳米颗粒 p =1.97 nm(参见 [24] 中的补充表 S2)或 16 个直径 d 的磁铁矿纳米颗粒 p =1.27 nm(见[24]中的补充表S3);和直径 d 的水合二氧化硅纳米孔 P =11.04 nm 填充有 36 或 66 个直径 d 的磁铁矿纳米颗粒 p =1.27 nm 或 20 个直径 d 的磁铁矿纳米颗粒 p =1.97 nm(见[24]中的补充表S3)。此外,新的模拟装置是直径 d 的水合二氧化硅纳米孔 P =8.13 nm 填充了一个 1UBQ 蛋白和一个直径 d 的水合二氧化硅纳米孔 P =11.04 nm 填充 2、3 或 9 个 1AKI 蛋白,或 2、7、9 或 12 个 1UBQ 蛋白。
图 2 显示了先前列出的不同系统的水自扩散系数的结垢行为,即本体水 (D B =2.60×10 −9 m 2 /s)、水合二氧化硅纳米孔、溶剂化蛋白质和磁铁矿纳米粒子,以及填充有蛋白质或纳米粒子的水合二氧化硅纳米孔。正如预期的那样,二氧化硅纳米孔内的水显示出减少的自扩散,与由缩放参数 θ 表示的纳米限制程度的增加相一致 * .悬浮分子(纳米粒子和蛋白质)对水的自扩散系数显示出类似的影响。在图 2 中,实线对应于方程。 (1) 与 D C /D B ≈0,这代表了假设纳米受限水分子没有流动性因此无法扩散的极限情况。相反,虚线对应于具有 D 更现实值的相同方程 C =0.39×10 −9 m 2 /s,如在 [24] 中报告的模拟中观察到的:该模型能够准确地恢复模拟结果 (R 2 =0.93),因此证实了方程的良好预测能力。 (1) 也适用于新的模拟配置。
<图片>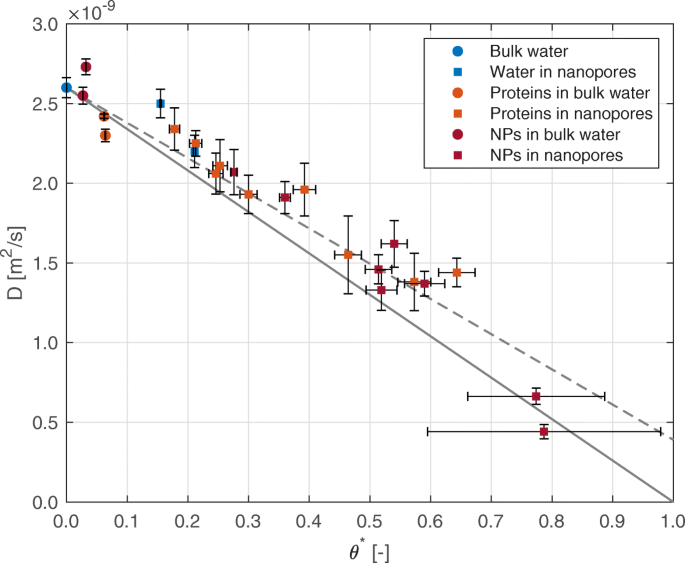
不同系统的水自扩散系数。水的自扩散系数相对于标度参数 θ * 对于不同的系统。二氧化硅纳米孔中蛋白质的数据是通过分子动力学获得的,而其余数据来自 [24] 中的补充信息。在图例中,纳米颗粒缩写为 NP。 D 值的不确定性 指均方位移(±1 s.d.)的拟合; θ值的不确定性 * 估计水分子可接近的总体积 (±1 s.d.)。实线和虚线报告方程中的模型。 (1) 在 D 的情况下 C =0 和 D C =0.39×10 −9 m 2 /s,分别
实践中提议的协议示例
让我们考虑将纳米多孔二氧化硅片用作水中已知污染物的计量装置,如提议的那样。让我们假设将片剂浸入溶液测试样品中足够长的时间,以便悬浮的污染分子扩散到片剂中并达到平衡(有关此问题的详细讨论,请参见下一节)。然后提取样品,水的自扩散系数D 通过例如 QENS 测量获得的片剂的多孔结构内部。体积分数θ * 然后可以很容易地从方程中获得。 (1),因为 D B 和 D C 在给定的温度下是已知的。然后,CPT 可以考虑重叠的纳米限制体积的水,从而导致 θ =− ln(1−θ * )。对于封闭在一个纳米孔中的单一类型的污染物,方程。 (2) 简化为
$$\begin{array}{*{20}l} V_{\text{c}} =n_{p} \text{SAS}_{p} \, \bar{\delta}_{p} + \文本{SAS}_{P} \, \bar{\delta}_{P} \,, \end{array} $$ (4)作为下标 p 和 P 分别指颗粒和孔隙。一旦溶剂可及区域SAS 并且粒子和孔隙的纳米限域的平均特征长度\(\bar {\delta }\) 由分子动力学已知,悬浮粒子的数量很容易获得为
$$\begin{array}{*{20}l} n_{p} =\frac{V_{\text{tot}}\theta-\text{SAS}_{P} \bar{\delta}_{ P}}{\text{SAS}_{p} \bar{\delta}_{p}}。 \end{array} $$ (5)该纳米计量程序的结果报告在表中。参见图 1 和图 3,对于图 2 中二氧化硅纳米孔内的蛋白质和纳米颗粒的一些样本情况。特别是,图 3 中的平分线曲线可以看出估计的悬浮颗粒数量 \((n_{p }^{e})\) 相对于原始(实际)\((n_{p}^{o})\),即 R 2 曲线等于0.85。
<图片>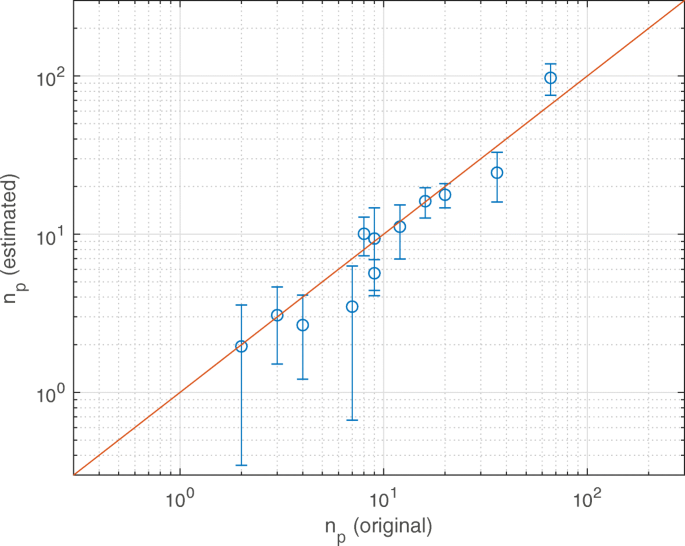
建议的纳米计量协议的准确性。使用提议的协议估计的粒子数与原始粒子数。报告数据(点)参考表1中的配置;实线是平分线。 \(n_{p}^{e}\) 值的误差线是根据 D 的可变性计算的 和 V tot 值(不确定性量化,± 1 s.d.)
给定纳米孔中生物分子或纳米粒子的数量,它们的数量浓度可以很容易地获得为 c =n p /V P, 是 \(V_{\text {P}}=T \pi d_{P}^{2}/4\) 在圆柱形贯通结构的情况下孔的自由体积 [27] (T 是孔长,即,例如,直孔情况下硅胶片的厚度)。该纳米计量方案已在此处针对单个孔进行介绍,但鉴于其孔隙率和水合纳米孔的数量,它可以很容易地外推到整个纳米计量片。
填充纳米孔
上一节中讨论的示例考虑了平衡条件,因此假设纳米孔中的粒子浓度等于本体溶液中的浓度。然而,在这项工作中提出的纳米计量协议也将涉及由待检测的溶剂化颗粒填充纳米孔的过程。在本节中,我们评估了建议的纳米计量方案在纳米孔的特征填充时间方面的实际可行性。
通常用于通过溶剂化纳米粒子最大限度地填充纳米孔的实验方案包括超声处理和离心过程 [43],在某些情况下,由于簇的产生和纳米通道的堵塞,这可能导致粒子分布不均匀 [44-47 ]。在这里,我们考虑自发的溶剂吸入和分散的颗粒扩散到最初干燥的纳米孔中。因此,我们采用了一种简化的方法,考虑到两个连续过程,因为所涉及现象的时间尺度非常不同:纯流体对干燥孔隙的毛细管吸收,以及通过 Fickian 机制通过水合孔隙达到平衡条件的粒子扩散。
实验和分子动力学模拟 [48-50] 表明,如果平均毛细管直径大于水分子直径的大约四倍 [50, 51],则可以通过 Lucas-Washburn (LW) 方程描述渗吸过程。在锐锋近似下,达西定律可用于模拟移动锋h的位置 (t ),恢复相同形式的 LW 方程 [52]:
$$ h=\sqrt{\frac{2K \Delta p}{\phi_{i} \mu}t}, $$ (6)其中Δ p 是驱动毛细管压力,μ 是流体(本例中为水)的动态粘度,ϕ 我 是吸收过程开始时介质的有效孔隙率,K 是它的渗透性。多孔二氧化硅材料呈现出非常规则的结构和狭窄的孔径分布 [46];因此,它们的渗透率可以计算为 [49, 53]:
$$ K=\frac{1}{8}\frac{r_{h}^{4}\phi_{0} }{r_{0}^{2} \tau }, $$ (7)其中 r 0 为公称孔径,r h 是孔隙的水力直径(小于 r 0 因为毛细管表面有水分子吸附层),φ 0 是介质的名义孔隙率,τ 是它的曲折。毛细压力可以用杨拉普拉斯方程描述:
$$ \Delta p=\frac{2\sigma \cos (\vartheta)}{r_{h}}, $$ (8)其中 σ 是流体的表面张力,𝜗 其相对于孔表面的动态接触角。请注意,对于二氧化硅-水界面,𝜗 ≈0 [49, 54]。
纳米多孔片剂可以精确制造,具有直径为 5 至 150 纳米的直圆柱孔和 40 至 90% 的孔隙率 [27]。等式 6 可用于估计具有这种几何特征的纳米多孔材料完全吸收所需的时间 (t 我 ),在简化假设中,稀释的污染物不会影响这个过程。结果 t 我 图 4 中使用蓝色星号和虚线报告了片剂厚度(即孔长)从 1 μ 变化的情况 米到 1 毫米。结果表明,吸收过程的速度非常快:所考虑的最厚的宏观片剂在不到 10 秒的时间内完全充满水。为了分析与分子动力学设置模拟的相干构型,t 的估计 我 考虑最初干燥的材料(即 ϕ 0=φ 我 ),平均孔径d 0=2r 0=11.04 nm,孔隙率和曲率等于φ 0≈40% 和 τ ≈1,分别。由于水动力半径要考虑吸附水分子的影响,r h =r 0−2d w ,其中两层吸附的水分子(带有 d w =0.275-nm 直径)假设 [24]。在体积条件下可以合理地考虑孔隙内的剩余水,因此,σ =0.072 N/m 和 μ =10 −3 Pa·s 在 T =300 K。执行这些估计时忽略了悬浮颗粒对吸入过程的影响。然而,在高体积分数或颗粒孔径比接近单位时,颗粒-壁相互作用不可忽略,因为水的局部特性,如粘度和接触角可能会改变[55]。尽管如此,液体前沿的位置可以用方程来描述。 (6) 粒径比为 10% 或更低 [55]。
<图片>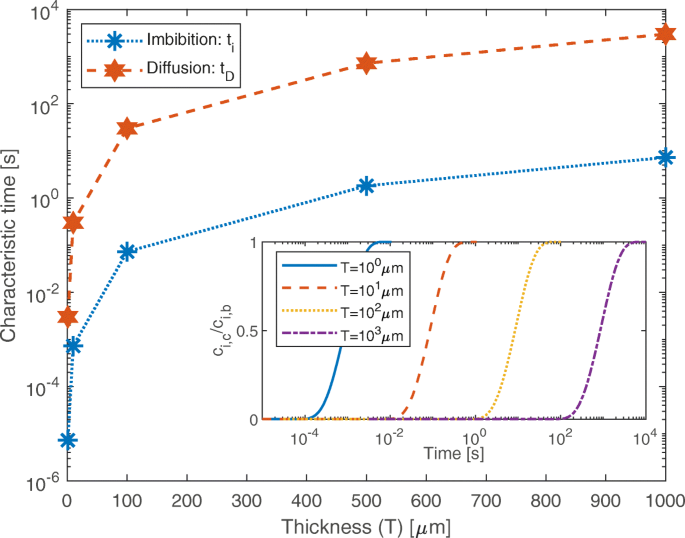
纳米孔的特征填充时间。毛细作用填充纳米孔的特征时间(蓝色虚线,t 我 ) 和粒子扩散(红色虚线,t D ) 改变纳米多孔二氧化硅片剂的厚度(直径为 11.04 nm 的纳米孔;1AKI 蛋白质在水中的溶液,重量分数为 1%)。颗粒通过完全水化孔隙的扩散过程需要一个特征时间t D 比 t 高两个数量级 我 , 在所有分析的配置中。插图显示了纳米孔中心的粒子浓度之间的比率 (c 我 ,c , 在 x =T /2) 和批量 (c 我 ,b , 在 x =0 和 T ) 作为不同厚度的时间函数 (T ) 的药片
然后评估粒子扩散到完全水合、均匀和直的纳米孔所需的特征时间。假设这种填充过程依赖于纯扩散 [56, 57],并且在粒子-孔相互作用可以忽略不计的假设下,可以用 Fick 方程来描述:
$$ \phi_{0}\frac{\partial c_{i}}{\partial t}-D_{e}\nabla^{2} c_{i}=0, $$ (9)c 我 粒子浓度,D e =φ 0D p /τ 颗粒在水合通道中的有效扩散系数,以及 D p 它们在大量流体中的扩散率。
作为第一个例子,计算被执行,考虑在 c 稀释的溶菌酶 (1AKI) 溶液 我 ,b =3.4 摩尔/米 3 浓度,即大约 1% 的重量分数。类似于用于估计 t 的配置 我 , 平均孔径为d的二氧化硅片 0=2r 0=11.04 nm,不同厚度,孔隙率等于 ϕ 0≈40% , 和曲折度 τ ≈1 被考虑。从内部没有任何颗粒的完全水化孔隙开始,填充时间t D 估计为到达 c 所需的时间 我 ,c =0.95c 我 ,b at the center of the pore, namely at x =T /2。 The particle concentration is constant and equal to c 我 ,b at both ends of the channel, namely at x =0 and T . The diffusion coefficient of the lysozyme in water is assumed equal to the bulk value, namely D p =11.08·10 −11 米 2 /s [58, 59]. Equation 9 is solved numerically in one dimension by a finite-element method. The results are reported in Fig. 4 as red stars and dashed line, showing that t D is about two orders of magnitude higher than t 我 for a given thickness of the silica tablet. Even in the worst case presented (T =1 mm, t D ≈3000 s), the filling time appears to be compatible with a nano-metering protocol of practical interest. Note that both simulations [60] and experiments [61] in the literature show that the particle diffusivity D p in nanopores can be significantly lower than the bulk one, because of the different affinity of particles with the pore surface and the presence of nanoconfined water with low mobility. Hence, the proposed approach provides initial indications on the characteristic filling time but, to achieve more accurate estimations, D p and thus t D should be analyzed on a case-by-case basis [62].
As a second example, we assess the possibility of metering the concentration of solvated drugs, since they are currently considered as emerging pollutants of water sources [5]. In particular, we analyze one of the relevant drugs for cancer treatment:doxorubicin, which is a hydrophobic molecule commonly used for chemotherapy [63–65]. An estimation of the diffusion time t D of doxorubicin into the hydrated silica nanotablets can be performed under the assumptions already adopted for the previous case study. Unbound doxorubicin has a diffusion coefficient of D p =1.6·10 −10 米 2 /s [66]; thus, a silica tablet with 500 μ m thickness would be filled at 95% of the bulk concentration (c 我 ,b =3.4 mol/m 3 ) in approximately 500 s. This illustrative case shows that the proposed nano-metering protocol could be also potentially employed to detect the concentration of drug traces in water. We remark that the effect of additional factors (e.g., chemical affinity between drugs and pore surface, pH, presence of surfactants or functionalizations), which are not considered in this simplified model, should be experimentally investigated, as they may significantly deviate the characteristic time with respect to the considered simplified conditions.
Clearly, the filling time of the nanopores should lie between t 我 (best case, nanoparticles are dragged into the pores together with water by capillarity) and t D (worst case, water first hydrates the pores and then nanoparticles follow by Fickian diffusion). Even in the worst explored case, modeling estimations of the filling time of the nanopores indicate a practical feasibility of the proposed nano-metering protocol. This idea is also supported by some promising experimental evidences in the literature. For instance, hydrophilic carbon nanotubes with average diameter of 300 nm are easily filled by spontaneous imbibition with particles in the range of 10–50 nm [67, 68], proving that a proper tuning of the geometrical and chemical parameters of the configuration would provide a fast and homogeneous filling of the nanochannels, thus making the proposed nano-metering protocol feasible.
Implications of the Hypothesis
Inspired by the regular nanoporous structure of diatom algae frustules, in this work, we have presented a new concept for measuring the concentration of nanoparticles or biomolecules dispersed in water. The regular structure of the algae frustules can be artificially reproduced by nanoporous silica tablets, whose pore size, thickness, and shape should be precisely tuned to optimize the selective uptake of particles. The proposed nano-metering method relies on the effect of those nanoparticles or biomolecules on the self-diffusion coefficient of water nanoconfined within the tablet’s pores, and consists in the following steps:
- 1.
Synthesize porous tablet with a controlled size distribution of nanopores.
- 2.
Let the nanopores of the tablet fill with the solution containing the particles to be detected via capillary imbibition and particle diffusion, achieving equilibrium conditions between the nanopores and the surrounding solution.
- 3.
Remove the tablet from the solution and measure the self-diffusion coefficient of water in the hydrated nanopores filled with the particles, e.g., by QENS or D-MRI techniques.
- 4.
Correlate the measured self-diffusion coefficient of water with the particle concentration by means of Eqs. 1 to (5). The solvent accessible surface of nanopore and particles (SAS ) and their mean characteristic length of nanoconfinement (\(\bar {\delta }\)) should be computed from molecular dynamics or taken from available databases.
Molecular dynamic simulations and evidence from the literature have been employed to assess the feasibility of the proposed nano-metering protocol. Hydrated nanopores filled with different concentrations of iron-oxide nanoparticles or proteins have been analyzed, finding agreement between the computed and predicted self-diffusion coefficient of nanoconfined water, thus allowing to estimate the particle concentration. A preliminary analysis of the mechanisms involved in the nanopores filling has been also carried out. Because of the different time scales, two different phenomena have been considered separately:the imbibition of a dry tablet by pure water, driven by capillarity, and the particle diffusion through the hydrated pores, driven by concentration gradient. Results show that the leading characteristic time in the filling process is the time required for particles to diffuse into the hydrated pores; however, the estimated filling time does not exceed 1 h even in case of the thickest tablets considered (1 mm), therefore not compromising the practical feasibility of the nano-metering protocol.
Although the proposed nano-metering method has shown promising results from a numerical point of view, the actual experimental implementation may have to face some additional issues. First, the interaction between the pore surface and particles could be non-negligible and thus alter the filling process (e.g., pores clogging). This effect could generate a bias between the actual concentration of the particles in the bulk solution and the one measured within the pores. Such an issue could be solved by an accurate selection of the surface properties of the pores, which should not interact with the particles to be detected. Second, the current experimental techniques could have difficulty to measure the water diffusivity with a single-nanopore resolution. This issue could be mitigated by measuring the average self-diffusion coefficient over hundreds or thousands of nanopores, which could also provide a better statistical sampling in case of inhomogeneous particle filling throughout the tablet. Third, the uncertainty of the nano-metering protocol should be assessed by experiments. The configurations studied by molecular dynamics have revealed prediction errors up to ± 50% :this error range could be eventually reduced by considering larger statistical samples, both in terms of time (multiple measures) and space (averages over hundreds or thousands of pores). Fourth, the optimal diameter of the nanopores should be determined on the basis of the expected size and concentration of the particles to be detected. On the one hand, the pore size should be chosen to avoid low θ * (e.g., θ * should be> 0.2), since this could lead to negligible variations of the self-diffusivity of water that could be eventually below the resolution of the QENS or D-MRI techniques; on the other hand, high levels of water nanoconfinement should be avoided as well (e.g., θ * should be <0.8), to limit the risk of pore clogging or particle aggregation/segregation and thus biased concentration results.
In conclusion, further research is needed to validate experimentally the original nano-metering protocol discussed in this work. However, the presented numerical results prove the potential of the idea, which may pave the way to a completely new class of detection processes of emerging nanopollutants in water or biomolecules. In perspective, the microscopic size of the metering devices, e.g., nanoporous silica tablets, may allow automation of the nano-metering process through lab-on-a-chip devices.
数据和材料的可用性
当前研究中使用和/或分析的数据集可根据合理要求向相应作者索取。
缩写
- 1AKI:
-
Lysozyme
- 1UBQ:
-
Ubiquitin
- CPT:
-
Continuum percolation theory
- D-MRI:
-
Diffusion magnetic resonance imaging
- IONP:
-
Iron oxide nanoparticle
- LINCS:
-
Linear constraint solver
- LW:
-
Lucas-Washburn
- MD:
-
分子动力学
- MOL:
-
Molecule
- MRI:
-
磁共振成像
- NP:
-
Nanoparticle
- PME:
-
Particle Mesh Ewald
- QENS:
-
Quasi-elastic neutron scattering
- SAS:
-
Solvent accessible surface
纳米材料