

基于自分解纳米颗粒的精密溶酶体pH指示剂的建立及应用研究
摘要
溶酶体的酸性pH值与自噬密切相关;因此,众所周知的精确溶酶体,pH 值的变化将提供有关自噬过程和状态的更多信息。然而,到目前为止,只能指示相对较宽范围内的 pH 变化,准确的溶酶体 pH 检测从未到来。在我们的研究中,我们基于具有特定合成参数的自分解 SiO2 纳米颗粒系统建立了一种内切/溶酶体 pH 指示剂。中心中空结构纳米粒子中的中心浓缩亚甲蓝 (MB) 呈现出作为 pH 值函数的敏感释放,pH 值 4.0–4.8,这正是溶酶体的 pH 范围。已建立光密度 (OD) 值与 pH 值的线性相关性,已用于检测 6 种不同细胞系中溶酶体的 pH 值。此外,通过该系统,我们成功地精确检测了黑介孔硅(BPSi)NP内吞前后溶酶体的pH平均值变化,阐明了BPSi内吞后自噬终止的机制。因此,基于自分解纳米颗粒的管腔 pH 指示剂可以提供一种新的方法和策略,以更好地了解溶酶体的 pH 值,然后指示自噬过程或其他重要代谢信号的更多细节。
介绍
溶酶体是大分子的最终目的地,这些大分子被低 pH 值激活的水解酶降解 [1]。由液泡型 H + −ATP 酶 (v-ATPase) [2] 维持的溶酶体酸性 pH 值将质子从细胞质泵入溶酶体腔,以保持约 60 种水解酶的活性 [3]。此外,最近的文献报道表明溶酶体的酸性pH值与自噬密切相关[4],因此熟知溶酶体pH值的精确变化将提供更多关于自噬过程和状态的信息。根据我们的研究和文献综述,带胺正电荷的纳米颗粒内吞作用可能会增加内切体/溶酶体的 pH 变化,例如伯胺和仲胺 PEG 修饰的纳米颗粒或颗粒表面的一些亲水性修饰 [5, 6]。
胺纳米颗粒的内吞作用引起的pH升高会显着增加转录因子EB(TFEB)的核定位[7],不仅导致该途径的转录上调,还会导致溶酶体功能障碍,最终导致自噬流受阻[7]。 7,8,9]。由于TFEB调节自噬,因此其过表达导致培养细胞中自噬体的产生显着增加。
因此,为了预测自噬过程和自噬的细节,溶酶体精确的pH值及其变化测量非常关键。迄今为止,从内/溶酶体pH值指示文献综述[10]和用于检测内/溶酶体pH值的商品,只能指示相对较宽范围内的pH变化,而准确的溶酶体pH检测从未到来.因此,要了解自噬的细节,建立精确的管腔pH变化检测方法是重要的途径。
基于我们之前在自分解SiO2纳米粒子方面的经验,本研究建立了一种精确的pH指示剂,可以实现管腔pH值变化的检测。 SiO2 纳米粒子在尺寸可调和生物相容性方面具有良好的优势[11]。通过设置特定的合成参数,已建立的自分解 SiO2 pH 指示剂可以在 pH 4.0–4.8(恰好是溶酶体的 pH 范围)内灵敏地释放有效载荷亚甲蓝 (MB)。此外,MB 释放与 pH 值变化呈线性相关(方案 1)。然后,我们通过引入6种不同的细胞系测试了pH指示剂在细胞水平上的可行性,成功测定了黑介孔硅(BPSi)NPs内吞前后溶酶体的平均pH变化,阐明了BPSi后自噬终止的机制内吞作用。因此,基于自分解纳米颗粒的管腔 pH 指示剂可能提供一种新的方法和策略,以更好地了解溶酶体的 pH,然后指示自噬过程或其他重要代谢信号的更多细节。
<图片>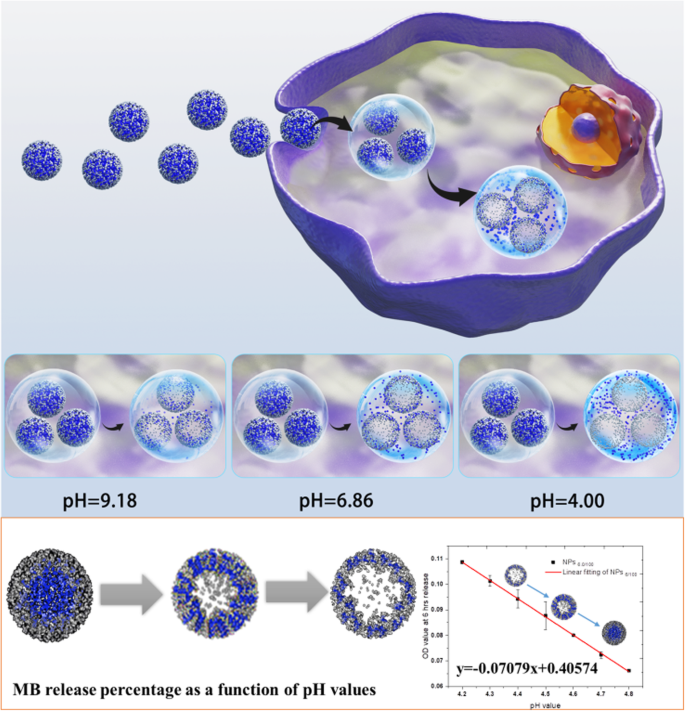
MB@SiO2测定活细胞溶酶体pH示意图
材料和方法
材料部分
硅化钠 (NaSi) 和 Si 晶片(直径 20 cm、p + (100)、0.01–0.02 Ω cm)分别由 SiGNa Chemistry Inc. 和 Ocmetic Inc. 提供。溴化铵(NH4Br,99%)、溴化钠(NaBr,99%)、甲苯(无水,99.8%)、盐酸(HCl,37%)、MB 和原硅酸四乙酯 (TEOS) 购自 Sigma-Aldrich。 0.5 kDa甲氧基-PEG-硅烷和2 kDa甲氧基-PEG-硅烷分别购自Fluorochem Ltd.和Laysan Bio Inc.。 RPMI 1640 培养基由 Life Technologies 提供。胎牛血清(FBS)购自天航生物科技。碳酸氢钠、硫酸链霉素、青霉素 G、HEPES、溶菌酶溶液、CellLight Early-endosomes-GFP、LysoTracker™ Red DND-99、Pierce® BCA 蛋白质检测试剂盒、增强的化学发光、pHrodo™ 红色转铁蛋白偶联物、活细胞成像溶液和Trizol 试剂购自 Thermo Fisher Scientific。乙醇和氨水由国药集团提供。 BioRT Master HiSensi cDNA First-Strand Synthesis kit购自杭州百尔科技有限公司 RIPA裂解液购自Heart Biological Technology Co., Ltd. P62、TFEB、β-actin抗体购自Proteintech Group , Inc. LC 3B 抗体由 Abcam 提供。 2-(4-吡啶基)-5-((4-(2-二甲氨基乙基-氨基氨基甲酰基)甲氧基)苯基)恶唑(PDMPO)由亿森生物技术有限公司提供
研究的目标、设计和设置
本研究的目的是(1)探讨BPSi纳米颗粒对HepG2细胞自噬的影响,(2)找出影响自噬的溶酶体pH值变化的潜在机制,(3)建立一个精确的溶酶体pH指示剂,可以测量溶酶体的 pH 值准确,最后,(4)表明 pH 值波动对自噬的影响。为实现上述研究目的,我们采用转录组测序实验探索了喂食BPSi纳米颗粒后HepG2细胞转录组基因的变化,并通过RT-qPCR和Western实验进行验证。使用荧光染料如 PDMPO 来测量喂食 BPSi 后 HepG2 细胞中溶酶体 pH 值的变化。为了精确测量溶酶体的pH值,我们开发了具有10个参数的MB@SiO2纳米颗粒,并通过DLS和HR-TEM等实验测试了这10种纳米颗粒的表征。在不同的 pH 值溶液和 HepG2 细胞中测试了 10 系列自分解纳米颗粒系统的 MB 加载效率和释放动力学研究。为了验证纳米颗粒进入细胞后的细胞内位置,我们进行了细胞 TEM 实验和活细胞共聚焦显微镜检查。最后,我们测量了喂食BPSi后6种细胞的溶酶体pH变化,以验证MB@SiO2纳米颗粒测量溶酶体pH变化的通用性。
BPSi 纳米粒子合成
BPSi 纳米粒子由我们之前的方法 [12] 制备并由我们的合作者(Wujun Xu,东芬兰大学应用物理系)提供。 BPSi、NaSi、铵盐和 NaBr(NaSi:NH4Br:NaBr 为 1:4:4,w/w/w)的制备在具有 Ar 气氛的手套箱中研磨。使它们在管式烘箱中在 N2 气氛下在 240 °C 下反应 5 小时(方程式 1)。冷却至环境温度后,通过分别用0.5 M HCl和1.0 M HF溶液冲洗来纯化获得的微粒。将微粒在乙醇中以1000 rpm球磨15 min,通过调节离心速度收集所需粒径的BPSi纳米粒子。
$$ \mathrm{NaSi}+{\mathrm{NH}}_4\mathrm{Br}\to \mathrm{NaBr}+{\mathrm{NH}}_3+\mathrm{Si}/\mathrm{H}+{ \mathrm{H}}_2 $$ (1)通过动态光散射实验,研究了纳米粒子的直径分布和表面电荷。将所有纳米颗粒通过轻微超声灭菌(5 s 以使其均匀分散在溶液中,超声波清洁器 SB-5200DT,宁波森茨生物科技有限公司)在其引入细胞之前分散在培养基中。
10系列自分解纳米粒子系统建立
10 系列自分解纳米粒子是通过我们之前报道的方法合成的 [13,14,15,16],并修改了参数。在典型的程序中,首先将一定量的 MB 加入到乙醇 (75 mL) 和氨水溶液 (25%, 3.4 mL) 的混合物中,然后再加入一定量的 TEOS。搅拌24 h后得到系列自分解MB@SiO2纳米颗粒,洗涤3次后干燥。方案中添加的 MB 和 TEOS 量如表 1 所述。NPs1.0/100 中 1.0/100 的含义代表我们合成纳米粒子时 MB 和 TEOS 的库存,MB 为 1.0 mg,100 μL的 TEOS。 NPs1.5/100等中1.5/100的含义与1.0/100的含义一致。
细胞培养
为了测试基于自分解纳米粒子的 pH 指示剂的效率和通用性,我们尝试在特定的肿瘤衍生癌细胞系上对其进行测试。因此,我们选择肝癌、肺癌、结肠癌和黑色素细胞瘤细胞系作为研究对象。人结肠癌细胞HCT116、HCT8和HCT15的细胞系;人肝癌细胞 HepG-2;人肺癌细胞 A549;和小鼠黑色素瘤细胞 B16 维持在 RPMI 1640 培养基(Life Technologies)中,该培养基补充有 10% 热灭活 FBS、2.0 g/L 碳酸氢钠、0.1 g/L 硫酸链霉素、0.06 g/L 青霉素 G 和 5.958 g/L HEPES。将细胞培养在标准的细胞培养箱中,37 °C,5% CO2 的湿润气氛中。
10 系列自分解纳米粒子系统的表征
所有系列纳米粒子的形貌均通过具有 STEM 模式的 HR-TEM 进行表征,并通过 EDS 元素映射研究 Si 映射。纳米颗粒尺寸分布分析由 ImageJ 软件通过计算随机选择的 STEM 图像中的纳米颗粒直径进行。纳米粒子的 zeta 电位和多分散指数 (PDI) 已通过动态光散射 (DLS) 研究在具有特定 pH 值的串联缓冲液中测量。数据采用SPSS15.0进行分析,统计结果以均数 ± 标准差表示
10 系列自分解纳米粒子系统的 MB 加载效率和释放动力学研究
为了研究MB负载效率和释放动力学,首先建立了MB系列浓度的标准曲线。 MB的吸收通过UV-Vis光谱进行,在660 nm处的吸光度为λ 单体 MB 的最大值。 MB加载效率由下式计算,MB加载效率(%) =包封的MB量/(MB输入总量)。
在具有不同 pH 值(pH 4.0、pH 6.86 和 pH 9.18)和溶菌酶溶液(Thermo Scientific™ # )的纯水和 pH 缓冲液中研究了 10 系列纳米颗粒的 MB 释放 90082)。此外,还研究了在不同 pH 缓冲液中特定持续时间后 MB 的释放动力学。然后研究了660 nm处的OD值和作为时间函数的MB释放百分比。
更详细地说,MB 释放研究是通过以下方案进行的;将10系列纳米颗粒分别溶解于15 mL pH 4.0、6.86和9.18的标准缓冲液中,溶酶体溶液;并在 Hula 混合器中在 37 °C 下进行 MB 释放。在接下来的15 天中,每个样品收集1 mL,然后以12000 rpm离心10 分钟。测定上清液和沉淀物在200-800 nm处的吸收光谱。
此外,还使用上述相同的方案研究了在 4.1 到 5.5 的 pH 范围内具有溶菌酶溶液的精确 pH 缓冲液中 MB 的释放。将特定的持续时间(6 h、12 h 和 24 h)作为观察时间点。记录每个样品在 660 nm 处的吸收。分别计算各时间点各pH溶液吸光度与残差平方和的线性关系。
为了检测细胞中的 MB 释放曲线,将 HepG-2 细胞培养在 75 cm 2 当细胞增殖到培养瓶的 70% 时,加入 NPs (300 μg/mL)。每隔30 分钟后,收集细胞。细胞被反复冷冻和解冻以完全释放细胞中的 MB。细胞裂解液以 12000 r/min 离心 10 min。获得上清液并测量其在 660 nm 处的吸光度以计算释放的 MB 总量。本研究选择HepG2细胞作为研究对象,因为其细胞增殖速度快,可以将10个测试组之间的差异最小化。
10 系列纳米粒子的细胞共定位和在 6 种不同细胞系中的释放性能
按照标准细胞 TEM 协议,采用细胞 TEM 来研究纳米颗粒在内/溶酶体中的共定位。细胞接种强度为1 × 10 6 细胞/烧瓶并孵育 24 h,使细胞附着。将培养基中具有相同浓度 (100 μg/mL) 的十个系列纳米粒子与细胞分别再孵育 12 和 24 小时。然后用PBS洗涤细胞3次以去除多余的纳米颗粒,然后在2.5%戊二醛溶液中固定超过1 天。固定后的细胞用1%四氧化锇去离子水中洗涤染色1 h,然后用PBS洗涤3次,去离子水洗涤2次。接下来进行经典的细胞 TEM 协议 [17, 18],并收集厚度为 90 nm 的切片用于 TEM 观察。在具有 NPs6/100 和 NPs7.5/80 的 6 个细胞系中研究了 MB 释放作为 pH 值的函数。同时,记录了MB释放的OD值和MB释放百分比用于数据分析。
MB@SiO2 纳米颗粒细胞内摄取的调查
活细胞共聚焦显微镜用于评估 MB@SiO2 纳米颗粒的细胞摄取和细胞内命运。 HepG-2 细胞早期内体染色(CellLight Early-endosomes-GFP,BacMam 2.0 ThermoFisher Scientific C10586,激发/发射~ 488/510 nm)16 小时。然后在特定时间间隔(2 h、2.5 h、3 h、5 h和6 H)。在拍摄图像之前,lysotracker 用 LysoTracker™ Red DND-99(Thermo Fisher Scientific L7528,激发/发射:577/590 nm)染色 40 分钟。之后,去除染色溶液并在 PBS 中清洗细胞 2-3 次。图像使用尼康 A1R 共聚焦显微镜拍摄。
转录组测序评估 BPSi 喂养后的基因表达变化
对照组和BPSi处理组的总RNA提取按照标准操作程序使用Trizol试剂进行。使用 NanoDrop ND-2000 分光光度计检测用于测序实验的初始总 RNA 样品的质量。通过质量控制的总RNA用于后续的测序实验。通过二代测序进行基因表达的比较。所有测序程序均由 BGI-Shenzhen Corporation(中国深圳)使用 BGISEQ-500 平台执行。通过测序获得的原始数据进行质量控制,以确定测序数据是否适合后续分析。如果通过,根据基因表达水平对基因进行定量分析,并对所选样本之间差异表达的基因进行基因本体(GO)功能的显着富集分析。
通过逆转录定量聚合酶链反应 (RT-qPCR) 检测确认 TFEB-CLEAR 基因网络的激活
使用Trizol试剂从对照组和BPSi处理组培养的HepG-2细胞中提取总RNA,并使用BioRT Master HiSensi cDNA First-Strand Synthesis Kit(杭州博尔科技有限公司)反转录为cDNA .) 随机引物。使用 Applied Biosystems™ 7500 实时 PCR 系统(Applied Biosystems, Life Technologies, Carlsbad, CA)通过定量 PCR 扩增 TFEB-CLEAR 基因网络,肌动蛋白作为参考对照。用于定量RT-PCR的引物见表S4。
Western Blot Assay 以确认 BPSi 喂养后自噬被激活
对照组和不同浓度BPSi处理组的细胞蛋白采用RIPA裂解液(Heart Biological Technology Co., Ltd.)提取。将蛋白酶抑制剂加入 RIPA 裂解液并在冰上预冷。用预冷的 PBS 洗涤细胞 3 次。完全倒掉液体并将盘子放在冰中 2 分钟。将400微升RIPA裂解液加入到整个培养皿表面,用移液器移液数次,冰上孵育30 min,在此过程中多次摇动培养皿以完全裂解细胞。将裂解的细胞液转移到 1 ml Eppendorf 管中,并在 4 °C 下以 13,000 rpm 离心 10 分钟。将得到的上清液在水中煮沸 10 min,置于 –20 °C 备用。使用 Pierce® BCA 蛋白质检测试剂盒(Thermo science)定量蛋白质浓度。
将含有 25 μg 总蛋白的细胞提取物直接进行 SDS-PAGE 并转移。膜用 5% 脱脂牛奶封闭,并用识别 P62 的一抗(Proteintech # 18420–1-AP)、TFEB(Proteintech # 13372–1-AP)、LC 3B(Abcam # ab192890) 和 β-肌动蛋白 (Proteintech # 20536-1-AP)。根据一抗的来源物种选择二抗,并通过增强化学发光(Pierce)或使用 Bio-Rad ChemiDoc XRS + 凝胶成像系统(Bio-Rad,美国)进行检测。 P62、TFEB 和 LC 3B 相对于 β-肌动蛋白的归一化条带强度在 BPSi 组中使用 ImageJ 软件通过光密度测定法进行量化,数据为平均值 ± 标准差。来自三个独立的实验。
通过 PDMPO 和 pHrodo™ Red Transferrin 共聚焦显微镜测量细胞 pH 值
PDMPO 研究
1 × 10 5 HepG-2 细胞在无菌共聚焦板上培养过夜,并以 100 μg/mL 的浓度加入 BPSi 纳米颗粒。次日,免疫荧光染色前,用0.01 M磷酸盐缓冲盐水(PBS),pH 7.4清洗玻片3次,然后加入1 μM PDMPO染料(Ex/Em =329/440)。 PBS洗涤3次后,用新鲜的RPMI-1640培养基孵育细胞,在荧光显微镜(Nikon A1R,日本)下用CCD相机观察并在5 min内拍照,蓝绿荧光强度比值然后根据 Chen 等人的程序计算溶酶体中的[19].
pHrodo™ 红转铁蛋白结合物研究
HepG-2细胞以同样的方式铺在共聚焦板中以进行细胞附着24 h,然后将板置于冰上10 min。用含有 20 mM 葡萄糖和 1% BSA 的冷活细胞成像溶液洗涤细胞。在活细胞成像溶液中以 25 μg/mL 添加 pHrodo™ Red Transferrin 缀合物(Ex/Em =560/585 nm),并在 37 °C 下孵育 20 分钟,然后在活细胞成像溶液中洗涤细胞。观察也通过共聚焦显微镜进行。 ImageJ软件对显微图像强度进行定量分析。
细胞溶酶体pH检测
细胞A549、HepG-2、HCT8、HCT15、HCT116和B16在75 cm 2 培养瓶中,当细胞增殖到培养瓶的 70% 时加入 NPs,6 h 后收集细胞。细胞被反复冷冻和解冻以完全释放细胞中的 MB。细胞裂解液以 12000 r/min 离心 10 min。获得上清液并测量其在 660 nm 处的吸光度以计算释放的 MB 总量。比较NPs6.0/100在标准pH下的吸光度,得到各细胞的pH值。
统计分析
采用SPSS15.0软件对独立组采用双向方差分析(ANOVA),采用Tukey HSD法进行多重比较检验。统计显着性基于 P 的值 <0.05.
结果与讨论
当用双 PEG 功能性黑色多孔二氧化硅纳米粒子 (BPSi NPs)(由我们的合作实验室提供 [12])喂养细胞时,我们首先检测到差异基因表达。 zeta 电位从 - 18.5 到 + 2.8 mV 的变化也表明表面双聚乙二醇化是成功的(图 S1a)。 BPSi 纳米颗粒的平均直径为 156 nm(图 S1b)。基于差异基因表达的聚类热图(图S2),我们选择了2倍以上的差异基因表达进行进一步研究。 Go和KEGG被引入来分析差异基因。从 Go 富集气泡图(图 1a)中,选择了代谢和溶酶体相关基因,包括吞噬溶酶体组装、吞噬作用和异生物质代谢过程,以进行进一步分析。值得注意的是,TFEB-CLEAR [17] 相关基因表达显着增加。 RT-PCR结果(图1b)也验证了基因测序结果,TFEB-协同溶酶体表达与调控(CLEAR)通路上的基因显着增加,如CTSD、CTSF、TFEB、MFN1、LAMP2和TPP1 .这些基因已被标记在溶酶体途径上,如图 S3 所示。它们的表达高于对照组,具有统计学意义(P BPSi VS 对照 <0.05)。并且TFEB正调控溶酶体基因的表达,控制溶酶体的数量,促进溶酶体底物的细胞降解。
<图片>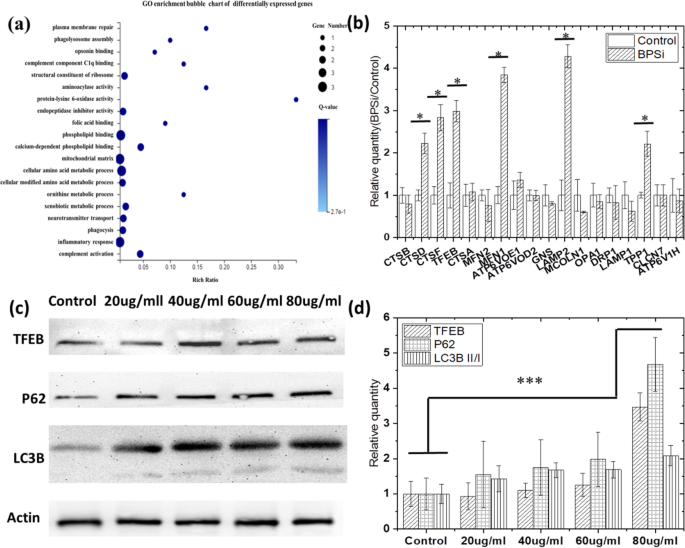
喂食 BPSi 后,HepG-2 细胞中的自噬被激活。 一 转录组测序发现的差异表达基因的GO富集气泡图。 b 通过 RT-qPCT 实验验证 BPSi 处理后 TFEB-CLEAR 基因网络中的基因变化。 c BPSi 处理后的 P62、TFEB、LC3B II/I 蛋白表达。 d 根据对照组,BPSi处理组中P62、TFEB、LC3B II/I蛋白的归一化条带灰度强度。数据表示为平均值 ± S.D.
此外,TFEB 调节自噬,由于TFEB 基因的主要功能是诱导溶酶体的生物合成并促进自噬的发生,其过表达导致培养细胞中自噬体的产生显着增加[20]。还采用蛋白质印迹分析来证明在用 BPSi NPs 喂养细胞时是否发生了自噬。 Western试验的目的是进一步证实BPSi喂养后TFEB的表达增加和细胞自噬的发生。 LC3B 和 P62 蛋白都是自噬标志物。当自噬发生时,微管相关蛋白 1A/1B-轻链 3B (LC3B) II/I 的表达增加。 p62是一种会被自噬降解的囊泡受体,也是一种泛素化蛋白聚集体被清除的受体,当发生自噬时它的表达会降低。所以我们在Western实验中测量了这些蛋白质的表达。
从图 1c、d 所示的蛋白质印迹结果来看,TFEB (P 80 μg/ml VS 对照 =0.000008),LC3B II/I (P 80 μg/ml VS 对照 =0.000297) 和 p62 (P 80 μg/ml VS 对照 =0.000016) 蛋白质均显着上调。由于 TFEB 和 LC3B II/I 蛋白的上调表明自噬的激活 [18],我们怀疑 BPSi 内吞促进了自噬的发生。然而,p62 蛋白应该在自噬过程中被下调,这是由于载体蛋白的性质将内体带到溶酶体并最终降解。在我们的研究中,p62 的显着上调表明内溶酶体融合过程中降解的终止 [21],这可能是由内溶酶体囊泡中的 pH 值增加引起的。因此,BPSi的内吞作用可能首先诱导自噬的发生,然后由于其酰胺碱性,通过增加内/溶酶体的pH值来抑制自噬过程。
为了通过 BPSi 内吞作用来证明内切/溶酶体的 pH 增加特性,我们的研究中使用了两种商业 pH 荧光探针,pHrodo™ Red Transferrin Conjugate(Thermo Fisher # P35376) 和 RatioWorks™ PDMPO。
pHrodo™ Red 作为商业细胞内 pH 指示剂通常在中性 pH 下呈现微弱的荧光,但随着 pH 下降而增加荧光。它应该在 9-4 范围内量化细胞溶质 pH 值,pKa 为 ~ 6.5,激发/发射为 560/585 nm。我们可以从 6 个细胞系测定中获得定性分析结论,即由于红色荧光信号减弱,BPSi NPs 的内吞作用具有增加内/溶酶体 pH 值的能力(图 S4 和 S5)。然而,在按照产品操作方案重复多次实验后,由于强度与所建立的 pH 值之间没有相关性,我们几乎无法定量分析在喂食 BPSi NPs 之前或之后不同细胞系之间下降的确切 pH 值。
然后采用 PDMPO 作为更好的解决方案来指示 BPSi 内吞后的 pH 值变化,这将比率成像技术引入 pH 定量测量。 PDMPO [2-(4-pyridyl)-5-((4-(2-二甲氨基乙基-氨基甲酰基) 甲氧基) 苯基) 唑] 被表征为嗜酸双激发和双发射 pH 探针。它在较低的 pH 值下发出强烈的绿色荧光,在较高的 pH 值下发出强烈的蓝色荧光。这种独特的 pH 依赖性荧光使 PDMPO 成为 pKa =4.47 的酸性细胞器的理想 pH 探针。 PDMPO 选择性地标记活细胞的酸性细胞器(如溶酶体),两个不同的发射峰可用于在比率测量中监测活细胞的 pH 值波动。然而,我们仍然未能测量 BPSi 喂食前后 6 个细胞系的 pH 值。如图 S6 所示的结果,在喂食 BPSi 之前和之后,所有 6 个细胞系都没有观察到显着差异。虽然蓝/绿比与 pH 值之间已经建立了相关性(图 S7),但 pH 4-5 的非线性相关性使得 PDMPO 方法无法对 BPSi 喂养前后的内切/溶酶体进行定量分析。
从上述两个商业 pH 指示剂的数据中,我们首先证明了我们的怀疑,由于酰胺的碱性,PEG 链上带有酰胺的 PEG 修饰的纳米粒子可以使内切/溶酶体的 pH 值增加。然而,如果没有精确的pH变化(0.1 pH范围)的定量分析,我们仍然无法建立自噬状态与内/溶酶体pH值之间的相关性,从而无法预测自噬。
根据我们之前对自分解纳米粒子的研究 [13, 14] [15, 22],我们在 75% 乙醇中保持相同浓度的氢氧化铵,但调整了 MB 和 TEOS 的浓度。两个系列的TEOS量被设置为100 μL和80 μL,以获得不同的壳厚度和孔径。设置了十个系列的MB用量以获得不同尺寸的中心空心结构和MB加载效果。
方案中添加的 MB 和 TEOS 量如下表 1 所述。
如图 2a、b 所示,在两种 TEOS 浓度(100 μL 和 80 μL)中,纳米颗粒尺寸都随着 MB 量的增加而增加。在相同的 MB 浓度下,粒径随着 TEOS 用量的增加而增大。此外,随着 TEOS 量的增加,壳厚度也增加,这已被元素映射证明(如图 2c 所示)。纳米颗粒的多分散指数(PDI)和表面电荷如图 S8 和表 S1 所示。 The morphology studies predicted that with the increase of MB amount, the loading efficiency will grow up, leading to the faster release profile, while with the increase of TEOS amount, the release will slow down. And we need to find out the appropriate MB and TEOS concentration, with which we could obtain the optimized nanoparticle systems, that we may be able to make the MB release profile linear correlated with the pH changes.

Morphology characterization of 10 different self-decomposable nanoparticles with specific MB or TEOS amount. 一 STEM figures. b Nanoparticle size distribution analysis. c Si mapping of 10 self-decomposable nanoparticles. Scale bars in all figures are 100 nm. The size distribution analysis was performed by randomly chosen 100 nanoparticles from STEM figures and measured by ImageJ software. Data was presented as mean ± S.D.
The MB loading efficiency was determined by UV-Vis spectrum. The standard curve (Fig. S9) of MB was firstly drawn using series concentrations of MB solution (from 6.25 to 46.88 μg/mL), with the equation as y = 67.63x + 0.10919, R 2 = 0.9987. As calculated with the equation above, we obtain MB loading efficiency of 10 self-decomposable nanoparticles with specific parameters, detailed data shown in Fig. S10.
Before the study of the MB release profiles in different pH solutions, the release profiles in pure water have been studied. As shown in Fig. S11 and Fig. S12, all the nanoparticles with TEOS amount of 80 μL presented increased MB release along with the duration increase, which was reflected by the UV–Vis absorption. Moreover, with the MB encapsulated amount increase, the growth trend of MB release becomes more significant. Also, the release velocity grows faster. However, as the TEOS amount increase to 100 μL, the particle surface became more densed and the release becomes slower when the MB amount below 3.0 mg; almost no increase trend could be observed in the MB release in water during 14 days of release. As long as the MB amount increases to above 4.0 mg, an obvious increase trend of MB release could be observed. One thing to be noticed is that the nanoparticle parameter of both NPs7.5/80 and NPs6.0/100 presented solid growth as the time prolongs, almost showed a linear increase trend during the first 7 days, and then reached the platform.
Then, we focused on the MB release behavior in different pH buffers to figure out whether self-decomposable nanoparticles with specific parameters could have the linear pH-dependent MB release.
Firstly, we carried out the MB release experiments at pH 4.0 buffer solution. From Fig. S13, we could easily reach the conclusion that with the same TEOS amount of 100 μL, the MB release velocity presented a similar trend was observed in the 5 nanoparticle systems of TEOS at 80 μL (Fig. S14), the center positive correlation with the MB encapsulated amount.
Concentrated MB diffuses into the surrounding solution via diffusion due to concentration difference. The bigger concentration gradient makes the faster MB release. Compared with the MB release in pure water, we found that the acidic environment speeded up the release of MB (Fig. S13 and S14 compared with Fig. S11 and S12), indicating that the MB release is not only driven by diffusion; however, in acidic solutions, electrostatic repulsion is also an important driven force due to the positive charge nature of MB. We then calculated the release percentage of each nanoparticle parameter according to the MB loading efficiency, MB standard curve, and the dilution ratio at measurements. The release percentage reflected the release speed of MB in pH 4.0 acidic solution, and the results (Fig. 3) showed that only the release percentage of NPs7.5/80 presented linear release in pH 4.0 solution. Other nanoparticle systems with specific MB and TEOS parameters showed similar release trends, and the release percentage did not have a linear growth. One exception is NPs6/100, and the MB release reached the platform in only 72 h; thus, it was hard to tell whether the MB release could grow linear before that duration at this stage.

MB release percentage of 10 series self-decomposable nanoparticles after a specific duration in pH 4.0 buffer. All experiments were triple repeated, and the data were shown as mean ± S.D.
Meanwhile, we tested the MB release profiles in near-neutral and alkali buffers (pH 6.86 and pH 9.18). The results in both Fig. S15, S16, Fig. S17, and S18 demonstrated that the MB release slowed down with the solution pH increase to 6.86; moreover, with the central MB concentration increased, the MB release percentage decreased. At pH 9.18, all nanoparticles with 10 specific parameters presented a very slow MB release (Fig. S19 and S20); no matter in UV–Vis absorption or the release percentage, the trend was similar with the one in pH 6.86 buffer, but with even lower release percentage. So, it was clear that the self-decomposable nanoparticles only presented MB release linear growth in acidic solutions. We thought back to the endo/lysosomes pH, from 4 to 5, which is exactly the pH range of MB linear growth as a function of time in a specific MB/TEOS parameter. Thus, we get more confident that the self-decomposable nanoparticle system may be an accurate measuring tool for quantitative determining the endo/lysosome average pH, then provide evidence on the exact pH value of autophagy status.
The precondition of using the specific self-decomposable nanoparticles as an endo/lysosome pH indicator is that the nanoparticles stay stable in the endo/lysosome during the whole measurement process. Secondly, the MB release in endo/lysosome should occur smoothly when the measurement carried out.
The colocalization of the nanoparticle in the endo/lysosomes by cell TEM study and the MB release in 6 different cell lines were studied. From the cell TEM results, all of the 10 series nanoparticles stayed in the endo/lysosomes without escaping, after 24-h incubation with the HepG-2 cells (Fig. 4). Since the diameter of HepG2 cells used in Fig. 4 is about 10–20 μm and the diameter of MB@SiO2 nanoparticles is between 75 and 200 nm, it will be very difficult to clarify the nanoparticle morphologies using the images with low magnification (as shown in Fig. S21). We also investigated the intracellular location of the nanoparticles in the other 5 cell lines, and 4 nanoparticles were randomly selected to demonstrate the nanoparticles were trapped in the endo/lysosomes (Fig. S22). The nanoparticles with all parameters showed a central hollow structure in all other 5 cell lines after 24-h incubation, indicating the MB release. Moreover, under more precise observation, we noticed the MB release may be different due to different hollow sizes, pointing to the fact that (1) the endo/lysosome pH in different cells is different and (2) the MB release from the nanoparticles is very sensitive to the endo/lysosomes pH, especially for the NPs6/100 and NPs7.5/80. From Fig. S23, we can find that nanoparticles have already realized the endocytosis and stayed in the vesicles 2 h after nanoparticle feeding, then nanoparticles gradually accumulated in lysosomes.

The colocalization of the nanoparticle in the endo/lysosomes by cell TEM study after 12 and 24 h incubation with the 10 series nanoparticles. The scale bar is 200 nm in the TEM images
We then evaluated the correlation between the pH values and the OD values in pH 4.0–4.8. From the results in Fig. 5 and Fig. S24, for NPs6/100 and NPs7.5/80 nanoparticle systems, the MB release presented a linear decrease as a function of pH in the pH range from 4.0 to 4.8.

MB release as a function of pH values in NPs6/100 and NPs7.5/80 after specific incubation duration, 6 h, 12 h, and 24 h. The linear correlation equations were also calculated for 6 h and 12 h for MB release from both NPs6/100 and NPs 7.5/80 as a function of pH values. All experiments were carried out triplicated, and the data were shown as mean ± S.D.
We then converted the OD value to the MB release percentage according to the MB loading efficiency and feeding amount. As shown in Fig. S25, in the first 6 h, the MB release percentage in NPs6/100 and NPs7.5/80 nanoparticle systems also presented as a function of pH values. We then calculated the residual sum of squares and Pearson’s related coefficient at 6 h and 12 h release duration, respectively, as the residual sum of squares present a negative correlation with closeness of linear fitting, while the closer the absolute value of Pearson’s related coefficient to 1, the more linear it is. As shown in Table S2 and S3, the highest degree of linearity is the fitting of NPs6.0/100 nanoparticle systems, followed by the one of NPs7.5/80 at 6 h release.
Till then, we were so excited by the results that the method for precisely monitoring the pH values has been established, especially with the accuracy less than or equal to 0.1 pH value interval. That means, we have great possibilities to figure out the correlation between endo/lysosome pH values and the autophagy status, which is of great significance for better studying the autophagy mechanism and predicting the autophagy process. As we can see in Fig. S26, the MB release in HepG-2 cells have already reached the plateau after incubation for 4 h. Thus, we chose 6 h as the observation time point.
We then carefully investigated the MB release of NPs6.0/100 in 6 cell lines in the nanoparticle cell interaction duration of 6 h, including liver cancer HepG-2 cell line, colon cancer HCT8, HCT 15, and HCT 116 cell lines, lung cancer A549 cell line, and myomelanocytic cancer B16 cell line.
As shown in Table 2, we clearly differentiate the endo/lysosomes in 6 cancer cell lines, with the accuracy at 0.01 pH values, which is impossible to be done with the commercial intraocular pH indicator kits.
Moreover, we re-evaluated pH values in endo/lysosomes of the HepG2 cells before and after cultured with BPSi nanoparticles. We reached the conclusion that BPSi uptake significantly increases the endo/lysosome pH values, from 4.70 ± 0.09 to 5.59 ± 0.05, perfectly illustrating the reason for BPsi uptaken induced the autophagy initially then terminated the autophagy flux. The intracellular uptake of BPSi makes the quantities of the endo/lysosomes increased, which was consistent with the results of gene sequencing, that autophagy-related genes (TFEB-CLEAR) were activated. Meanwhile, the autophagy termination by the increased pH values in endo/lysosomes also coincide with the results of p62 proteins upregulation in Western blot study.
讨论
Nanoparticles can generally cause autophagy in cells [23], and studies have shown that the autophagic response to nanoparticles presenting a neutral or anionic surface involves enhanced clearance of autophagic cargo. Cell exposure to nanoparticles presenting a cationic surface, on the other hand, results in transcriptional upregulation of the TFEB pathway, but also causes lysosomal dysfunction, ultimately resulting in blockage of autophagic flux [7]. And our results are in consistent with these previous conclusions. In our study, we found that the expression of autophagy-related genes and proteins in HepG2 cells has been increased after feeding of BPSi nanoparticles through transcriptome sequencing, RT-qPCR, and Western experiments. However, the expression level of autophagy-related P62 protein does not decrease as the autophagy is activated. We suspect that the PEG-amine on the surface of BPSi nanoparticles raises the pH value of the lysosome, resulting in inhibition of P62 degradation. Existing lysosomal pH indicators cannot verify our guess. To accurately measure the lysosomal pH of living cells, we established a new method for endo/lysosomes pH qualitative determination based on self-decomposable nanoparticle systems. Ten nanoparticle systems with specific MB/TEOS parameters were employed for obtaining optimized pH sensitively responsive measurement method. The radial MB concentration gradient from inner out served as a major driving force for MB release. The drug release proceeded with simultaneously carrier decomposition, which was driven by a diffusion-controlled mechanism. Moreover, as the pH value decreases, the hydrogen ion concentration increases, and the enhanced electrostatic interaction promotes inner MB to release faster than in neutral solution [24]. The optimized central hollow nanoparticle system could release the central concentrated MB as a linear function of precise pH values in the range of pH 4.0–4.8, which is exactly the pH of lysosomes. Finally, by this qualitative pH indicator based on self-decomposable nanoparticles, we have succeeded in the detection of the average pH values of lysosomes in 6 cell lines. Moreover, by this system, we can qualitatively differentiate the pH changes of lysosomes before and after BPSi nanoparticle endocytosis by HepG-2 cells, clarifying the mechanism of the autophagy occurrence and then termination after BPSi endocytosis. The self-decomposable nanoparticle systems pave a brand new way for studying the luminal pH values, providing new tools to know better of the cell signaling and metabolism, and then providing new ways and methods for the treatment of cancer [25, 26].
Conclusion
In this study, we found that BPSi can promote cell autophagy through transcriptome sequencing, but the amino groups on the surface of the nanoparticles can increase the pH of the lysosome and inhibit the degradation of autophagic flow. Thus, the lysosome pH significantly influences the autophagy stages. And precisely acquiring the information of lysosome pH will promote the perceiving of autophagy. However, the existing fluorescent lysosomal pH indicators could only determine a wide range of lysosomal pH; thus, we established a precise lysosomal pH indicator based on the self-dissociation system. By adjusting the synthesis parameters of MB@SiO2, the release of MB loaded on the nanoparticles was linearly and negatively correlated with pH. And the nanoparticles mainly stay in the lysosome after entering the cell. By measuring the amount of MB released in the cells, the pH value of the lysosome can be calculated exactly according to the linear function. The established precise pH indicator provided a brand new tool and methodology to precisely study the lysosome pH values and further acquire more information on autophagy.
数据和材料的可用性
本研究期间生成或分析的所有数据均包含在这篇已发表的文章及其补充信息文件中。
缩写
- BPSi:
-
Black mesoporous silicon
- FBS:
-
胎牛血清
- 开始:
-
Gene ontology
- HCl:
-
盐酸
- KEGG:
-
Kyoto Encyclopedia of Genes and Genomes
- MB:
-
Methylene blue
- NaBr:
-
Sodium bromide
- NaSi:
-
Sodium silicide
- NH4Br:
-
Ammonium bromide
- NP:
-
纳米粒子
- OD:
-
光密度
- PBS:
-
磷酸盐缓冲盐水
- PDMPO:
-
2-(4-Pyridyl)-5-((4-(2-dimethylaminoethy- laminocarbamoyl) methoxy) phenyl) oxazole
- RT-qPCR:
-
逆转录定量聚合酶链反应
- TEOS:
-
原硅酸四乙酯
纳米材料
- SaaS 应用程序监控:看到森林和树木
- 玻璃纤维织物的开发与应用
- 负载 ICA 的 mPEG-ICA 纳米颗粒的制备及其在治疗 LPS 诱导的 H9c2 细胞损伤中的应用
- 超窄带完美吸收体及其在可见光区域中作为等离子体传感器的应用
- 二氧化钛纳米颗粒对小鼠的潜在肝脏、大脑和胚胎毒性
- 基于苯基三甲氧基硅烷改性氧化铝纳米颗粒的 Al2O3:SiOC 纳米复合材料的形成和发光特性
- Au@TiO2 蛋黄-壳纳米结构的制备及其在亚甲基蓝降解和检测中的应用
- 铜纳米粒子合成和稳定方面的环保能力:催化、抗菌、细胞毒性和抗氧化活性
- 关于双层/三层宽带 SiO2 抗反射膜横截面形貌的 TEM 和 STEM 研究
- 桔梗皂苷(桔梗)用于金和银纳米颗粒的绿色合成
- 金属和金属氧化物纳米粒子的绿色合成及其对单细胞藻类莱茵衣藻的影响
- 电容器薄膜:特性、结构和应用