

用于高级双电光传感应用的电活性染料/LDHs 纳米血小板基质膜的逐层组装
摘要
证明毒性最强的Al 3+ 离子对人类神经系统和与该系统有关的疾病,例如阿尔茨海默氏症。在基于传感器的Al 3+ 检测方法中,固态电极的发展仍处于起步阶段 .因此,在本研究中,设计并构建了一种新型柔性 ITO/PET 电化学固态传感器。通过逐层 (LbL) 组装 Mg-Al LDH 来完成电极床层表面的改性。纳米血小板与茜素红 S (ARS) 在相互连接的基质膜中。在电极传感基的分子设计中,存在于ITO/PET层状(ARS/LDHs)n基体中的电活性有机单元(ARS分子)暴露于目标分子(Al 3+ 离子),所以新形成的铝螯合系统的电化学变化是可检测的。这种类型的传感器用于灵敏和选择性地检测Al 3+ .在 LbL 组装技术的第五次循环中获得了改性基质膜的最小薄层电阻、形貌和高电催化活性。在该电化学传感器中,电化学和光学方法均以高灵敏度和选择性检测Al 3+ ,因此在循环伏安电化学方法中,与基于荧光的光学方法相比,检测下限为 10.1 nM,线性范围为 [0.2–120 μM]。
介绍
层状双氢氧化物 (LDH) 是一般类型的阴离子粘土的二维化合物,广泛用于光学、生物和电子应用 [1,2,3,4]。 LDHs的化学结构式为[M II 1-x M III x (OH)2] − (A n− )x /n。 mH2O (M II 和 M III 分别是二价和三价金属,A n− 是层间阴离子)[1]。由于 LDHs 的二维结构、柔韧性和离子交换,借助新的逐层 (LbL) 组装方法,将这种组合与合适的有机分子以规则的层状排列相互结合并形成广泛用于各个科学领域的有机/无机化合物 [5,6,7]。在这种排列中作为客体分子的这些物种之一是电活性分子,这导致加速参与电化学反应的物种与初始电极层之间的直接电子转移过程 [8, 9]。 LDH 纳米片的使用及其表面结构改造已广泛用于电子和光电器件的开发 [10]。该领域的一些基本研究如下:Chen 及其同事 [11] 使用一种新的直接方法,使用超薄多孔纳米片单阶段 Ni-Co LDHs 混合膜生长,可以显着增加比电容基于这种混合膜的电极,与其他基于 Ni-Co 氧化物/氢氧化物的类似电极相比,其性能得到了极大的增强。李等人。 [12] 成功地将两种不同摩尔比的阴离子嵌入到 Mg-Al LDHs 网络中,从而获得蓝色发光杂化材料。田等人。 [13] 在二维 LDHs 网格内局部化金纳米团簇 (Au NCs),逐层组装以改善荧光和制造基于 Au NCs 的薄膜的有效方法。分层组装组织被认为是制造具有高荧光效率的荧光传感器的主要新方法。因此,利用先进材料对电化学装置中电极基的分子和结构进行精确的分子和结构设计,并在设计的网络内进行高度优雅的电化学和光学变化的错误检测和显示,可以显着提高设备的效率和灵敏度。
由于光电器件的关键部件,透明电极最近引起了更多关注。最近,柔性和可拉伸电子和光电子技术设备快速增长,特别是促进了可穿戴电子和高度便携功能的发展 [14] 柔性电子的研究正在迅速扩大。它已经在超级电容器、植入传感器、柔性压电传感器、电子纸、太阳能电池、触摸板、无线可穿戴设备、柔性显示器、生物集成治疗设备和表皮电子设备中展示了应用。氧化铟锡 (ITO) 显示出优异的光电特性。它是目前使用最广泛的透明电极 [15,16,17] 此外,到目前为止,ITO 涂层的聚对苯二甲酸乙二醇酯 (PET) 基材 (ITO/PET) 已被应用于众多应用中,因为它们结合了良好的柔韧性和高电电导率[18].
最近,我们报道了一种基于 LDH 的电化学传感器,具有用于多巴胺和 Fe(III) 检测的双重放大策略。在逐层 (LbL) 组装过程中,合成的电活性萘酰亚胺染料/LDH 纳米血小板基质 (NALD-n) 显示在 GO/ITO/PET 表面电极上的连续层中。这种结构设计导致传感器床层中电活性染料的荧光发射显着增加[19]。
纳米传感器等高灵敏度电子结构中的分子工程领域是本研究工作设计的过程的基础。
茜素红 S 的化学名称为 1,2-二羟基-9,10-蒽醌,具有扁平的杂环结构,已广泛用于涉及有毒污染物的生物科学、光化学和环境研究 [20, 21]。 ARS因其高荧光强度而被广泛用作检测金属离子和生物分子的传感器[22, 23]。
铝 3+ 离子是一种重且有毒的金属离子,在各行各业中有着广泛的应用。多项研究调查了铝离子对人类健康的毒性和破坏性影响。对人类神经系统最具破坏性的影响,如阿尔茨海默氏症的报道[24]。通常使用几种精确的实验室方法来确定生物和环境样品中铝离子的含量。其中一些常用的方法包括电感耦合等离子体原子发射光谱 (ICP-AES) [25, 26]、电感耦合等离子体原子发射光谱 (ICP-MS) [27]、石墨炉原子吸收光谱 (GF-AAS) [28]、高分辨率连续源火焰原子吸收光谱仪(HR-CS)[29]、火焰原子吸收光谱仪(FAAS)[30]。这些方法是标准的和功能性的,但存在严重的基质干扰以及准确性不足的严重缺点。不同的铝离子测定方法列于表1。可以看出,其检出限在mg/l或μg/L范围内。有些方法需要很长时间进行样品制备和分析。
在大多数情况下,对于痕量分析,需要对特定吸附剂进行预浓缩步骤。一些荧光光谱方法显示出高灵敏度和低检测限,但响应时间长 [31,32,33,34,35,36,37]。尽管他们的检测系统很简单,但在灵敏度和选择性上却显示出弱点。结合光学和电化学方法的传感器将提供比其他方法更好的优势。光电化学传感器结构紧凑,小型化,易于集成到低成本且易于使用中,具有实时环境监测所需的出色选择性和灵敏度。固态传感平台在传感器制造中必不可少。当化学试剂固定在固体基质中或固体基质上时,其在固定介质中的稳定性提高,从而避免了不良的干扰和污染敏感性。
在较新的研究中,引入了电化学传感器的使用,以更精确地检测 Al 3+ 离子 [38]。由三维无机或二维有机/无机刚性网络组成的传感器具有更高的离子吸附界面面积,因此传感器具有更高的电催化反应性,这将导致电化学传感器具有更高的灵敏度和选择性。 39]。据我们所知,这里提出的 ITO/PET 层状 (ARS/LDHs)n 矩阵是第一个用于铝监测的光电平台。
在这项研究工作中,一种用于检测 Al 3+ 的新型电化学固态传感器 离子准确。这种电化学传感器的基础是通过电化学和光学方法同时测量信号。在这种类型的传感器中,存在于氧化铟锡涂层 PET (ITO/PET) LbL 组装 (ARS/LDHs)n 基质中的电活性有机单元 (ARS 分子) 在暴露于目标分子 (Al 3+ 离子),所以新形成的铝螯合系统的电化学变化是可检测的。电化学变化、传感器释放的光的数量和质量也通过与目标分子的接触来评估。
材料和方法
材料
ITO/PET 片材 (60 Ω cm −1 ), 茜素红 S (3,4-dihydroxy-9,10-dioxo-2-anthracensulphonic acid, 钠盐), 硝酸铝 (III) (Al(NO3)3), 硝酸钴 (II) (Co(NO3) 2)、硝酸Ni(II)(Ni(NO3)2、Ca(II)硝酸(Ca(NO3)2)、Sr(II)硝酸(Sr(NO3)2)、Cu(II)硝酸(Cu(NO3) )2),醋酸盐/碳酸钠缓冲液和氯化钾 (KCl) 购自 Sigma Aldrich Co.
设备
使用 Fluke Ohmmeter (1550B) 测量改良电极的薄层电阻。使用单光束紫外-可见分光光度计 (CECIL CE9200) 从 200 到 800 nm 进行吸收测量。分别使用 (LEO 1455VP) 和 (Micro Photonics Inc/Dual scope DS95-200E) 仪器对制备的样品进行扫描电子显微镜 (SEM) 和原子力显微镜 (AFM) 测试。荧光光谱仪(PerkinElmer LS55)用于测量测试样品的荧光强度。在三电极电化学电池中使用(Zahner PP211 恒电位仪)对电极进行循环伏安法 (CV) 测量。本试验中,制备电极的表面作为工作电极,铂作为对电极,Ag/AgCl作为参比电极。在所有测试中都使用 KCl 溶液(0.1 摩尔的去离子水)作为标准电解质。在所有 CV 测试中,电位扫描步长为 0.005 V,电位扫描速度为 0.05 Vs -1 .本研究工作中呈现的每个循环伏安图都是每个实验获得的最具代表性的循环。
A.R.S./LDHs 薄膜改性电极的制作
Mg-Al LDHs(包括硝酸根阴离子)是通过红十字国际委员会研究组[40]开发的方法合成的。 Mg-Al L.D.H.s 纳米片在去离子水中的胶体悬浮液 (1.0 g L −1 ) 是在超声波浴 (Bandelin electronic/510 h) 中在 40 °C 下超声处理 4 h 制备的。为了研究在通过不同(醋酸盐/碳酸盐)缓冲液调节的 pH 值范围内,电极表面上 LDH 纳米血小板和 ARS 染料分子吸附的 pH 值影响,将 ITO/PET 电极浸入 LDH 悬浮液中(在不同的调节 pH 值从 3.5 到 11.5 不等)持续 10 分钟。然后取出电极并用蒸馏水冲洗。然后将它们浸入蒸馏水中的 ARS 溶液(1.0 g L −1 ) 具有恒定的中性 pH (=7.0)。将电极浸入 ARS 溶液后,将它们冲洗并用氮气流干燥 2 分钟。在 25°C。这个 LbL 过程重复了五次。在第 5 次 LbL 循环后,从电极表面进行 UV-Vis 分光光度法测试(图 1a)。在选择了 LDH 分散的最佳 pH 值后,进行了相同的测试。这一次,在一个阶段中,将电极浸入 LDH 胶体悬浮液(具有最佳 pH 值)中 10 分钟。漂洗和干燥后,将它们浸入不同pH值的ARS溶液中(其他条件相同)。 ARS 溶液的 pH 值在 pH 3.0 和 pH 7.0 之间变化。然后从电极表面进行 UV-Vis 分光光度法测试(图 1b)。随后,对 LDHs 悬浮液(具有最佳 pH 值)和 ARS 溶液(具有最佳 pH 值)的一系列这些操作重复 n 次以获得 (ARS/LDHs)n 的多层膜(图 1c)。 LbL浸入试验流程如方案1所示。制备的电极特性及其代码见表2。
<图片>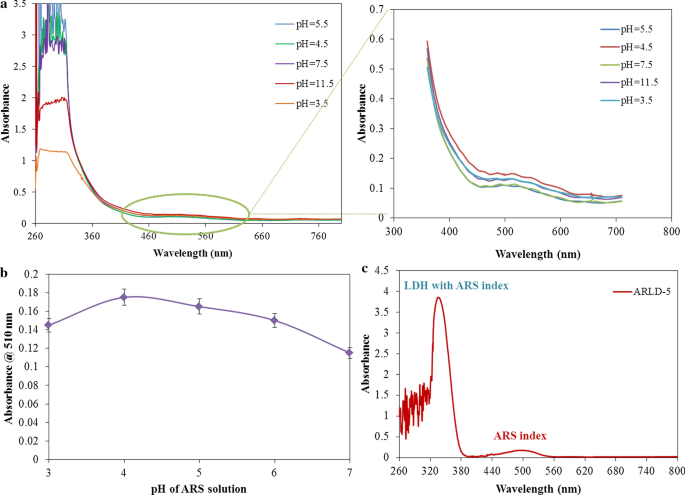
ARLD-n对pH值的吸光度变化a LDH 胶体悬浮液(1.0 克 L −1 ) 在不同调节 pH 值的去离子水中(在 LbL 循环中 ARS 溶液的 pH 值固定为 7),b ARS 溶液(1.0 克 L −1 ) 在不同调节 pH 值的去离子水中(在 LbL 循环中 LDH 悬浮液的 pH 值固定为 5.5),c ARLD-5的吸光度变化(LDH悬浮液的pH值固定在5.5,ARS溶液的pH值通过LbL循环固定在4.0)
<图片>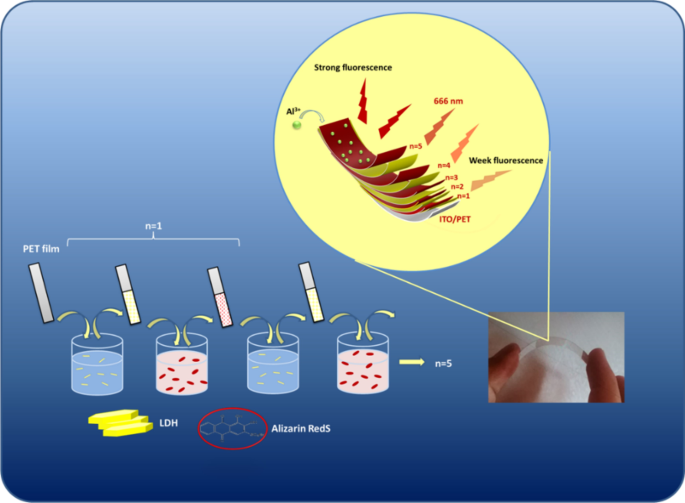
LDH 悬浮液的 LbL 组装示意图(1.0 g L −1 ) 和 ARS 溶液 (1.0 g L −1 )实现修饰电极ARLD-5
结果与讨论
研究了pH对LDH纳米血小板吸附行为的影响,以获得在固态电极上的最佳ARS吸附。为此使用了紫外-可见分光光度法。 [260-360] 和 [400-600] 区域的 LDH 和 ARS 分别显示指数吸收峰 [24]。 LDH胶体悬浮液和ARS溶液的pH优化结果见图1。
结果表明,分别在 pH 3.5 和 pH 5.5 下观察到 LDH 纳米血小板对 ARS 分子的最小和最大吸附。由于LDH晶体网络中的异构置换现象(取代Mg 2+ 而不是 Al 3+) 并且电荷水平取决于LDH表面质子化/去质子化引起的pH值,LDHs的金属离子(在LDH的基面)在非常酸性的条件下(pH <4)溶解,LDH的结构发生变化.在其他 pH 值下未观察到 LDH 的溶解 [41,42,43]。零电荷点 (PZC) 是指在恒定温度、压力和介质下,相反电荷为零时的 pH 值。研究表明 PZC 已存在于 LDH [44]。 LDH 表面吸附质子电荷可以改变介质的 pH 值。然而,LDHs 表面的电荷会随着系统 pH 值的变化而变化。此外,由于静电结合在不同 pH 条件下的影响,LDH 纳米片(基底和棱柱表面)的排列对染料分子的吸附具有不同的倾向。结果表明,在强酸性条件下(pH <4),由于金属离子溶解在LDHs的基底表面,吸附在固体电极表面的稳定且不可溶解的LDH纳米粒子的数量将很少。
另一方面,通过转向完全碱性条件,由于 LDH 的去质子化,较少量的 ARS 分子被吸附在 LDH 的表面。因此,用于 LbL 浸渍试验的 LDH 胶体悬浮液的最佳 pH 值被认为是 5.5。根据图 2b,ARS 在含有 LDH 纳米血小板的电极表面上的最高吸附在 pH 4.0 时表示。与 Al 3+ 形成络合物似乎形成了不适当的介体 LDHs 表面的离子。由于显着酸性条件(pH 4.0),中间体化合物(Scheme 2中的化合物II)的结构形式更稳定,在更稳定的条件下,可以与Al 3+ 形成螯合物 LDHs 网络中的离子。就中性 pH 而言,ARS 在 LDH 表面的相对吸附减少。 Sathish [45] 和 Supian 等人。 [24] 还报道了 ARS 试剂与 Al 3+ 离子在 pH 4.0 的醋酸盐缓冲液中。因此,用于 LbL 浸泡试验的 ARS 溶液的最佳 pH 值被认为是 4.0。 ARLD-5修饰电极的吸光度行为如图1c所示,而在所有五个LbL循环期间,对LDH悬浮液(pH 5.5)和ARS溶液(pH 4.5)进行了最佳pH调节。
<图片>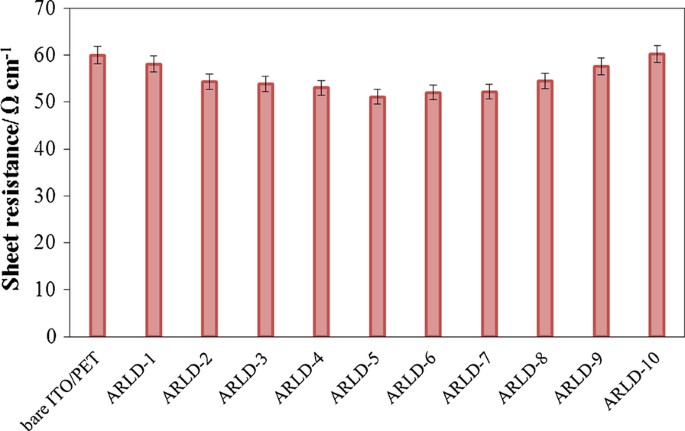
(ARS/LDHs)n分层的ITO/PET电极样品的薄层电阻变化
<图片>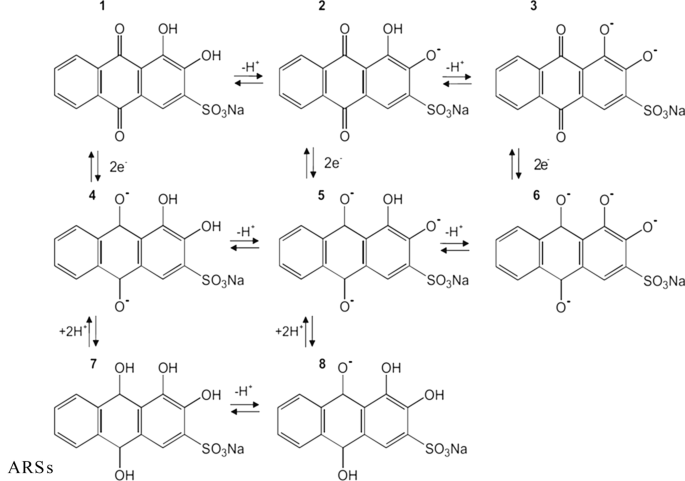
ARS的平衡结构取决于pH值和互变异构结构
关于 Mg-Al LDHs 纳米片对电极表面电导率的影响,浸入循环次数 (n ) 应确定。为此,在不同的浸入循环中研究了电极薄层电阻的变化。图2显示了由(ARS/LDHs)n分层的ITO/PET电极样品的薄层电阻结果。
从图 2 的结果可以看出,电极的薄层电阻到第 5 个循环后略有下降,第 5 个循环后,薄层电阻的增加是由于 LDHs 纳米片密度的过度增加和电子长度的增加转移途径。需要注意的是,电极表面上 LDHs 纳米片的 LbL 组装会导致离子交换功能和强大的电子转移。因此,选择第五个循环作为最佳循环,使这些条件下的修饰电极具有最小的电阻和最高的电导率。总的来说,本次测试结果表明,LDHs纳米血小板与ARS染料分子的LbL组装方法直到第10次循环才对电极的电阻和电导率产生显着影响。
在无花果。图3和图4分别给出了样品的SEM图像和形貌AFM结果。
<图片>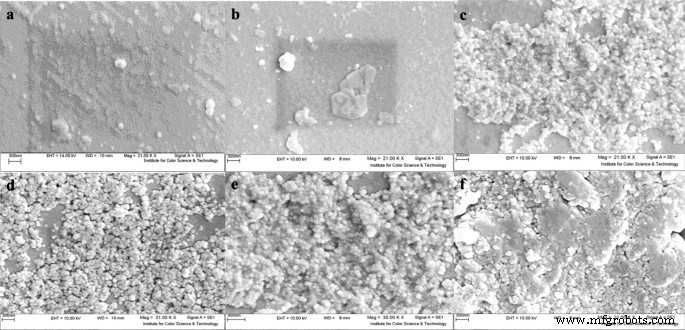
从制备的固态电极 (a :ITO/PET, b :ARLD-1, c :ARLD-2, d :ARLD-3, e :ARLD-4, f :ARLD-5)
<图片>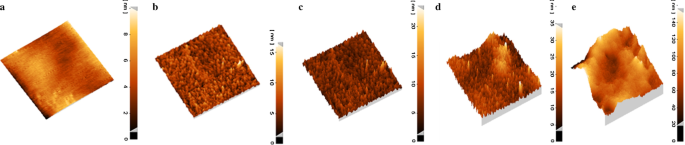
从制备的固态电极 (a :ARLD-1, b :ARLD-2, c :ARLD-3, d :ARLD-4, e :ARLD-5)
作为制备电极的形态和形貌扫描结果的说明,随着 LbL 循环次数的增加 (n ),在电极表面观察到沿 ARS 的 LDH 层密度不断增加。从第一个循环到第五个循环,表面粗糙度增加(AFM图像),LDH纳米片的厚度随着吸附的ARS不断增加。
为了研究 ARS 分子在 LDHs 纳米片上的吸附,使用荧光分光光度法测试研究了吸附层的光学行为。在每个 LbL 浸入循环后,从固体电极表面进行荧光分光光度计测试。所制备电极的荧光光谱测试结果见图5。
<图片>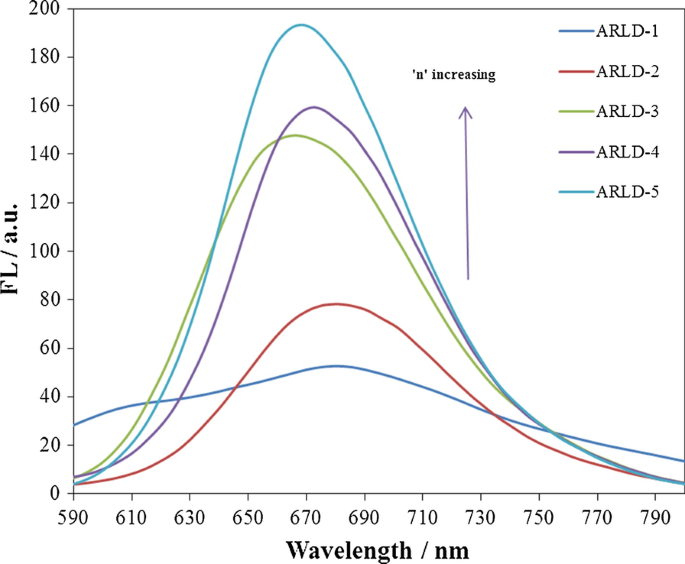
不同制备电极的荧光强度变化(λ 除外=388 nm)
结果表明,在第一次 LbL 浸渍循环后,由于 ARS 分子以及吸附在电极表面上的 LDHs 纳米片较少,荧光发射量很少,弱荧光发射的峰值约为 666 nm。通过增加 LbL 浸入循环的次数 (n ),通过增加 ARS 层的密度以及固体电极表面上的 LDHs 纳米片,荧光发射率不断增加。在第五个循环中,在 668 nm 处观察到最高的荧光发射峰。由于 ARS 溶液在低浓度 (10 –4 M),由于固相中染料分子的分子旋转比溶剂相中的染料分子少,并且固相中的溶剂效应降低,因此当封闭在固体电极基板上的 Mg-Al LDHs 之间时,该化合物的荧光发射强度有所提高 [46 ]。随着层数的增加,信使的形状会变得尖锐,峰宽会变低,这证实了这一点。聚集体形式或组装成晶格的分子的荧光发射得到增强,非辐射能量转移和分子旋转减少的影响显着减少或消除。然而,固体表面的高度聚集导致了显着的自淬火。为了减少发色团之间的分子间相互作用,增加堆叠结构之间的间隔以减少芳香核之间的π重叠,导致荧光猝灭和强发射减少[47]。
它发现 ARS 具有三种平衡结构,具体取决于溶液的 pH 值,如方案 2 所示 [48, 49]。在 pH> 12.1 时,第二次去质子化导致蓝紫色二价阴离子 (III)。氧化型 ARS 1 和还原型 ARS 7 作为实验条件的函数存在。从 pH 4 以下可以看出 ARS 1 代表主要种类,ARS 2 在 pH 5.5-10.5 范围内占优势,ARS 3 将是 pH 12 以上的相关种类。ARS 的离子形式具有互变异构结构。 Scheme 2显示了每个物种的还原形式和互变异构现象。
已知茜素 (I) 和 ARS 与 Al 3+ 形成稳定的复合物 ,被称为“色淀颜料”。 V. 雅Fain 及其同事根据茜素和茜素红的电子吸收光谱对金属配合物进行了深入研究 [50]。他们得出结论,二羟基蒽醌的络合总是在周围或邻羟基羰基上进行,并且涉及互变异构的蒽醌形式。茜素络合通过形成 C=O M-O 配位键和六元螯合环以单阴离子形式 ARS,化合物 II(方案 3)发生在周围羟基羰基上。作者认为,在碱性溶液中,茜素与金属离子作为邻二酚化合物反应,得到结构 III。中性介质中的络合可以通过金属离子取代络合物 I 螯合循环中的氢原子,随后 M-O 键的电离来解释。因此,1位茜素单阴离子的离子化羟基通过分子内氢键键合。此外,为了形成 II,该复合物可以有另外三种互变异构形式(IV-VI)。
<图片>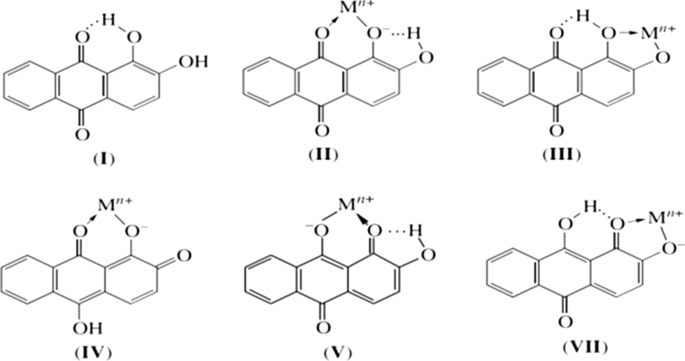
ARS-Al复合物的互变异构形式
在酸性介质中,O-M 键保持共价,单金属茜素的电子吸收光谱与非离子化茜素的光谱相同。在弱碱性介质中,茜素以单阴离子形式与金属离子发生络合反应。在所有单阴离子结构中,只有 9-羟基-2-氧代-1,10-蒽醌含有相邻的羰基和氧代基团。因此,在碱性介质中形成的单金属茜素化合物应具有五元螯合循环的1,10-蒽醌结构Ⅶ。
从方案 2 中可以看出,ARS 具有可逆的氧化还原行为。它的金属配合物也具有电活性,具有不同的氧化还原特性,使其成为基于电化学分析的合适应用。其络合速度比一些常见的金属离子络合剂快。 ARS 和 ARS-Al 显示出不同的氧化还原峰电位。因此,在将铝离子添加到游离 ARS 期间,与 ARS-Al 氧化还原相关的不同电位中的新峰 (ARS-Al) 与铝离子浓度成正比增长。引入了不同的稳定平台,以提高基于 ARS 的传感器的灵敏度和适用性。 ARS及其配合物在固态下均具有电活性。
通过循环伏安法测试制备的电极的电化学行为。所制备电极的循环伏安结果如图6所示。
<图片>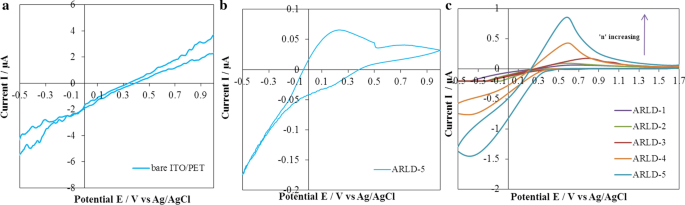
a的循环伏安图 裸 ITO/PET 在 0.1 M KCl 去离子水中,b ARLD-5 电极在 0.1 M KCl 去离子水中,c 在(去离子水中的 0.1 M KCl)中制备电极,包括 15 μM Al 3+
根据图 6a 的结果,裸 ITO/PET 电极的形状是具有低电流和浅宽度的噪声图,表明电极的电催化活性较弱。随着(ARS/LDHs)n LbL组件对电极表面的修饰,CV图的形状趋向于更宽和对称的循环,因此随着浸入循环次数的增加,流动间隔增加,信使表面变得更多膨胀,在第五个循环中具有最高的峰值流速和最宽的图 (n =5)。如图 6b 的结果所示,对于 0.1 M KCl 中的 ARLD-5 电极,当不存在铝离子时,通过 CV 测试的结果观察到有点“可逆”的峰。在该峰中,由于改性电极表面上游离 ARS 的氧化/还原,出现了大约 0.25 V(相对于 Ag/AgCl)的阳极和阴极电流。在铝离子存在的情况下(图 6c),在大约 0.58 V(相对于 Ag/AgCl)处可检测到伪可逆峰爆发,这与修饰电极表面上茜素-铝复合物的氧化峰有关,因此在 ARLD-5 中,可以清晰地检测到氧化峰。伏安图结果表明,随着 LbL 浸入层数量的增加,修饰电极的电催化活性在电子转移到电极外表面方面有所提高。此外,在电极表面还原(ARS-Al)配合物(Scheme 3)的以下反应也得到了改善,ARLD-5电极的电催化活性最好[24]。
关于 pH 值对染料结构模型和 (ARS-Al) 复合物形成的重要性,所有 CV 实验均在中性 pH 值(=7.0)(去离子水中 0.1 M KCl)下进行,所有电化学仅通过改变Al 3+ 的浓度即可控制和检测电极表面的光学变化 离子。
Al的电化学检测 3+
添加不同浓度Al 3+ 后循环伏安图的变化 如图 7 所示。所有结果都是在电解液中加入铝离子 10 s 后得到的。
<图片>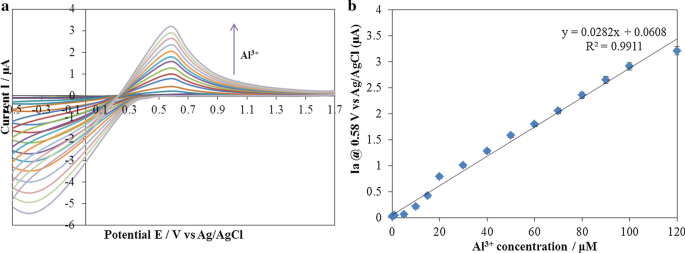
一 加入不同浓度Al 3+ 后ARLD-5电极的循环伏安图 [Al 3+ 浓度范围 0.2–120 μM],b ARLD-5电极在不同Al 3+ 浓度下的峰值电流变化
根据图 7 的结果,通过增加 Al 3+ 离子,氧化峰电流的强度在峰值电位(E pa) 为 0.58 V(相对于 Ag/AgCl),过程受控并持续进行。表明形成了 ARS-Al 3+ ARLD-5 电极表面的复合物,氧化电位约为 0.58 V(相对于 Ag/AgCl)。 Due to the high strength of formation of the complex between A.R.S.和Al 3+ , the oxidation peak of the complex formation is pseudo-reversible [51]. The results obtained in this study are close to the results of other studies as the linear sweep scan shows the large peak at 0.27 V corresponds to oxidation of free alizarin while oxidation of Al complexed alizarin gives the peak at 0.58 V in different scan rates [52]. Figure 7b shows the electrocatalytic behaviour of the ARLD-5 electrode for the detection of Al 3+ 离子。 The anodic peak current changes enhance linearly along with the increase in Al 3+ 专注。 The linear response ranges in [0.2–120 μM] with a regression equation of i pa (μA) = 0.0282C (10 −6 M) + 0.0608, r 2 = 0.991, and a detection limit of 10.1 nM for Al 3+ was obtained.
Furthermore, Co 2+ , Ni 2+ , Ca 2+ , Sr 2+ 和 Cu 2+ as interfering ions were investigated under the same conditions (ARLD-5 as working electrode, concentrations of 120 μM of interfering ions in 0.1 M KCl solution for testing CV). The cyclic voltammograms of ARLD-5 electrode after adding interfering ions are shown in Fig. 8.

The cyclic voltammograms of ARLD-5 electrode after adding interfering ions
Figure 8 demonstrates the good selectivity to Al 3+ for the modified electrode. pH was changed by acetate/sodium carbonate buffers, 0.1 M KCl (including 15 μM Al 3+ ion) from 2.0 to 12.0. The results of the cyclic voltammograms are shown in Fig. 9.

Anodic current changes at 0.58 V versus Ag/AgCl of ARLD-5 electrode to pH of 0.1 M KCl in deionized water (including 15 μM Al 3+ ion)
As shown in Fig. 9, in the pH range 5.0–7.5, there is little difference in the shape of the graph and the oxidation peak current. However, in more acidic conditions (pH range 5–6.5), due to the presence of higher hydrogen ion in the electrolyte, the probability of the formation of the compound II (in Scheme 4) on the surface of the solid electrode increases to form the chelate with the aluminium ion, and therefore, the oxidation peak current of the ARS-Al complex increases [38]. The application of this sensor is not recommended for pH less than 5.0 (severe acidic conditions) and more than 8.0 (severe alkaline conditions) due to the structural changes in adsorbed LDHs nanoplatelets on the electrode surface.

Mechanism of ARS complex reduction on the electrode surface
Optical Detection of Al 3+
Alizarin red S (ARS) has been used as a chromogenic agent for developing spectrophotometric methods. Anthraquinone-metal complexes show strong fluorescence. The fluorescence of metal–ARS complexes is affected by cation's field energy [53]. Therefore, the maximum excitation fluorescence wavelength pair of the Al-ARS complex is significantly different from other metal ions, which are interferents in spectrophotometric methods for Al determination. The principle of spectrofluorimetric determination of aluminium is based on its intensity enhancement which growing up during addition of aluminium ion to free ARS. Herein ARS was adsorbed on a solid platform of LDH, making it more rigid and improved its intensity resulted in more sensitivity.
Prepared electrodes were considered as the working electrode in the three-electrode electrochemical cell. The electrolyte used was a KCl solution (0.1 M) in distilled water. Different concentrations of aluminium ion were added to the electrolyte. After each CV test and completion of this test, the spectrofluorimetry test was regularly performed on the electrode surface. The results of spectrofluorimetry test are shown in Fig. 10.

一 , b The changes of fluorescence intensity (λ 除外= 388 nm) of ARLD-5 electrode after adding different concentrations of Al 3+ [Al 3+ concentration range 0.2–120 μM], c the fluorescence intensity changes in terms of Al 3+ concentration inverse
The modified ITO/PET electrode with (ARS/LDHs)5 matrix shows an intense fluorescence emission spectrum in the presence of Al 3+ 离子。 Figure 10 shows the gradual fluorescence increase in ARLD-5 after the addition of Al 3+ (concentration range from 0.2 to 120 μM) and indicates the formation of a static adduct between A.R.S.和Al 3+ . It was found that the ARLD-5 fluorescence intensity increased within 10 s after addition of Al 3+ . So, the fluorescence increasing of ARLD-5 was relatively independent of the incubation time. From the results above, the ARLD-5 has a sensitivity and high-efficiency fluorescence emission to Al 3+ ion.
To calculate the detection limit and calibration curve in an optical sensor, first, we obtain the ratio of the fluorescence intensity differences, draw then the graph of this ratio in terms of the target concentration inverse.根据方程。 (1) [54], the slope of the fitted line was used to determine the detection limit. The obtained results are shown in Fig. 10c.
$$(F_{\max } - F_{0} )/(F_{{\text{c}}} - F_{0} ) =1 + ({\text{KC}})^{ - 1}.$$ (1)As the results of Fig. 10b shows, the fluorescence intensity changes enhance along with the increase in Al 3+ concentration with the linear response ranges of [0.2–120 μM]. Plotting fluorescence intensity versus inverse of the concentration, the regression equation of Y = 0.6994X + 0.5445, r 2 = 0.986, and a detection limit of 23 nM for Al 3+ was obtained.
In order to determine the selectivity of the sensor to the Al 3+ , a concentration of 120 μM interfering ions (Co 2+ , Ni 2+ , Ca 2+ , Sr 2+ , 铜 2+ ) were prepared. The spectrofluorimetry test was carried out from the electrode surface after adding the interfering ions to the electrolyte. As shown in the results of Fig. 11, it is clear that the addition of interfering ions did not show a significant difference in the fluorescence emission of the electrode surface, and the most significant difference was observed in the emission of fluorescence for Al 3+ , indicates the high selectivity of this type of sensor for Al 3+ . In order to better determine the selectivity of the modified electrode to Al 3+ , six solutions of 10 –4 M concentrations of ARS in distilled water were prepared in completely same conditions. Therefore, 120 μM of Al 3+ ion and interfering ions were assigned to each of the solutions and mixed well. Figure 11b shows the images taken under UV cabin with an excitation wavelength of 366 nm of each of the solutions. As the spectrofluorimetry test results showed, adding Al 3+ ion to ARS solution showed significant fluorescence, while the initial solution of ARS and other ARS solutions contained interfering ions under the UV cabin have no fluorescence emission.

一 The fluorescence intensity (λ 除外= 388 nm) changes of ARLD-5 electrode after adding 120 μM of Al 3+ and interfering ions, b the fluorescence intensity differences for Al 3+ detection compared to interfering ions
To better understand the electrochemical mechanism on the electrode surface, UV–Vis spectrophotometry investigation was performed on the electrode surface before and after adding 120 μM of Al 3+ ion and performing a CV test. A.R.S. solution (10 –4 M) in deionized water was also prepared. 120 μM of Al 3+ ion was added to the solution and mixed well. The UV–Vis spectrophotometry test was then taken from both solutions. The obtained UV–Vis spectrophotometry results from the samples are shown in Fig. 12.

The UV–Vis spectrophotometry test of ARS solutions (10 –4 M) in deionized water compared to modified solid electrodes before and after adding 120 μM Al 3+
According to the results of Fig. 12, when the alumini um ion was added to the ARS solution, we see a sharp peak at a maximum absorption wavelength of 577 nm, indicating an increase in the absorption wavelength (redshift) after the formation of the ARS-Al 3+ complex in the ARS solution. When Al 3+ ion reacted with the ARS molecule, the hydroxyl (–OH) functional group in the ARS molecule which acted as an auxochrome group has affected the shifting of carbonyl (C=O) chromophore peak to a longer wavelength at 577 nm as well as increasing the chromogen absorbance intensity [24]. The interesting point is that the absorption diagram of the ARLD-5 after adding the aluminium ion to the electrolyte solution and testing CV, a sharp peak at 590 nm absorption wavelength indicates that the formation of the ARS-Al 3+ complex on the surface of the solid electrode is confirmed. In the study of Supian et al. [24], the wavelength of maximum absorption of the ARS-Al 3+ complex was measured at 488 nm.
Sensor Stability
Moreover, ten replicate measurements of 0.2 μM Al 3+ on the modified electrode yielded a reproducible current and maximum fluorescence intensity with the relative standard deviation (R.S.D.) of 2.5% and 2.6%, respectively; also, six independent modified electrodes were prepared using the same procedure and used for determination of Al 3+ (0.2 μM) with the (RSD) of 1.9%, demonstrating the excellent repeatability and reproduce ability of the electrochemical sensor. The long-term and too high flexibility were investigated by measuring the current response of 0.2 μM Al 3+ after bending test (in a cylindrical manner to a 90° angle) of modified ITO/PET electrode for 90 times during 1 month and the per cent recovery was 96%, indicating the long lifetime stability of the modified flexible electrode.
The results of Fig. 13 represent the electrochemical and optical response changes of the electrochemical sensor designed to the changes in the aluminium ion concentration, which shows a perfect and significant fit between the electrochemical and optical response of this type of sensor against the target molecule.

The electrochemical /optical response changes of the electrochemical sensor to the changes in Al 3+ concentration
The detection limit in this work is compared to previous works so that the details are presented in Table 3.
Other methods summarized in Table 3, based on the ASV technique, usually require longer detection times and repeatable electrode polishing step at each measurement. On the other hand, the electrochemical sensor designed in this study has a simple design system and, in addition to an electrochemical signal that accurately detects tiny amounts of target molecules quantitatively, also has an optical signal. As the optical signal changes in the spectrofluorimetry test, the application of the sensor is very convenient for biologists. This design structure is considered very suitable for future biotechnology applications.
结论
In this study, a novel flexible ITO/PET-based electrochemical sensor was designed and constructed so that by modifying its surface by (ARS/LDHs)n matrix grid by LbL assembly technique, a sensitive and selective sensor was obtained to detect Al 3+ . The results of this study showed that the LbL assembly of LDH nanoplatelets along with the electroactive dye molecules (ARS), up to five cycles, formed a conductive matrix network with uniform morphology and topology. The minimum sheet resistance with the high electrocatalytic function was obtained in the fifth cycle of the LbL assembly. In this electrochemical sensor, both electrochemical and optical methods were detected with the high sensitivity of Al 3+ , so that in a CV-based electrochemical method, the lower detection limit of 10.1 nM with a broad linear range [0.2–120 μM] was obtained than fluorescence-based optical method. Although the electrochemical technique had a sensitivity of about 2.27 times more than an optical method in this sensor, due to the resolution of distinct optical response in different concentrations of Al 3+ , the optical applications will be an interest of biologists for biotechnological diagnostics.
数据和材料的可用性
支持本文结论的所有数据均包含在本文中。
缩写
- L.D.H.:
-
层状双氢氧化物
- LbL:
-
Layer-by-layer
- A.R.S:
-
Alizarin red S
- NC:
-
Nanoclusters
- ITO/PET:
-
ITO-coated polyethylene terephthalate
- NALD:
-
Naphthalimide dye/LDH nanoplatelets matrix
- ICP-AES:
-
电感耦合等离子体原子发射光谱
- ICP-MS:
-
电感耦合等离子体质谱
- GF-AAS:
-
Graphite furnace atomic absorption spectroscopy
- HR-CS:
-
High-resolution continuum source flame atomic absorption spectrometer
- FAAS:
-
Flame atomic absorption spectrometry
- ASV:
-
Adsorptive stripping voltammetry
- DPV:
-
微分脉冲伏安法
- EIS:
-
电阻抗谱
- 简历:
-
循环伏安法
- PZC:
-
Point of zero charges
- SEM:
-
扫描电子显微镜
- 原子力显微镜:
-
原子力显微镜
- SPE:
-
Solid phase extraction
纳米材料