

使用含羞草提取物合成金纳米粒子,评估细胞毒性、细胞摄取和催化作用
摘要
由于其广泛的健康应用,用植物提取物合成金纳米粒子 (AuNPs) 在生物医学领域引起了极大的兴趣。在目前的工作中,AuNPs 与 Mimosa tenuiflora 合成 (Mt) 不同金属前体浓度下的树皮提取物。 Mt提取物是通过将树皮与乙醇-水混合而获得的。提取物的抗氧化能力使用 2,2-diphenyl-1-picrylhydrazyl 和总多酚测定进行评估。 AuNPs 通过透射电子显微镜、X 射线衍射、UV-Vis 和傅立叶变换红外光谱以及 X 射线光电子能谱法表征其表面的官能团。 AuMt(由 AuNPs 和 Mt 分子形成的胶体)表现出多种形状,尺寸在 20 到 200 nm 之间。 AuMt 在加入硼氢化钠的均相催化下对亚甲蓝降解进行了测试。最小的纳米颗粒 (AuMt1) 的降解系数为 0.008/s,并在 190s 内达到 50% 的降解 .在人脐静脉内皮细胞 (HUVEC) 中评估细胞活力和细胞毒性,发现在 24 和 48 h 有中等的细胞毒性作用。然而,毒性不以剂量依赖性方式表现。通过共聚焦激光扫描显微镜分析了 AuMt 在 HUVEC 细胞上的细胞内化。可以观察到AuMt1的物质分散在细胞质中,而AuMt2的物质集中在细胞核外围。
介绍
植物介导的纳米材料生物合成是一种生态友好的方法,允许在一锅法中合成 NP。这是因为植物提取物的相同生物还原剂可作为所形成颗粒的稳定剂,并且有毒化合物的含量较低 [1,2,3]。从这个意义上说,含羞草 (Mt) 树皮含有高含量的缩合单宁,具有四个黄酮单元的结构 [4]、皂苷、葡萄糖、生物碱 (N ,N -二甲基色胺)和淀粉 [5,6,7,8]。这些化合物(缩合单宁)可以作为金属离子还原剂,特别是黄酮类化合物与金属络合[4]。
Mt 乙醇提取物已被用作革兰氏阴性菌、革兰氏阳性菌和酵母菌的抗菌剂 [9]。此外,作为抗原生动物(使用山叶和花的黄酮类化合物)[10] 和皮肤再生 [6]。此外,它具有治愈严重皮肤溃疡的潜力,其特性归因于山树皮的分子和多酚 [11]。植物提取物具有抗氧化剂等特性,特别是含有多酚,可用于金属纳米粒子的绿色合成,如 Au、Ag、Fe、Pt、Pd、Cu、它们的合金和氧化物 [12, 13]。 NP 系统的光学特性,如表面等离子体共振 (SPR) 的共振频率,不仅取决于纳米材料的固有特性(尺寸、形状、介电常数),还取决于 NP 周围的环境特性,作为它们所在的溶剂稳定分子的分散或性质,覆盖 NPs。这些参数对于确定 NP 系统中 SPR 的峰值位置具有决定性作用 [14,15,16]。
一方面,AuNPs 的催化性能已在多项工作中得到报道,与农药、酚类化合物和染料等有机化合物的降解有关 [17,18,19] 并用于与环境修复相关的催化过程,例如,作为清洁受污染的水[20]。近年来出现了一些关于用植物提取物合成的 AuNPs 作为黑豆蔻 [21] 和工业中使用的染料降解催化活性评估的报告,如亚甲蓝 (MB) [22]、甲基橙 [19] 或罗丹明乙[23]。然而,在相反的方向上,一些论文报道了涂有稳定分子的 NPs 显示出较差的催化活性,因为 NP 表面上的可用于催化的位点被有机分子占据 [24, 25]。此外,AuNPs 已被用作分子传感器,例如有毒金属离子的比色检测 [7] 和治疗诊断(治疗和诊断)应用 [26]。
表面带有分子的功能化 AuNP 显示出与定义其特征的组成、厚度、组织和构象相关的光学和生物学特性 [27]。纳米技术面临着各种挑战,例如 AuNPs 在血液中的聚集 [28]。浓度小于 20 μg/mL 且大小约为 20 nm 的 AuNP 在健康和癌细胞系中没有显示细胞毒性作用,它们的使用允许分析 NP 与细胞之间的相互作用 [13, 29, 30]。然后,纳米技术提供了在相同尺度的细胞受体 [31] 上相互作用的可能性,从而可以了解细胞过程 [32, 33] 和抗菌特性 [34],例如,在氧化应激中产生一系列信号不同的作用,例如细胞毒性或抗氧化防御反应 [35]。此外,功能化的 AuNPs 作为药物、基因或蛋白质的转运载体 [36] 和生物医学应用 [37, 38]。更重要的是,AuNPs 配体作为蛋白质和聚合物产生了一个化学环境,有利于 NPs 内化到达细胞质、细胞核或穿过细胞膜 [39]。
在这项工作中,AuNPs 是使用丰富的多酚 Mt 树皮提取物合成的。在 HUVEC 细胞中评估 AuMt 细胞毒性,并在 24 h 时通过共聚焦显微镜监测细胞内化。在室温下,在硼氢化钠 (NaBH4) 存在下,评估了 AuMt 对 MB 降解的催化活性。我们的结果与通过“绿色”方法合成的金纳米粒子的类似催化作用进行了比较。
材料和方法
材料和化学品
对于 AuMt 合成,将 15 g 的 Mt 树皮切成碎片并放入 100 mL 烧瓶中。加入70毫升乙醇(Fermont,99%纯度)和30 mL超纯水(18 MΩ,Millipore),然后用铝覆盖并在室温下放置15 天。使用 Whatman 滤纸 (8 μm) 然后使用 acrodisc (0.20 μm) 过滤溶液。所得溶液用作AuMt合成的还原剂(Mt提取物)。将一部分滤液旋转蒸发,然后冻干用于 DPPH 和总多酚测定,并构建 Mt 提取物的校准曲线。根据校准曲线确定,Mt 提取物的浓度为 32.5 mg/mL。四氯金酸(HAuCl4,Sigma-Aldrich 纯度 99%)用作金属前体。合成中使用的前体浓度对于 AuMt1 为 5.3 mM,对于 AuMt2 为 2.6 mM。还原剂体积保持恒定(1.6 mL),用超纯水将样品总体积补至6 mL。附加文件 1:表 S1 显示了 AuMt1 和 AuMt2 合成中使用的配方以及每种反应物的 pH 值。合成在实验室光照条件下在 25 °C 下进行。使用的协议如下。在 50 mL 管中,加入 Mt 提取液,然后加入超纯水,最后加入金前体溶液,立即在涡旋中以 3000 rpm 的速度搅拌 10 s。 AuMtNPs 的合成在几分钟内通过混合物颜色的变化被目视确认。 NPs清洁过程包括悬浮液以14,000 rpm离心1 小时,弃上清液,加水,超声分散,重复该过程两次。加入乙醇后,AuMt 再次通过超声分散并以 14,000 rpm 离心 1 小时。弃去上清液并沉淀,在 40 °C 的烘箱中干燥。然后,得到的纳米复合材料由表面有Mt提取物分子的AuNPs组成。
AuMtNP 合成的 pH 随时间变化
在进行反应时测量 AuMtNP 合成的 pH 值。为此,使用了多参数 pH/电导率台式仪表 (Orion™ VERSA STAR™)。仪器在 25 °C 下使用用于校准的缓冲参考标准溶液在 pH =4.01 下进行校准。在所有测量中,使用再循环浴将样品的温度控制在 25 °C (± 0.1 °C)。在混合试剂后立即进行反应 180 s 时测量 pH 值。该装置用于反应物的pH测量。
UV-Vis 光谱、2,2-二苯基-1-Picrylhydrazyl (DPPH) 和总多酚测定
使用双光束 Perkin-Elmer Lambda 40 紫外/可见光谱仪获取提取物的紫外-可见光谱,测量范围为 200-400 nm,扫描速率为 240 nm/min。 AuMt SPR在250和875 nm之间进行监测。
AuMt形成动力学通过每秒测量550 nm处的吸光度来确定,同时NP合成反应在磁力搅拌下在石英池内发生。
对于 DPPH 测定,所有测试均重复三次。测试了不同的 Mt 提取物浓度(25、12.5、6.25 和 3.125 μg/mL)。除了 DPPH 溶液 (300 μM) 外,还向 100 μL 的每种浓度添加了 100 微升乙醇。随后,将样品在黑暗中孵育 2 小时,然后测量 517 nm 处的吸光度。将结果与维生素 C 和儿茶素 (70 μmol/L) 进行比较,并将这两种分子用作对照。对于清除活性,溶解在乙醇上的 DPPH 自由基用作空白 [40, 41]。清除活性的百分比用方程式计算。 (1).
$$ \%\mathrm{Scavenging}\ \mathrm{activity}=\left[\left(1-\mathrm{A}\ \mathrm{sample}\right)/\mathrm{A}\ \mathrm{control} \right]\times 100 $$ (1)其中样本 是样品吸光度和 A 对照 是空白吸光度。使用方差分析(ANOVA)和Tukey多重比较检验对数据进行分析。
对于总多酚测定,通过添加 0.25 N 的 Folin-Ciocalteu 和 5% 的碳酸钠,在没有光的情况下孵育 1 小时,使用相同的浓度。在 750 nm 处测量吸光度。结果以没食子酸当量表示[42, 43]。
Zeta 电位和 DLS 大小确定
NP 的 Zeta 电位 (ζ) 使用 Zetasizer NS (Malvern, PA) 测量,尺寸通过 Zetasizer NS 的动态光散射 (DLS)(分辨率为 0.5 nm)测量。仪器通过确定电泳迁移率 (μ e ) 使用亨利方程。 (2) [44]:
$$ {\mu}_e=\frac{2\varepsilon \zeta f(ka)}{3\eta } $$ (2)其中 ε , η , 和 f (ka) 分别表示介质的介电常数、介质的粘度和亨利函数。两个值通常用作 f 的近似值 (ka) 测定值,1.5 或 1.0。 ζ 的电泳测定最常在水性溶剂和中等电解质浓度下进行。 f (ka),在这种情况下,取值为 1.5,被称为经典的 Smoluchowski 近似,方程。 (3) [45]。
$$ {\mu}_e=\varepsilon \frac{\upzeta}{\upeta} $$ (3)将样品置于 U 形折叠毛细管中 ζ 测量。每个样品在室温(25 °C)下重复测量三次。
在补充培养基 (s-DMEM) 中评估 NP 稳定性
通过 DLS 和 ζ 在 s-DMEM 中评估 AuMtNP 稳定性 . AuMt1 和 AuMt2 的流体动力学直径 (2RH) 在 37 °C 下在超纯水和 s-DMEM 中测量,浓度介于 25 和 200 μg/mL 之间。对于 s-DMEM 中的 AuMt1 和 AuMt2,在 37 °C 下测量 ζ 以确定培养基是否改变了 NP 表面电荷。将纳米颗粒添加到带有 s-DMEM 的 Eppendorf 管中,其中 s-DMEM 预先加热并在涡流中以 3000 rpm 的速度搅拌 30 s。 37 °C保温15 分钟后,在相同温度下进行测量。
傅立叶变换红外光谱 (FTIR)
Mt 提取物和 AuMt FTIR 是通过 Perkin-Elmer Frontier FTIR 使用固体样品获得的。光谱在透射模式下获得,分辨率为 2 cm − 1 , 从 4500 到 500 cm −1 .
X 射线光电子能谱 (XPS)
XPS 实验使用 Perkin-Elmer(Model PHI 5100,分辨率基于 Ag3d5/2 峰的 FWHM 0.80 eV,XR 源双标准阳极(Mg/Al)和 15 kV,300 W,20 mA )。以 0.5 eV/s 的扫描速率进行调查扫描分析。对于高分辨率分析,使用的扫描速率为 0.025 eV/s。
透射电子显微镜 (TEM)
对于 TEM,将 10 μL 的样品沉积在覆盖有碳膜(电子显微镜科学,300 目)的铜网上。使网格干燥 1 小时,然后放置在真空室中 12 小时。电子显微镜设备是在 200 keV 下操作的场发射 Jeol 2010 F。能量色散 X 射线光谱 (EDS) 是探测器 Bruker Quantax 200,珀尔帖冷却,并与 TEM 系统耦合。高分辨率TEM(HRTEM)显示的晶面间距由显微数字分析(3.0 Gatan版)确定。
X 射线衍射
使用配备多层反射镜单色器和 CuKα 微聚焦密封管 (λ) 的 Bruker D8 QUEST 衍射仪系统收集数据 =1.54178 Å)。在 T 收集帧 =300 K 通过扫描。
AuMt 细胞毒性作用
使用 3-(4,5-二甲基噻唑基-2)-2,5-二苯基溴化四唑 (MTT) 测定法在 HUVEC 细胞中评估 AuMt 细胞毒性作用。细胞在 Dulbecco 改良的 Eagle 培养基(DMEM,Sigma-Aldrich)上生长,并在 37°C 和 5% 的 CO2 下补充 10% 胎牛血清 (GibcoBRL)。在Neubauer室中对HUVEC细胞进行计数,并通过台盼蓝排除试验(Sigma-Aldrich)测定活力。
对于 MTT 测定,将细胞调整为 100,000 个细胞/mL,每孔 100 μL 置于 96 孔板中。 AuMt1 和 AuMt2 在 200、100、50 和 25 μg/mL 的浓度下进行评估。将处理过的细胞在 37 °C、5% 的 CO2 下孵育 24 和 48 小时。孵育时间后,将板用磷酸盐缓冲盐水 (PBS) 洗涤并加入 MTT 溶液并孵育 4 小时。添加二甲基亚砜 (DMSO) 以溶解 MTT 晶体。使用 Gen5 软件,在多模式读板机(Synergy HTX,BioTek)上在 570 nm 处测量吸光度。使用方程计算细胞活力。 (4):
$$ \mathrm{Cell}\ \mathrm{viability}=\left(\mathrm{A}\ \mathrm{sample}/\mathrm{A}\ \mathrm{control}\right)\times 100\% $$ (4)其中样本 是样品和A 对照的吸光度 为空白[46, 47]的吸光度。
统计分析
数据表示为平均值 ± 标准偏差(SD)。组间显着差异通过 Tukey 检验、单向方差分析酌情进行分析。 P 小于 0.05 的值被认为具有统计学意义。 Origin Pro 9.1 软件用于数据管理、统计分析和图形生成。使用的符号是 *p <0.05。比较治疗组(AuMt1和AuMt2)和对照组24和48 h的表现。
对于活/死检测,将 HUVEC 细胞接种在载玻片上并用 AuMt1 和 AuMt2 处理。在孵育玻片 24 小时后,根据制造商的建议,使用活/死活力/细胞毒性试剂盒 (ThermoFisher) 对这些玻片进行染色。样品采用激光共聚焦扫描显微镜(CLSM800,Carl Zeiss)进行观察。
共聚焦激光扫描显微镜:AuMt 的荧光
在安装在倒置显微镜 Axio Observer.Z1(Carl Zeiss,Jena Germany)上的 LSM 800 设备(Carl Zeiss,Jena Germany)中进行共聚焦显微镜分析。研究使用了 405、488 和 640 nm 的三种激光器,最大功率分别为 5、10 和 5 mW。使用高灵敏度 GaAsP 检测器收集荧光。明场图像是通过在光电倍增管 (PMT) 上收集透射激光来获得的。对于AuMt 荧光、活/死检测和HUVEC 细胞研究中的NP 分布,使用Plan-Apochromatic × 40/0.95 干物镜。对于具有 AuMt 的 3D 重建细胞,使用了平场消色差 × 63/1.40 油目标。
对于 AuMt 荧光表征,将一滴 20 μL 的 NP 胶体分散体沉积在盖玻片中并在室温下干燥,然后通过 CLSM 进行分析。使用 640 nm 激光作为激发源,功率为 0.5%,在 650 到 670 nm 之间收集荧光。明场 AuMt 图像是使用 488 nm 激光(功率的 0.2%)在透射光模式下形成的。在不同的轨道上收集荧光和明场。
细胞内化
对于 HUVEC 细胞上的 AuMt 内化,细胞核用 4',6-二脒基-2-fenilindol (DAPI) 染色,肌动蛋白纤维用抗 β 肌动蛋白抗体与 5-异硫氰酸荧光素 (FITC) 偶联以划定细胞边界. DAPI 用 1.0% 功率的 405 nm 激光激发,FITC 用 0.20% 的 488 nm 激光激发。 DAPI 和抗 β 肌动蛋白抗体的发射分别在 410 和 500 nm 和 500-700 nm 之间收集。 AuMt 用 640 nm 激光(0.50% 功率)激发,在 650 和 700 nm 之间收集发射。
3D cell-AuMt 重建和正交投影由 30 张图像在 Z-stack 模式(总 Z 长度 =8 μm),如上所述收集来自 DAPI、FITC 和 AuMt 的荧光。在每个 Z 的不同轨道上收集荧光信号 位置。为清楚起见,在 3D 重建中省略了 FITC 信号。
实现了纳米颗粒细胞摄取的相对比较。为此,使用ImageJ软件通过共聚焦图像分析确定了HUVEC细胞中AuMt1和AuMt2的平均荧光强度[48]。
催化
对MB的催化活性,浓度为3.33 × 10 -5 M,通过紫外-可见光谱分析。在均相催化中,将 90 μL 的 NPs (2 mg/mL) 直接添加到含有 MB 和 200 μL 浓度为 100 mM 的 NaBH4 的石英池中。通过在分光光度计单元内的磁力搅拌使样品均质化。反应在25 ℃下进行。
结果和讨论
综合
通过目视检查,发现两个系统中 NPs 的合成都非常快。附加文件 1 的插图中显示的 AuMt1 系统的最强烈颜色:图 S1 表明来自该合成的 NPs 含量更高。这是因为与 AuMt2 相比,AuMt1 具有双倍浓度的金属前体。在附加文件 1:表 S1 中,纳米颗粒合成中使用的试剂具有酸性 pH。附加文件 1:图 S1 显示了进行 AuMtNPs 合成时反应 pH 值的变化。反应开始于酸性环境(pH <2.65),随着 NPs 合成的发展,酸度增加。这是由于 Mt 提取物的多酚分子中存在的羟基的去质子化。事实上,这是氧化还原过程的第一步,导致电子从去质子化的羟基转移到 Au 3+ 离子。作为氧化还原反应的产物,Au 3+ 离子被还原为金属原子 Au 0 并且贡献2个电子的多酚环被氧化。该过程在附加文件 1 的插图中进行了描述:图 S1。
紫外-可见光谱、DPPH 和总多酚测定
山树皮提取物的 UV-Vis 光谱如图 1a 所示,其中信号包含在一个明确的波段中,最大值为 280 nm,宽为 50 nm。该光谱与报告的 Rumex hymenosepalus 非常相似 根提取物,其中含有高含量的多酚化合物 [49]。确定 Mt 树皮提取物中的多酚含量很重要,因为这些分子可以作为 AuNPs 合成中的还原剂做出显着贡献,为 Au 3+ 的还原提供必要的电子 离子到金属金 (Au 0 )。一旦纳米颗粒形成,多酚类化合物就会吸附在其表面,从而为纳米材料提供稳定性。
<图片>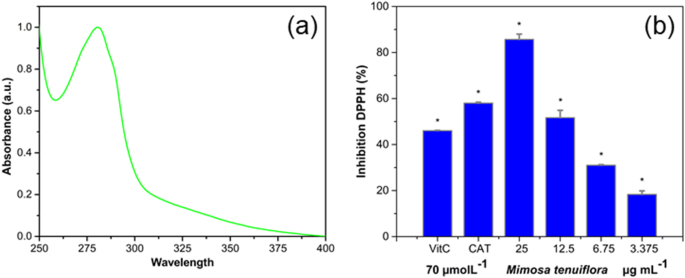
山提取物的表征。 一 山提取紫外-可见光谱和b DPPH 抑制与单向方差分析 (*p <0.05)
对于 DPPH 测定,观察到对于 12.5 mg/L 的 Mt 提取物,我们获得了 50% 的抑制 (L50),与维生素 C 和儿茶素报告的值(分别为 46% 和 58%)类似。这表明 Mt 提取物具有与用作对照的纯化合物非常相似的抗氧化能力,图 1b,其中显着差异 (*p <0.05) 的对照值用星号标记。从总多酚测定中获得的值为 425 mg/g,表明提取质量的几乎一半相当于没食子酸。 Mt提取物中的高抗氧化能力和高多酚含量表明它可以作为可持续化学框架内良好的还原剂和稳定剂纳米材料合成[50, 51]。
特征
形成动力学和紫外-可见光谱 AuMt
图 2a 显示了随着纳米材料合成反应的发生,AuNP 的 SPR 峰(AuMt1 和 AuMt2 分别为 550 和 560 纳米)吸光度的时间演变。实验数据符合玻尔兹曼的 sigmoidal 函数 [52],其中至少观察到三个生长阶段。在第一个中,当 Au 3+ 合成反应开始时,吸光度增长缓慢 离子被还原为 Au 0 并形成几个原子的聚集体,这些原子结合形成小的 NP。在第二阶段,小纳米颗粒通过自催化生长增大尺寸,吸光度快速增长。在最后阶段,在 NP 重结晶中,吸光度达到其固定相。从图 2 中可以看出,AuMt1 在 60 秒内达到最大吸光度,AuMt2 在 120 秒内达到最大吸光度。有趣的是,AuMt1 的第一生长阶段为 20 秒,而 AuMt2 几乎为零(小于 1 秒),这是由于还原分子(Mt 提取物)相对于金属前体的比例较高所致。相对于 AuMt1,这有利于 AuMt2 的 NPs 中核的快速形成;尽管如此,AuMt2 纳米颗粒的下一阶段生长较低,并且获得了更大尺寸的纳米颗粒。据报道,使用麦芽糖和吐温 80 作为稳定剂的 AuNP 合成显示出生长动力学,其反应时间与本工作中报道的非常相似 [53]。在另一份绿色合成报告中[54],指出还原剂/前体剂的比例最低会产生较小尺寸的纳米颗粒。
<图片>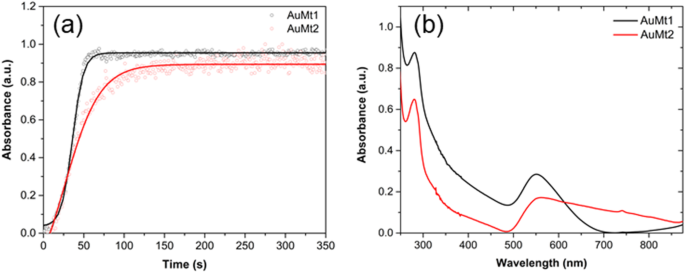
AuMt1 和 AuMt2 的 UV-Vis 表征。 一 动力学形成和b 紫外-可见光谱
图 2b 显示了 AuMt 在由 250-875 nm 组成的区域中的特征吸收光谱。 AuMt1 的 SPR 显示出对称带,最大吸收在 550 nm 处,宽为 200 nm。 AuMt2 等离子体激元峰出现轻微红移,现在位于 560 nm,具有不对称带且宽度大于 300 nm,这是由于两种纳米材料之间的尺寸差异 (dAuMt1
如表 1 所示,在不同条件下对 DLS 的 AuMtNP 大小和 Z 电位进行了测试(50 μg/mL)。AuMt1 和 AuMt2 在水中显示出高负值(≤ 30 mV),这有利于两种纳米颗粒的静电稳定性系统。根据 Qu 等人的说法。 [56], ζ 值随着 NP 大小逐渐增加;在我们的例子中,AuMt1 在水中的尺寸小于 AuMt2,尺寸由 NP 合成控制。这些尺寸值与 NP ζ 匹配 值,其中 ζ 越高 对应于 NP 更大的尺寸。 Zeta 电位 (ζ ) 分散在 s-DMEM 中的 AuMtNPs 显示出比在超纯水中获得的那些更少的负值(表 1)。这种减少可归因于 DMEM 存在的阳离子和 FBS 存在覆盖 AuMtNP 表面的蛋白质,这导致静电相互作用的减少。尽管如此ζ 减少,两个系统的值保持接近 - 25 mV,这表明纳米粒子在 s-DMEM 孵育后保持其静电稳定性 [57]。此外,表 1 显示了通过 DLS 在 37 °C 下在超纯水和培养基中测量的 AuMtNP 流体动力学直径 (2RH) 的结果。在 s-DMEM 中,由于纳米颗粒表面的蛋白质吸附,两个系统的大小都增加了 [58]。对于 AuMt1,蛋白质电晕导致的 2RH 增长为 33.8 nm,AuMt2 为 42.9 nm。预计纳米颗粒越大,蛋白质吸收的表面就会越大 [59]。这可以解释 ζ 上略小的值 AuMt2 与 s-DMEM 中的 AuMt1 相比。对于 AuMt1 和 AuMt2,与 s-DMEM 蛋白的相互作用是由于附着在纳米颗粒表面的提取物分子。这些分子在 AuMt1 和 AuMt2 之间略有不同,如 XPS 结果所示。我们还测量了相同浓度范围内溶液的 pH 值。结果发现,超纯水中的 AuMt 和 s-DMEM 中的 7.2(表 1)的 pH 值没有变化,其平均值约为 7.5。
附加文件 1:图 S2 显示了在 37°C 下以 25 到 200 μg/mL 的浓度范围分散在超纯水和 s-DMEM 中时的 AuMtNP 流体动力学直径。对于每个研究的系统,流体动力学直径不随纳米颗粒浓度而变化,并且仅对于 100 μg/mL 的 AuMt2 s-DMEM,颗粒大小相对于最低评估浓度增加,这可能表明这些浓度下的 NP 聚集过程[32].
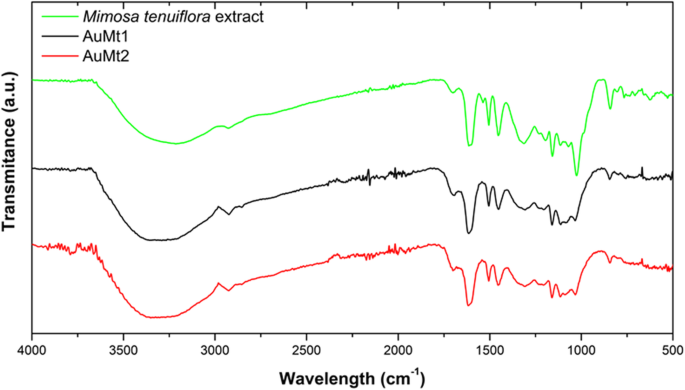
图 3 所示的 FTIR 光谱对应于 Mt 提取物、AuMt1 和 AuMt2。以 3250 cm
−1
为中心的特征宽带 主要与来自单宁和黄酮类化合物的酚类 OH 相关联。峰值在 1594 cm
−1
对应于 N-H 弯曲振动,在 1705 cm
-1
到酮无环拉伸和 1000 到 1300 cm
−1
之间的区域 到 C-O 拉伸。 1600 到 500 cm
−1
范围内的峰值 用多酚识别,信号在 1235 和 1160 cm
−1
与芳香 C-O 键拉伸有关,在 1020 cm
−1
到脂肪族 C-O 带拉伸和在 1235 cm
−1
具体与以太的循环性质有关。这些信号可能与 Mt 提取物中最丰富的化合物有关,如含羞草单宁、黄酮樱花素、三萜皂苷、查耳酮和 N ,N -二甲基色胺生物碱(附加文件 1:图 S3)。样品 AuMt1 和 AuMt2 在多酚区域显示出相同的特征峰,证实 NP 被 Mt 提取物分子稳定 [60]。我们观察到 1331 cm
−1
的变化 AuMt1 和 AuMt2 的宽度和峰强度的降低对应于 AuNPs 和多酚 C-H 基团之间的键; 1723 cm
−1
在 Au
3+
还原过程中,通过多酚氧化成羧酸化合物而转变 到 Au
0
[51, 61, 62]。
FTIR 光谱。 Mt提取物(绿色)、AuMt1(黑色)和AuMt2(红色)
在 AuMt1 和 AuMt2 的 XPS 勘测扫描分析中,样品清楚地表明存在氧 (O 1s ), 碳 (C 1s ) 和黄金 (Au 4f ),其峰值分别以 532、284 和 85 eV 为中心,如图 4a、b 所示。进行高分辨率 XPS 实验以建立覆盖 AuNP 表面的不同分子官能团的相对丰度。 Au4f AuMt1 和 AuMt2 的高分辨率 XPS 光谱由两个对称峰组成,相距 3.7 eV(图 4b、e)。与 4f 相关的峰 5/2 自旋轨道耦合位于 AuMt1 和 AuMt2 的结合能 (BE) 分别为 88.6 和 87.7 eV。对于 4f 7/2, spin-orbital coupling peaks are located on 84.9 and 84.0 eV. The link of intensities (I4f 7/2 > I4f 5/2) and location and separation (ΔBE = 3.7 eV) between peaks confirm that gold ions (Au
3+
) are reduced completely to metallic gold Au
0
[63]。 Au4f signals, for AuMt1, are slightly shifted (~ 0.9 eV) at higher energies with respect to sample AuMt2. This can be explained in terms of NP size differences between samples. AuMt1 has a half population of NPs with size less to 40 nm, while AuMt2 NPs have a mean diameter of 150 nm, determined by TEM. Peak shift for Au4f signals, due to the presence of small NPs, has been reported by other authors who relate the Au4f BE increase with decreasing NP size [64, 65]. Also, the shift effect could be due to the interaction of functional groups capped on surfaces of AuNPs [66]. In Fig. 4c, f, the high-resolution XPS spectra of C1s are shown for AuMt1 and AuMt2. Spectra were deconvoluted by 3 Gaussian bands associated with C=O, C–O, and C–C or C=C. For AuMt1, peaks are centered on 286.9, 286.1, and 284.5 eV, for AuMt2 on 287.0, 286.3, and 284.7 eV, respectively. Comparing the experimental XPS curves for C 1s , we see appreciable differences between AuMt1 and AuMt2. The main difference comes from a significant decrease in AuMt1 of the signal associated with C–O group. Comparing the percentage contributions of each group, obtained from the deconvolutions (Additional file 1:Table S2), we see that in AuMt2 contribution of C–O signal is 27.8% while in AuMt1 is 16.6%. This difference can be explained in terms of the oxide-reduction reaction that gives rise to the process of AuNP formation. The synthesis of AuMt1 is added twice the metal precursor (HAuCl4 is 0.01 M) than in synthesis of AuMt2. In both cases, the same amount of extract is used as a reducing agent, so in AuMt1, more hydroxyl groups (−C–OH) are consumed to reduce a greater number of Au
3+
离子。 Thus, a decrease of C–O signal in AuMt1 confirms that hydroxyl groups participate in the synthesis reaction. High-resolution XPS of O 1s revealed that carbonyl C=O is the most abundant group (Additional file 1:Figure S4 and Table S2). In addition, the content of the C=O group is higher in the AuMt1 sample, which confirms what was previously discussed.
XPS spectra of AuMt1 and AuMt2. 一 , d Survey spectra, b , e Au4f 高分辨率和c , f C1s high resolution
XPS and FTIR indicate that AuMtNPs interact mainly with carbonyl groups (ketones) in addition to hydroxyl groups of Mimosa tannins, saponins, and other molecules that participate in the reduction of Au
3+
to Au
0
and stabilization of AuMtNPs [63, 67, 68].
AuMt1 TEM micrographs are shown in Fig. 5a, b and AuMt2 in Fig. 5d, e showing products’ shape distribution. AuMt1 has the biggest diversity in shapes. AuMt shape is determined by the relationship between the variation of metal precursor concentration and Mt extract at a fixed concentration. In this case, NPs were observed without cleaning the extract to observe the interaction that forms around the AuMt. As observed in the micrographs, an extract is placed on the surface; however, NPs are kept dispersed and no aggregation is shown. Figure 5c, f show size distribution for each sample, and AuMt1 have an average size dispersion of 40 nm and AuMt2 of 150 nm.
Size distributions by TEM. 一 , b , c AuMt1 and d , e , f AuMt2
In Fig. 6a, AuMt TEM micrographs were also analyzed by EDS (Fig. 6b), which showed Au presence. Other chemical elements such as Cl, O, and Ca, on EDS spectrum, come from the extract that surrounds NPs. According to the crystallographic tab (JCPDS file:04-0784), the obtained distances between 2.35 and 2.03 Å (Fig. 6c) correspond to Au crystalline planes (111) and (200).
Nanostructural characterization of AuMt. 一 透射电镜,b EDS, c single HRTEM, and FFT and d XRD
Figure 6d shows the characteristic AuMt XRD diffraction peak at 2Ɵ , which are in 38.17, 44.37, 64.81, and 77.66
o
corresponding with the planes (111), (200), (220), and (311), respectively; these planes correspond with the face-centered cubic Au (space group Fm
3
m, JCPDS File No. 89-3722). High Score Plus and Origin software were used for the analysis [69].
To evaluate AuMt1 and AuMt2 toxicity, tests were performed on HUVEC cells using MTT. Four concentrations and two times for both materials were evaluated. In Fig. 7a, it is observed that at 24 h for AuMt1, cell viability decreases between 10 and 20%, only in concentrations higher than 25 μg/mL. For AuMt2, a similar effect is obtained in cell viability; however, the concentration of 100 μg/mL seems to have no effect on these tests. In Fig. 7b, MTT tests at 48 h for AuMt1 and AuMt2 are shown. For AuMt1, it is easy to notice that concentration with the greatest effect is 50 μg/mL, where the viability drops almost 30% compared to the control. The concentration of 50 μg/mL seems to be the concentration with the highest toxic effect; however, when the obtained data were analyzed, it is found that there is no significant difference between the obtained data on 24 and 48 h, a similar result obtained for 100 and 200 μg/mL, Fig. 7c. For AuMt2, a toxic effect between 20 and 30% is observed only on 100 and 200 μg/mL, while 25 and 50 μg/mL show no significant difference, compared to the observed effect at 24 h, Fig. 7d. This seems to correlate with AuMt2 size growth in s-DMEM (Additional file 1:Figure S2) where at a concentration of 100 μg/mL, they begin to aggregate. In the work published by Chandran et al. [70], they used gold nanoparticles coated with branched polyethyleneimine (BPEI), lipoic acid (LA), and polyethylene glycol (PEG), where they see an important toxicity in HUVEC cells by nanoparticles coated with BPEI, which have sizes of 40 and 80 nm, where viability is between 20 and 30%. When these particles are covered with human serum proteins, it is found that toxicity decreases; this is due to the corona effect. Recently, Zhaleh et al. [71] have reported the biogenic synthesis of 40-nm gold nanoparticles using leaf extracts from Gundelia tournefortii L. plant. Interestingly and in contrast to our results, the authors indicate that MTT cell viability tests for these particles in HUVEC, the cell viability was 95% at 1000 μg/mL; however, they do not establish if the low cytotoxicity is due to the fact that there is no material internalization or if the particles are harmless due to protein corona. In this sense, bioreductive compounds present in Gundelia tournefortii L extract are different from those reported for Mimosa tenuiflora extract (Additional file 1:Figure S3). Thus, the interactions of these two nanoparticle systems with proteins present in FBS are very different, which may explain the differences in cytotoxic responses.
Viability assay using MTT in HUVEC cell. 一 For 24 h and b 48 h. 0ne-way ANOVA analysis with (*p <0.05)。 Comparison between 24 and 48 h for c AuMt1 and d AuMt2 with ANOVA analysis with Tukey tests (n.s. no significance and (*p < 0.05))
As mentioned above, AuMt1at a 50-μg/mL concentration shows the highest toxicity and cellular uptake. We believe that toxicity may be due to the fact that the nanomaterial has a low affinity to s-DMEM proteins, since it has only 16.6% of hydroxyl groups on the surface to promote hydrogen bonding with S-DMEM proteins. The fact that the material toxicity decreases as AuMt1 concentration increases may be due to a cellular detoxification response, like an exocytosis caused by high intracellular content of gold [70]. For AuMt2, the toxicity effect at 100 and 200 μg/mL may be due to nanomaterial agglomeration, which could be attaching to the membrane causing adverse effects for the cells; however, more experiments are required to confirm this hypothesis.
Only one concentration (50 μg/mL) was chosen to be evaluated by live/dead fluorescent dye; this is due to the purpose of confirming the MTT results and later analyzing the metallic NP internalization in HUVEC cells, avoiding a field saturation by NPs. When cells were stained with live/dead fluorescent dye kit, it was found that a large part of the cell population favorably marked for calcein and just a few for ethidium homodimer, indicating that cell culture is viable, as shown in Fig. 8.
Live/dead assay in HUVEC cells. 一 , d , 和 g with calcein; b , e , 和 h with ethidium homodimer;和 c , f , 和 i merge by confocal microscopy
In Fig. 9a, d are shown micrographs of AuMt1 and AuMt2 in bright field and in Fig. 9b, e, their corresponding fluorescence, captured by confocal microscopy. Red fluorescence of AuMt (collected emission 650–700 nm) was excited employing 640 nm diode laser, and a mayor size of NPs can be appreciated in AuMt2 sample than AuMt1. In the merge images in Fig. 9c, f, it can be observed how the luminescence comes exclusively from the dark points associated with the NPs. This indicates that the cleaning process effectively removed the extract that is not complexed to the nanomaterial, so there is no background emission. It is interesting to observe that an intense fluorescence of the NPs captured by the confocal system is achieved at a very low excitation power of the laser (below 0.5 mW). So, this NPs system can be fluorescently traced efficiently in cellular systems with little risk of phototoxicity. Some authors have reported fluorescent emission about 610 nm, suggesting intrinsic Au fluorescence [72, 73]. AuNPs emission is related to the core size confinement effect that generates discreet electronic states [74]. However, in our case, the metal surface is covered with flavonoids, which show fluorescence, and when complexing with AuNPs, the fluorescence of both is enhanced. Different authors have reported that fluorescence is largely enhanced by charge transfer from the surface ligands to the metal core via S–Au bonds [75]. It has also been reported that ligands (thiol molecules, DNA oligonucleotides, dendrimers, polymers, peptides, and proteins) affect AuNPs optical and electronic properties since its fluorescent properties can be significantly affected by their surface chemistry [76].
AuMt1 and AuMt2 fluorescence. 一 , d Bright field. b , e Confocal. c , f Merge
Cells were also analyzed, by confocal microscopy, after 24 h incubation, with AuMt1 and AuMt2 at a concentration of 50 μg/mL. The nucleus is shown in blue color using DAPI Fig. 10a, and the cytoskeleton structure was stained with anti-beta actin in green color Fig. 10b and merge Fig. 10c. The observed micrographs were obtained through 3 different channels on separate tracks, where the excitation wavelengths were 405, 488, and 640 nm for DAPI, anti-beta actin, and AuMt, respectively.
AuMt1 and AuMt2 cellular internalization. 一 , d , 和 g with DAPI; b , e , 和 h with beta-actin;和 c , f , 和 i merge by confocal microscopy
As previously described, cells were also analyzed by confocal microscopy, for AuMt1 and AuMt2 internalization, at a concentration of 50 μg/mL. Confocal micrographs show that AuMt are internalized in HUVEC cells cytosolic space, and many of these particles are surrounding the nucleus, without being internalized in it. When not observing particles in the nucleus, a more meticulous analysis was carried out, by cell orthogonal projection and a 3-D reconstruction. Observing the micrographs of both reconstructions, it is possible to notice that AuMt is distributed differentially. In Fig. 11a, b for AuMt1, it can be observed that a material is dispersed in the cytoplasm, while in AuMt2, the material is concentrated in the nuclear periphery, as shown in Fig. 11c, d. We were not able to find NPs in the nucleus, and this suggests that the nanomaterial has little or no genotoxic potential, since it has no way of interacting with nuclear DNA, which is a quality for a nanocarrier. Efficient cellular uptake depends on NP size, shape, charge, and coating, the parameters that can affect their interactions with cell proteins. The fact that polyphenolic compounds are found on AuMt surface could facilitate the nanomaterial internalization, which would make it a candidate as a possible pharmacological nanocarrier [77,78,79].
Orthogonal projections and 3-D images. 一 , c AuMt1 and AuMt2 cellular internalization analysis through orthogonal projection and b , d 3-D reconstruction by confocal microscopy
The obtained results for an AuMtNP cellular uptake in HUVEC by a confocal microscopy at 50 μg/mL suggests that AuMt1 interacts with the cells in a greater quantity than AuMt2 in a 3:1 ratio, as seen in Additional file 1:Figures S5–S7. If we consider that protein corona in AuMt1 is 9.1 nm smaller than in AuMt2, we can suggest that AuMt1-efficient internalization by HUVEC cells is given by a combination of factors such as AuMt1 smaller size, the highest absolute value of z potential and the lower thickness of protein corona. This indicates a poor protein coverage that allows partial exposure of the nanoparticle surface, which is rich in extract molecules. Therefore, nanoparticles can interact by means of extract molecules with surface-specific membrane receptors that facilitate the internalization of AuMt1.
Analysis of catalytic reaction was realized to calculate the degradation percentage ( %D) using the Eq. (5):
using the A 0 absorbance at t = 0 and A is the absorbance at time t . Langmuir-Hinshelwood equation was used to calculate the slope of the regression plot \( \ln \left(\frac{A}{A_0}\right) \) versus irradiation time [80], which is expressed in Eq. (6) and K is the first-order rate constant of the degradation ratio:
For the analysis of catalytic activity on MB degradation, the absorbance at 660 nm was monitored. Figure 12 shows the AuMt1 and AuMt2 catalytic activity, where a decrease on maximum absorption of MB is observed as time progresses Fig. 12a, d. MB degradation and its conversion to leucomethylene is confirmed by progressive decreases of the absorbance at 292, 614, and 660 nm correspond to MB and by the increase in time of the absorbance at 256 nm associated with leucomethylene. Homogeneous catalysis reaches a 50% MB degradation at 190 s Fig. 12b, while the degradation ratio K for the total process is 8.24 × 10
−3
s to AuMt1 Fig. 11c. AuMt2 reaches a 50% of MB degradation in 400 s, Fig. 12e, and K takes the value of 3.54 × 10
−3
/s, Fig. 12f.
AuMt1 and AuMt2 Catalysis. 一 , d UV-Vis spectra. b , e Percentage. c , f Ratio of MB degradation
On this way, AuMt1 have a more efficient response than AuMt2. We observed a size-dependent effect (AuMt) in degradation ratio [81], and a total surface area of NPs is inversely proportional to the NP size [37]. Table 2 shows a comparison between different green syntheses of AuNPs and their K obtained in size function.AuMtNPs 的大小、Zeta 电位和稳定性
傅立叶变换红外光谱 (FTIR)
X 射线光电子能谱 (XPS)

Transmission Electron Microscopy


X-ray Diffraction (XRD)
Biological Tests
Cytotoxicity by MTT and Live/Dead Assay


Confocal Laser Scanning Microscopy:Fluorescence of AuMt

Cellular Internalization


Catalytic Tests
Catalysis

Conclusions
In this work, we show for the first time that the extracts of bark of Mimosa tenuiflora allow the production at room temperature of gold nanoparticles by means of one-pot synthesis. AuNP sizes are easily controlled by regulating a metal precursor/reducing an extract ratio. It was observed that AuMt1 and AuMt2 cellular uptakes generate a moderate cytotoxic effect at 24 and 48 h post exposition. However, toxicity does not behave in a dose-dependent manner, which suggests different action mechanisms for AuMt1 and AuMt2. XPS and FTIR indicate that AuMtNPs interact mainly with carbonyl groups (ketones) in addition to hydroxyl groups of Mimosa tannins, saponins, and other molecules that participate in the reduction of Au 3+ to Au 0 and stabilization of nanomaterials. Polyphenols adsorbed on AuMtNPs facilitate nanoparticle internalization. AuMt2 were located near the nuclear periphery, but for AuMt1, it was observed that nanoparticles distribute on the whole cell and present a 3 fold uptake in comparison to AuMt2. Due to the fluorescence property at low excitation power and a high cellular uptake, AuMtNPs synthesized with Mt bark extracts are candidates for its implementation as drug nanocarriers and fluorescent probes in cells. However, other strategies must be addressed, in order to reduce the nanomaterial toxicity. Finally, it was observed that AuMtNPs showed a relevant catalytic activity on MB degradation using NaBH4 as a reducing agent.
数据和材料的可用性
All datasets are presented in the main paper.
缩写
- ANOVA:
-
Analysis of variance
- AuMt:
-
Colloids formed by AuNPs and molecules of Mt
- AuNPs:
-
金纳米粒子
- CLSM:
-
共聚焦激光扫描显微镜
- DLS:
-
动态光散射
- DMEM:
-
Dulbecco’s modified Eagle medium
- DMSO:
-
二甲亚砜
- DPPH:
-
2,2-Diphenyl-1-picrylhydrazyl
- EDS:
-
Energy dispersive X-rays spectroscopy
- FTIR:
-
傅里叶变换红外光谱
- HAuCl4 :
-
Tetracloroauric acid
- HRTEM:
-
高分辨率透射电镜
- HUVEC:
-
人脐静脉内皮细胞
- MB:
-
Methylene blue
- Mt:
-
Mimosa tenuiflora
- MTT:
-
3-(4,5-二甲基噻唑基-2)-2,5-二苯基溴化四唑
- NaBH4 :
-
Sodium borohydride
- PBS:
-
磷酸盐缓冲盐水
- PdI:
-
Polydispersity index
- PMT:
-
Photomultiplier tube
- ROI:
-
Region of interest
- 标准差:
-
Standard deviations
- SPR:
-
表面等离子体共振
- TEM:
-
透射电子显微镜
- 紫外可见光:
-
紫外可见
- XPS:
-
X射线光电子能谱
- XRD:
-
X射线衍射
纳米材料
- 等离子纳米粒子
- 用于化学传感器的金纳米粒子
- 用于改进诊断和治疗应用的多功能金纳米粒子:综述
- 小型硒纳米晶体和纳米棒的简便合成和光学特性
- 涂有 CuS 纳米粒子的有色导电 CuSCN 复合材料的简便合成
- Au 纳米颗粒对 HT29 和 SPEV 细胞系影响的体外研究
- 水溶性α-NaGdF4/β-NaYF4:Yb,Er核壳纳米粒子的合成和发光特性
- 用于细胞内蛋白质递送的二氧化硅纳米颗粒:一种使用绿色荧光蛋白的新型合成方法
- 一维混合二元氧化物 CeO2-LaO x 支持的金催化剂的合成和 CO 氧化活性
- 铜纳米粒子合成和稳定方面的环保能力:催化、抗菌、细胞毒性和抗氧化活性
- 使用声悬浮快速合成 Pt 纳米晶体和 Pt/微孔 La2O3 材料
- 桔梗皂苷(桔梗)用于金和银纳米颗粒的绿色合成