

使用来自轧制废料的磁铁矿纳米吸附剂从水溶液中吸附去除铜 (II) 离子:合成、表征、吸附和动力学建模研究
摘要
本研究从氧化铁皮废料中提取磁铁矿纳米吸附剂(MNA),合成并应用于去除Cu 2+ 来自水溶液。使用常规研磨研磨氧化皮废料,并使用高能球磨 (HEBM) 进行 3、5 和 7 小时不同的研磨。在这方面,使用 X 射线衍射 (XRD)、高分辨率透射电子显微镜 (HRTEM)、场发射扫描电子显微镜-能量色散 X 射线光谱 (FESEM-EDS)、UV-Vis光谱、傅里叶变换红外 (FTIR)、Brunauer-Emmett-Teller (BET) 和 zeta 电位。所得的 MNA-7 h 球磨时间显示出晶体结构不规则形状为 11.23 nm,比表面积为 5.98 m 2 g −1 ,饱和磁化强度,Ms 8.35 emug −1 和等电点电荷在 pH 5.4。最佳吸附容量,q e 4.42 mg.g −1 用于去除Cu 2+ 在 120 分钟的接触时间达到实验数据最适合 Temkin 等温线模型。实验动力学研究与理论方面的比较表明,伪二级与实验趋势相匹配,相关系数为 (R 2 > 0.99)。此外,经过三个循环的可重用性研究后,再生效率达到了 70.87%。 MNA 提供了一种实用、高效、低成本的方法来重新利用氧化皮废料并提供超快速分离以去除 Cu 2+ 来自水。
介绍
水是自然界中最宝贵的自然资源之一,在所有生物的生存中起着至关重要的作用[1]。随着世界经济的革命和当代工业化的快速扩张,水污染的挑战变得更加严峻[2]。由于工业和人口路线产生的大量排放,重金属对生态环境的危害在全世界范围内急剧增加。不可生物降解的重金属毒性很大,容易在人体器官和其他生物体内积聚,破坏水质供应,给水生生物带来各种困难,导致多种疾病和紊乱[3,4,5] .特别是含有铜 (II) 离子 (Cu 2+ ) 由进入国内水域的人为途径产生的结果已证明对公共健康和环境造成问题 [6,7,8]。虽然 Cu 2+ 是人体和动物各种生物途径和代谢中的重要微量元素[9],大量食用高浓度会导致严重的毒理学影响,例如抽搐、痉挛、呕吐或同时死亡。例如,二价铜引起的污染会引发戏剧化、角化、手脚刺痛,并表现出致癌和致突变的影响 [10-12]。此外,过量消耗铜会引发氧化损伤和急性神经退行性综合征,包括肌萎缩侧索硬化、门克斯病、阿尔茨海默病和威尔逊病 [13, 14]。 Cu 2+ 对水体的污染 被认为是自 Cu 2+ 以来最普遍的环境公害之一 大量的工业活动中都含有这些化合物 [15]。相反,Cu 2+ 的缺乏 在动物营养中可能会导致腹泻、贫血和神经紊乱 [16]。世界卫生组织 (WHO) 规定了 Cu 2+ 的耐受水平 在饮用水中为 2 mgL −1 [17, 18]。此外,美国环境保护署 (USEPA) 将水中铜的最大可接受浓度固定为 1.3 mgL −1 [19]。因此,Cu 2+ 的水平 在日常饮食中,尤其是饮用水和废水中,应监测并减少到最小量,然后再释放到周围环境中[20]。
为了遏制这些对环境的有害影响,已经使用了许多废水修复方法,例如沉淀 [21]、离子交换 [22]、化学沉淀、共沉淀 [23]、膜处理 [24、25、82] ]、混凝[26]和吸附[3, 27–30]去除Cu 2+ 来自废水。在这些方法中,吸附因其极其方便、经济高效、易于操作、灵活、设计程序简单、简单、卓越的去除效果、更广泛的实用性和可回收性而备受青睐[10, 31-33]。因此,中心焦点已转移到开发包含多种官能团的新型吸附剂上,这些吸附剂可以加速 Cu 2+ 删除。
几种吸附剂可用于通过吸附从水中去除重金属,包括活性炭 [34]、农业生物质 [35]、金属氧化物 [36]、二氧化硅纳米材料 [37、38]、粘土矿物 [31、39、 40],其他 [41]。然而,这些吸附剂由于条件复杂或特定设备的改进和低吸附性而限制了更多的应用。此外,由于扩散不足、最小结合能力和活性表面位点不足,传统吸附剂显示出从大量溶液中回收目标金属离子的能力很弱 [42]。因此,探索具有更高吸附效率、大吸附表面积、最小扩散阻力、优异吸附能力和大体积溶液快速分离的低成本新型纳米吸附剂势在必行。
最近,已经使用了各种新的吸收剂,包括纳米材料、介孔材料、碳纳米管 (CNT)、离子涂层材料和磁性纳米粒子 [11, 43,44,45]。其中,纳米材料由于其生物、物理和化学特性、大的表面积与体积比、更高的金属离子吸附能力和优越的吸附能力而受到极大关注[46,47,48]。磁性纳米吸附剂具有很强的吸附气态或含水液体废物中污染物的倾向,近年来,这些磁性吸附剂在解决许多环境污染问题方面的应用越来越受到关注[11]。磁铁矿吸附剂是一种很有前景的低成本前驱体,具有高表面积、超顺磁性、高各向异性、高矫顽力、高活性低居里温度、易于分离、高磁化率、优异的回收和再利用能力、磁性吸引力属性等 [49, 50, 83]。此外,NPs 被认为对某些金属离子、阴离子、配体、阳离子和染料的吸附是有效的,因此它们的应用在吸附、回收或消除某些离子的创新领域中具有吸引力 [51,52,53] .
有鉴于此,可以推断,该研究利用当地可获得的工业磨碎的碎片中的磁铁矿纳米吸附剂,采用高能球磨技术去除Cu 2+ 来自水的资源相当有限,尽管其潜力巨大,但几乎没有得到应用。在这方面,本研究的重点是使用高能球磨法从氧化铁皮废料中合成新型磁铁矿纳米吸附剂 (MNA) 及其作为经济去除水中重金属铜 (II) 离子的应用。的水溶液。此外,还研究了从在废水处理中用作金属吸附剂的轧制废料中回收的 MNA 的表面动力学研究。精心建立和研究了MNA反应的动力学模型方程。
材料和方法
材料和化学品
在这项工作中,生铁屑废屑由位于马来西亚登嘉楼的钢铁厂供应。批次实验中使用的去离子水 (DI) 来自精制系统 Milli-Q 水。硝酸铜 (Cu(NO3)2) 购自 Aldrich(化学工业股份有限公司,中国),用于制备铜标准溶液 (1000 ppm)。 pH 5-SS(矛式pH测试仪)用于pH测量和搅拌实验。紫外-可见分光光度计 (HACH DR4000U) 用于分析 600 nm 波长下的铜浓度。使用标准程序(APHA,2005)[54] 测量初始铜浓度,并将剩余的大部分样品保存在 4 ℃ 的冷却器中。
磁铁矿纳米吸附剂 (MNA) 的合成
生的氧化皮废屑含有磁性颗粒和杂质(非磁性颗粒)。去除杂质以防止样品污染。图 1 描述了用于从研磨碎片合成磁铁矿纳米吸附剂 (MNA) 的方法。首先,使用去离子水对磨碎的碎片进行彻底清洗,并在 104 ℃ 下干燥 24 小时,然后使用传统的磨粉机将其粉碎成微米级。该过程稳定进行 48 小时,随后用磁分离技术 (MST) 净化所得的微型磁铁矿 (Fe3O4)。 MST 促进非磁性和磁性颗粒的分离。之后,将清洁后的微米磁铁矿在 104 ℃ 烘箱中干燥 48 小时,然后输送到密闭容器中。此外,强磁性颗粒与弱磁性颗粒通过居里温度分离技术(CTST)分离,如图 1 所示。该方法是根据 [55-57] 采用的程序。随后将分离的坚固磁性颗粒风干 24 小时,然后进行高能球磨 (HEBM) 三种不同的研磨时间,分别为 3、5 和 7 小时,以获得纳米级磁铁矿 [58]。
<图片>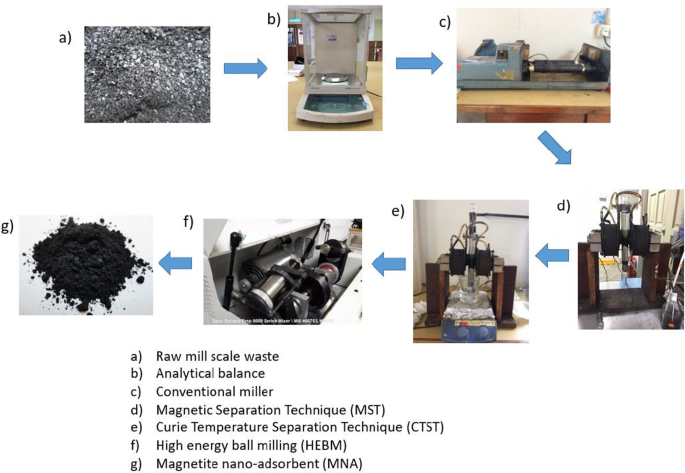
HEBM法合成磁铁矿纳米吸附剂的工艺流程
制备的纳米磁铁吸附剂 (MNA) 的表征
合成的吸附剂的结构形态通过 TEM/EDS 使用 Hitachi Co., Japan Model No. S3400N 进行分析。 FTIR 提供有关合成吸附剂上存在的官能团的信息。 Bruker-Tensor 27 IR 设备在 400–4000 cm −1 光谱范围内采用标准 KBr 颗粒方法 2 cm −1 分辨率确定了纳米磁铁矿吸附剂的 FTIR 光谱。使用 X 射线衍射 (XRD) 飞利浦专家衍射仪,使用 X 射线衍射 (XRD) 技术分析合成 MNA 的晶体结构和相,Cu Kα 辐射 (λ =0.154 nm) 在 2θ 范围内获得20 到 80°,扫描步长为 2θ =0.033,每步 5 秒作为计数。将观察到的 XRD 光谱与标准 ICSD 数据库进行比较。 MNA 样品的结构和形态组成是使用场发射扫描电子显微照片 (FESEM), JEM JEOL 2100, USA 和高分辨率透射电子显微镜 (HRTEM) 获得的。 Brunauer-Emmett-Teller (BET):Micromeritics II PLUS,美国,使用 NOVA2020e 自动表面积和孔隙度分析仪通过氮吸附-解吸来确定 MNA 的比表面积。在分析之前,MNA 在 100°C 下脱气。 zeta 电位测量使用 zeta sizer (Malvern ZS, UK) 进行。 zeta sizer 提供了几个 pH 值的滴定。使用振动样品磁强计 (VSM) 型号:LAKESHORE 7404,施加 0-13 kOe (kG) 的外场,对 MNA 粉末样品的磁性能进行了研究。
吸附研究
吸附测试使用分批系统进行。硝酸铜 (Cu(NO3)2) (50 mgL −1 ) 制备并稀释至合适的浓度。使用 0.1 molL -1 调节 pH HCl 或 0.1 molL -1 氢氧化钠。 Cu 2+ 的初始和最终浓度 基于制备的校准曲线,使用紫外-可见分光光度计 (UV-Vis)(型号:HACH DR4000U)在 λ =600 nm 处测定。所有吸附测试均使用 250 mL 烧瓶进行,向其中添加适量的吸附剂和 100 mL 离子溶液。使用 1 mg/L 初始浓度的 Cu (II) 离子和 0.5 g Fe3O4 进行动力学研究。温度和 pH 值分别保持恒定在 25°C 和 pH 值 7。在 200 mL 中,Cu (II) 离子的初始浓度为 10、20、30、40、50 mg/L。通过添加 HCl 和 NaOH,pH 值在 2、4、6、8、10 和 12 之间变化。初步研究表明,吸附过程在 180 分钟内达到平衡条件。为了研究影响吸附能力的剂量,使用了不同的 MNA 剂量,范围在 10 到 50 毫克之间。去除百分比 (%RE ) 和吸附容量 (q e) Cu 2+ 使用方程式确定离子。分别为 1 和 2 [59, 60]。
$$\% RE =\frac{{C_{o} - C_{e} }}{{C_{o} }} \times 100$$ (1) $$q_{e} =\frac{V}{ m}\left( {C_{o} - C_{e} } \right)$$ (2)其中 C o 和 C e , 代表初始和最终浓度 (mgL −1 ) 的解决方案,分别。 V 是以升为单位的溶液体积,m 是吸附剂的质量,单位为克 (g)。 q e (mg/g) 是 t 时刻每单位质量吸附剂的吸附量。
动力学研究
使用 Jar Tester 和 200 mL 铜溶液在 28 ℃ 恒温和 pH 5.4 下进行实验。在 0、10、20、30、40 和 50 分钟的不同时间间隔采集样品并使用 UV-Vis 进行分析。使用 Lagergren 伪一级和伪二级研究动力学模型。 Lagergren 的伪一阶在等式中描述。 (3):
$$q_{t} =q_{e} \left( {1 - e^{{ - k_{1} t}} } \right)$$ (3)其中 q e (mg/g) 和 q t (mg/g) 是平衡时和 t 时间的吸附量 , 分别, 和 k 1 (min −1 ) 是准一级吸附的速率常数。对于二级机理中的吸附速率,拟二级动力学速率方程可表示为方程(4):
$$q_{t} =\frac{t}{{\frac{1}{{k_{2} q_{e}^{2} }} + \frac{t}{{q_{t} }}} }$$ (4)其中 k 2 (gmg −1 .min −1 )为拟二级吸附的平衡速率常数。
再生研究
当活性孔位达到平衡时,通过溶剂解吸方法回收 MNA。 MNA 通过外部磁铁从水溶液中分离,随后浸入 HCL 溶液中并在 26 ℃下混合 180 分钟。然后用蒸馏水漂洗所得 MNA 以达到中性 pH,然后在 60°C 下保持 1 小时。然后,再生的 MNA 与之前的研究一起重新使用 [54, 55]。可重用效率 (RE%) 使用等式计算。 5:
$$RE =\frac{{q_{reg} }}{{q_{ori} }} \times 100\%$$ (5)其中 q reg 和 q ori分别为再生后和原始吸附剂的单位质量吸附量。
统计分析
对实验数据进行完全随机化设计,并通过 SAS 软件 9.4 版(SAS Institute Inc., Cary, NC)中的一般线性模型 (GLM) 程序使用单向方差分析 (ANOVA) , 美国)。 Duncan 多极差检验用于分离 p 处的均值 <0.05 显着性水平。
结果与讨论
结构和相分析
MST 和 CTST 后废料氧化皮的 XRD 检查结果如图 2a 所示。在 MST 工艺之后(图 2ai),XRD 证实了方铁矿 (FeO) 和磁铁矿 (Fe3O4) 的存在。在 36.33° (111)、61.40° (044)、73.25° (113) 的 2θ 处观察到方铁矿的布拉格衍射,与 ICSD 匹配:98–001-2335。在2θ为35.61°(113)和43.28°(004)处观察到磁铁矿相,同意参考Fe3O4 ICSD文件98-010-9826。
<图片>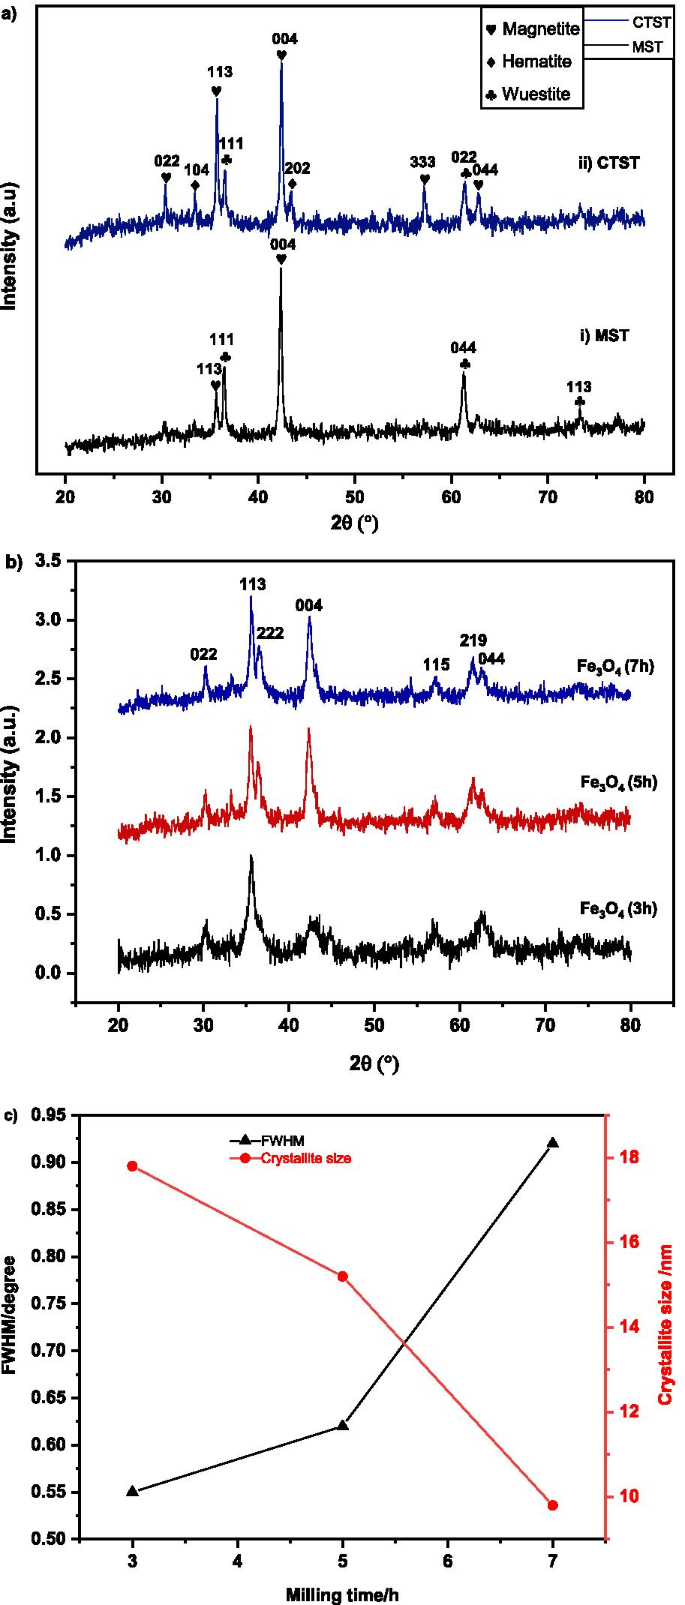
一 经过MST和CTST后氧化皮的X射线衍射图谱,b 在 3、5 和 7 小时的不同研磨时间下磁铁矿的索引光谱,c MNA的半峰全宽(FWHM)和微晶尺寸随球磨时间的变化
对于 CTST 工艺后的 XRD 谱(图 2aii),观察到磁铁矿、赤铁矿和方铁矿相的存在。所有峰的布拉格衍射角 (2θ) 是必不可少的识别和同意参考 ICSD 文件 98-010-9826 磁铁矿的峰是 30.23° (022), 35.61° (113), 43.28° (004), 57.24°(333),62.86°(044)。赤铁矿峰也在 33.44° (104)、48.48° (202) 处观察到,与 ICSD 98–004-6407 匹配);和 36.33° (111) 和 61.27° (022) 的方铁矿衍射角与 ICSD 匹配:98–001-2335。结果与前人文献[84]报道的结果一致。
图 2b 显示了在 3、5 和 7 小时的不同时间间隔内高能球磨过程后氧化皮粉末的 XRD 衍射图。合成样品的衍射光谱表明在所有研磨时间中都存在直径为纳米的磁铁矿 (Fe3O4) 相。 30.24°、36.66°、36.57°、42.45°、57.26°、61.54°和62.76°的2θ衍射角可索引为(022)、(113)、(222)、(004)、(224) (115) 和 (044) 分别证实了立方晶胞 Fe3O4 的特征峰。 XRD 谱与参考 ICSD 98-01-11,241 的磁铁矿相匹配,空间群为 Fd -3 米 和晶格参数 (a =b =c ) 的 8.3440 Å。如图 2b 所示,随着研磨时间的增加,纳米磁铁矿吸附剂表现出高纯度。小瓶中钢球碰撞产生的高能量负责破坏氧键并将赤铁矿 (Fe2O3) 还原为磁铁矿 (Fe3O4) 相。随着研磨时间的增加,观察到纳米晶磁铁矿的形成是通过 XRD 峰的加宽来确定的。随着研磨时间的增加,观察到 XRD 峰展宽增加,表明粒径减小。还观察到 XRD 峰强度随着研磨时间的增加而降低。该图案表明样品的粒径减小 [61]。随着粒径的减小,研磨过程中引起的应变导致峰强度降低和衍射峰变宽。平均晶粒尺寸D 使用 Debye-Scherrer 公式计算样品的数量,如等式。 (6) [62]。
$$D =\frac{0.9\lambda }{{\beta \cos \theta }}$$ (6)其中 D 是平均晶粒尺寸,λ 是 X 射线的波长 (0.1541 nm),β 是半高宽 (FWHM),θ 是衍射角。使用 X’pert Highscore Plus 软件自动分析 XRD 谱。 FWHM 和微晶尺寸的关系如图 2c 所示。分析表明,随着研磨时间从 3、5 和 7 小时的增加,微观 MNA 粉末的变化以及 FWHM 和 MNA 平均微晶尺寸的变化,如图 2c 所示。 FWHM 的变化趋势表明,随着研磨时间从 3、5 和 7 小时的增加,FWHM 呈现增加趋势。随着球磨时间从 3、5 和 7 小时增加,平均晶粒尺寸分别从最小值 17.8 nm、15.2 nm 和 9.8 nm 减小。
形态和微观结构组成
在 3、5 和 7 小时的不同研磨时间研磨的 MNA 的 HRTEM 显微照片如图 3 所示。显微照片显示 MNA 颗粒在三个研磨期间呈现出不规则的形状,如图 3 所示。此外,与 14.45 纳米(5 小时)和 19.16 纳米(7 小时)相比,在 3 小时研磨时间观察到平均 MNA 粒径为 5.53 纳米。这意味着可以在更短的研磨时间内获得更小的 MNA 粒径。 3、5 和 7 小时的平均粒径范围为 10 至 22 nm。随着研磨时间的增加,样品中的微应变也增加 [63]。因此,延长研磨时间会对样品产生更大的应变。晶格应变随研磨时间的增加是由于研磨过程中引入的晶格中的原子位错和扩散引起的强烈畸变效应。然而,由于磁铁矿粉末的磁吸行为,在 MNA 样品中观察到团聚效应,如图 3 所示。
<图片>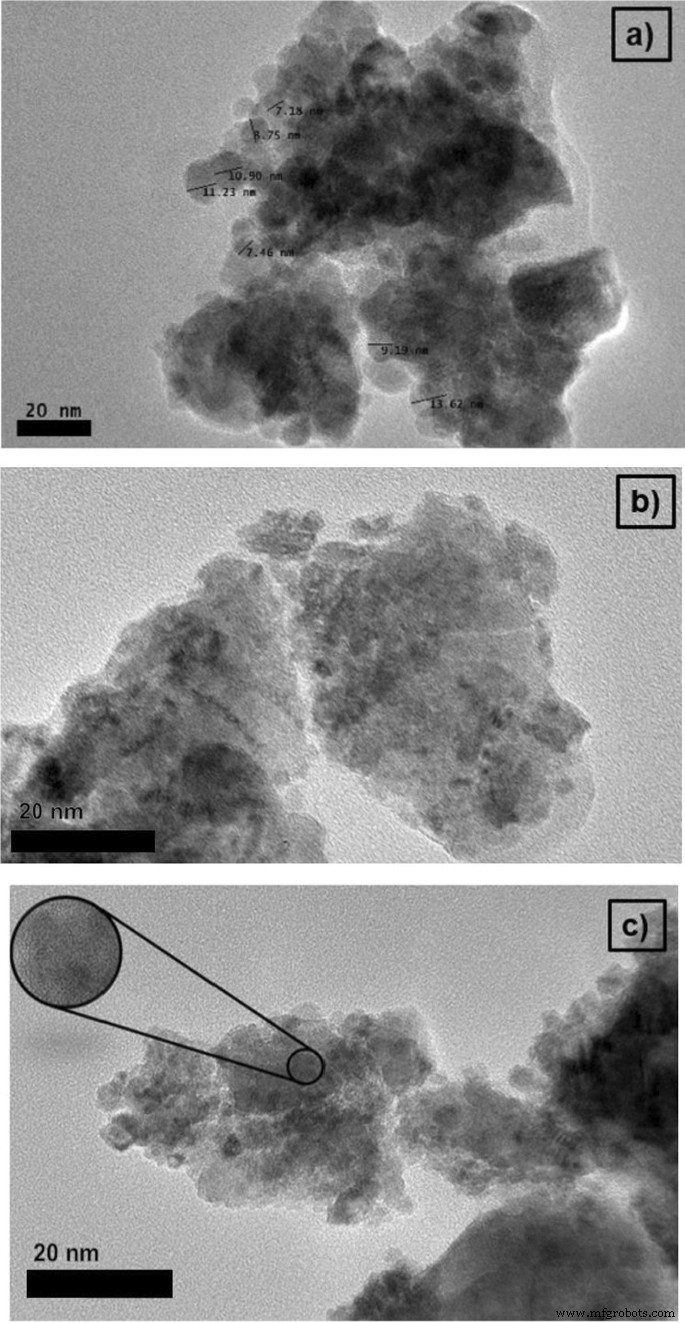
在 a 处具有 20 纳米 MNA 比例尺的 HRTEM 图像 3 h b 5 h 和 c 7 小时研磨时间
磁特性分析
在室温下使用 VSM 实验研究样品的磁性能。磁化响应(M ) 与外加磁场 (H ) 的样品如图 4 所示。饱和磁化强度 (M s), 剩磁 (M r) 和矫顽力 (H c) 样品汇总在表 1 中。 MNA 的矫顽力值在 200-270 G 的范围内,剩磁在 1.5 和 6.6 emu/g 之间,饱和磁化强度值在 21 和 27 emu/g 之间。由于粒径小于 20 nm,样品具有超顺磁性。从磁化参数(表 1)来看,这表明样品由有助于增加吸附容量的超顺磁性和铁磁性化合物的混合物组成。 MNA-7 小时样品显示出最高的磁参数(图 4),这有助于铜吸附研究(图 5)的最高吸附容量。
<图片>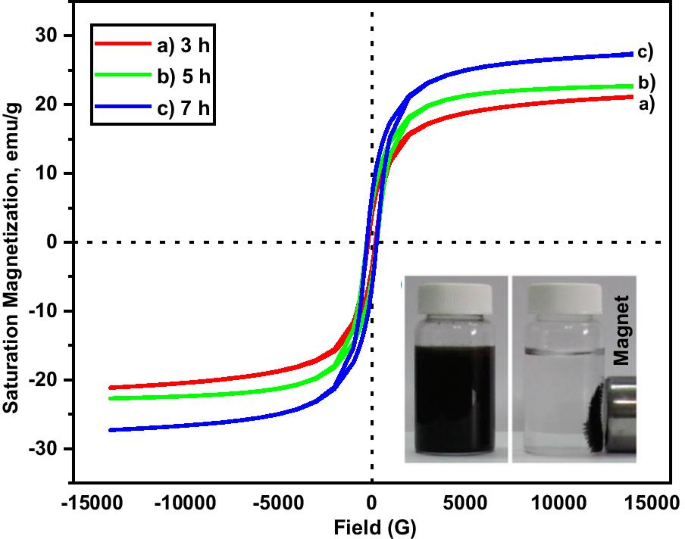
M-H 不同球磨时间样品的滞后曲线a 3 h,b 5 h 和 c 7 小时
<图片>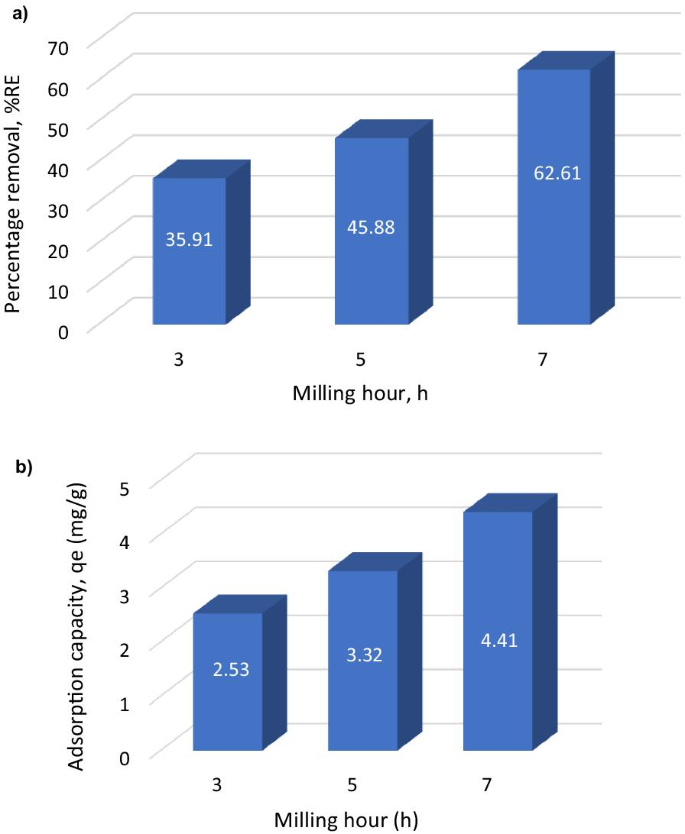
一 去除百分比条形图; b MNP对Cu 2+ 的金属吸收/吸附能力 在不同的研磨时间
吸附参数的影响
已经研究了对 MNA 3、5 和 7 小时的批量吸附研究的进一步分析。图 5 显示了在 3、5 和 7 小时的不同研磨时间对 MNA 进行的吸收研究。该图显示了最高的吸附容量(金属吸收)(q e) 和最高去除率 (%RE )。 MNA-7 小时研磨时间显示出最高的吸附能力和最高的水溶液去除百分比。因此,选择MNA-7 h作为MNA纳米吸收剂,对接触时间、初始浓度、吸收剂用量、表面积、pH值和温度等几个参数进行批量吸收分析。
表面积分析
使用 BET 的氮吸附用于评估 MNA 7 小时研磨的表面积和孔隙特征。图 6a 显示了 MNA-7 小时的 BET 结果,平均孔体积为 0.011 cm 3 g −1 比表面积为 5.98 m 2 g −1 . MNA-7 h 的 N2 吸附-解吸曲线位于 III 型滞后曲线(图 6b)中,与 Sing 等人先前报道的一致。阿尔。 (1985) [65]。 BET 结果描述了吸附分子聚集在 MNA 表面周围的吸附剂 - 被吸附物相互作用 [66]。因此,III型吸附表明气体分子被物理吸附在MNA上[67]。
<图片>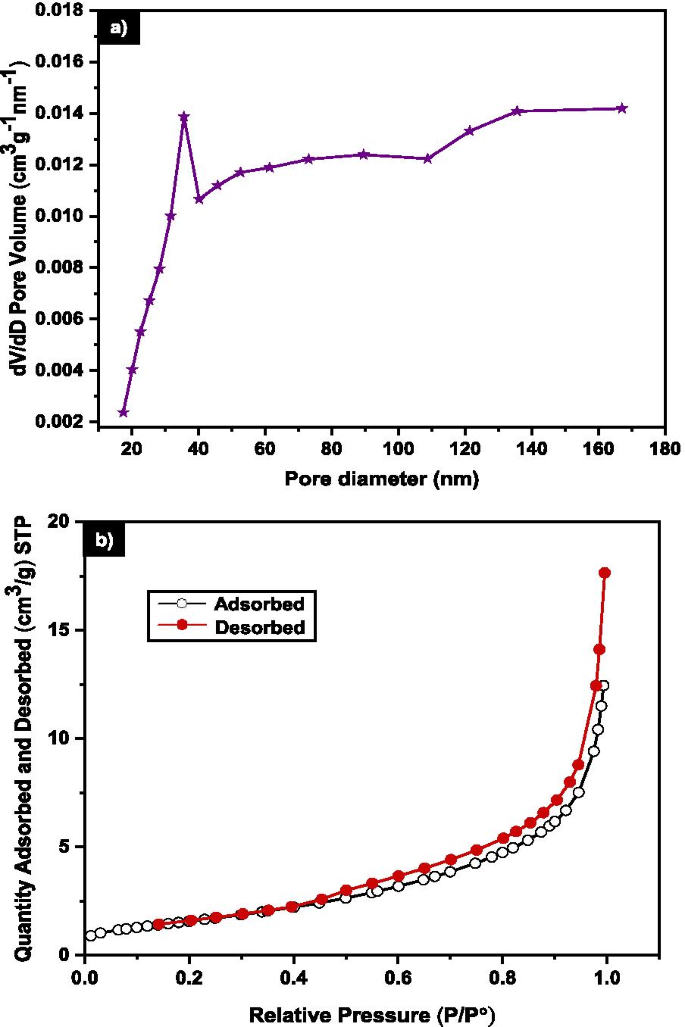
一 7 h MNA 的孔径分布b 氮吸附-解吸等温线
EDS 分析
MNA-7 h 的元素成分如图 7 所示。FESEM 和 EDS 分析显示,吸附过程前 MNA-7 h 元素 Fe 和 O 的存在百分比分别为 78.25% 和 21.75%(图 7)。 7a)。图 7b 描绘了吸附过程后元素 Fe、Cu 和 O 的 EDS 光谱。谱图中铜的存在表明对Cu 2+ 的吸附 由 MNA。这种趋势也与 Lingamdinne 等人报告的研究中显示的光谱一致。 (2016) [64] 氧化铁纳米颗粒用于吸附去除重金属。
<图片>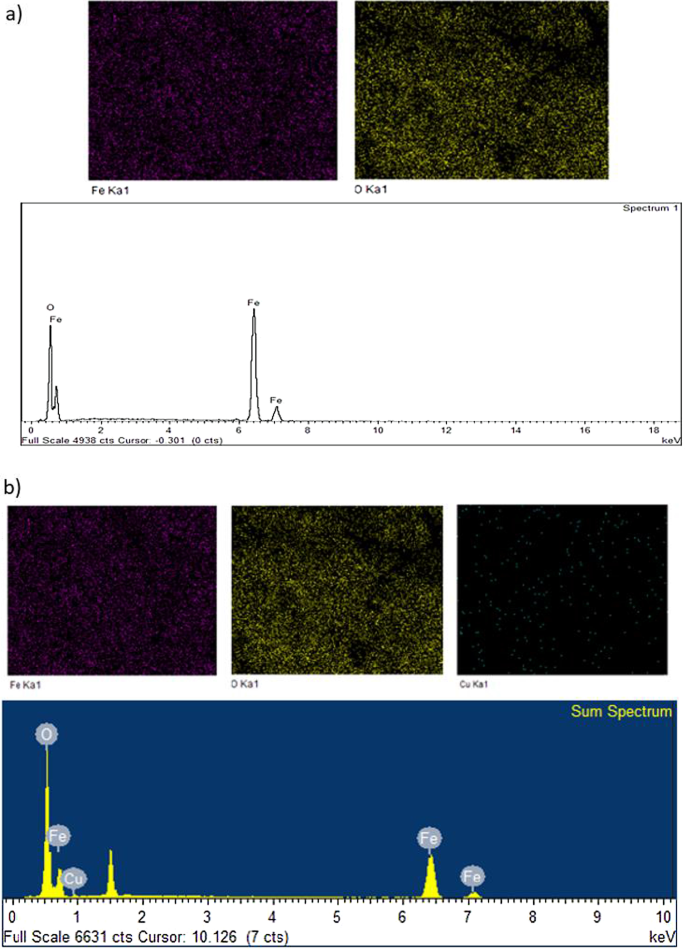
EDS 频谱分析 (a ) 在吸附之前和 (b )吸附Cu(II)离子后
FTIR 分析
还通过 FTIR 分析进一步确认了 MNA-7 h 上的 Cu 吸附。 FTIR 用于鉴定 Cu 2+ 的官能团和连接 到 MNA。图 8 显示了吸附 Cu (II) 离子前后 MNA-7 小时的 FTIR 光谱。 FTIR 光谱揭示了 Fe3O4 纳米颗粒的强特征峰带。吸附后的 FTIR 光谱显示谱带强度在 500-600 cm -1 范围内发生变化 和 2800–3600 厘米 −1 导致 Cu 2+ 吸附。此外,525 cm −1 处的吸附带 和 576 厘米 −1 代表 Fe-O 带磁铁矿纳米粒子的四面体和八面体位点 [68]。在 3478 cm −1 处的强而宽的吸附光谱 对应于羟基 (- OH) 和 MNA 表面的微量水分子 [69]。 FTIR光谱表明,由于MNA表面吸附了少量化学物质,因此MNA具有晶体结构。
<图片>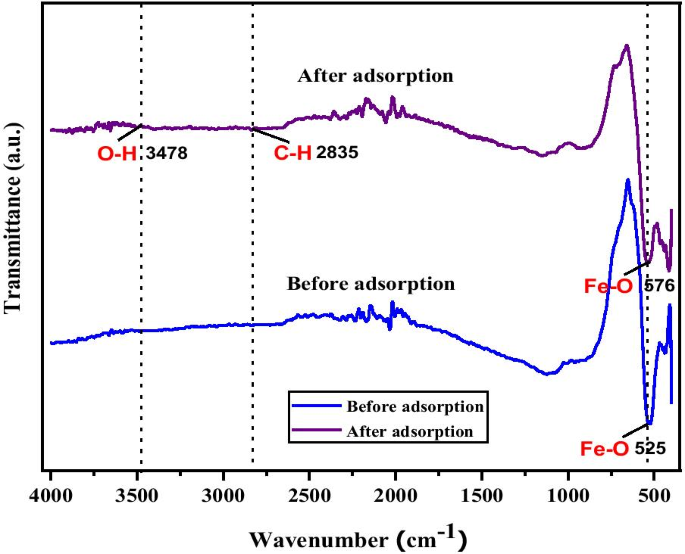
MNA-7 h吸附Cu(II)离子前后的傅里叶变换红外光谱
Zeta 电位分析
图 9 显示了 MNA-7 h 的表面 zeta 电位。对 Zeta 电位进行了研究,以准确准确地确定吸附过程中发生的中和电荷。 Zeta 电位数据为监测 Cu 吸附过程中的最佳吸附剂剂量提供了一个可测量的值。结果表明,等电点 (pHpzc) 出现在 pH 5.4,即 Cu 2+ 发生在 MNA 上的吸附处于最佳状态。在水溶液中,氧化铁的表面被OH - 覆盖 由于质子化或去质子化过程,表面上的 FeOH 可以变成其他 Fe 官能团,如 FeO 或 FeOH2 [70, 71]。质子化和去质子化的平衡取决于溶液的 pH 值和吸收剂的 pHpzc。 zeta电位结果表明在pH为5.4时吸附有效。
<图片>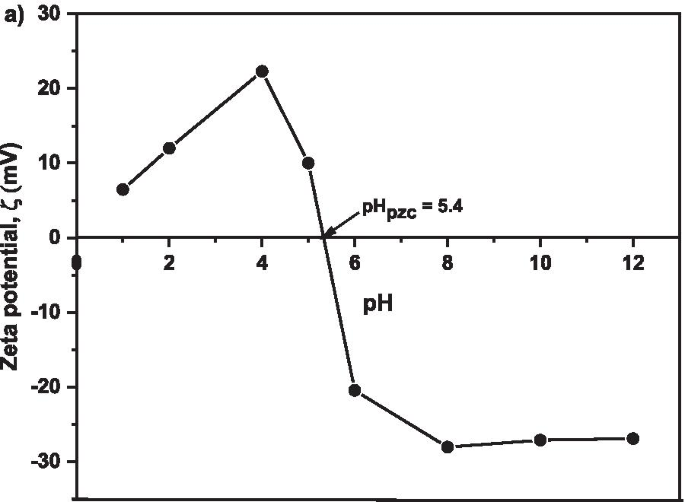
MNA-7 h 的 pH 值为 1、2、4、6、8、10 和 12 时的 Zeta 电位
批量吸附分析
接触时间的影响
图 10a 显示了接触时间对 Cu 2+ 吸附容量和速率的影响 250 分钟后摄取到 MNA。很明显,在较长的接触时间,吸附容量达到平衡,因为 pH 值保持在 5.4,吸附剂剂量保持在 0.05 g。如图 10b 所示,获得的最大去除效率为 62.61%。 Cu 2+ removal efficiency surges rapidly from the early first 5 min, and later slower and stable throughout the adsorption process. This is attributed to the fact that the rate of the adsorption capacity was high due to the abundant free binding and active sites of the Cu 2+ . Based on Fig. 10, it was noticed that the percentage removal and adsorption capacity increased rapidly with the increase in contact time at the initial stage. The contact time has a substantial influence on the efficacy of Cu 2+ removal and adsorption capacity. Increase in contact time from 0 to 240 min led to an increase in the removal efficiency of Cu 2+ from 0.81% to 62.61%. For contact time greater than 120 min, the removal efficiency of Cu 2+ remains steady, as the active sites has been saturated on the surface of the adsorbent. Similarly, the highest adsorption capacity of 4.41 mg/g was attained at 120 min of contact time. Thus, the equilibrium time was attained at 120 min.

一 Adsorption capacity; b Copper removal efficiency under various contact times of MNA-7 h (metal solution:200 mL; temperature:25 °C; initial pH:5.4; initial concentration:50 mg/L; adsorbent dosage:0.05 g)
The results of copper removal efficiency follow a definite trend (Table 2). It shows that the higher the time, the more the removal efficiency. There were significant differences (p < 0.05) among the removal efficiencies under varying contact times. Generally, as contact time progresses, the removal efficacy also improves. Table 3 shows the percentage of the copper removal at different adsorbent dosages. The result shows that as the time progresses, the removal percentage increases. 0.05 g adsorbent dosage recorded the highest copper removal efficiency (62.58 g) after 120 min contact time.
Effect of Initial Concentration
Figure 11 shows as the initial concentration increases, the equilibrium adsorption capacity also increases. Thus, the higher initial concentration due to 0.05 g adsorbent in the Cu 2+ solution to fill the active sites on the adsorbent and the quantity of copper adsorbed increases with the increase in Cu 2+ concentration [83]. The initial concentration of Cu 2+ increased from 10 mg/L to 50 mg/L with corresponding increase in adsorption capacity from 0.04 mg/g to 4.41 mg/g, which in turn provide a higher driving force for the ions from the solution to the adsorbents, resulting in more collisions between Cu 2+ and active sites on the MNA-7 h. Since nearly all the adsorption sites of MNA-7 h existed on their exterior, it is easy for the adsorbate to access these active sites, thereby facilitating a rapid attainment of equilibrium condition.

Copper removal efficiency under various initial concentration of MNA-7 h (metal solution:200 mL; temperature:25 °C; initial pH:5.4; adsorbent dosage:0.05 g)
Effect of MNA Dosage
Adsorbent dosage plays an important role during the adsorption process, as it controls the ability of the adsorbent for a given solution. The more the dosage, the more obtainable site for sorption to occur [67]. Figure 12a shows the adsorption capacity, q e of Cu 2+ with respect to different dosages of MNA-7 h at 0.05 g, 0.2 g, 0.5 g, and 0.8 g, respectively. The adsorption capacity was observed to be dependent on adsorbent dosage, which determines the availability of the active sites and the amount of the surface area for adsorption. This is due to the increase in surface area and the probability of collision and interaction between the particles of nano-adsorbent and Cu 2+ [72]. As shown in Fig. 12b, at 0.05 g dosage, 62.61% copper removal efficiency and 4.41 mg/g of adsorption capacity were recorded. The Cu 2+ removal increases sharply and becomes stable as the adsorbent dosage increases. As the adsorbent dosage increases, the larger surface interaction and the agglomeration effects develop. Thus, it causes a decrease in free specific area per unit mass of MNA surface, causing a reduction in contact surface with the adsorbate surface. This will lead to the decrease in q e and %RE. Besides, the decrease in q e and %RE , perhaps was due to the saturation of Cu 2+ in solution with respect to available adsorption binding sites [73]. Thus, a higher amount of adsorbent causes an aggregation which decreases the total surface area of the MNA, thereby leading to a decrease in adsorption capacity [74–76]. The aggregation could result to a decrease in total surface area of the adsorbent and an increase in diffusion path length [75].

一 Adsorption capacity; b Copper removal efficiency under various adsorbent dosage of MNA-7 h (metal solution:200 mL; initial concentration:50 mg/L; temperature:25 °C; initial pH:5.4)
Effect of pH
The removal of Cu 2+ from the aqueous solution through adsorption is highly dependent on the solution pH which determines the surface charge of the adsorbent and the adsorbate speciation [77]. Adsorption is regarded to be minimal at acidic state owing to higher concentration of H3O + which competes with the positively charged ions for the actively binding site on the adsorbent surface, and this usually led to low contaminant removal [77, 78]. The influence of pH on the adsorption of Cu 2+ on MNA was evaluated between the pH range of (2–12). Figure 13 shows the effect of pH on the adsorption capacity and removal efficiency of Cu 2+ . It was observed that increase in pH from 2 to 5.4, results in an increase in adsorption capacity from 0.58 mg/g to 4.408 mg/g and percentage removal of copper from 10.71% to 62.61%, respectively. However, the equilibrium adsorption capacity of Cu 2+ is low at a strong acidic condition recording 0.58 mg/g at pH 2 due to the presence of a high percentage of H3O + ion which competes with Cu 2+ at the sorption sites of MNA. Besides, when pH is higher than 5.4, the adsorption capacity decreases from 49.32% to 44.69%. At a higher pH, higher concentration of OH − causes a decrease in the adsorption rate. Figure 13a and b shows that pH has a significant impact on Cu 2+ adsorption capacity and removal percentage (%RE ) of Cu. The removal rate for Cu 2+ increases with an increase in pH, from 10.71% to 28.04% and to 62.61% when pH is at 2, 4 and 5.4, respectively, before declining to 49.32%, 42.56% and 44.69 at pH 8, 10 and 12, respectively (Fig. 13a).

一 Adsorption capacity; b copper removal efficiency under various pH of MNA-7 h (metal solution:200 mL; initial concentration:50 mg/L; temperature:25 °C; adsorbent MNA dosage:0.05 g)
Similarly, the adsorption capacity also increases from 10.71% to 62.61% with the increase in pH from 2 to 5.4 and decreases until it reaches pH 12. At pH 2 and 4, the amount of protonation of the adsorbent surfaces results in a decrease in Cu 2+ 吸附。 The results also are in agreement with zeta potential graph as indicated in Fig. 9. Also, Fig. 9 describes the net charge of the MNA adsorbent surface at different pHs, with the point of zero charges (pHpzc). As the pH increases, the H + ion is lower and causes the surface of the adsorbent to become negatively charged, with the increase in %RE of Cu 2+ , thereby increasing the electrostatic attraction force between the adsorbents in the solution [79]. Therefore, pH influences the surface zeta potential of MNA. The surface functionality of iron oxides varies depending on the nature of iron oxides and the pH value.
Copper Adsorption Kinetics
Kinetic studies are essential in the adsorption process to describe the uptake rate performance of MNA-7 h and influence the residual time for the entire adsorption process. The adsorption kinetics of Cu 2+ on MNA-7 h was determined using similar procedures to those used in the batch adsorption studies [55]. The Lagergren’s first-order kinetic model and second-order kinetic model for the removal of Cu 2+ at various initial concentrations from the aqueous solution using MNA at 0.05 g/L of the MNA dosage are shown in Fig. 14. The calculated q e values are in agreement with the theoretical values, and the graph shows good linearity with R 2 above 0.96. Therefore, the adsorption kinetics follows the pseudo-second-order model. The pseudo-second-order model represents the adsorption kinetics, involving donation or electron exchange between adsorbate and adsorbent. Table 4 shows the fitted parameter summary of Cu 2+ kinetics at different initial Cu 2+ concentrations (q e :mg/g, k 1 :min −1 , k 2 :g/mg/min) of MNA-7 h. For the parameters of initial concentration, C i (mg/L), adsorption capacity, q e (mg.g −1 ), k 2 is the rate constant of pseudo-first-order, k 2 is rate constant of pseudo-second-order, and the R 2 is the correlation coefficient. Two kinetic models:Lagergren’s first-order and pseudo-second-order order were applied to further study the rate of adsorption process for Cu 2+ . The kinetic parameters of pseudo-first-order and pseudo-second-order are presented in Table 4. According to Table 4, pseudo-second-order was best fitted for the adsorption of Cu 2+ . Pseudo-second-order revealed a higher correlation coefficient of R 2 = 0.999, for Cu 2+ removal.

一 Lagergren’s first-order kinetic model; b Pseudo-second-order kinetic model for the removal of Cu (II) ions at various initial concentrations from the aqueous solution using MNA at 0.05 g/L dosage of MNA-7 h
Copper Adsorption Isotherms
The adsorption isotherms experimental data were investigated using Freundlich isotherm model (Eq. 7) and Temkin isotherm model (Eq. 8). The adsorption isotherm is illustrated in Fig. 15a and b. The Freundlich isotherm is expressed as:
$$q_{e =} K_{F} \times C_{e}^{1/n}$$ (7) $$qe =B\log kt + B\log C_{e}$$ (8)where q e is adsorbent capacity at equilibrium (mg/g); B :(RT /b ) is the Temkin constant related to heat of adsorption (J/mol) R is universal gas constant (8.314 J/mol K); T is absolute temperature (K); 1/b indicates the adsorption potential of the adsorbent; kt is equilibrium binding constant corresponding to the maximum binding energy (L/mg); and Ce is adsorbate concentration at equilibrium (mg/L). From the graph, the straight line emerged, and the values of q m and K L constants can be calculated using the slope and the intercept of the straight line. Freundlich and Temkin models was used to examine the relationship between the adsorbent and adsorbate. As shown in Fig. 15, the initial concentrate correlation coefficient with an R 2 value of 0.914 and manifested Temkin adsorption isotherm to be more favourable for the removal of copper. The synopsis of the isotherm parameter of Freundlich, Temkin parameter with correlation coefficient, R 2 for adsorption of Cu (II) on MNA-7 h at room temperature is depicted in Table 5. 1/n constant reciprocal implies natural sorption; therefore, the adsorption process is beneficial. The values of n, 1/n , K F, and R 2 for the current work are also presented in Table 5. Temkin isotherm adsorption plot shows maximum Cu 2+ removal by MNA-7 h at optimal conditions and reveals the feasibility of the process. The data prove that the Temkin model well fitted the experimental data than Freundlich based on the correlation coefficient, R 2 (Table 5). This could be due to the fact that the Temkin isotherm model considers the effect of indirect adsorbate on the adsorption process and assumes that the heat of the adsorption of molecules decreases linearly in the adsorption layer [80].

一 Linearized Freundlich; b Linearized Temkin isotherm models for Cu 2+ adsorption by MNA-7 h at various adsorbent dosages:contact time 240 min; initial pH 5.4; room temperature
Regeneration and Desorption Study
The reusability of adsorbent is a prime issue since periodically regenerating adsorbent is strongly desirable for industrial applications [81]. In the reusability tests, the adsorption and desorption cycle of Cu 2+ onto MNA was repeated three times. The adsorption capacity of MNA was recycled, and the regeneration of the MNA of the adsorption–desorption cycle of Cu 2+ was repeated three times using the same MNA. The desorption process was studied for 3 cycles of MNA-7 h. The results proved that the magnetic nanoparticles have higher sustainability for industrial applications. The results also revealed that Cu 2+ could be desorbed from the adsorbent in the presence of deionized water as the desorbing agent. For repeated use of MNA, the adsorbed Cu 2+ were desorbed under suitable conditions. In this work, the percentage of desorption by MNA was obtained by 0.1 M HCl as shown in Table 6. Hence, MNA exhibits an enhanced recovery efficiency of 70.87%. Figure 16 displays the desorption efficiency of MNA. The adsorption capacity decreased by 10% during three adsorption–desorption cycles which indicates the stability and reusability of MNA.

Desorption of copper onto MNA-7 h in three cycles
Conclusions
Novel magnetite nano adsorbent (MNA) from mill scale waste has been successfully synthesized via conventional milling technique and impacted by high-energy ball milling procedure at varying milling time. The high-energy ball milling (HEBM) at 3, 5 and 7 h successfully produced the MNA in the range of 10–25 nm, as confirmed by HRTEM. The HEBM technique was used to reduce the microcrystalline size to nano-sized particles showing the potentials of MNA as an efficient precursor for Cu 2+ removal in an aqueous solution.
VSM results showing the MNA-7 h possess the highest magnetization property and indicate the best absorbent, with the specific surface area of 5.98 m 2 g −1 and the average pore size of 8.01 nm thereby showing the better adsorption capacity. The adsorption of Cu 2+ on MNA-7 h was confirmed by EDS and FTIR analysis. For the adsorption studies, pH at 5.4, dosage of 0.05 g and 240 min of contact time, the highest adsorption capacity, q e and removal efficiency of 4.408 mgg −1 and 62.61% were achieved. Also, at the initial concentration of 50 mgL −1 Cu 2+ , the q e of 4.41 mgg −1 was recorded. The reusability efficiency of 70.87% was attained even after three cycles of reapplications and desorption. The Temkin adsorption isotherm fits best with a correlation coefficient, R 2 of 0.91. Based on these findings, it can be inferred that MNA is a promising precursor for Cu 2+ removal.
Availability of data and materials
The datasets generated during and/or analysed during the current study are available from the corresponding author on reasonable request.
纳米材料
- 氧化铜纳米颗粒对大肠杆菌的生物合成、表征和抗菌潜力评估
- 二氧化硅气凝胶负载的水锌矿和碳酸盐插层水滑石通过沉淀转化反应高效去除 Pb(II) 离子
- 使用烷醇胺水溶液高效液体剥离氮化硼纳米片
- 钯(II)离子印迹聚合物纳米球的制备及其从水溶液中去除钯(II)
- 铜纳米粒子合成和稳定方面的环保能力:催化、抗菌、细胞毒性和抗氧化活性
- 改性 BiOCl 的合成和表征及其在从水溶液中吸附低浓度染料中的应用
- 使用声悬浮快速合成 Pt 纳米晶体和 Pt/微孔 La2O3 材料
- 桔梗皂苷(桔梗)用于金和银纳米颗粒的绿色合成
- 使用木材固有结构作为天然模板的纯铜纳米结构的合成和表征
- 超长细铜纳米线的简便合成及其在高性能柔性透明导电电极中的应用
- Fe3O4@C 混合纳米粒子的水热合成和磁性吸附性能以去除水溶液中的重金属离子
- 单分散 CoFe2O4@Ag 核壳纳米粒子的一锅法合成及其表征