

改性 BiOCl 的合成和表征及其在从水溶液中吸附低浓度染料中的应用
摘要
BiOCl和Fe 3+ 的合成与表征 据报道,接枝的 BiOCl (Fe/BiOCl) 可作为有效吸附剂去除阳离子染料罗丹明 B (RhB) 和亚甲蓝 (MB) 以及阴离子染料甲基橙 (MO) 和酸性橙 (AO) 0.01~0.04 mmol/L低浓度水溶液。各种技术的表征表明 Fe 3+ 接枝诱导更开放的多孔结构和更高的比表面积。带负电荷表面的 BiOCl 和 Fe/BiOCl 对阳离子染料均表现出优异的吸附效率,在 BiOCl 上可在 3 分钟内急剧达到 99.6 和接近 100%,在 Fe/BiOCl 上去除 RhB 和 MB 时在 10 分钟内可达到 97.0 和 98.0%,分别。然而,Fe/BiOCl 对离子染料的吸附能力高于 BiOCl。综合研究了初始染料浓度、温度和pH值对吸附容量的影响。 RhB的吸附过程符合Langmuir吸附等温线和准二级动力学特征。所制备的吸附剂对阳离子染料的优异吸附能力是基于静电引力以及开放的多孔结构和高比表面积而合理化的。与Fe/BiOCl相比,BiOCl对混合染料溶液中的阳离子染料显示出更高的选择性。
背景
由有毒染料、有机污染物和金属离子污染水体造成的严重环境危害已经引起人们的注意[1,2,3,4]。排放的废水大多有毒,不可生物降解,对人类健康和海洋生物有害。因此,必须从废水中去除污染物,以解决生物、生态和环境问题。各种技术,包括离子交换 [5]、吸附 [6, 7]、化学沉淀 [8]、高级氧化 [9,10,11]、生物降解 [12, 13] 和光催化 [14,15,16]尝试去除废水中的污染物。该吸附法操作简便、效率高、经济可行且环境友好[17,18,19],因此被认为是有效去除废水中污染物的竞争途径。
氯氧化铋 (BiOCl) 作为一种光催化剂,最近引起了很多关注 [20,21,22,23,24,25]。然而,其对废水中染料或有机污染物的优异吸附能力引起了很少的关注 [26,27,28]。众所周知,吸附能力受吸附剂的形态、粒径和组成的影响很大[29]。 BiOCl 的代表性形态是三维 (3D) 分层花状微观结构。这种特殊的多孔结构和 3D 分层花状形态的大表面积对吸附过程非常有益 [28, 30, 31]。表面改性是提高吸附剂吸附能力的通用技术。余等人。 [32] 通过在 BiOCl 外部连接 CTAB 提高了 BiOCl 对染料刚果红 (CR) 和活性红 3 (X3B) 的吸附能力,对 CR 和 X3B 的最大吸附能力分别为 901 和 699 mg/g , 分别。 Sohn [29] 通过 Ti 负载路线提高了 BiOI 去除甲基橙 (MO)、罗丹明 B (RhB) 和亚甲蓝 (MB) 染料的吸附能力。 BiOCl 的吸附能力也可以通过引入碘来增强,当 I/Cl 摩尔比为 0.5 时,对羟基苯乙酸(p-HPA)达到最大吸附值,并随着 I/Cl 摩尔比的进一步增加而降低 [33 ].
在这项工作中,我们通过 Fe 3+ 成功合成了 3D 分层 BiOCl 微结构 -修改方法。分别选择浓度为 0.01~0.04 mmol/L 的阳离子染料(RhB 和 MB)和阴离子染料(MO 和酸性有机物,AO)来检查合成的 BiOCl 和 Fe 3+ 首次接枝 BiOCl (Fe/BiOCl),尽管它们的光催化性能已有报道[34]。还研究了它们的混合染料吸附效率。此外,还讨论了各种反应参数,包括 pH 值、反应温度和初始浓度,对 BiOCl 和 Fe/BiOCl 吸附能力的影响。为了彻底了解吸附过程,研究了吸附等温线和动力学特征,并提出了吸附剂结构与染料吸附容量之间的关系。该工作不仅为构建具有增强吸附能力的吸附剂提供了新思路,而且有利于更好地理解吸附剂结构与染料吸附能力之间的关系。
方法
BiOCl 和 Fe/BiOCl 的合成
Bi(NO3)3·5H2O、Fe(NO3)3·9H2O、KCl和甘油为分析级化学品,均购自上海化学工业有限公司,均为原料,未经进一步纯化。
在 BiOCl 的典型程序中,0.776 g Bi(NO3)3·5H2O 在磁力搅拌下溶解在 76 mL 甘油中(溶液 A),0.12 g KCl 溶解在 4 mL 去离子水中(溶液 B)。随后,将获得的 KCl 溶液与溶液 A 混合并转移到衬有聚四氟乙烯的不锈钢高压釜中。高压釜在 110°C 下加热并在此温度下保持 8 小时。通过离心收集所得沉淀,用乙醇和去离子水洗涤数次并在80°C下干燥。最后,将粉末在 400°C 下煅烧以获得纯 BiOCl 粉末。 Fe/BiOCl的制备过程与BiOCl的制备过程相同,只是在溶液A中加入了不同数量的Fe(NO3)3·9H2O。最终产物记为Fe/BiOCl (x ),其中 x 表示Fe/Bi的摩尔比。
特征化
X 射线粉末衍射 (XRD) 图案在 X 射线衍射仪 (Empypeanp Panalytical) 上用 Cu Kα 辐射 (λ =0.154 纳米)。详细的形态和结构是通过透射电子显微镜 (TEM) 和高分辨率 TEM (HRTEM) 在 JEM-2010 显微镜上以 200 kV 操作的。扫描电子显微镜 (SEM) 图像记录在 Hitachi S-4800 设备上,加速电压为 15 kV。通过 X 射线光电子能谱 (XPS) 分析样品的化学成分和表面状态,该分析在 Thermo Escalab 250Xi 光电子能谱仪上进行,采用单色 Al Kα (hv =1486.6 eV)。 N2 吸附-解吸等温线是在 Micrometrics ASAP 2020 操作的 77 K 下测量的。在测量之前,合成样品在 180 °C 的真空中脱气 8 小时。比表面积通过Brunauer-Emmett-Teller(BET)方法计算;样品的孔径分布是通过使用 Barrett-Joyner-Halenda (BJH) 模型从等温线的解吸分支得出的。使用DelsaTM Nano Zeta Potential测量样品的zeta电位,检测不同pH值下的表面电荷。
吸附能力测试
吸附实验在室温避光下进行。选择MB和RhB的阳离子染料以及MO和AO的阴离子染料作为典型的有机染料来检查BiOCl和Fe/BiOCl的吸附能力。在典型的吸附实验中,在磁力搅拌下,将 50 mg 制备好的样品分别加入 50 mL 浓度范围为 0.01~0.04 mmol/L 的各种染料溶液中。在每个给定的时间间隔,取出 3 mL 悬浮液并离心以除去固体粉末。使用紫外-可见分光光度计(Hitachi U-3900)测定剩余染料的浓度。
残留染料百分比可以使用方程计算。 (1):
$$ \mathrm{residual}\ \mathrm{percentage}\ \left(\%\right)=\frac{C_{\mathrm{t}}}{C_0}\times 100\% $$ (1)t时刻吸附的染料分子量 使用公式计算。 (2):
$$ {q}_t=\frac{\left({C}_0-{C}_t\right)V}{m} $$ (2)其中 C 0 和 C t (mg/L) 是染料分子在初始和任何时间 t 的浓度 , 分别; q t 是在 t 时间每单位吸附剂上吸附的染料分子数量 (毫克/克); V 是染料溶液的体积 (L );和 m 为吸附剂重量(mg)。
研究了吸附时间、染料初始浓度、温度和pH值等实验参数的影响,以优化吸附过程。
还进行了 BiOCl 和 Fe/BiOCl 吸附剂的可回收性。对于染料解吸,将 50 毫克 BiOCl 和 Fe/BiOCl 加入 50 毫升 NaOH 乙醇溶液 (0.01 M) 中,然后分别搅拌 60 分钟。随后,收集吸附剂,用水彻底洗涤并干燥。所得产物用于下一个吸附循环。
结果与讨论
材料表征
图 1a 显示了具有不同 Fe/Bi 摩尔比的 BiOCl 的 XRD 图。纯 BiOCl (Fe/Bi =0) 的所有峰都与四方 BiOCl (JCPDS 06-0249) 非常吻合,没有观察到其他 XRD 峰。随着 Fe/Bi 摩尔比的增加,XRD 峰变得更强、更尖锐。注意到在 2θ 范围内没有观察到新的峰 =20~35°(图 1b)。众所周知,Fe 3+ 很容易水解形成(氢)氧化物,然后逐渐转化为结晶氧化铁 [35, 36]。然而,在 Fe/BiOCl (x ),即,尽管样品在 400°C 下热处理了 3 小时,但在我们的样品中并未形成氧化铁。此外,Fe/BiOCl (x ) 与纯 BiOCl 相比没有变化,这表明 Fe 3+ 离子未结合到 BiOCl 的晶格中 [37, 38]。因此,可以得出结论,铁主要以高度分散的 Fe 3+ 形式存在。 在BiOCl的表面或晶格中形成而不是氧化铁或掺杂离子,其结果与Cu/BiOCl [39]和Fe(III)-BiOCl [34]一致。
<图片>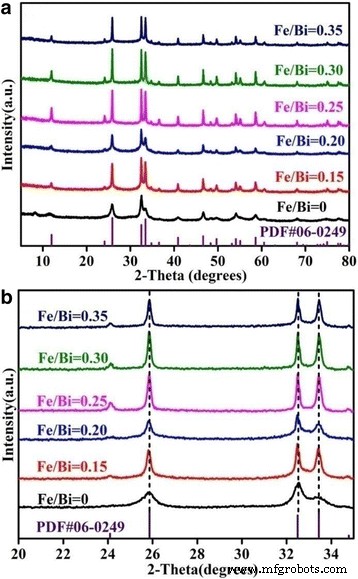
宽 XRD 谱图 (a ) 和局部 XRD 图案 (b ) Fe/BiOCl (x )
Fe/BiOCl (x ) 如图 2 所示。从图 2a 可以清楚地看出,BiOCl 显示出平均直径约为 1~2 μm 的 3D 微球状结构。高倍 SEM 图像(图 2b)显示 BiOCl 微球由许多宽约 70 nm 和约 20 nm 的不规则纳米片紧密组装而成。 Fe 3+ 后 接枝后,Fe/BiOCl 的形态保持球形结构,但直径减小约 0.5~1 μm(图 2c)。从 Fe/BiOCl 的高倍 SEM 图像(图 2d)可以发现 Fe/BiOCl 微球由大量厚度较薄的纳米片组成,厚度约为 15 nm。此外,还观察到一些新的方形纳米片。据报道,Fe 3+ 的引入 离子可以诱导卤氧化铋中的形态转变 [11, 37, 40]。 Fe 3+ 的存在 在我们的样品中可能起到了诱导具有更薄纳米片的分级微结构的作用。
<图片>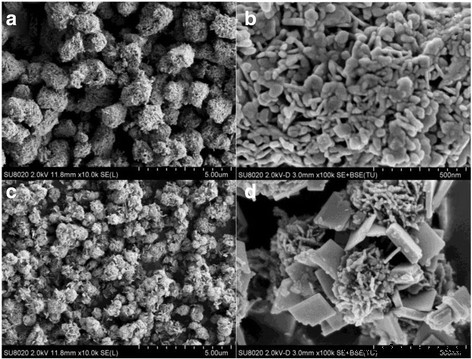
BiOCl (a , b ) 和 Fe/BiOCl (0.25) (c , d )
通过TEM和HRTEM技术进一步研究了样品的几何结构和形态。单个结构的典型 TEM 图像(图 3a)进一步揭示了直径约 1 μm 的 BiOCl 球状形态,其由显示近似圆形边缘的纳米板构成,厚度为 20 nm。图 3b 显示了薄纳米片的 HRTEM 图像,其中清晰的晶格条纹表明这些片状亚基具有良好的结晶度和单晶性质。带有 d 的晶格条纹 0.276 nm 的间距属于 BiOCl 的 (110) 晶面。其他带有 d 的晶格条纹 0.344 nm 的间距对应于 BiOCl 的 (101) 平面。与纯 BiOCl 相比,Fe/BiOCl 样品由具有少量方形结构的大量纳米片松散组装的分级微花组成,其结果与 SEM 结果一致(图 2c)。图 3d 中带有 d 的晶格条纹 0.276、0.344 和 0.342 nm 的间距分别属于 BiOCl 的 (110)、(101) 和 (011) 晶面。根据 SEM 和 TEM 结果,可以推断 Fe 3+ 离子可以诱导规则的方形纳米片生长并驱动纳米片形成具有开放多孔结构的分层微花,这种转变可能与定向附着和Ostwald成熟有关[37]。
<图片>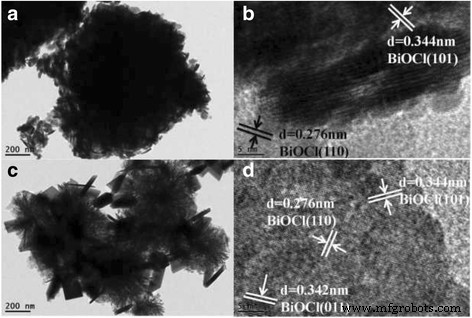
BiOCl (a , b ) 和 Fe/BiOCl (0.25) (c , d )
结果表明,XRD图中没有观察到明显的峰位移,也没有观察到与Fe物种有关的新衍射峰以及相同的d BiOCl 和 Fe/BiOCl 的间距,可以得出结论,Fe 3+ 在我们的 Fe/BiOCl 样品中未检测到 离子。进一步证明Fe 3+ 的存在 离子,Fe/BiOCl (0.25) 的元素映射是通过 SEM 与能量色散 X 射线 (EDX) 进行的,结果如图 4 所示。从图 4 中可以看出,Fe 元素是均匀的分布在Fe/BiOCl微花表面,有力地证明了Fe 3+ 的存在 离子。
<图片>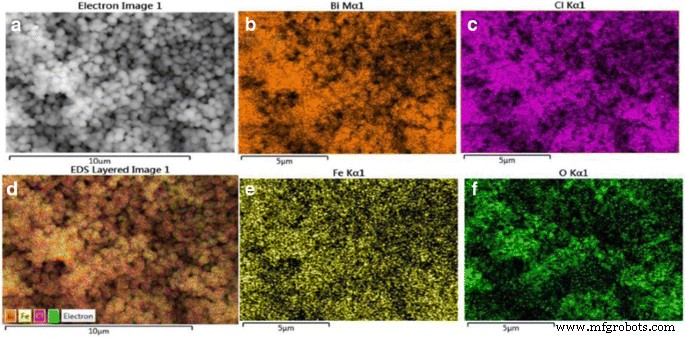
典型的 SEM 图像 (a ) 和 Bi (b ), Cl (c ), 所有元素 (d ), Fe (e ) 和 O (f ) Fe/BiOCl (0.25)
为了确定我们样品中的化学成分并指定表面元素的化学状态,进一步进行了 XPS 测量(图 5)。样品 Fe/BiOCl (0.25) 的测量光谱与裸 BiOCl 的测量光谱大体相似,除了在 700~ 750 eV。 C 峰来自样品表面的外来碳。 Bi 4f 的高分辨率光谱(图 5b)显示了位于 164.8 和 159.5 eV 的两个强峰,分别属于 Bi 4f5/2 和 Bi 4f7/2。如 Cl 2p 核心能级光谱(图 5c)所示,有两个清晰的峰位于 198.2 和 199.8 eV,分别对应于 Cl 2p3/2 和 Cl 2p1/2。图 5d 中 530.3 和 533.4 eV 的结合能分别分配给 BiOCl 或 Fe/BiOCl 中的晶格氧以及缺陷氧化物和类羟基基团 [41]。如图 5e 所示,在 724.0 和 710.5 eV 处观察到的两个明显峰分别归属于 Fe 2p1/2 和 Fe 2p3/2。两个能级之间的能量跨度约为 13 eV,这是 Fe 3+ 的特征值 状态 [11, 42]。值得注意的是,在 Fe 3+ 之后,Bi 4f、Cl 2p 和 O 1s 光谱中没有观察到峰位置的临界位移 修饰,表明 Fe 3+ 离子只是接枝在 BiOCl 的表面上或作为无定形 FeO(OH) 状簇存在 [43]。特别是XPS技术也可用于检测表面元素的化学成分。根据XPS结果,样品Fe/BiOCl的Fe/Bi摩尔比(0.25)估计为0.27,非常接近原始排列值。
<图片>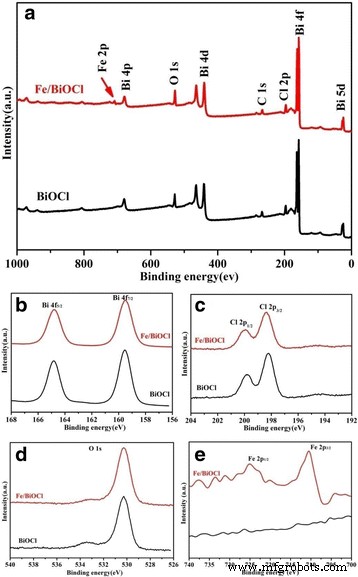
BiOCl 和 Fe/BiOCl (0.25) 的 XPS 光谱。 一 调查,b 双 4f,c Cl 2p, d O 1s 和 e Fe 2p
表面积是吸附剂去除有毒染料、有机污染物和金属离子的关键因素 [28, 33, 44]。更高的比表面积 (S BET) 和孔体积 (V T) 的吸附剂可能有利于吸附能力 [33]。因此,通过 N2 吸附-解吸实验测量了比表面积和 BJH 孔径分布,结果如图 6a 和表 1 所示。样品 BiOCl 和 Fe/BiOCl 的 N2 吸附-解吸等温线( 0.25) 被归类为具有 H3 磁滞回线的 IV 型,这表明每个相互交叉的纳米板或纳米片之间存在多孔结构 [45, 46]。 BJH 孔径分布曲线(图 6a 中的插图)进一步证实了我们的样品中存在多孔结构。如表 1 中所列,S 下注和V Fe/BiOCl (0.25) 的 T 值高于 BiOCl,这可能归因于 Fe 3+ 后更小的粒径和开放的微观结构 修改。
<图片>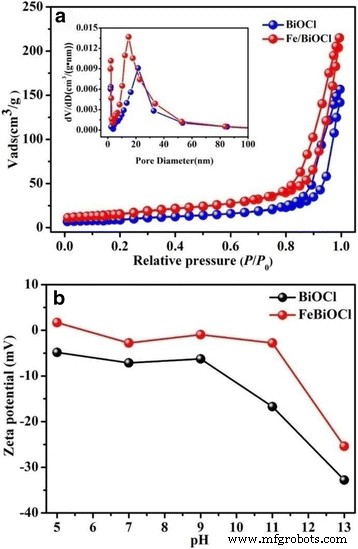
N2 吸附-解吸等温线以及孔径分布曲线(插入)(a ) 和 zeta 电位 (b ) BiOCl 和 Fe/BiOCl (0.25)
Zeta 电位广泛用于量化分散在溶液中的颗粒的表面电荷大小 [18],这是吸附剂的另一个关键因素。图 6b 显示了在不同 pH 值下测量的 BiOCl 和 Fe/BiOCl (0.25) 的 zeta 电位。如图 6b 所示,在 pH 值为 5~13 的范围内,BiOCl 表面带负电。 Fe 3+ 后 修改后,电荷得到积极改善,但在测量的 pH 值中仍低于 0 mV。表面电荷的正改善可能归因于通过 Fe 3+ 的特异性吸附进行的电荷中和 离子到 BiOCl 表面或形成羟基 (Fe-OH) 质子化形成 Fe-OH2 + [35].
BiOCl 和 Fe/BiOCl 的吸附能力
在下面的吸附实验中,选择 Fe/BiOCl (0.25) 作为代表样品来检验 Fe/BiOCl (x ).
选择阳离子染料RhB和阴离子染料MO作为典型的有机染料来测试BiOCl和Fe/BiOCl的吸附能力。图 7 显示了 BiOCl 和 Fe/BiOCl 的吸附能力作为 RhB 和 MO 初始浓度的函数,随着时间在 0.01~0.04 mmol/L 范围内增加。如图 7 所示,BiOCl 和 Fe/BiOCl 的吸附能力在 20 分钟内随时间变化,并随着 RhB 和 MO 初始浓度的增加而降低。在较低浓度下较高的吸附效率可能与最大数量的染料分子倾向于吸附在制备的吸附剂上的事实有关 [47]。图 7a、b 显示 BiOCl 和 Fe/BiOCl 都对阳离子染料 RhB 显示出优异的吸附效率,并且分别在 5 和 20 分钟内对 BiOCl 和 Fe/BiOCl 达到最大值。然而,由于静电排斥力的增加,BiOCl 对阴离子染料 MO 的吸附性能较差,20 分钟内吸附效率仅为 30% 左右。 Fe 3+ 后 改性后,吸附能力增强,在 20 分钟内达到 60% 左右。对阴离子 MO 的吸附能力增强可能与 Fe/BiOCl 更开放的多孔结构和更高的比表面积有关。由此可见,BiOCl和Fe/BiOCl对RhB的去除效果显着,但不适用于MO的吸附剂。
<图片>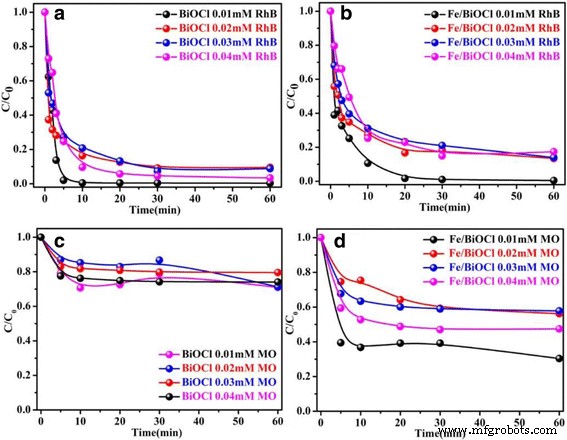
初始浓度对 BiOCl 和 Fe/BiOCl 对 RhB (a , b ) 和 MO (c , d ) (pH =7,温度 =25°C)
还研究了温度(25~85°C)对 BiOCl 和 Fe/BiOCl 对 RhB 和 MO 吸附能力的影响。图 8 中显示的结果表明,BiOCl 和 Fe/BiOCl 的吸附能力与去除 RhB 的温度之间没有密切联系;然而,BiOCl 和 Fe/BiOCl 的吸附能力高度依赖于 MO 的温度,低温有利于这种吸附过程。此外,BiOCl 和 Fe/BiOCl 对 RhB 的吸附容量仍然高于对 MO 的值,这与图 7 一致。基于图 7 的结果,染料分子和吸附剂之间的静电吸引力主要是负责 BiOCl 的大吸附容量。 Fe 3+ 后 改性,BiOCl 表面带更多正电荷(图 6b),结果类似于 Fe 3+ -接枝斜发沸石 [35]。这种现象不利于从溶液中去除阳离子染料。尽管如此,Fe/BiOCl 对 RhB 的吸附能力在 25~85°C 的温度范围内几乎与 BiOCl 的值保持一致。众所周知,更高的比表面积可以为染料分子的吸附提供更多的活性位点 [33, 35, 48]。 Fe/BiOCl 的比表面积 (58.96 m 2 /g) 高于 BiOCl (35.05 m 2 /G);因此,比表面积在染料分子在Fe/BiOCl上的吸附过程中也起着重要作用。
<图片>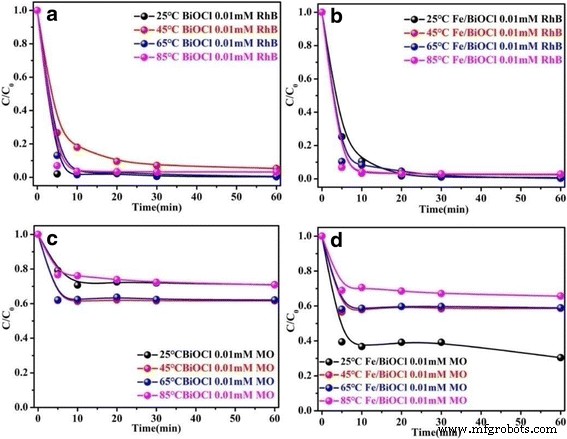
温度对 BiOCl 和 Fe/BiOCl 对 RhB (a , b ) 和 MO (c , d ) (pH =7,初始浓度 =0.01 mmol/L)
溶液的 pH 值在控制吸附剂和染料分子之间的相互作用方面起着至关重要的作用,因为吸附剂的表面电荷和染料分子的电离度都受溶液 pH 值的影响很大 [7]。还研究了通过 0.1 M HCl 或 0.1 M NaOH 调节的 pH 值在 5~13 范围内对吸附容量的影响,结果如图 9 所示。BiOCl 和 Fe/BiOCl 对 RhB 和 MO 的吸附容量强烈依赖于 pH 值,在碱性溶液中表现出较差的吸附性能。图 9a、b 显示染料分子的初始吸收率在 BiOCl 上 3 分钟内急剧增加到 99.7%,在 Fe/BiOCl 上 10 分钟内增加到 93.0%,然后随着 pH 值为 5 的时间延长而趋于平稳。众所周知, H + 之间存在吸附竞争 和阳离子 RhB 分子在酸性溶液中 [47, 49]。然而,与pH =7时相比,BiOCl和Fe/BiOCl对RhB的吸附能力没有降低,表明H + 之间不存在吸附竞争 和阳离子 RhB 分子。人们普遍认为,碱性溶液有利于提高 BiOCl 和 Fe/BiOCl 对阳离子染料的吸附能力,因为 BiOCl 和 Fe/BiOCl 都带负电荷(图 6b)并且 OH - 和染料分子。不幸的是,BiOCl 和 Fe/BiOCl 对 RhB 的吸附能力在 pH =13 时急剧下降,这可能归因于 BiOCl 的结构破坏,因为 BiOCl 在强碱性溶液中不稳定 [50]。 MO 对 BiOCl 和 Fe/BiOCl 的吸附行为类似于 RhB,即在酸性溶液中的吸附量高于在碱性溶液中的吸附量。不同之处在于,在pH =11时,BiOCl和Fe/BiOCl对MO的吸附能力急剧下降,这种现象可能与OH − 之间的弱吸附竞争有关。 和阴离子 MO 分子 [35, 51]。
<图片>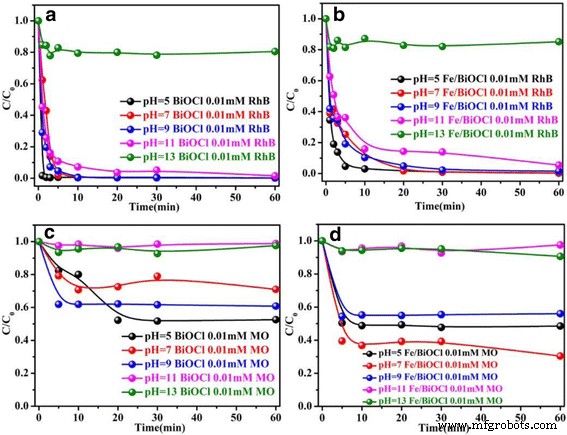
pH值对BiOCl和Fe/BiOCl对RhB(a , b ) 和 MO (c , d )(温度 =25°C,初始浓度 =0.01 mmol/L)
基于上述吸附实验,在初始浓度 =0.01 mmol/L、pH值 =5.0、温度 =25°C的条件下,优化了BiOCl和Fe/BiOCl对RhB的最大吸附容量。
吸附机制
根据zeta电位和以上吸附结果,我们可以推断出强静电引力在吸附过程中起主要作用。为了证实这一推论,选择了其他两种有机染料,包括阳离子亚甲蓝 (MB) 和阴离子酸橙 (AO),以进一步研究 BiOCl 和 Fe/BiOCl 的吸附性能。附加文件 1:图 S1 显示了 MB 和 AO 在 BiOCl 和 Fe/BiOCl 上的吸附效率。如附加文件 1 所示:图 S1,BiOCl 和 Fe/BiOCl 对阳离子 MB 表现出优异的吸附效率,但对阴离子 AO 的表现令人失望,结果表明强静电吸引力是 BiOCl 吸附性能的主要原因和 Fe/BiOCl。
除了强大的静电引力外,高比表面积和开放的多孔结构也有助于所制备的吸附剂的吸附性能。一般来说,Fe 3+ 接枝使 BiOCl 的表面比母体 BiOCl 带更多正电荷(图 6b),这会导致 Fe/BiOCl 对阳离子染料分子的吸附能力降低。然而,Fe/BiOCl 的吸附容量几乎保持与 BiOCl 相同的值。此外,Fe/BiOCl 对阴离子染料分子显示出比裸 BiOCl 更高的吸附能力,尽管它们都带负电荷。需要注意的是,Fe/BiOCl 比母体 BiOCl 具有更开放的多孔结构和更高的比表面积(TEM 和 BET 结果),这两者都有利于提高吸附能力。因此,可以推断出静电引力、更高的比表面积和更开放的多孔结构三个参数是影响Fe/BiOCl吸附能力的原因。
综上所述,BiOCl 和 Fe/BiOCl 对有机染料的吸附机理可概括如下: (1) 对于吸附剂 BiOCl,强静电引力是其对阳离子染料分子的吸附能力的主要原因,但多孔结构和高比表面积主要负责对阴离子染料分子的吸附能力; (2) 对于吸附剂 Fe/BiOCl,静电引力、更开放的多孔结构和更高的比表面积三个方面是对阳离子染料分子的吸附能力的原因,但后两个方面是吸附能力的主要原因阴离子染料分子。
混合染料在 BiOCl 和 Fe/BiOCl 上的吸附
实际的工业染料废水通常由不止一种染料组成。因此,制备了一系列混合染料溶液来检查所制备的吸附剂的吸附性能。图 10 显示了 BiOCl 和 Fe/BiOCl 对混合染料溶液的选择性吸附性能,染料分子对 BiOCl 和 Fe/BiOCl (0.25) 的选择性吸附能力随时间的变化见附加文件 1:图 S2 和S3,分别。结果表明,BiOCl对混合染料溶液中的阳离子染料分子表现出比Fe/BiOCl更优异的选择性吸附性能。然而,各种染料分子的吸附能力普遍低于相应的单一染料体系,这可能是染料分子在吸附剂表面竞争吸附所致[7]。
<图片>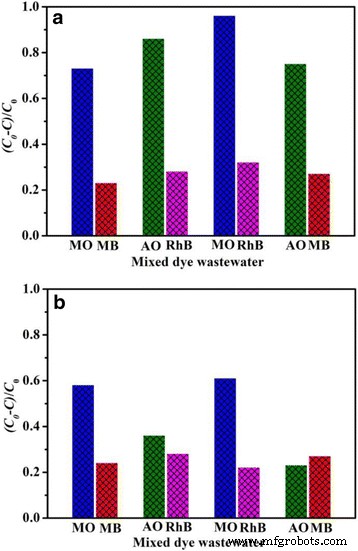
MO、MB、RhB 和 AO 在 BiOCl (a ) 和 Fe/BiOCl (b )。吸附条件 50 毫克吸附剂,25 毫升混合染料溶液中的单一染料,室温。 All the concentration of dye solutions is 0.01 mmol/L
Adsorption Isotherms
Adsorption isotherm is often adopted to determine the equilibrium relationship between the adsorbent and the dye molecules as well as the equilibrium concentration of the dye molecules [52]. Langmuir isotherm and Freundlich isotherm are the most frequently used isotherms; the former model is based on the assumption that the maximum adsorption capacity keeps a correspondence with a saturated monolayer of solute molecules on the adsorbent surface, and the latter model describes a kind of multilayer adsorption with the solutes from a liquid to a solid surface and provides a relationship between the adsorbed dye amounts and the dye concentration at equilibrium [48, 49, 52]. The linear form of the Langmuir equation can be described as follows:
$$ \frac{C_e}{q_e}=\frac{1}{Q_0b}+\frac{C_e}{Q_0} $$ (3)其中 C e (mg/L) is the equilibrium concentration of the dye molecules, q e (mg/g) is the amount of adsorbed dyes per unit mass of adsorbent at equilibrium, and Q 0 and b are the Langmuir constants which are related to adsorption capacity and rate of the adsorption, respectively.
The Freundlich isotherm, an empirical equation, can be described as follows:
$$ \ln {q}_e=\frac{1}{n_F}\ln {C}_e+\ln {K}_f $$ (4)其中 q e (mg/g) is the amount of adsorbed dyes per unit mass of adsorbent at equilibrium, C e (mg/L) is the equilibrium concentration of dye molecules, and K f (L/mg) and n F are Freundlich constants which are associated with the adsorption capacity at unit concentration and adsorption intensity of the adsorbent, respectively.
The plots of the experimental data on the basis of Langmuir and Freundlich models are shown in Fig. 11 and Additional file 1:Figure S4, respectively. It is obviously observed in Fig. 11 and Additional file 1:Figure S4 that the Langmuir isotherm model displays a better fit to the experimental data for both BiOCl and Fe/BiOCl than the Freundlich isotherm model, which indicates the monolayer coverage of the surface of BiOCl and Fe/BiOCl by RhB molecules.

Langmuir isotherm for adsorption RhB on BiOCl (a ) and Fe/BiOCl (b )
Adsorption Kinetics
To further investigate the adsorption rate and the possible mechanism, kinetics of RhB adsorption on BiOCl and Fe/BiOCl at different temperatures were studied using the pseudo-first order and the pseudo-second order [53, 54], respectively.
The pseudo-first order can be described as Eq. (5):
$$ \ln \left({q}_e-{q}_t\right)=\ln {q}_e-{k}_1t $$ (5)The pseudo-second-order can be described as Eq. (6):
$$ \frac{t}{q_t}=\frac{1}{k_2{q}_e^2}+\frac{t}{q_e} $$ (6)其中 q t (mg/g) and q e (mg/g) are the amount of dye molecules adsorbed at t time and at equilibrium, respectively. k 1 (min − 1 ) and k 2 (g/(mg min)) represent the rate constant of the pseudo-first-order model and the pseudo-second-order model, respectively.
The plots of the experimental data simulated on the basis of the pseudo-first-order and the pseudo-second-order are shown in Additional file 1:Figure S5 and Fig. 12, respectively. As shown in Additional file 1:Figure S5 and Fig. 12, the experimental data shows a better fit to the pseudo-second-order model than the pseudo-first-order model. The values of kinetic parameters q e 和 k 2 and the corresponding correlation coefficients (R 2 ) are listed in Additional file 1:Table S1. All the q e values are very close to the theoretical value for complete adsorption capacity for RhB (4.79 mg/g), which indicates the forceful adsorption efficiency of BiOCl and Fe/BiOCl. The low q e value is possibly resulted by the low concentration of as-prepared dye solutions.

Pseudo-second-order kinetics for adsorption RhB on BiOCl (a ) and Fe/BiOCl (b )
Adsorption Cycles and Adsorbent Regeneration
For potential applications in pollutant treatment, the recycled utilization of an adsorbent plays a significant role. Thus, the adsorption cycle tests of BiOCl and Fe/BiOCl toward RhB were conducted and the results are shown in Fig. 13. As displayed in Fig. 13, the adsorption efficiency of BiOCl maintained more than 80% after three adsorption cycles. The adsorbent Fe/BiOCl also presented excellent adsorption efficiency, i.e., about 50% after five adsorption cycles, although which was slightly lower than that of BiOCl.

The adsorption cycle tests of BiOCl and Fe/BiOCl
It is generally accepted that BiOCl is recognized as an excellent photocatalyst toward organic dye photodegradation [22,23,24]. Thus, this photocatalytic performance could be applied to regenerate the adsorbents. Using RhB as reaction model, the regeneration of BiOCl and Fe/BiOCl was investigated and the detailed description was displayed in Additional file 1. Additional file 1:Figure S6 (a) showed the FT-IR spectra of RhB, BiOCl, and Fe/BiOCl and the corresponding counterparts after adsorption and photocatalytic process. A series of bands at 1000–1800 cm − 1 are attributed to RhB dye molecules [55], and the peak at 522 cm − 1 is attributed to the Bi–O stretching vibration [56]. After adsorption of RhB dye molecules onto BiOCl and Fe/BiOCl, many peaks belonging to RhB were observed and Bi–O stretching vibration did not changed, which confirmed the electrostatic interaction between adsorbents and RhB molecules as well as the high stability of adsorbents. In addition, the photocatalytic activities of BiOCl and Fe/BiOCl after adsorption were measured under visible light illuminations. After 60 min irradiation, the residual samples were collected and washed with water. It is noticeable that the characteristic peaks of functional groups for RhB molecules became very weak in samples BiOCl and Fe/BiOCl, forcefully demonstrating the regeneration and superior photocatalytic activities of absorbents. Additional file 1:Figure S6 (b) shows the intuitive photographs of as-prepared BiOCl and Fe/BiOCl and the corresponding samples after adsorption and photodegradation. The pristine BiOCl and Fe/BiOCl displayed white and light brown colors, which turned to nearly RhB color after adsorption and then approximately faded into the original color of samples after photodegradation. The color variation of the adsorbents verifies the adsorption and photodegradation of RhB over BiOCl and Fe/BiOCl, further confirming that BiOCl and Fe/BiOCl are excellent adsorbents and could be easily regenerated by a photocatalytic route.
结论
In summary, two adsorbents including BiOCl and Fe/BiOCl were prepared for the removal of cationic and anionic dyes with low concentration from the solutions. After grafting Fe 3+ on the surface of BiOCl, the adsorbent showed more open porous structure and higher specific surface area. Both BiOCl and Fe/BiOCl are more favorable for removing the cationic dye molecules from the solution, whereas Fe/BiOCl displays higher adsorption capacity toward anionic dye molecules than BiOCl. Furthermore, BiOCl exhibited higher selective adsorption efficiency toward cationic dye molecules than Fe/BiOCl in mixed dye solutions. The prominent adsorption efficiency is probably to provide a potential application for as-prepared adsorbents in actual industrial wastewater.
缩写
- AO:
-
Acid orange
- 赌注:
-
Brunauer-Emmett-Teller
- BiOCl:
-
Bismuth oxychloride
- BJH:
-
巴雷特-乔伊纳-哈伦达
- Fe/BiOCl:
-
Fe 3+ -grafted BiOCl
- HRTEM:
-
High-resolution TEM
- MB:
-
Methylene blue
- MO:
-
Methyl orange
- RhB:
-
Rhodamine B
- S 赌注:
-
Specific surface area
- SEM:
-
扫描电镜
- TEM:
-
透射电子显微镜
- V T :
-
Pore volume
- XPS:
-
X-Ray photoelectron spectroscopy
- XRD:
-
X-ray powder diffraction
纳米材料
- 使用来自轧制废料的磁铁矿纳米吸附剂从水溶液中吸附去除铜 (II) 离子:合成、表征、吸附和动力学建模研究
- 负载 ICA 的 mPEG-ICA 纳米颗粒的制备及其在治疗 LPS 诱导的 H9c2 细胞损伤中的应用
- 氧化铜纳米颗粒对大肠杆菌的生物合成、表征和抗菌潜力评估
- 重吸收抑制的 II 型/I 型 ZnSe/CdS/ZnS 核/壳量子点的合成及其在免疫吸附测定中的应用
- ZnO 纳米晶体的合成及其在倒置聚合物太阳能电池中的应用
- 钯(II)离子印迹聚合物纳米球的制备及其从水溶液中去除钯(II)
- 水溶性硫化锑量子点的合成及其光电特性
- Cu2ZnSnSe4 纳米片的一锅法合成及其可见光驱动的光催化活性
- Co3O4 纳米线的环境友好和简便合成及其与石墨烯在锂离子电池中的有前景的应用
- 使用木材固有结构作为天然模板的纯铜纳米结构的合成和表征
- 表面功能化磁性纳米复合材料的简便合成,可有效选择性吸附阳离子染料
- 金属和金属氧化物纳米粒子的绿色合成及其对单细胞藻类莱茵衣藻的影响