

使用冻干单相溶液法制备甘草次酸脂质体:预配制、优化和体外评估
摘要
本研究采用冻干单相溶液法成功制备了甘草次酸(GA)脂质体。制剂前研究包括评估大豆磷脂酰胆碱 (SPC)、胆固醇和 GA 在叔丁醇 (TBA)/水共溶剂中的溶解度。研究了TBA体积百分比对升华速率的影响。使用不同体积百分比的TBA/水共溶剂冻干后的GA通过DSC、XRD和FTIR进行物理化学表征。 GA的XRD图谱显示出明显的无定形性质。 FTIR 光谱结果表明没有发生化学结构变化。溶解度研究表明 GA 的水溶性增强。通过Box-Benhnken设计和冻干保护剂选择实验研究,得到了508mg SPC、151mg胆固醇、55%体积百分比的TBA、4:1海藻糖/SPC重量比的最佳配方和工艺参数。在最佳条件下,重组脂质体获得了令人满意的包封率 (74.87%) 和平均直径 (191 nm)。体外药物释放研究表明,重组脂质体在两种释放介质中均具有缓释特性。此外,体外细胞摄取研究表明,Hep G2细胞对载药脂质体的摄取过程具有时间依赖性。
背景
甘草次酸(GA)是一种三萜皂苷,主要从中药甘草根中提取[1]。研究表明,GA具有明显的抗菌、抗病毒和抗癌作用,常用于慢性肝炎和肝癌的临床治疗[2,3,4]。根据生物制药分类系统,GA为II类药物。由于GA分子极性低、疏水性高、溶解性差,其口服生物利用度较低[5]。此外,GA 可能导致钠潴留和钾丢失 [6],这与高血压有关,而 GA 的不良反应似乎是剂量依赖性的。因此,采用适当的制剂策略来增加GA的吸收并保持其有效浓度将显着提高其生物利用度和安全性。
脂质体作为药物载体的优越性已被广泛认可[7,8,9]。它们的功能优势主要体现在以下几个方面:(1)脂质体具有良好的生物相容性和安全性; (2)脂质体增强靶向药物向淋巴结的递送,减少抗癌药物对正常细胞和组织的抑制作用或损伤; (3)大小合适的载药脂质体在实体瘤、感染、炎症等毛细血管通透性增加的部位具有增强的通透性和滞留作用,显示出被动靶向的能力; (4)脂质体既可以携带疏水性药物,也可以携带水溶性药物; (5)脂质体表面可以被修饰并与官能团相连。由于这些优点,许多脂质体药物已获批。
常规脂质体制备方法得到的产品为脂质体水悬液。然而,水性脂质体混悬液相对不稳定,在储存过程中可能发生泄漏、融合和磷脂水解,导致长期储存能力有限[10]。目前,解决这些问题的有效途径是制备前体脂质体[11]。前体脂质体是由脱水脂质体成分和赋形剂制成的具有良好流动性的粉末。脂质体可以通过在应用前将前脂质体分散在水中来重建。喷雾干燥和冷冻干燥是制备前体脂质体的两种最常用的方法[12],但它们在应用中存在一些局限性。例如,喷雾干燥不适用于热敏性药物,由于设备热效率低,往往会导致粘壁等问题。脂质体双层的结构重排可能发生在喷雾干燥过程中 [13]。常用的冷冻干燥方法是水悬浮系统,但水冷冻干燥需要很长时间,因此这种方法成本高、耗时长。
近年来开发了一种新的前体脂质体制备方法(冻干单相溶液法)[14, 15]。该方法包括将脂质、药物和水溶性冻干保护剂溶解在叔丁醇 (TBA)/水共溶剂系统中,然后通过冷冻干燥获得前体脂质体,然后加入水,形成均匀的脂质体悬浮液。这种方法有几个优点:(1)TBA的加入可以显着提高冰的升华速度,实现快速彻底的冻干,经济上有利。同时,快速升华有利于防止团块塌陷[16]。 (2)冻干单相溶液技术为一步法,是大规模制备脂质体的一种高效方法。 (3) 尽管未在 ICH 残留溶剂指南中列出,但 TBA 很可能属于 3 类低毒性溶剂,因为它与其他 3 类溶剂的 LD50 毒性数据相似[17]。 (4)此方法可得到无菌粉末。 (5) 适用于水溶性差或水稳定性差的药物[18]。
有一些关于使用 TBA/水冻干系统制备脂质体的报道。然而,对该系统的研究还不够充分,还存在许多问题。例如,不同浓度TBA/水体系升华速率的变化,不同浓度TBA/水体系冻干后特定药物固态性质的变化,冻干粉体的水化和组装过程等。还不清楚。另一方面,特定疏水性药物在不同比例和温度的 TBA/水共溶剂中的溶解度是非常特殊的。上述信息对于载药脂质体的配方和工艺设计至关重要。因此,在本研究中,我们使用 GA 作为模型药物进行上述制剂前研究。此外,使用平均直径和包封率作为主要评估指标,我们使用 Box-Benhnken 设计优化了通过冻干单相溶液法制备的 GA 脂质体的配方和加工变量。评价了冻干保护剂类型对脂质体质量的影响,以及脂质体的体外释放和肝癌细胞对脂质体的吸收。
方法/实验
材料
甘草次酸(> 98% 纯度)购自大连美伦生物科技有限公司(中国大连)。大豆磷脂酰胆碱 (Lipoid S100) 购自 Lipoid GmbH (Ludwigshafen, Germany)。胆固醇购自 J&K Scientific Ltd.(中国北京)。 GA 参比化合物购自国家食品药品监督管理局(中国北京)。 FITC-PEG-DSPE(分子量 2000)购自 Shanghai Ponsure Biotech, Inc.(中国上海)。叔丁醇 (> 98%) 和所有其他试剂,如果没有特别说明,均购自国药集团化学试剂有限公司(中国北京)。去离子水采用 Milli-Q 净水系统(Millipore, Bedford, MA, USA)制备。
GA、SPC 和胆固醇在 TBA/水共溶剂体系中的溶解度研究
通过在 25°C、30°C、35°C、40°C 和 45°C 下在相应的载体中搅拌过量的药物来制备具有不同 TBA 体积百分比的 GA 的饱和 TBA-水溶液(30 毫升) 72 小时。离心(3000 rpm 15 分钟)后,上清液通过 0.45 μm 微孔过滤器。 GA的饱和溶解度在充分稀释后通过HPLC测量。在每种 TBA/水共溶剂中进行三次重复。 HPLC 分析在 LabAlliance(型号系列 III)HPLC 系统(Lab Alliance,天津,中国)上进行,该系统配备有四元泵、自动进样器和柱温箱,并与 UV 检测器相连。在 C18 色谱柱(4.6 mm × 250 mm;5 μm;Dikma Technologies,北京,中国)上进行分离;甲醇和水 (90:10 V /V ) 用作流动相,流速为 1.0 毫升/分钟。分析物由紫外检测器在 250 nm 处检测。
使用比浊法估计大豆磷脂酰胆碱 (SPC)(或胆固醇)在 TBA/水共溶剂系统中的溶解度 [19, 20]。简而言之,在 25°C、30°C、35°C、40°C 和 45°C 下将 10mg SPC(或胆固醇)溶解在 TBA 中以获得澄清溶液;在整个实验过程中保持温度。在 25°C 下向 SPC(或胆固醇)的 TBA 溶液中加入相同温度下逐渐增加的纯净水,直至首次出现浑浊,并记录临界水体积值。浊度可通过在 T6 型紫外-可见分光光度计(北京浦肯野通用仪器有限公司)上检测空白溶液(纯化水)在 655 nm(> 0.04)处的吸收值来确定。
使用冻干单相溶液法制备脂质体
GA、SPC 和胆固醇在 45°C 下溶解在 TBA 中,水溶性冻干保护剂如甘露醇、乳糖、蔗糖和海藻糖溶解在 45°C 水中。然后将这两种溶液以适当的比例混合以获得第三个透明的各向同性单相溶液(总体积 60 毫升)。将单相溶液通过 0.22 μm 孔过滤灭菌后,将其装入 10 ml 冷冻干燥小瓶中,填充体积为 2.0 ml。在- 40°C下预冻12小时后,在- 50°C的架子温度下,在冻干机(SJIA-10N,宁波双佳科技)中,室压为1-20Pa进行冷冻干燥24小时中国发展有限公司)。
脂质体粒径和封装效率的测量
通过将 5mg 前体脂质体粉末加入 5ml 纯净水中,随后涡旋搅拌 1 分钟两次,间隔 15 分钟以完全水合来制备脂质体悬浮液。采用激光粒度分析仪(Nano ZS90 Malvern Instruments, UK)对脂质体进行粒度分析。
GA 在脂质体中的包封率由超滤-离心技术确定。简而言之,将 1 ml 脂质体分散液(5 ml 纯净水中的 500 μg 前体脂质体)移至 10 ml 容量瓶中,然后加入 5 ml 纯净水、2 ml 丙酮,并用纯净水稀释至 10 ml。将 0.5 ml 的这种悬浮液转移到截留分子量为 50 kDa 的离心过滤器(Amicon Ultra-0.5,Millipore,Cdduounty Cork,Ireland)的上室中,在 15°C 下以 10,000 rpm 离心 30 分钟超速离心机(CP70MX,日立工机株式会社,日本)。然后将20 μl超滤液注入HPLC系统,紫外吸收波长为250 nm,GA含量称为游离药物含量。包封率 (EE) 按下式计算
$$ \mathrm{EE}\left(\%\right)=\frac{W_{\mathrm{total}}-{W}_{\mathrm{free}}}{W_{\mathrm{total}}} \times 100 $$ (1)其中 W free 是免费药物的数量,W total 为总药量。
TBA/水混合物升华率的测定
将一毫升不同 TBA 体积百分比(10%、20%、30%、40%、50%、60%、70%、80% 和 90%)的 TBA/水混合物放入 10 毫升冻干小瓶中, 分别。 TBA/水混合物在- 40°C 下预冷冻12 小时,然后通过冻干机(SJIA-10N,宁波双佳科技发展有限公司,中国)在- 50°C 下冻干。记录TBA/水混合物从冻干瓶中完全消失时的时间,升华速率为体积(μl)除以时间(min)。
TBA/水混合物饱和蒸气压的测定
实验装置和操作程序的细节在别处描述[21, 22]。通过静态方法测量系统 TBA/水(10%、20%、30%、40%、50%、60%、70%、80% 和 90%)的蒸气压。该装置由装有 TBA/水混合物的工作沸腾计、装有纯水的参考沸腾计、缓冲容器、两个冷凝器、两个温度测量和压力控制系统组成。根据Antoine方程[23]表示的温度-压力关系,系统的平衡压力由参考沸点计中纯水的沸点温度确定。
GA 溶解度的测定
游离GA在水中的溶解度通过在恒温控制水浴(DF-101S,河南裕华仪器有限公司,DF-101S,中国)在 25°C 直到达到平衡(48 小时)。样品通过 0.45 μm 膜过滤器过滤,用甲醇适当稀释,然后通过 HPLC 进行分析 [24]。实验一式三份进行。
预冻 TBA/水混合物的表面形态观察
将 5 毫升水/叔丁醇混合物倒入 90 毫米培养皿中,然后在冷阱中冷冻(- 40°C);使用XSP-4C光学显微镜(上海长方光学仪器有限公司,上海,中国)观察冷冻样品。
透射电子显微镜
通过 Hitachi HT7700 透射电子显微镜 (TEM) (Hitachi, Japan) 在 100 kV 的加速电压下观察脂质体外观。在室温下将 5 mg 前体脂质体粉末加入 5 ml 纯净水中,涡旋混合 10 s,然后静置 30 s,得到脂质体悬浮液。用微量移液管吸取一滴,然后放置在涂有碳的铜网上。通过用滤纸吸干网格除去过量的悬浮液。使用 1% 磷钨酸溶液 (w /w , pH 7.1) 直接在沉积物上制备。用滤纸除去多余的沉淀物并在分析前让沉积物干燥。
傅立叶变换红外光谱
在 Nicolet 6700 FTIR 分光光度计(Thermo Scientific, Waltham, MA, USA)上获得样品的傅里叶变换红外光谱 (FTIR) 光谱。每个样品和溴化钾用玛瑙研钵混合并压缩成薄盘。扫描范围为 4000–400 cm -1 分辨率为 4 cm −1 .
差示扫描量热法
差示扫描量热法 (DSC) 测量在 HSC-1 DSC 扫描量热仪(中国北京恒久仪器有限公司)上进行。将 15 mg 样品置于铝盘中并密封在样品盘压机中。在氮气氛下以 10°C/min 的速率将探针从 25°C 加热到 350°C。
X 射线衍射
使用 D8 Focus X 射线衍射仪 (Bruker, Germany) 使用 Cu-Kα 辐射获得样品的结构特性。在 40 kV 和 40 mA 的电压下进行测量。样品从5°到60°扫描,扫描速度为5°/min。
GA Proliposome 的稳定性
GA 前体脂质体粉末被转移到玻璃瓶中,充满氮气,密封,并在室温下避光储存。以重组脂质体的包封率和粒径为指标进行了6个月的稳定性测试。
体外药物释放
使用透析方法在 37 ± 0.5°C 下观察到 GA 从脂质体中的释放。在 PBS (pH 7.4) 或生理盐水中重构脂质体以制备 0.5 mg/ml GA 后,将每种脂质体分散体的等分试样 (5 ml) 放入透析袋(截留分子量 8000-14,000 Da)中密封严密。然后,将管浸入 150 毫升释放介质、PBS (pH 7.4) 或含有 0.1% (v /v ) 吐温 80 以保持下沉条件 [25, 26]。在使用磁力搅拌器以 300 rpm 搅拌释放介质的同时,在 12 小时内以预定时间间隔从释放介质中取出样品(1.5 毫升),再填充相同体积的新鲜介质。用甲醇适当稀释后,用高效液相色谱法测定GA的浓度。
体外细胞摄取
采用冻干单相溶液法制备荧光脂质体。简而言之,将 30 mg GA、254 mg SPC、75.5 mg 胆固醇和 21.2 mg FITC-PEG-DSPE 的混合物溶解在 TBA 中。此外,将1016mg海藻糖溶解在水中。然后将这两种溶液混合以获得澄清的单相溶液(总体积 30 毫升)。单相溶液经0.22μm孔径过滤灭菌后,装入10ml冻干小瓶中,装量2.0ml,冻干24h,加水复溶脂质体备用。
HepG2 细胞(万雷生物有限公司,沉阳,中国)在含有 10% FBS(胎牛血清)的 DMEM 中培养。将细胞铺板直至在 6 孔板中达到 90% 汇合,并将细胞在 37.0°C 和 5.0% CO 2 的加湿培养箱中培养。孵育 24 小时后,将 200 μl FITC-GA-脂质体悬浮液加入 1 ml HepG2 细胞悬浮液(1 × 10 4 每孔细胞)。孵育 0.5 小时、1 小时、2 小时和 4 小时后,将细胞用 pH 7.4 PBS 洗涤 3 次,并用 0.4% (w /v ) 台盼蓝溶液。细胞用 1% (w /v ) 海卫 X100。细胞裂解物在 495 nm 激发和 520 nm 发射的荧光强度使用 RF5301 荧光分光光度计(Shimadzu,Tokyo,Japan)测量。根据在细胞裂解缓冲液中测量的磷脂浓度与 FITC 荧光强度的标准曲线,将相对荧光值转换为磷脂浓度。使用 BCA 蛋白质测定试剂盒(Pierce, Rockford, IL, USA)测定蛋白质浓度。摄取量表示为每毫克细胞蛋白中磷脂的量[27]。
结果与讨论
预制剂研究
溶解度研究
由于脂质体是采用冻干单相溶液法制备的,因此进行了溶解度研究,以确保药物和载体材料在冻干前可以溶解在TBA/水溶液中。
图1显示了GA在不同体积百分比的TBA/水共溶剂体系中饱和溶解度的变化。在25°C至45°C范围内,GA的饱和溶解度随着TBA体积百分比从10%增加到60%而不断增加,当TBA体积百分比> 40%时,GA的饱和溶解度> 0.5 mg/ml。另一方面,当保持相同的体积百分比时,GA 的饱和溶解度随着 TBA/水溶液温度的升高而增加。当TBA的体积百分比达到30%时,不同温度下溶解度的差异越来越明显。大豆磷脂和胆固醇在 TBA/水共溶剂系统中的溶解度显示在堆积柱状图中(图 2)。图 2a、b 分别表示单位 (1mg) 磷脂和胆固醇在不同温度下达到饱和溶解度所需的 TBA/水混合物的体积。灰色区域代表水的体积,黑色区域代表TBA的体积。随着温度从 25°C 逐渐升高到 45°C,溶解 1mg 磷脂所需的 TBA/水共溶剂的总体积和 TBA(柱上的标签)的体积百分比逐渐降低(图 2a)。随着温度升高超过 35°C,所需的 TBA 体积显着减少,低于 0.15 毫升。类似地,随着温度从 25°C 逐渐升高到 45°C,溶解 1 mg 胆固醇所需的 TBA 体积减少,而 TBA 体积百分比呈逐渐减少的趋势。以上结果表明温度和TBA体积百分比对磷脂、胆固醇和GA的溶解度有很大影响。
<图片>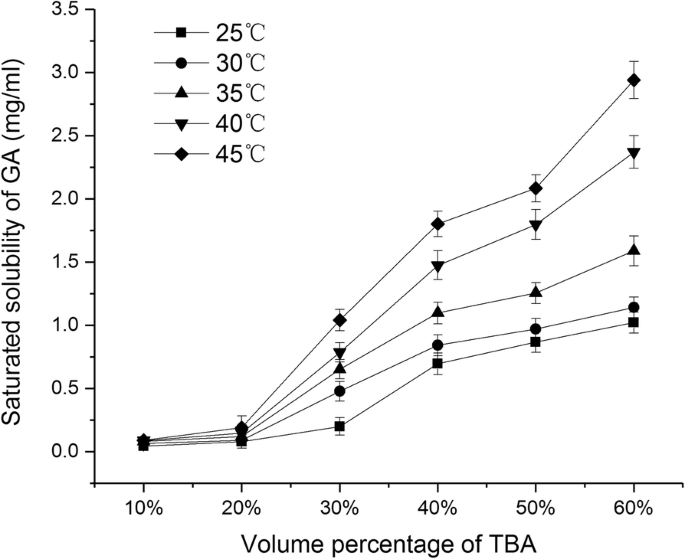
GA在不同体积百分比的TBA/水共溶剂中的饱和溶解度(平均值 ± SD,n =3)
<图片>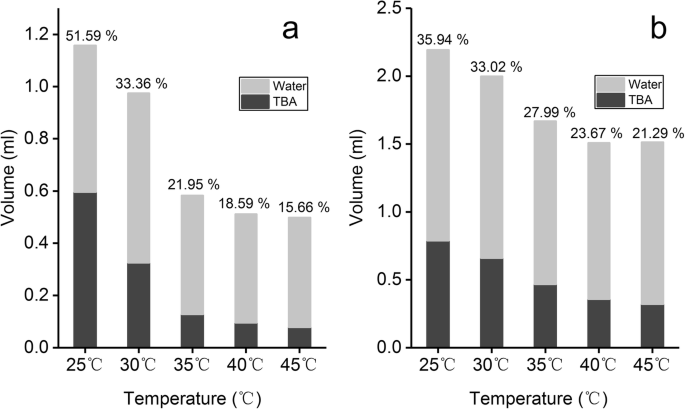
SPC 的溶解度 (a ) 和胆固醇 (b ) 在不同体积百分比的 TBA/水共溶剂中
不同体积百分比的TBA/水共溶剂体系升华率对比
升华速度直接影响冻干粉的生产效率。更快的升华速度更经济,并且可以防止材料坍塌[16]。在这项研究中,我们检查了不同浓度的 TBA/水系统的升华率。如图 3 所示,随着 TBA 的体积百分比从 10% 增加到 90%,混合溶剂的升华率逐渐增加。此外,当体积百分比超过60%时,升华速率达到10μl/min以上。
<图片>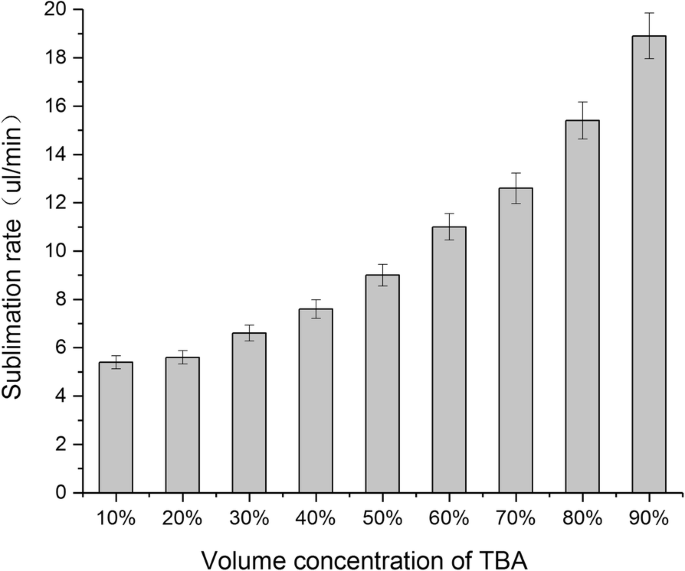
不同体积百分比的TBA/水共溶剂升华率(平均值 ± SD,n =3)
为了确定不同体积百分比的 TBA 升华速率差异的原因,我们首先检查了冷冻样品的表面形态。图 4 包含体积百分比为 40% 至 80% 的 TBA/水溶液的光学显微图像(体积百分比小于 30% 的 TBA 无法检查,因为它在光学显微镜下迅速熔化)。与体积百分比为40%的TBA相比,> 50%体积的TBA具有清晰分散的针状结构。我们推测随着TBA体积百分比的增加,针状晶体的直径变小,导致比表面积增加,升华率增加。
<图片>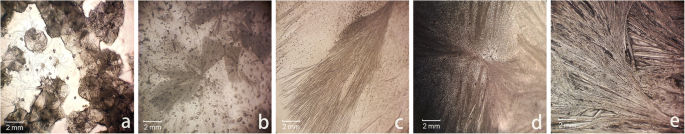
不同TBA体积百分比的TBA/水共溶剂在光学显微镜下的表面形貌(× 100放大倍数)。 一 40%。 b 50%。 c 60%。 d 70%。 e 80%
此外,我们还测量了不同体积百分比的 TBA/水共溶剂体系在 25°C 下的饱和蒸气压。图 5 是不同 TBA 体积百分比的 TBA/水共溶剂体系的饱和蒸气压变化的条形图。如图所示,随着TBA体积百分比的增加,混合溶剂的饱和蒸气压有逐渐增加的趋势。由于温度与饱和蒸气压呈正相关,根据 Antoine 方程 (Eq. 2),我们可以推断出共溶剂系统在冻干温度 (- 50 °C) 下的饱和蒸气压将随着体积百分比的增加而增加TBA的增加,这可能是升华率逐渐增加的原因之一。
$$ {\log}_{10}p=A-\frac{B}{T} $$ (2)其中 p 是蒸气压,T 是温度,A 和 B 是特定于组件的常量。
<图片>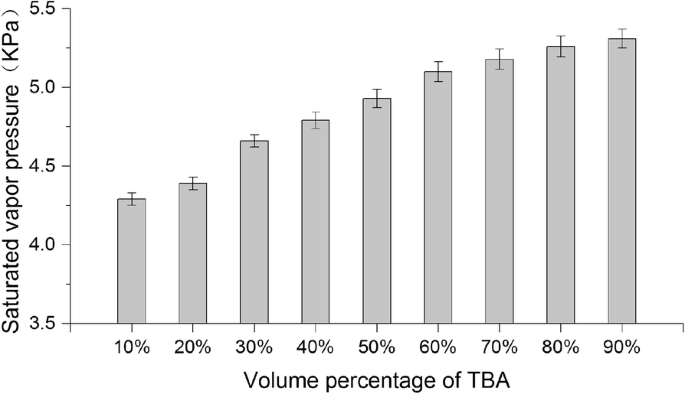
不同体积百分比的TBA/水共溶剂的饱和蒸气压(平均值 ± SD,n =3)
不同体积百分比的TBA/水共溶剂体系中冻干对GA理化性质的影响
为了研究冻干对 TBA/水共溶剂体系中 GA 理化性质的影响,进行了以下实验。将 10 毫克 GA 溶解在 8 毫升不同 TBA 体积百分比(40%、50%、60%、70% 和 80%)的 TBA/水共溶剂中。将单相溶液通过 0.22 μm 孔过滤灭菌后,将其装入 10 ml 冷冻干燥小瓶中,填充体积为 2.0 ml。用冻干机在- 50℃下冷冻干燥24小时。
将 GA 溶解在具有不同 TBA 体积百分比的 TBA/水共溶剂体系中后,冻干粉的 DSC 光谱如图 6a 所示。原料药的 DSC 曲线在 301°C 处有一个明显的吸热峰,这是 GA 的熔点。在具有不同 TBA 体积百分比的 TBA/水共溶剂系统中冻干导致 GA 熔融峰的前移。随着TBA体积百分比的降低,熔解峰位移的幅度增大。
<图片>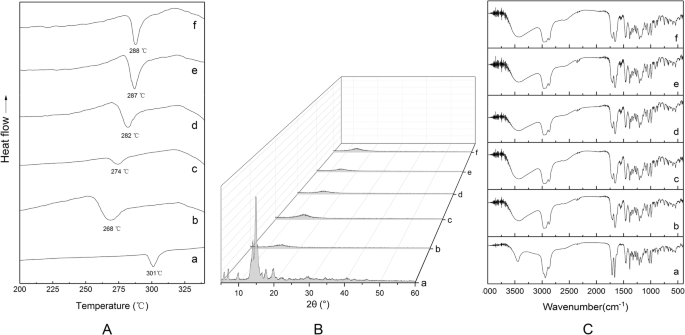
DSC (a ), XRD (b ) 和 FTIR (c )在不同体积百分比的TBA/水共溶剂中冻干后的GA; (a) GA,(b) 40% 待定,(c ) 50% 待定,(d) 60% 待定,(e) 70% 待定,和 (f) 80% 待定
先前的研究已经表明,TBA 的浓度可以深刻影响结晶相、非晶相或亚稳相的复杂混合物的形成 [28]。在某些情况下,使用 TBA 会导致结晶度降低,而另一种情况则相反[29]。
将 GA 溶解在具有不同 TBA 体积百分比的 TBA/水共溶剂体系中后,冻干粉末的 X 射线衍射(XRD)光谱如图 6b 所示。原料药的 XRD 谱显示在 5° 和 20° 之间有几个明显的晶体衍射峰。在不同TBA体积百分比的TBA/水共溶剂体系中冻干导致样品XRD谱中5°~20°衍射峰消失。这说明原来的药物晶体已经变成了无定形。
将 GA 溶解在具有不同 TBA 体积百分比的 TBA/水共溶剂体系中后,冻干粉的 FTIR 光谱如图 6c 所示。在4000-400 cm -1 范围内,原料药的FTIR光谱形状与TBA/水共溶剂体系中不同TBA体积百分比的冻干粉的形状一致 范围。新官能团未出现特征峰,说明GA在不同体积百分比的TBA中冻干后化学结构保持不变。
从晶体到无定形形式的变化可以改变药物的溶解度,从而影响水合重建过程中的脂质体封装。在这项研究中,我们测量了冻干 GA 粉末在 25°C 下的水溶性。我们发现,随着 TBA 体积百分比从 40% 增加到 80%,冻干 GA 在水中的饱和溶解度从 64.10 逐渐降低到 19.27 μg/ml。然而,它仍然显着高于原料药在水中的溶解度(6.36 μg/ml),表明冻干过程中从结晶结构到无定形结构的变化确实影响了原料药的溶解度(图 7)。 <图片>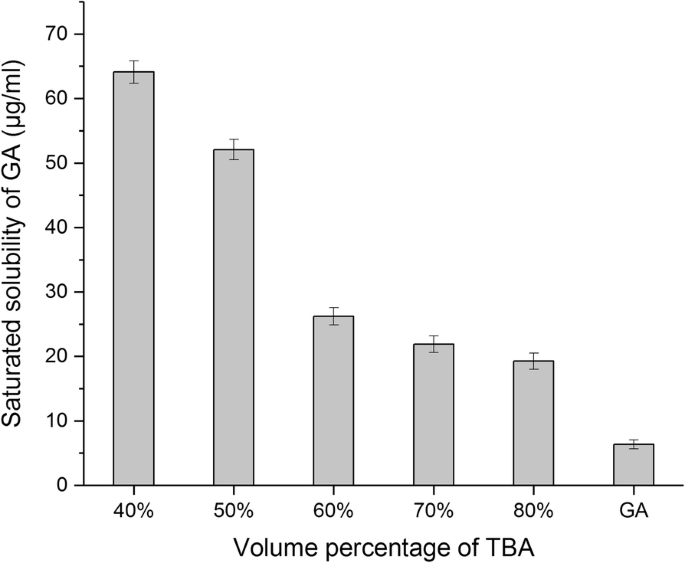
GA冻干在不同体积百分比的TBA/水共溶剂中的水溶性(平均值 ± SD,n =3)
单因素实验
影响脂质体质量的因素有很多。众所周知,磷脂/药物比例对药物的胶囊质量有影响 [30]。适量的胆固醇可以增加脂质膜的有序排列和稳定性。然而,脂质体中高含量的胆固醇会降低膜的柔韧性,从而阻碍药物渗透到脂质双层中[31]。 In this study, we selected three factors that impact on liposome quality and performed a single-factor study to determine the appropriate values for subsequent optimization tests, including quantity of SPC, quantity of cholesterol, and volume percentage of TBA in the co-solvent. The quality of liposomes was evaluated in terms of encapsulation efficiency and mean diameter. Each experiment was performed in triplicate with all other parameters set to constant value, GA 60 mg, pre-freeze temperature − 40 °C, pre-freeze time 12 h. In this study, we compared the results via a scoring system, giving equal weight to both encapsulation rate and mean diameter. Scoring was conducted as follows:
$$ \mathrm{Score}=\frac{\mathrm{EE}}{\mathrm{MEE}}\times 50\%-\frac{\mathrm{MD}}{\mathrm{MMD}}\times 50\% $$ (3)where EE is encapsulation efficiency, MEE is maximum encapsulation efficiency of the group, MD is mean diameter, and MMD is maximum mean diameter of the group.
The experimental design and result are shown in Table 1. As can be seen in the table, within the range tested in this experiment, the highest score can be obtained separately when the amount of SPC is 480 mg (drug-SPC ratio of 1:8, w /w ), the amount of cholesterol is120 mg (cholesterol-SPC ratio of 1:4, w /w ), and volume percentage of TBA in the co-solvent is 50%. Therefore, these parameters were chosen as the center level of response surface optimization design, respectively.
Parameter Optimization by Box-Benhnken Design
To further study the interactions between the various factors, parameter optimization was performed by Box-Benhnken design. Based on the results of single-factor experiments, we investigated and optimized the interactions between the parameters, including quantity of SPC (X 1), quantity of cholesterol (X 2), volume percentage of TBA (X 3) by Box-Benhnken design (BBD). Encapsulation efficiency (Y 1) and mean diameter (Y 2) were selected as responses. Optimization process was undertaken with desirability function to optimize the two responses simultaneously. We suppose that Y 1 and Y 2 have the same weightiness (importance). 是 1 had to be maximized, while Y 2 had to be minimized. The desirable ranges are from 0 to 1 (least to most desirable). Experimental design and results are shown in Table 2. To find the most important effects and interactions, analysis of variance (ANOVA) was calculated by statistical software, Design Expert trial version 8.03 (Stat-Ease, Inc., Minneapolis, USA). Two quadratic models were selected as suitable statistical model for optimization for two responses encapsulation efficiency and mean diameter. The results of ANOVA relating encapsulation efficiency as response were shown in Table 3, indicating that the model was significant for all factors investigated with F value of 12.81 (P <0.05)。 In this case, X 1, X 2, X 1X 2, X 1X 1, X 2X 2 were significant model terms (P < 0.05), demonstrating that the influences of the factors (X 1 and X 2) on encapsulation efficiency were not simply linear. The interaction terms were notably significant, indicating good interactions between the factors. On the contrary, the ANOVA results relating mean diameter as response (Table 3) indicated that the model was not significant for all factors investigated with F value of 1.9 (P> 0.05)。 In this case, X 3 were significant model terms (P < 0.05), demonstrating that volume percentage of TBA have significant influence on mean diameter, while quantity of SPC (X 1) and quantity of cholesterol (X 2) do not have a significant effect (P> 0.05)。 Moreover, there were no significant interactions between the three variables.
In order to provide a better visualization of the effect of the independent variables on the two responses and desirability value, three-dimensional profiles of multiple non-linear regression models are depicted in Fig. 8. Figure 8a–f presented the interaction of X 1, X 2, and X 3 under encapsulation efficiency and mean diameter as response respectively. The three-dimensional profiles demonstrated how three pairs of parameters affect the encapsulation efficiency and mean diameter of reconstituted liposomes. For encapsulation efficiency, all the three surfaces are upper convex (Fig. 8a–c), with a maximum point in the center of the experimental domain, which demonstrated that there are good interactions between the three variables. For mean diameter, the shape of Fig. 8d is similar to flat surface, indicating that X 1 and X 2 have less effect on mean diameter. The surface contours of Fig. 8e, f both showed a slope; the mean diameter was decreased by increasing the volume percentage of TBA, indicating that factor X 3 had an obvious effect on mean diameter but there was no obvious interaction between X 3 and the other two factors.

Three dimensional plots of the effect of X X (a ), X X (b ) and X X (c ) on encapsulation efficiency and the effect of X X (d), X X (e) and X X (f) on mean diameter
Based on the quadratic model, the optimal conditions for liposomes preparation calculated by software were as follows:508 mg phospholipid quantity, 151 mg cholesterol quantity, and 55% volume percentage of TBA. Under these conditions, the encapsulation efficiency and mean diameter were found to be 68.55% and 220 nm, respectively.
Selection of the Type and Dosage of Lyoprotectant
Competition for liquid water between the growing ice crystals and the hydrophilic substances (including the hydrophilic portion of the lipid membrane) during freezing leads to adhesion of ice crystals to the phospholipid groups. This can result in damage to the lipid membrane. Lipid membrane fusion following rehydration causes an increase in particle size and leakage of encapsulated drug. Lyoprotectant can reduce liposomal damage during the freeze-thaw process [32]. In this study, we investigated the effect of various types (lactose, sucrose, trehalose, mannitol) and dosage (lyoprotectant to SPC ratio was 1:2, 1:1, 2:1, 4:1, and 6:1 w /w ) of lyoprotectant on scores of reconstituted liposome. Single-factor experiments were performed while maintaining all other variables constant:GA amount of 60 mg, SPC amount of 508 mg, cholesterol amount of 151 mg, volume percentage of TBA in the co-solvent of 55%, pre-freeze temperature of − 40 °C, pre-freeze time of 12 h. Experimental results are shown in Fig. 9. The encapsulation efficiency increases firstly and then decreases by decreasing lyoprotectant/SPC weight ratio from 1:2 to 1:6, wherein lactose, sucrose, and mannitol are respectively used as lyoprotectant. However, the encapsulation efficiency of the trehalose group increases constantly with decreasing lyoprotectant/SPC weight ratio (Fig. 9a). In terms of the mean diameter (Fig. 9b), it was found that the mean diameter was greater than 218 nm for lactose, sucrose, and mannitol group in the range from 1:2 to1:6. Nevertheless, the mean diameter of trehalose group can be reduced to less than 190 nm when lyoprotectant/SPC weight ratio is more than 4:1; obviously, the protective effect of trehalose is better than other lyoprotectants tested. Trehalose has a good protection ability for membrane, perhaps because of the formation of hydrogen bonds with the polar head groups of lipids, and disruption of the tetrahedral hydrogen bond network of water [33]. According to scores (Fig. 9c), the highest score (0.24) was obtained when trehalose/SPC weight ratio is 4:1 and 6:1. Finally, we choose trehalose and 4:1 (trehalose/SPC weight ratio) for following experiments from the perspective of cost and increasing drug loading.

The effect of mass ratio between cryoprotectant and SPC on encapsulation efficiency (a ), mean diameter (b ) and scores (c ) of reconstituted liposomes (mean ± SD, n =3)
Through the above Box-Benhnken design and lyoprotectant screening experiment, the experimental conditions were determinated:GA amount of 60 mg, SPC amount of 508 mg, cholesterol amount of 151 mg, volume percentage of TBA in the co-solvent of 55%, weight ratio of trehalose to SPC was 4:1. Under these conditions, the encapsulation efficiency and mean diameter were 74.87% and 191 nm, respectively.
Transmission Electron Microscopy
In this study, TEM of liposomes suspension was taken at the same time point (same hydration time). We have observed different states in the sample, which could explain the self-assembly behavior of the liposomes. Figure 10a shows the initial state of hydration; it can be seen that a large amount of GA (black dots) is wrapped in dispersed phospholipids (translucent material), and spontaneous aggregation of the phospholipid fragments occurs. Figure 10b shows the morphology of fully assembled liposomes (average diameter of about 200 nm), which were nearly spherical with a phospholipid bilayer structure (the light-gray portion). Moreover, the drug particles (dark gray dots) were entrapped in the lipid bilayer.

Transmission electron micrographs of reconstituted liposomes, (a ) initial state of hydration of proliposomes, (b ) fully assembled liposomes
Stability of GA Proliposome
After 6 months, the proliposome powders have a good mobility and an unaltered appearance. The liposome suspension formed automatically when in contact with purified water. The entrapment efficiency and particle size of the reconstituted liposome were 72.82% and 198 nm. There is no significant difference from the data of the reconstituted liposome 6 months before. Therefore, the GA proliposome could be considered stable at 25 °C for over 6 months.
In Vitro Drug Release Studies
Evaluation of in vitro drug release from encapsulated liposome was done by dialysis method. The in vitro release profiles of GA from GA-loaded liposomes at 37 °C in PBS (pH 7.4) and physiological saline solution are shown in Fig. 11. The release profile of both group showed a fast release (the larger slope) within 1 h, then curve slope becomes smaller after 1 h, the release rate begins to slow down. The drug-release curve shapes of physiological saline solution group are similar to PBS group. The in vitro release of GA from the GA-loaded liposomes was 65.25 ± 4.82% and 69.46 ± 4.32% from PBS and physiological saline solution in 12 h. No significant difference (P = 0.088, paired t test, SPSS software17.0) was found for the release of GA at different release medium over the entire study period, which demonstrated that the reconstituted liposomes have both sustained-release performance in two kinds of release medium.

In vitro dissolution profiles of GA from GA-loaded liposomes in a PBS and b physiological saline solution (mean ± SD, n = 3)
In Vitro Cell Uptake
Figure 12a showed that the uptake process of GA-liposomes by Hep G2 cells is time-dependent under the experimental concentrations. After incubation for 30 min, the uptake amounts of drug-loaded liposomes (unit mass protein) by Hep G2 cells were 1480 ng. In the range from 30 to 240 min, the uptake amounts of drug-loaded liposomes (unit mass protein) were gradually increased from 1480 to 2030 ng. Figure 12b–e showed fluorescence microscopy images of Hep G2 cells at 30, 60, 120, and 240 min after ingestion of drug-loaded liposomes, and it is observed that the fluorescence intensity is also gradually increased over time. This result indicates that the reconstituted liposomes prepared by monophase solution method can be effectively uptaken by the hepatoma cells.

In vitro cellular uptake of GA-loaded liposomes by Hep G2 cells. 一 The uptake amount versus incubation time. b –e Fluorescence microscopy images at 30, 60, 120, and 240 min
Conclusions
In the present work, preformulation investigation, formulation design along with in vitro characterization of GA-loaded liposomes by lyophilization monophase solution method have been done. After carrying out a preformulation study, we found that solubility of GA, cholesterol, and SPC in TBA/water co-solvent was substantially increased when temperature was over 40 °C. Sublimation rate of co-solvent gradually increased with increasing TBA volume percentage, which perhaps relate to surface morphology of the frozen co-solvent and saturated vapor pressure. After lyophilization using TBA/water co-solvent system, GA became amorphous structure; moreover, water solubility increased. This may have an effect on proliposome encapsulation during hydrated reconstruction. After optimization by Box-Benhnken design and screening of lyoprotectant, the optimum conditions (508 mg SPC, 151 mg cholesterol, 55% volume percentage of TBA, 4:1 trehalose/SPC weight ratio) for lyophilization monophase solution process were achieved. Under the optimum conditions, satisfactory encapsulation efficiency (74.87%) and mean diameter (191 nm) of reconstituted liposomes were obtained. The reconstituted liposomes resulted in initial assemble and final spherical shape, as confirmed by TEM analysis. The in vitro release profile of the produced GA-loaded liposome was investigated in the two media and it both showed prolonged release during 12 h. Cellular uptake studies showed that the uptake process of reconstituted liposomes by Hep G2 cells is time-dependent.
缩写
- BBD:
-
Box-Benhnken design
- DSC:
-
差示扫描量热法
- EE:
-
Encapsulation efficiency
- FTIR:
-
傅里叶变换红外光谱
- GA:
-
Glycyrrhetinic acid
- MD:
-
Mean diameter
- SPC:
-
Soybean phosphatidylcholine
- 待定:
-
Tert-butyl alcohol
- TEM:
-
透射电子显微镜
- XRD:
-
X射线衍射
纳米材料
- 使用来自轧制废料的磁铁矿纳米吸附剂从水溶液中吸附去除铜 (II) 离子:合成、表征、吸附和动力学建模研究
- 钴掺杂 FeMn2O4 尖晶石纳米粒子的制备和磁性
- 走向 TiO2 纳米流体——第 1 部分:制备和性质
- 石墨烯和氧化石墨烯的体外和体内生物安全和抗菌能力
- 中空结构LiNb3O8光催化剂的制备和光催化性能
- 通过聚乙二醇化脂质体改善蟾蜍灵的抗肿瘤功效和药代动力学
- 钯(II)离子印迹聚合物纳米球的制备及其从水溶液中去除钯(II)
- 磁性聚(N-异丙基丙烯酰胺)纳米复合材料:制备方法对抗菌性能的影响
- 使用分子束外延法制备锗铋薄膜及其光学特性
- 低聚(乙二醇)二丙烯酸-甲基丙烯酸热敏聚合物纳米凝胶的制备及其性能表征
- 使用气体监测解决方案的应用和好处
- 使用瞬态和锁定热成像对结构进行无损评估