

Sn2+ 掺杂:调节 Fe3O4 纳米粒子磁化浸渍温度/振幅、不可逆性和居里点的策略
摘要
掺杂磁铁矿 (Snx Fe3-2/3x O4) 具有不同 Sn 2+ 量的纳米颗粒 (NPs) (12–50 nm) 离子 (x ) 使用共沉淀法合成。 Sn 2+ 掺杂减少了 Fe3O4 NPs 向磁赤铁矿 (γ-Fe2O3) 的预期氧化,使其在多种磁性应用中具有吸引力。加热-冷却循环期间的详细表征揭示了调整这些纳米颗粒异常观察到的磁化倾角温度/幅度、不可逆性和居里点的可能性。我们将这种下降归因于 NPs 表面 γ-Fe2O3 的化学还原。随着浸渍温度的升高,我们发现掺杂 Sn 2+ 减小倾斜幅度,直到当 x 时它大约消失 =0.150。基于这些 NPs 的核壳结构,一种结合了修正布洛赫定律 (M =M 0[1 - γ (T /T C )] β ) 和修正的居里-魏斯定律 (M =− α [1/(T - T C ) δ ]) 是为了解释观察到的 M -T 在不同外加磁场和不同 Sn 2+ 下的行为 浓度。通过施加足够高的磁场,参数γ的值 和 δ ≈ 1,这与修正的布洛赫定律和居里-魏斯定律相同。它们不随磁场变化而仅取决于材料结构和尺寸。幂β 高磁场为 2.6,这与核主导磁化的这种纳米颗粒尺寸一致。然而,β 对于小磁场,值在 3 到 10 之间波动,表明居里-魏斯项提出的壳结构有额外的磁性贡献。参数 (α ) 有一个非常小的值,它在高磁场中变成负值。
介绍
从技术和理论的角度来看,金属氧化物纳米颗粒都很有吸引力。其中,氧化铁纳米粒子因其在磁流体、颜料、信息存储盘以及磁引导药物递送、细胞分离和癌症诊断等医学应用领域的大量应用而广受欢迎[1,2,3,4, 5,6,7,8,9]。磁铁矿 (Fe3O4) 纳米颗粒特别适用于医疗应用,因为它们具有生物相容性和大块饱和磁化强度 (Ms),在 300 K 时为 92 emu/g [10, 11]。然而,这些纳米粒子的热不稳定性可能是这些应用的一个缺点,因为即使在温度和压力的环境条件下,尺寸为 ~ 8-22 nm 的纳米粒子也很容易被氧化成磁赤铁矿 (γ-Fe2O3)——尽管体积可以在 ~ 220 °C 下完成 [12]。磁赤铁矿是一种类似于磁铁矿的亚铁磁性材料,具有相同的尖晶石结构,但在 300 K 时的 Ms 较低,为 78 emu/g [10]。通过加热到大约 850 K(居里点),Fe3O4 可以在结构上转变为具有零 Ms 的反铁磁性类刚玉结构赤铁矿 [13]。这些转变受粒度、温度和压力控制。由于热不稳定性,很少对高温下的 Fe3O4 颗粒进行研究。最近,有机封端(例如油酸盐封端的 Fe3O4 纳米粒子)对纳米粒子 (NP) 磁化的影响受到更多关注 [14]。结果表明,在加热-冷却循环中,Fe3O4 NPs 表现出不可逆的M 具有两种特殊效果的行为,即 M 中的下降和循环 (T ) 曲线。浸渍和不可逆磁化归因于Fe 3+ 的诱导还原 到 Fe 2+ 和分别在封端配体分解时烧结。我们在这项研究中的目的是彻底了解这些特殊效应的原因、它们的性质、稳定性、对磁化的影响以及 Fe 3+ 的表面还原 到 Fe 2+ 以及它们与 NPs 在高温下的烧结过程的关系。由于 Fe3O4 NPs 可以很容易地在表面上形成 γ-Fe2O3 壳(即,此后称为壳的薄层)作为覆盖层,并利用了用某些离子如 Sn4+ 和 Ti 4+ 显示 Fe 3+ 的减少 到 Fe 2+ 在还原过程 [15, 16] 中,我们因此探索了通过 Sn 2+ 调整温度相关磁化曲线中那些特殊效应(即倾角和环路)的可能性 Fe3O4纳米颗粒的掺杂
为了研究Sn 2+ 掺杂对磁铁矿纳米粒子的稳定性、磁化浸渍和高温不可逆性的影响,Snx Fe3-2/3x O4 纳米粒子 (12–50 nm) 与 (x =0.000、0.045、0.090 和 0.150),使用几种互补技术进行制备和表征。使用振动样品磁强计 (VSM) 测量磁化强度,同时将样品反复加热至 900 K (5 K/min) 并冷却回室温 (300 K)。在第一次加热-冷却循环期间,在特定温度和一定幅度下注意到磁化强度的不可逆下降。浸渍温度、振幅、不可逆性、磁化发散(即加热和冷却循环中特定温度下的磁化值不同)和居里点随 x 变化的证据 被观察和解释。与观察到的加热 - 冷却状态的不可逆性只能预期无配体的 Fe3O4 NPs 的解释相反,我们表明发散可以通过在磁性测量期间施加到 Fe3O4 NPs 的外部磁场来控制,并且在更高的温度下消失应用领域。此外,我们证明 M -T 原始和 Sn 2+ 可以通过一种新方法预测第一次加热 - 冷却循环后的掺杂 Fe3O4 NP,该方法结合了不同 Sn 2+ 的修正布洛赫定律和居里-魏斯定律 浓度和不同外加磁场。
方法/实验
材料
氨水(Mw =17.03,30%)和无水乙醇购自默克公司,六水氯化铁(Mw =270.3,≥ 99%)和四水氯化亚铁(Mw =198.8,≥ 99%)购自 Sigma-Aldrich,氯化亚锡 (Mw =189.60, ≥ 98%) 从 Fluka 获得。所有化学品均未经进一步纯化直接使用。
方法
Sn 2+ 纳米粒子 标称成分为 Snx 的掺杂 Fe3O4 Fe3-2/3x O4 (x =0.000、0.045、0.090 和 0.150),其中 Sn 2+ 替代 Fe 3+ , 使用共沉淀在 80 ° 回流下制备 C 4 小时。在 50 °C 下,将氨水加入到六水氯化铁、四水氯化亚铁和氯化亚锡的化学计量溶液中,直至达到 pH ≈ 10.4。然后通过过滤去除沉淀物,用蒸馏水和乙醇洗涤,并在室温下非常小心地干燥,避免高温导致形成掺杂锡的磁赤铁矿,正如 Berry 等人所证明的那样。 [16].
原始 Fe3O4 纳米颗粒的表面覆盖有 2 nm 的金层(99.99% 金靶,Scotech),使用电子束蒸发(沉积速率 ~ 0.47 Å/s)连接到 Mantis Deposition Ltd. 的 Nanosys 550 纳米颗粒沉积系统。以检验表面效应。
特征
连接到量子设计物理特性测量系统 (Dynacool PPMS) 的 VSM 用于在 2 到 900 K 的温度范围内进行磁场测量(特斯拉)。居里点是通过将 M 曲线外推到 x -轴在遵循参考文献 [17] 中使用的程序的第一个加热方案期间。使用 JOEL 数字高分辨率 (JEN-2100F) 透射电子显微镜 (HRTEM) 和 (X'Pert PRO) 衍射仪表征样品的形态,使用标准 Cu-Kα 辐射进行 X 射线粉末衍射 (XRD) 图案。 MAUD 软件用于执行简单的 XRD Rietveld 精修 [18]。使用场发射扫描电子显微镜(JOEL,JSM 7600F)进行元素映射(EDX)。使用配备半球形电子分析仪的 Omicron Nanotechnology 多探针光电子仪器获得 X 射线光发射光谱 (XPS),其中在 10 -9 使用 Al Kα 辐射(1486.6 eV) 毫巴。 284.6 eV 的固有碳峰用于校准。 Casa XPS 软件用于 XPS 数据分析 [19]。傅里叶变换红外 (FTIR) 光谱从 PerkinElmer (SpectraOne) 获得,使用透射模式,KBr 颗粒在 400–4000 cm -1 范围内 .
结果与讨论
M的主要特点 -T 第一个加热周期的曲线
图 1a-d 显示了磁化强度的变化(M ) 作为样品温度的函数;原始的 Fe3O4- 和锡掺杂的 Snx Fe3-2/3x 具有不同x量的O4纳米颗粒 .将样品从 300 加热到 900 K(图 1 的 A 点到 B 点)并冷却(B 点到 C 点)进行第一次加热-冷却循环,同时施加 200 Oe 的外部磁场。在相同磁场下重复曲线 D 到 E 所示的加热-冷却循环的测量,直到达到稳定的磁化数据。原始的 Fe3O4 纳米颗粒(图 1a)经历了五次加热-冷却循环。为清楚起见,我们只展示了三个循环,因为此后在加热-冷却过程中磁化强度不再发生变化。掺杂的样品(图 1b-d)仅加热和冷却 3 次,因为在第二个循环后 M 没有明显变化(图中显示了两个循环)。在温度范围从 300 到 900 K 的地方注意到四个明显的特征。首先,在原始样品中发生了大约 10 emu/g 的磁化下降 (x =0.000) T 之间 1 (564 K) 和 T 2 (655 K),同时在第一个加热-冷却循环中从 A 点到 B 点。这种下降也发生在掺杂样品中,但随着浸渍温度的升高 (T 1、T 2) 作为 x 增加(图 2a)。这种增加可能归因于由于 Sn 掺杂导致的粒径增加,如图 S1 所示的 HRTEM 测量证实。确保 Sn 2+ 离子在整个结构中均匀分布,纯元素和 Snx 的元素映射 Fe3-2x 带有 x 的 /3O4 掺杂样品 =0.150(图 S2 和 S3)。
<图片>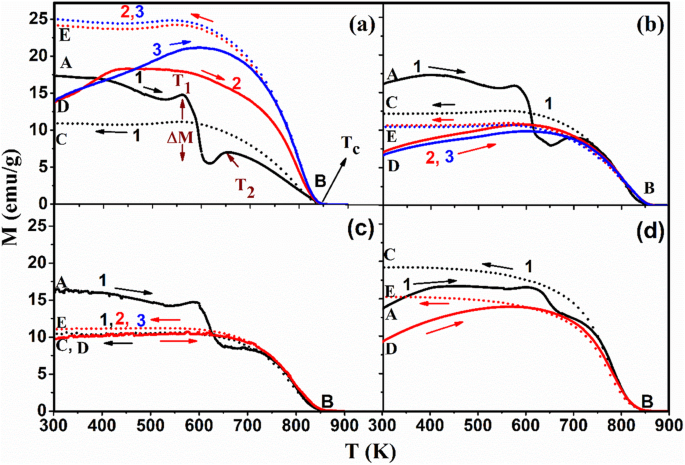
磁化强度 (M) 随原始温度和 Snx 的变化 Fe3-2/3x Sn 2+ 的O4纳米颗粒 (x ) 金额 a 0.000(原始 Fe3O4),b 0.045,c 0.090 和 d 分别为 0.150,对于不同的加热-冷却循环 [for a 和 b ,黑色表示第一个;红色,第二;蓝色,第三和 c 和 d , 仅显示 2 个周期](磁场 H =200 Oe)(实线,加热;虚线,冷却)
<图片>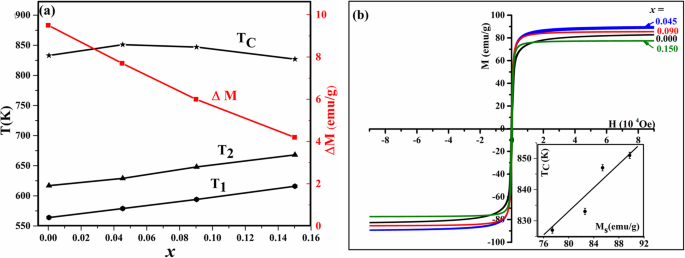
一 T 1、T 2、ΔM , 和 T 在第 1 次加热方案和 b 期间获得的 c 值 不同数量的 x 的磁滞回线 对于 Snx Fe3-2/3x 2 K下的O4纳米颗粒(插图,居里温度与饱和磁化强度的关系)
如上所述,在尺寸为 20 nm 的油酸盐封端的磁铁矿纳米粒子中也报道了类似的浸渍,这归因于封端配体的热分解。随着分解,Fe 3+ 的减少 到 Fe 2+ 加热后也用拉曼和穆斯堡尔光谱[14]观察。
有趣的是,在 Kolen'ko 等人报道的未加盖的 Fe3O4 样品中没有检测到浸渍特征。 [14]。虽然在我们的样品制备中没有使用封端配体,但纳米颗粒的表面受到氧化为磁赤铁矿 (γ-Fe2O3) 或 Sn 2+ 的影响 -相关的氧化物,两者都可以作为覆盖层。因此,在第一次加热-冷却循环中 M 的浸渍表明这些纳米粒子表面的氧化层发生了热分解(即 Fe 3+ 和 Sn 2+ , Sn 4+ 离子)。对于较小的颗粒,由于它们的比表面积较大,这种分解将在较低的温度下发生。先前报道的无定形 γ-Fe2O3 纳米粒子在 523 K 的真空环境中的还原支持了这一解释 [20]。第二个观察到的特征与M有关 倾斜幅度(标记为 ΔM 在图 1a)。 ΔM 随着 Sn 2+ 的量减少 由于掺杂过程[11, 16]导致γ-Fe2O3量的减少而增加(图2a)。
第三个特征是加热-冷却曲线是不可逆的(即M 加热过程中的曲线不同于冷却)。这与阻塞特征有关,因为加热后,TEM 图像证实了粒径增加(图 3)。粒径的增加会增加磁晶各向异性能量(E A ) 根据 Wolfarth 模型的单域粒子,如下所示。
$$ {E}_A=KV\ {\mathit{\sin}}^2\theta $$ (1)其中 K 是磁晶各向异性常数,V 是纳米粒子的体积,θ 是磁化方向与纳米颗粒的易磁化轴之间的角度 [21, 22]。因此,需要更多的热能来克服磁各向异性能量并使磁自旋随机化。由于加热而产生的随机取向的自旋将在一定温度下通过冷却开始受到外加磁场的影响。当温度达到T 如图 2 所示,当接近室温时,这些对齐的自旋将被阻止获得高恒定磁化强度(详细解释在“加热-冷却图的分歧起源”部分)。第四个特征是居里温度的依赖性(T C) 关于Sn 2+ 的量 如图 2a 所示掺杂,这与 Sn 2+ 的影响有关 离子对饱和磁化强度 (Ms) 的影响如图 2b 所示。因此,预计作为 M s 增加,T C 将增加,如图 2b 的插图所示,这与之前的报告 [11, 16] 非常吻合。上述四个特征都表明了一种通过 Sn 2+ 调节 Fe3O4 纳米颗粒磁化强度、浸渍温度/幅度、不可逆性和居里点的策略 兴奋剂。
<图片>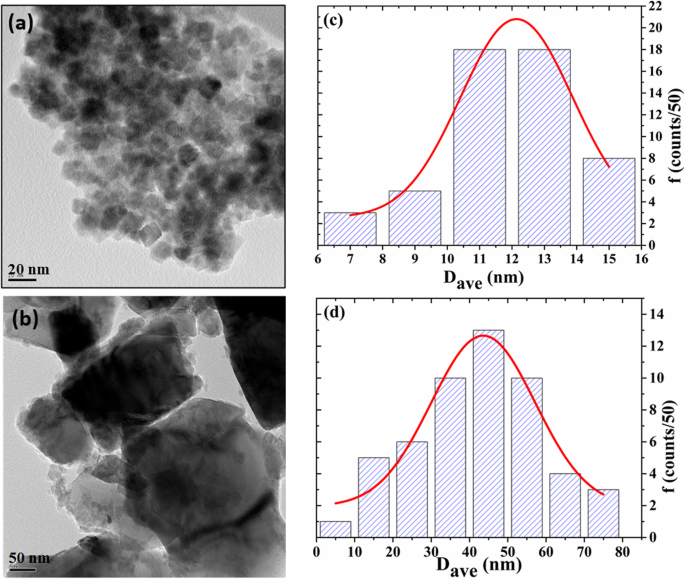
制备的Fe3O4纳米颗粒a的TEM图像和尺寸分布直方图 , c 在退火和b之前 , d 加热到 900 K 后(c 处的红色实线 和 d 是正常的拟合)
加热样品的表征
尽管获得并讨论了原始样品加热至 900 K 的结果,但为了研究第一浸渍温度 (T 1),在原位加热到 600 K 的高温 VSM 测量后,还对同一样品进行了额外的结构和磁性测量。图 4a 显示了原始样品加热前的 XRD 图案及其 Rietveld 精修,加热后通过高温 VSM 测量值达到 600 K 和 900 K。用于将样品固定在加热棒上以进行高温 VSM 测量的水泥(胶水)的 XRD 峰用小的实心方块表示作为参考。在加热之前,图案被索引到与尖晶石相关的结构 (SG#227)。 311 和 222 峰之间存在重叠,通常分别出现在 2θ 等于 35° 和 37° 处。这表明存在 γ-Fe2O3 相,因为它具有与磁铁矿相同的尖晶石结构,但具有较小的晶格参数。这种重叠在加热到 600 K 后消失,这表明由于 Fe 3+ 的还原,γ-Fe2O3 相减少或被抑制 到 Fe 2+ (忽略大约 35° 处的正方形顶部的峰,这是指胶水)。此外,由于 (220) 和 (440) 峰分别出现在约 30° 和 62° 处,仅与没有胶水的氧化铁有关 [23],我们在图 4b 和 c 中指出了这些峰的放大图。加热到 600 K 后,两个峰都向更高的反射角移动约 0.3°,这表明 (d) 间距值减小。这种降低通常与氧化物纳米颗粒的高温退火有关,这通常会导致溶剂去除和缺陷消失,从而导致晶格参数值降低 [14]。根据 Scherrer 方程,由于结晶度提高和微晶尺寸增加,两个峰的半峰全宽减小。峰的形状从对称变为不对称,具有更陡的低角度侧。如上所述,磁铁矿相和磁赤铁矿相具有相同的尖晶石结构,但磁铁矿的晶格参数稍大(反射角较低);不对称性表明磁铁矿相在 30.3° 处增加,与 30.5° 处的磁赤铁矿相比具有较低的角度峰。 γ-Fe2O3 相的减少将增加 T1 处的 M 值,因为磁铁矿具有更大的饱和磁化强度,并且在第一次加热-冷却循环中发生的不可重复过程解释了 M -T 随后的加热-冷却循环曲线。加热到 900 K 后,峰变尖,同时保持相同的角度,表明 TEM 图像(图 3)(从 12 nm 到 30 nm)证实了微晶尺寸的增加更多。这种锐度体现在 M -T 曲线随着 M 的增加而增加 在 T 2.
<图片>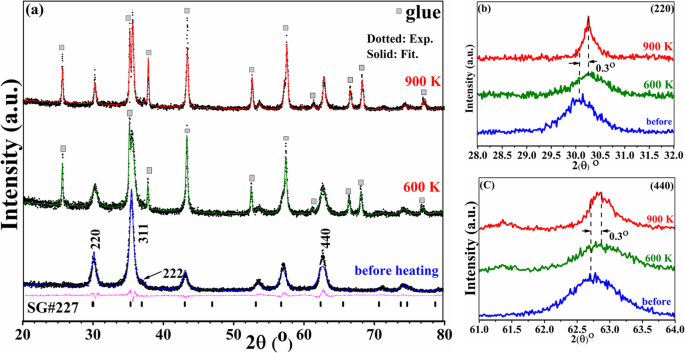
一 原始 Fe3O4 加热前和加热到 600 K(绿色)、900 K(红色)后的 XRD 图谱(黑色虚线,实验数据;实线,拟合;品红色,差异;pars,SG #227 相)(小填充方块代表用于高温 VSM 测量的胶水的峰值),b (220) 峰值的放大模式,以及 c (440)峰的放大图
由于两个峰 (220) 和 (440) 的不对称特征不仅提供了使用 XRD 区分双尖晶石磁铁矿和磁赤铁矿相的可靠证据。因此,通过 XPS 测量证实了在高退火温度下 γ-Fe2O3 相的减少或抑制。图 5a 显示了从原始样品加热到 900 K 之前和之后获得的 XPS 核心级电离 Fe 2p3/2 光谱。可以从结合能为 709 eV 和 711 eV 的解卷积 Fe 2p3/2 峰中找到两个组分,代表 Fe 2+ (22%) 和 Fe 3+ (77%) 状态,分别在 708 eV [24, 25] 处具有峰值前低能量尾部。在 900 K 加热时,随着两种组分结合能的降低,一定量的 Fe 3+ (72%) 状态转变为 Fe 2+ (19%) 和金属 Fe (9%)——在 705 eV 处描绘的组分——作为 γ-Fe2O3 相还原的反映。
<图片>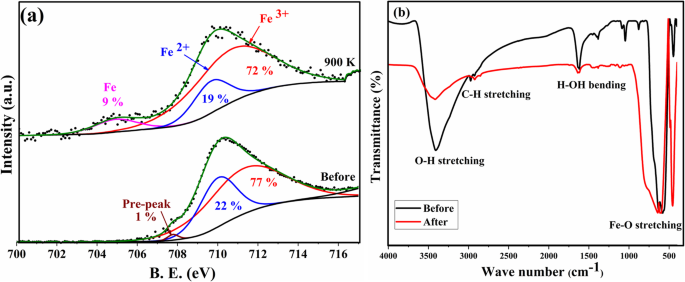
一 从原始 Fe3O4 样品中记录的 Fe 2p3/2 在加热到 900 K(红色,Fe 3+ ;蓝色,Fe 2+ ;品红色,Fe 金属尾)。 b Fe3O4 纳米粒子加热至 900 K 前后的 FTIR 光谱(透射与波数)
原始 Fe3O4 纳米粒子在加热到 900 K 之前和之后的 FTIR 光谱如图 5b 所示。 583 cm −1 处的强峰 和 634 cm −1 如图所示,被指定为 Fe-O 键的拉伸。加热样品后,这些峰变宽并转移到更高的频率,表明由于结晶度的提高和微晶尺寸的增加,Fe-O 键增强,使用 XRD 测量证明。 1402 cm −1 之间的峰 和 878 cm −1 与吸附物特征有关 [26,27,28] 并在 900 K 加热后消失。3413 cm -1 处的峰 和 2974 cm −1 与来自环境 OH − 的拉伸键有关 和 CO2 组,分别[27]。这些峰的强度因加热而降低,这是由于烧结过程而被接受的。 1619 cm −1 处的峰值 与来自大气的羟基相关的键的弯曲有关,其强度也随着加热而降低。
因此,由于 T 处的还原过程引起的磁化变化 1 和 T 处的烧结过程 2 导致观察到的磁化倾斜。原始样品在加热到 600 K 和 900 K 之前和之后的滞后回线(图 6)表明 M 略有增加 加热后有利于Fe 3+ 的还原 T 处的离子 1. 剩磁和矫顽力(图 6 插图)在加热到 900 K 后增加,而在加热到 600 K 后它们没有变化,这证实了烧结过程发生在 T 2,因此证实了从 XRD 和 FTIR 测量中发现的结果。
<图片>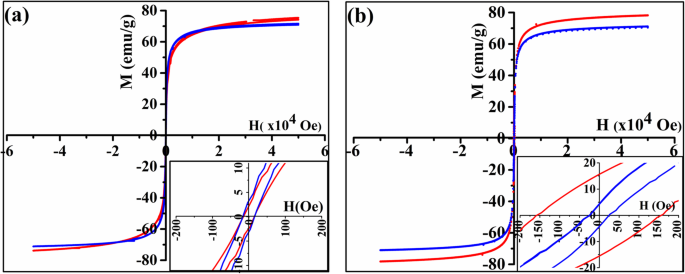
原始 Fe3O4 纳米粒子在加热前(蓝色)和加热后(红色)直到 a 的磁滞回线 600 K 和 b 900 K(插图显示低磁场下的磁化强度)
加热-冷却图分歧的起源
为了研究在加热和冷却时观察到的 M 发散的起源(图 1)及其与阻塞温度的关系,在加热和冷却时对原始样品进行了更多测量,同时加热和冷却,如图所示图 7. 可以清楚地看到,当施加 2 T 的高磁场时收集测量值时,发散(标记为圆环)消失了(即,这种发散简化了这些纳米粒子在外部的阻塞温度的识别) 200 Oe的磁场)。
<图片>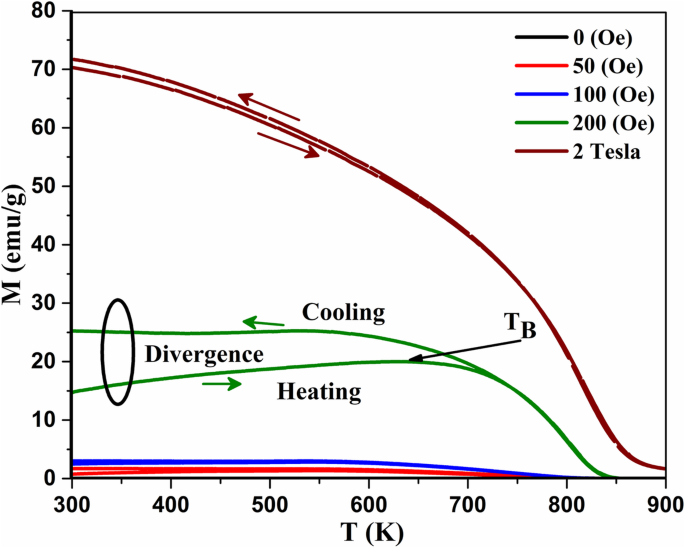
磁化强度的变化 (M ) 原始 Fe3O4 纳米粒子在不同外磁场 (H )。在 H =200 Oe,阻塞温度 T B 可以清楚地看到加热曲线和冷却曲线之间的磁散度(用圆环标记)
在此基础上,使用零场冷却-场冷却 (ZFC-FC) 协议和 200 Oe 的外部磁场对原始样品进行高温 VSM 测量后进行额外的低温 VSM 测量(2-400 K)高达 600 K 和 900 K,并与加热前的相同样品进行比较(图 8)。
<图片>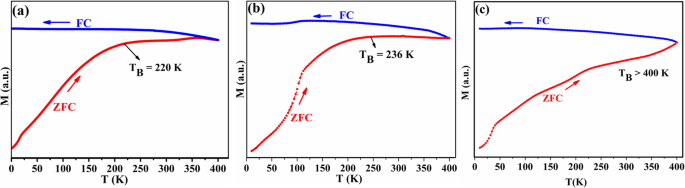
ZFC-FC (M -T ) 曲线在低温 (H =200 Oe) 对于原始 Fe3O4 a 加热前b 在加热到 600 K 和 c 后,使用水泥作为胶水的原始 Fe3O4 900 K
加热至 900 K 的样品的封闭温度高于加热至 600 K 的样品和未加热样品的封闭温度。这是预料之中的,因为加热到 600 K 的样品在加热/冷却状态下显示出非常小的差异(图 9a)。这强化了在 600 K 时,Fe 3+ 的减少 到 Fe 2+ 颗粒尺寸和阻塞温度都没有任何增加。因此,我们得出结论,第一个浸渍温度指的是减小,而第二个温度指的是颗粒尺寸的增加,如图 9 所示。相同的特征(增加 M 冷却时)对于带有 x 的样品是显而易见的 =0.150 来自第一次加热 - 冷却循环(图 1d),这证明掺杂这种量的 Sn 将产生相同的热磁趋势,并会在冷却过程中在较高温度下阻止自旋。这使得 Snx Fe3-2/3x O4 与 x =0.150 在需要在高温下使用时更加实用和适用。应该提到的是,油酸封端的 Fe3O4 的发散特征先前由 Kolen'ko 等人报道。并归因于其样品中存在 γ-Fe2O3。然而,情况并非如此,因为它被揭示与图 7 中解释和描绘的外部施加的磁场有关。因此,在加热到新的阻塞温度 (T 2),由于受阻磁矩的热激发,磁化强度增加。然而,当再次冷却到阻塞温度时,自旋在高磁化强度下被阻塞,热能无法克服外加磁场引起的磁能,如图 9 中的洋红色箭头所示。
<图片>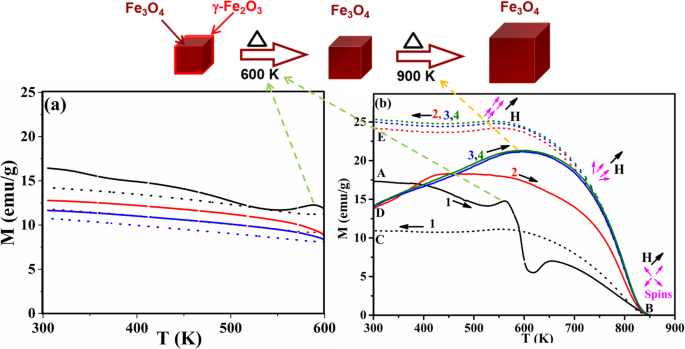
磁化强度的变化 (M ) 与温度 (T ) 对于原始 Fe3O4,同时加热到 a 600 K 和 b 900 K 在三个加热-冷却循环中使用 200 Oe 的磁场。图上方的示意图代表了随着温度从 300 升高到 900 K 时 NPs 形貌的变化(最初,Fe3O4 NPs 覆盖着一层薄薄的 γ-Fe2O3 表面层,作为壳。加热到600 K,发生γ-Fe2O3湮灭,NPs开始团聚,直到900 K,品红色箭头表示自旋方向)
表面效果
为了研究这些纳米粒子团聚对磁化的影响,使用蒸发技术将少量原始 Fe3O4 样品覆盖上一层薄的 Au(~ 2 nm)。 M -T 图 10 显示了原始 Fe3O4 纳米粒子在加热至 900 K 并冷却三个循环后,含金和不含金的曲线图。
<图片>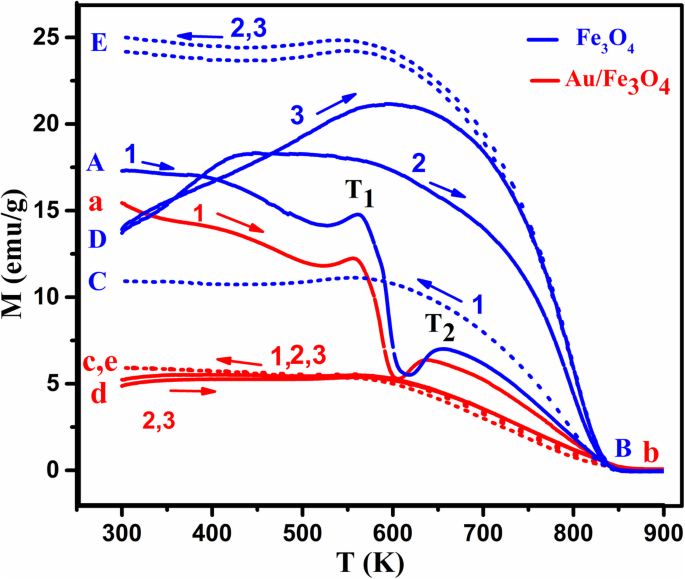
磁化强度的变化 (M ) 原始 Fe3O4(蓝色,大写字母)纳米粒子和 Au/Fe3O4(红色,小写字母)的温度,用于三个指示的连续加热-冷却循环(磁场 H =200 Oe)(实线,加热;虚线,冷却)
可以注意到,倾角幅度 (ΔM ) 被金覆盖的颗粒降低,类似于通过掺杂 Sn 2+ 观察到的行为 并且可以归因于通过在这些纳米粒子的表面上涂覆 Au 来减少氧化反应(即 γ-Fe2O3 相的数量)。对于第二个浸渍温度 (T 2),有两个观察。首先,与原始纳米粒子一样,T 处的磁化强度增加 2. 在此温度下,热能将解除这些纳米粒子的自旋,并使它们与磁场方向对齐。然而,T Au/Fe3O4 纳米粒子的 2 值降低,因为现在粒子间相互作用将减少,从而降低解除自旋所需的能量。
由于 Au 减少了这些纳米粒子的团聚,因此在第二个循环后原始纳米粒子出现的加热-冷却循环的差异非常小。加热前后 Au/Fe3O4 样品的磁滞回线(图 11)显示加热后 M 的减少,这可能与 Au 的抗磁效应有关。 The coercivity and remanence did not change which proves that there is no agglomeration, change in particle size or on the crystallinity of these nanoparticles after coating with gold.

Hysteresis loops for Au/Fe3O4 nanoparticles before and after heating to 900 K (inset at low magnetic field) (blue, before heating; red, after heating) (inset shows the hysteresis loops at low fields)
Theoretical Explanation
It is imperative to discuss two challenges faced while trying to understand the observed features of high-temperature NPs magnetization after reaching stable repeatable measurements (≈ 3rd cycles). The first is due to the deviation of the Bloch law normally used for the bulk to explain the observed change of in saturation magnetization with temperature for magnetic nanoparticles [29,30,31]. In this regard, many efforts have been made to modify Bloch law such as that reported by Kodama et al. [32]。 They started with Bloch formula:
$$ \mathrm{M}={\mathrm{M}}_0{\left[1-\upgamma \left(\frac{\mathrm{T}}{{\mathrm{T}}_{\mathrm{C}}}\right)\right]}^{\upbeta} $$ (2)and allowing the parameters γ 和 β —equal 1 and 3/2 for the bulk material, respectively—to change. Consequently, the value of β was found to lay between 3/2 and 2 for NPs. The increase in β value compared to that of the bulk is related to the collective thermal excitations of the ordered spin which produces an energy gap (ΔE ) between the ordered and disordered spins. This energy gap will reduce the spontaneous magnetization by an amount proportional to exp (− ΔE /k B T )。 Hence, Kodama et al. suggested to use the same value of β for the bulk (3/2) but by adding exp (− ΔE /k B T ) to Eq. 2. The second challenge is that our measurements were done in low magnetic fields and cannot be fitted with Bloch law alone since the spins are not saturated and the energy gap (ΔE ) will be affected by the magnetic field leading to change the measured magnetization. Motivated by the aforementioned challenges and in order to fit and justify our observed M -T graphs at different magnetic fields and different Sn 2+ concentrations, a simple phenomenological expression that combines both the modified Bloch law and Curie–Weiss law was introduced. This justification is based on a core-shell structure model for these nanoparticles [29]. Hence, we assume that each nanoparticle is composed of a core with saturated spins and a bulk like interchange interactions surrounded by a shell with randomly oriented spins. In the core, the magnetization is given by:
$$ {\mathrm{M}}_{\mathrm{H}-\mathrm{core}}={\mathrm{M}}_{\mathrm{H}}{\left[1-\upgamma \left(\frac{\mathrm{T}}{{\mathrm{T}}_{\mathrm{C}}}\right)\right]}^{\upbeta} $$ (3)which is the same modified Bloch law in Eq. 2 but by replacing Mo with M H - where the value of M at 300 K and at certain magnetic field. For the shell, there is no interchange interactions between the magnetic spins—like paramagnetic materials—and the M -T relation in this part (M H -Shell) will obey Curie–Weiss law as M H -Shell =C /(T − T C ), where C is the Curie constant. Hence, the deviation of our M -T curves from the modified Bloch law is related to the shell effect that decreases the magnetization and will disappear at high magnetic fields and high temperatures. The measured magnetization at each temperature (M exp) will be the total contribution of both the core and the shell parts. The best fit for the experimental magnetization (M ) of the pristine sample with the magnetic field (H ) (Fig. 12) and for M of the Snx Fe3-2/3x O4 with x (Fig. 13) was reached by applying the formula
$$ {\mathrm{M}}_{\mathrm{exp}}={\mathrm{M}}_{\mathrm{H}}{\left[1-\upgamma \left(\frac{\mathrm{T}}{{\mathrm{T}}_{\mathrm{C}}}\right)\right]}^{\upbeta}-\upalpha {\left(\mathrm{T}-{\mathrm{T}}_{\mathrm{C}}\right)}^{\updelta} $$ (4)其中 α , β , δ , γ , M H , 和 T C are parameters to be derived from the fitting. The second term will be positive for T <T C . We free the power (δ ) in the second part of Eq. 4 to see how it can affect the quality of our fitting. In order to verify our results, we tested the modified Bloch law proposed by Kodama et al. for the pure sample at high magnetic field of 2 T and the value of β was 2.6. This value is within the suggested range for this size of nanoparticles [32].

Change of magnetization (M ) with temperature during heating (after 3rd cycle) of the heated pristine Fe3O4 nanoparticles while applying different magnetic field H a 50 (Oe), b 100 (Oe), c 200 (Oe), and d 2 T (black dotted, experimental; pink solid, fitted using Eq. 4)

Change of magnetization (M ) with temperature during heating (the 3rd cycles) of the heated Snx Fe3-2/3x O4 nanoparticles with different amount of the indicated x (0.000, 0.045, 0.090, 0.150) (H =200 Oe) (black dotted, experimental; pink solid, fitted)
However, as can be seen in Fig. 14, fitting our M -T curves with the core-shell-related expression (Eq. 4) is better than the suggested modified Bloch law specially at high temperatures and low magnetic fields (i.e., for unsaturated magnetic spins).

Change of magnetization (M ) with temperature during heating for the 3rd cycle of the heated pristine Fe3O4 nanoparticles while applying a magnetic field H =2 (Tesla) (pink dotted, experimental; solid, fitted using the new bulk-shell expression (black) and the modified Bloch law proposed by Kodama et al. (green)). Green arrows indicate the temperatures where the modified Bloch law proposed by Kodama et al. failed to fully fit the experimental data
The change of the parameters in Eq. 4 with the applied magnetic field for the pristine Fe3O4 nanoparticles is shown in Fig. 15a. It can be noticed that M H increases as it is expected with the increase in the magnetic field. The values of γ and δ ≈ 1 and do not change with the applied field as they are depending only as mentioned above on the material structure and the particle size.

一 Change for the pristine Fe3O4 of M H (left) and T C (right) with the applied external magnetic field H and (the insets show the change in different parameters α (purple), β (blue), and δ (brown) in both cases and with γ (red) with respect to external magnetic field) b for Snx Fe3-2/3x O4 samples as a function of x taken at H =200 Oe (the insets show the change in different parameters α (purple), β (blue), and δ (brown) in both cases and with γ (red) with respect to x )
The (α ) parameter is a very small constant. It turns to negative sign for higher field which is reasonable since the high field will saturate the spins at the shell and the paramagnetic effect will be small. The β values fluctuated ranging from 3 to 10 with the magnetic field which is different than the obtained power for nanoparticles using modified Bloch law. This is acceptable since we use M H at 300 K instead of the saturated M s in Bloch law. T C values, which are the same as what founded experimentally at 200 Oe in Fig. 2a, also changes with the applied field—a characteristic feature previously reported for magnetic nanoparticles [33].
Figure 15b shows the change of these parameters with the amount of Sn 2+ (x )。 M H does not behave like the previously found saturation magnetization (M s ) (Fig. 2b) since M H is related to the magnetic field and the size of these nanoparticles. It is accepted that M H is larger for the pristine nanoparticles because of the reduction of γ-Fe2O3 phase and the sintering processes that took place during the previous heating–cooling cycles, which increased the saturated magnetization. For the Sn 2+ -doped sample, M H decreases since the existence of Sn 2+ at the surface which can prevent the agglomeration process and the crystal growth (can be verified using TEM or XRD). The value of M H for x =0.045 is larger than for x =0.090 which is consistence with the larger value of M s for this sample. Interestingly, for the larger NPs with x =0.150, M H increased which opposes the decrease in their M s and this is due to the larger particle size with larger blocking temperature. The values of (α ) and (δ ) are constants with average value equals 0.3 and 0.6, respectively. This is predicted since the second part of Eq. 4 is related to the change with the magnetic field which is now constant (200 Oe). The values of T C for different samples are approximately the same as recorded experimentally. γ is a constant with a value equals 1 which is the same as in Bloch law. β is also almost a constant since it is related to the material with an average value of 8.
结论
Snx Fe3-2/3x O4 nanoparticles (12–50 nm) with x =0.000 to 0.0150 were prepared using co-precipitation method. The magnetization was measured using VSM while repeatedly heating and cooling the nanoparticles up to 900 K. An irreversible dip in magnetization with certain amplitude was noticed between two peaks at T 1 and T 2 during the first heating–cooling cycle. We relate the first peak to a chemical reduction of the oxidized layer at the surface of each nanoparticle. The second peak is referred to a crystal growth due to the sintering process. Coating the surface with Au prevent sintering process and the magnetic exchange interactions between nanoparticles. More stable magnetic behavior was obtained for the high concentration of dopant Sn 2+ (x =0.150) which make it more appropriate for high-temperature applications. Best fitting for M -T graphs were made using a phenomenological expression where a core-shell model with magnetization of a ferrimagnetic core obeying the modified Bloch law and a paramagnetic shell obeying Curie–Weiss law. The results presented in this work present a method to tune the magnetization characteristics of Fe3O4 nanoparticles by Sn 2+ doping.
数据和材料的可用性
Supplementary information file
缩写
- NP:
-
纳米粒子
- VSM:
-
振动样品磁力计
- PPMS:
-
Physical property measurement system
- HRTEM:
-
高分辨透射电子显微镜
- XPS:
-
X-ray photoemission spectroscopy
- FTIR:
-
傅里叶变换红外
- XRD:
-
X射线衍射
- FC:
-
Field cooling
- ZFC:
-
Zero field cooling
纳米材料
- DIY:HomeBrew 的温度监控和调节
- 实验室和科学项目的温度测量
- 用于改进诊断和治疗应用的多功能金纳米粒子:综述
- 用于癌症治疗的纳米粒子:当前的进展和挑战
- 铝硅酸盐矿物的替代掺杂和优异的水分解性能
- 用于体内 CT 成像和肾脏清除特性的新型生物相容性 Au Nanostars@PEG 纳米颗粒
- Au@TiO2 蛋黄-壳纳米结构的制备及其在亚甲基蓝降解和检测中的应用
- 改性超支化聚甘油作为分散剂,用于控制和稳定碳氢化合物中的金纳米粒子
- 用于光热疗法和光声成像的聚吡咯涂层铁铂纳米粒子的合成和体外性能
- 用于生物医学应用的球形共轭金-鸟蛤壳衍生的碳酸钙纳米颗粒的制造、表征和细胞毒性
- CoFe2O4/Fe3O4 和 Fe3O4/CoFe2O4 核/壳纳米颗粒中的深刻界面效应
- 基于叶酸和 gH625 肽的 Fe3O4 磁性纳米颗粒功能化增强细胞内化的比较