

恢复的 microRNA-133a-3p 或耗尽的 PSAT1 通过抑制 GSK3β/β-Catenin 通路抑制内皮细胞损伤诱导的颅内动脉瘤
摘要
目前尚不清楚 microRNA-133a-3p (miR-133a-3p) 在颅内动脉瘤 (IA) 中的功能作用。因此,本研究的目的是研究 miR-133a-3p 通过磷酸丝氨酸转氨酶 1(PSAT1)/糖原合酶激酶 3β(GSK3β)/β-连环蛋白信号传导对血管内皮损伤诱导的 IA 的调节作用。途径。正常颅内小动脉组织和IA组织取自脑外伤和IA患者。通过RT-qPCR和蛋白质印迹分析确定组织中miR-133a-3p、PSAT1、GSK3β和β-连环蛋白的表达。培养人 IA 的内皮细胞 (EC) 并用 miR-133a-3p 模拟物和 si-PSAT1 处理,以确定它们在内皮细胞迁移、凋亡和增殖中的功能。通过 RT-qPCR 或蛋白质印迹分析检测 ECs 中 miR-133a-3p、PSAT1、GSK3β、β-catenin、Ki-67、CyclinD1、Bax 和 Bcl-2 的表达。此外,建立IA大鼠模型以检测体内IA组织的病理变化和miR-133a-3p、PSAT1、GSK3β、β-catenin、VEGF和MMP-9的表达。 miR-133a-3p的表达与IA的数量和大小有关。 IA 中 MiR-133a-3p 表达降低,PSAT1、GSK3β 和 β-catenin 表达升高。恢复miR-133a-3p和耗尽PSAT1缓解病理变化;降低 IA 中 PSAT1、GSK3β 和 β-catenin 的表达;抑制 IA ECs 的凋亡和促进增殖和迁移,并降低 体内 IA 组织中 VEGF 和 MMP-9 的表达。我们的研究表明 miR-133a-3p 的过表达或 PSAT1 的下调通过抑制 IA 中的 GSK3β/β-catenin 通路来抑制内皮细胞损伤并促进内皮细胞增殖。 MiR-133a-3p可能是IA的潜在候选标志物和治疗靶点。
假设陈述
本研究推测miR-133a-3p/PSAT1轴可能通过调节GSK3β/β-catenin通路影响内皮细胞损伤诱导的IA。
检验假设
为了验证这一假设,我们收集了人IA的临床样本、内皮细胞(ECs),并建立了IA大鼠模型,以阐明miR-133a-3p和PSAT1在IA过程中的功能。
假设的含义
我们的研究证实了我们的假设,即 miR-133a-3p 的过表达或 PSAT1 的下调通过抑制 IA 中的 GSK3β/β-catenin 通路来抑制内皮细胞损伤并促进内皮细胞增殖。这些发现为 IA 的新型靶向治疗提供了新见解。
介绍
颅内动脉瘤(Intracranial aneurysm, IA)是一种以脑内动脉异常膨出和IA破裂引起蛛网膜下腔出血(SAH)为特征的脑血管疾病,具有较高的病死率和致残率[1]。作为一种破坏性疾病,IA 的发病机制尚未阐明[2]。 IA是一种罕见的家族性形式,但通常认为是高血压、吸烟和其他传统危险因素引起的获得性血管损伤的结果[3]。血管内弹簧圈栓塞或显微外科夹闭已被用于预防具有高破裂风险的患者未破裂动脉瘤的未来破裂 [4]。尽管 IA 外科手术取得了显着进展,但 IA 患者的术后恢复仍然不佳 [5]。 IA治疗的严峻形势需要进一步探索其机制,寻找新的治疗策略。
MicroRNAs (MiRNAs)是一类非编码RNAs,通过抑制转录后水平的翻译或介导mRNA降解来调节靶基因的表达[6]。研究表明,miR-133a-3p 在几种恶性肿瘤中作为肿瘤抑制剂,miR-133a-3p 的过表达可以抑制结直肠癌 (CRC) 细胞的生长 [7]。之前的一项研究认为,鉴于阻断自噬介导的谷氨酰胺分解,miR-133a-3p 进一步抑制了胃癌的转移和生长 [8]。此外,一项研究表明 miR-133a-3p 参与调节心脏发育和心脏肥大 [9]。一项研究表明,miR-195-5p 的上调通过抑制磷酸丝氨酸转氨酶 1 (PSAT1) 依赖的 GSK3β/β-catenin 信号通路来降低卵巢癌的血管生成和顺铂耐药性 [10]。另一项研究报道,miR-365 通过调节 PSAT1 抑制食管鳞状细胞癌 (ESCC) 中的细胞侵袭和生长 [11]。 PSAT1 是一种与丝氨酸生物合成有关的酶;它最初是从绵羊脑中纯化出来的,在许多组织中含量很高 [12]。已经证明 PSAT1 被发现通过调节 GSK3β/β-catenin 信号通路介导乳腺癌细胞周期进程 [13]。刘等人。还指出PSAT1对ESCC的发展发挥作用并预测不良生存;因此,它可能是抗癌治疗的一个有希望的靶点[14]。鉴于上述分析,本研究有望为研究 miR-133a-3p/PSAT1/GSK3β/β-catenin 轴在 IA 中的功能作用的新方法做出贡献。
材料和方法
道德声明
该研究获得了天津中医药大学第一教学医院机构审查委员会的批准。所有参与者都签署了知情同意书。所有动物实验均符合国际委员会《实验动物护理和使用指南》。
学习科目
选取2016年1月至2018年3月天津中医药大学第一教学医院神经外科收治的IA所致SAH病例。收集显微手术获得的75例IA的病理标本归为IA组,其中男性29例,女性46例,年龄31~55岁,平均年龄44.98±6.79岁。选择在天津中医药大学第一教学医院同时接受神经外科治疗的脑外伤患者作为对照组。外伤手术或内减压收集75例正常颅内小动脉组织,其中男43例,女32例,年龄34~56岁,平均年龄48.14±8.68岁。如果患者有高血压、糖尿病或肿瘤病史,则被排除在外。 IA组与对照组在性别、年龄上无显着差异(均P> 0.05).
样品处理和保存
手术切除后,两组部分标本经甲醛固定,由低至高浓度梯度酒精脱水,石蜡包埋。然后,将样品切片进行苏木精-伊红(HE)染色和免疫组织化学染色。一些样品被快速放入液氮罐中,然后转移到- 80°C的低温冰箱中,用于蛋白质印迹分析和逆转录定量聚合酶链反应(RT-qPCR)的检测。部分样品用戊二醛固定用于电镜观察,部分样品用于ECs的分离。
电子显微镜观察
样品用3%戊二醛固定,然后用1%四氧化锇重新固定。样品用丙酮脱水,用Epon812包埋,切成3 μm厚的半薄切片。最后用醋酸双氧铀和柠檬酸铅对样品进行双重染色,并用H-600IV透射电子显微镜(Hitachi,Tokyo,Japan)观察。
HE 染色
制备好的石蜡切片在 60°C 下烘烤 30 分钟。上述步骤完成后,将组织切片用二甲苯固定,梯度无水酒精脱水,磷酸盐缓冲盐水(PBS)清洗。组织切片用苏木精染色,氨水处理几秒钟,伊红染色2分钟,脱水,澄清。然后,将组织切片滴上中性树胶并用盖玻片密封。最后采用显微镜(Nikon,Tokyo,Japan)进行观察和记录。
免疫组化染色
免疫组化试剂盒由 Zymed Laboratories (San Francisco, CA, USA) 生产。石蜡切片脱蜡水化,石蜡切片在二甲苯溶液中浸泡5 min×3次。将切片置于 100% 无水酒精中 3 min × 2 次,然后在 95-75% 酒精中依次浸泡 3 min。脱蜡后,切片用3%过氧化氢孵育15分钟,以消除内源性过氧化物酶的活性。切片滴加封闭液,用正常山羊血清工作液孵育15分钟,然后用基质金属蛋白酶(MMP)-9(5 μg/mL)和血管内皮生长因子(VEGF)(1:250)一抗检测, Abcam, Cambridge, MA, USA)(用于阴性对照 (NC) 的 PBS)并孵育 1-2 小时。切片用生物素化二抗工作溶液重新探测 30-60 分钟。切片加入辣根过氧化物酶标记的链霉亲和素/过氧化物酶工作液,滴加新配制的二氨基联苯胺(DAB)溶液,复染,封闭。尼康SPOT FlexTM 成像系统熟悉该图像。 MMP-9和VEGF蛋白表达的面积通过免疫组织化学定量分析软件测量。在每个样品的阳性细胞聚集区随机检测5个高倍视野,以每屏平均吸光度作为平均值进行统计分析。
EC 的隔离和文化
从正常颅内小动脉组织和 IA 组织中分离出 ECs 并进行培养。将组织切成 3 mm 2 片段并在 0.1% 胶原酶 B/0.1% 分散酶(罗氏,巴塞尔,瑞士)中孵育 25 分钟。分离组织,用 2-mL 移液器研磨 2 分钟,并用 100-μm 过滤器(BD Biosciences,NJ,USA)过滤以分离 EC。将细胞悬浮液离心,然后重新悬浮在含有生长因子和 20% 胎牛血清(PromoCell,Heidelberg,Germany)的培养基 MV2 中。接下来,将细胞接种在密度为 10 4 的纤连蛋白(Sigma Aldrich Inc., St. Louis, MO, USA)包被的培养皿上 细胞/cm 2 (1 微克/厘米 2 ) 并在 5% CO2 下生长 1 天。接种后的第二天,用 PBS 冲洗细胞以去除未附着的细胞并置于新鲜培养基中。当达到约 80-100% 汇合时,将培养物暴露于由 Ulex europaeus Agglutinin I (UEA) 包被的(Vector Laboratories, Ltd., Peterborough, UK)珠(Dynabeads M-450 Tosylactivated, Oxoid, Hampshire, UK)进行免疫分离获得纯EC。与凝集素包被的珠子结合的 EC 用磁性颗粒浓缩器聚集,而未结合的细胞通过用基础培养基洗涤两次去除。 UEA 阳性细胞重新悬浮在培养基中并接种在纤连蛋白包被的培养皿上以改善它们的粘附和生长。培养物在 4-6 天内融合。
EC 的识别
通过用细胞表面 CD31 抗体和 FVII 因子相关抗原进行免疫细胞化学染色来鉴定 EC。细胞用 PBS 清洗两次,用 4% 多聚甲醛固定,用 3% H2O2 孵育 10-15 分钟以消除内源性过氧化物酶活性,然后用 0.1% Triton X-100 孵育 10 分钟至穿孔细胞。将特定一抗滴入细胞:因子 VII(1:200)、CD31(1:400,Roche,Basel,Switzerland)并在 4°C 下孵育过夜。然后,将用辣根过氧化物酶二抗标记的免疫球蛋白 G (1:50) 滴入细胞。细胞在 37°C 下孵育 45 分钟,DAB 避光显色 4 分钟。然后,用蒸馏水终止显色,并在显微镜下观察照片。在荧光倒置相差显微镜下观察细胞,从10个视野中随机计数阳性细胞和细胞总数。阳性染色细胞率=(阳性细胞数/总细胞数)×100%。建立相应的NC组,用PBS代替一抗,其他步骤同上。
细胞的分组和转染
为了研究 miR-133a-3p 和 PSAT1 对 IA ECs 的影响,将 ECs 分为对照组(没有任何转染的正常血管 ECs)、IA 组(没有任何转染的 IA 血管 ECs)、模拟 NC 组(转染了 miR -133a-3p 模拟物 NC)、miR-133a-3p 模拟物组(转染 miR-133a-3p 模拟物)、小干扰 RNA(si)-NC 组(转染 si-PSAT1 NC)、si-PSAT1 组(转染si-PSAT1),和 miR-133a-3p 模拟物 + 过表达 (oe)-PSAT1 组(用 miR-133a-3p 模拟物和 oe-PSAT1 转染)。其中,模拟NC、miR-133a-3p模拟、si-PSAT1、si-NC和oe-PSAT1由GenePharma Co., Ltd.(中国上海)设计和组成。转染严格按照Lipofectamine TM 说明书进行 2000 转染试剂(Thermo Fisher Scientific, MA, USA)。
流式细胞术
弃去培养皿中的培养基,用PBS冲洗细胞两次。 0.25%胰蛋白酶分离细胞,800 rpm离心5 min,1×结合缓冲液悬浮,细胞密度调整至1×10 7 细胞/毫升。将细胞悬液(100 μL)与 5 μL 碘化丙啶(PI,20 μg/mL)和膜联蛋白 V-FITC 孵育 20 分钟,然后与 400 μL 1 × 结合缓冲液混合。流式细胞仪(BD FACSArial I细胞分选仪)用于检测1小时内的细胞凋亡。结果是散点图上的左下象限 (Q4) 显示健康的活细胞 (FITC − /PI − ),右下象限 (Q3) 作为早期凋亡细胞 (FITC + /PI − ),右上象限(Q2)为晚期凋亡和凋亡细胞(FITC + /PI + );凋亡率=早期凋亡百分比(Q3)+晚期凋亡百分比(Q2)。
3-(4, 5-Dimethylthiazol-2-Yl)-2, 5-Diphenyltetrazolium Bromide (MTT) 检测
用胰蛋白酶分离细胞以制备细胞悬液。在倒置显微镜下计数细胞。细胞浓度调整为5×10 4 细胞/毫升。细胞接种于 96 孔培养板中。 48 小时后,将细胞与 20 μL MTT 溶液孵育 4 小时。每孔中的 MTT 用 150 μL 二甲亚砜溶解。在 570 nm 波长处测量 ECs 的光密度 (OD) 值。根据OD值计算ECs的增殖率。
划痕测试
将各组细胞接种于 2×10 5 细胞/孔。每组设3个平行孔。当达到约 90% 汇合时,用消毒过的一次性 1 mL 微量移液器吸头划伤细胞生长平面;每孔划伤一次,每孔划伤长度和深度一致。划痕后去除漂浮细胞,换上新鲜培养基,培养24 h后在显微镜下观察划痕间距。划伤愈合面积由National Instrument Vision Assistant 8.6软件统计。细胞迁移=伤口愈合面积/初始划伤面积×100%。
实验动物及IA大鼠模型的建立
选择 84 只 7 周龄、体重 180 至 200 g(军事医学科学院实验室动物中心,北京,中国)的 Sprague-Dawley (SD) 大鼠。大鼠饲养于动物实验中心。饲养条件控制在 22-25°C 和 50-60% 的自然光下。所有大鼠均在标准大鼠笼中饲养,每笼4只大鼠。大鼠饲喂城市卫生饮用水和普通大鼠饲料。每3天更换一次垫子,并对笼子进行清洗和消毒。 IA大鼠按照参考文献[15]建模。当大鼠出现以下症状时,可确定动脉瘤破裂 [16]: 1、由于体重减轻(体重减轻约 10%)超过 24 小时而导致进食或饮水活动减少; 2、上举时躯干和前肢的屈曲; 3、以正常姿势单侧行走; 4、休息时偏向一侧,无自发活动。有这些症状的大鼠在手术后3个月处以安乐死。术中取IA组织,PBS灌注,含谷氨酸蓝色染料灌注脑动脉。
IA 大鼠的治疗和干预
将上述84只大鼠随机分为7组,每组12只。治疗方法如下:正常组(不造模); IA 组(立体定向注射 100 μL PBS 和 Lipofectamine 2000 的混合物);模拟 NC 组(立体定向注射 100 μL miR-133a-3p 模拟 NC 和 Lipofectamine 2000 的混合物); miR-133a-3p 模拟物组(立体定向注射 100 μL miR-133a-3p 模拟物和 Lipofectamine 2000 的混合物); si-NC 组(立体定向注射 100 μL si-PSAT1 NC 和 Lipofectamine 2000 的混合物); si-PSAT1 组(立体定向注射 100 μL si-PSAT1 和 Lipofectamine 2000 的混合物);和 miR-133a-3p 模拟物 + oe-PSAT1 组(立体定向注射 100 μL miR-133a-3p 模拟物和 oe-PSAT1 和 Lipofectamine 2000 的混合物)。上述所有注射均每天进行一次,并将这些大鼠在无特定病原体(SPF)动物实验室饲养12周。 12周后,麻醉各组大鼠并按上述方法打开胸腔。从左心室插管到主动脉,通过切割腔静脉释放血液。同时通过导管灌注30 mL含肝素钠(37℃)的生理盐水,然后通过导管缓慢注入10%聚甲醛/0.1 M磷酸盐缓冲液(pH 7.4)。灌注固定后,打开大脑。在手术显微镜下分离并切除颅底动脉环,在显微镜下观察动脉瘤的变化,并观察其病理特征。模拟NC、miR-133a-3p模拟、si-NC、si-PSAT1和oe-PSAT1由上海生工生物科技有限公司(中国上海)合成。
血流动力学检测
于手术前3天和介入治疗后12周检测大鼠左颈总动脉末端血流量。方法为:将大鼠放入麻醉机动物架内进行吸入,并调整流量参数。待大鼠呼吸平稳,触碰大鼠尾部无明显反应后,用橡皮筋将大鼠固定在实验操作台上。用电动剃须刀剃掉大鼠颈部的毛发。开启彩色多普勒超声检测仪,测量左颈总动脉末端血流速度,探头涂抹适当偶联剂后记录数据。测量结束后,将大鼠小心放回笼内,保持呼吸道通畅,直至大鼠麻醉苏醒。
RT-qPCR
总 RNA 是在 RNA 简单总 RNA 提取试剂盒(天根生物技术有限公司,北京,中国)的基础上提取的。 RNA经紫外分析和甲醛变性电泳确认为优质RNA,经PrimeScript RT试剂盒逆转录为互补DNA。 PCR反应采用SYBR Permix Ex Taq II (宝,大连,辽宁,中国)。 PCR 引物由北京康维生物技术有限公司(中国北京)设计和合成(表 1)。 U6 被选为 miR-133a-3p、PSAT1、GSK3β、β-catenin、Bax、Bcl-2、Ki-67 和 CyclinD1 的内部参数,磷酸甘油脱氢酶 (GAPDH) 作为内部参数。数据通过2 -ΔΔCt 测量 .
Western Blot 分析
从细胞和组织中提取总蛋白,采用双辛可宁酸蛋白检测试剂盒(Beyotime Institute of Biotechnology,中国上海)对蛋白样品进行定量。将样品与 1/4 体积的 5 × 样品缓冲液混合并煮沸 5 分钟。电泳选用10%分离胶和5%浓缩胶。将膜在 5% 脱脂奶粉中孵化 60 分钟。膜上附加一抗 PSAT1 (1:500)、GSK3β (1:500)、β-catenin (1:5000)、Bax (1:1000)、Bcl-2 (1:1000)、CyclinD1 (1:200)、Ki-67 (1:5000)、MMP-9 (1 μg/mL)、VEGF (1:1000)(均来自美国马萨诸塞州剑桥的 Abcam)。然后,用二抗 (1:2000) 孵化膜 60 分钟。将膜浸入电化学发光反应溶液(Beyotime Institute of Biotechnology,Shanghai,China)中1 min,除去液体后用食品包装纸覆盖。用X射线对膜片进行曝光,显影、定影后观察结果。以GAPDH(1:10000,Abcam)为上样对照,采用ImageJ2x软件分析蛋白质图像。
双荧光素酶报告基因检测
miR-133a-3p 与 PSAT1 之间的靶标关系以及 miR-133a-3p 与 PSAT1 3' 非翻译区 (3'UTR) 之间的结合位点由生物信息学网站 (https://cm.jefferson.edu/rna22) 预测/预先计算/)。将含有 miR-133a-3p 结合位点的 PSAT1 3'UTR 启动子区序列扩增并克隆到 pGL3 碱性荧光素酶质粒(Takara Bio Inc., Otsu, Shiga, Japan)中构建野生型(WT)质粒( PSAT1-WT) 的 PSAT1 3'UTR,而突变体 (MUT) PSAT1-MUT 重组质粒是通过用点突变试剂盒(Takara Bio Inc., Otsu, Shiga , 日本)。将处于对数生长期的血管 EC 接种到 96 孔板中。当汇合度达到约 70% 时,将 PSAT1-WT 和 PSAT1-MUT 质粒与模拟 NC 和 miR-133a-3p 模拟质粒通过 Lipofectamine 2000 混合并共转染到血管内皮细胞中。转染48 h后收集细胞裂解,荧光素酶活性检测试剂盒(Promega Corporation, Madison, WI, USA)。
统计分析
所有数据均通过 SPSS 21.0 软件(IBM Corp., Armonk, NY, USA)进行解释。计数资料以比率或百分比表示,分析采用卡方检验或Fisher's检验。服从正态分布的测量数据用平均值±标准差表示。 t进行两组比较 检验,同时通过单向方差分析 (ANOVA) 和 Tukey 事后检验分析多组之间的比较。一个 P 值 <0.05 被认为是显着的。
结果
IA 患者的一般数据
如表2所示,比较了IA组和对照组的一般数据。具体信息见表2。
miR-133a-3p的表达与IA的数量和大小有关
通过分析 miR-133a-3p 表达与 IA 临床病理特征的关系,详细见表 3,根据 IA 中 miR-133a-3p 的平均相对表达量,将 75 例 IA 分为两部分组:miR-133a-3p高表达组(n =47) 和 miR-133a-3p 低表达组 (n =28)。 miR-133a-3p与不同临床病理参数之间的关系通过卡方检验或Fisher's检验进行统计分析。结果表明,miR-133a-3p的表达与动脉瘤的年龄、性别、形状和位置无关(均P> 0.05),但与动脉瘤的数量和大小有关(P <0.05).
MiR-133a-3p 表达下降,IA 组织中 PSAT1、GSK3β 和 β-Catenin 表达升高
RT-qPCR检测IA中miR-133a-3p的表达,结果显示相对于正常颅内小动脉组织(对照组),IA组织中miR-133a-3p表达降低( IA 组) (P <0.05)(图 1a)。 RT-qPCR 和蛋白质印迹分析表明,与正常颅内小动脉组织相比,IA 组织中 PSAT1、GSK3β 和 β-catenin 的表达升高(所有 P <0.05)(图 1a-c)。
<图片>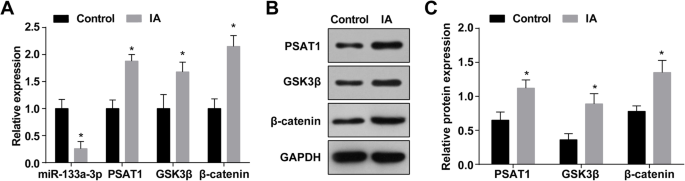
IA 组织中 MiR-133a-3p 表达降低,PSAT1、GSK3β 和 β-catenin 表达增加。 一 IA组和正常组miR-133a-3p、PSAT1、GSK3β和β-catenin的表达。 b PSAT1、GSK3β 和 β-catenin 表达的蛋白条带。 c Western blot检测IA组和正常组PSAT1、GSK3β和β-catenin的蛋白表达。 n =75, *P <0.05 与对照组相比。测量数据以平均值±标准差表示,两组比较采用独立样本t 测试
动脉瘤的病理变化及IA组织中MMP-9和VEGF的表达
直接观察正常颅内小动脉组织和IA组织,发现对照组动脉组织血管呈鲜红色,腔内未见明显的动脉粥样硬化斑块和侧血栓。 IA组动脉瘤组织肿瘤多呈褐色或暗红色,外观呈阴囊状或梭状,质地多为坚韧。切开肿瘤时,部分肿瘤标本的瘤壁出现白色或暗红色动脉粥样硬化斑块,呈扁平、圆形或椭圆形。在部分肿瘤标本中,瘤腔内有附壁血栓,血栓质地较软。瘤壁的厚度从瘤颈开始逐渐变薄,有的在瘤顶只有薄薄的纤维膜,有的甚至已经破裂。破裂动脉瘤的裂口位于肿瘤顶部或附近。
HE染色可见光镜下正常颅内小动脉组织壁厚均匀;内、中、外层解剖结构清晰完整;各层细胞形态正常;相邻细胞的肌膜常紧密形成;并且壁的炎症细胞很少见。 IA组动脉瘤壁颅内动脉分叉顶端远端外侧血管腔内形成的局部突起变钝变小,局部ECs丢失。少数样本显示从平滑肌细胞层迁移到内膜层和肌源性内膜细胞增殖。 ECs 减少甚至消失。内皮细胞层由增生的肌内膜细胞和线性排列的内皮细胞组成,或由凋亡的内皮细胞和附着在管腔上的血细胞组成。它的液泡退化并呈现连续性中断。部分与基底膜一起脱落,内膜胶原纤维增多。动脉粥样硬化改变,小动脉壁明显变薄,充满大量结缔梯组织。各层均可见炎性细胞浸润和部分扩散,以中膜和外膜为主。在一些细胞中观察到脂质和胆固醇晶体沉积。部分瘤壁完全或局部变薄并向外扩张(图2a、b)。
<图片>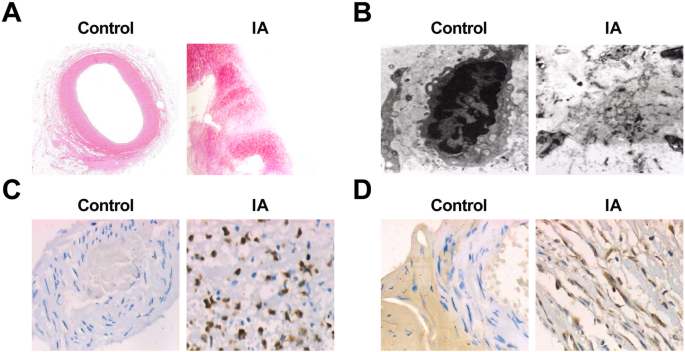
IA 动脉瘤病理变化及 MMP-9、VEGF 的表达。 一 HE染色(× 10)对照组正常颅内小动脉组织切片。 b 用 HE (× 10) 染色的 IA 组织切片。 c Ultrastructure of normal intracranial arterioles tissues in the control group under an electron microscope (× 10,000). d Ultrastructure of IA tissues under an electron microscope (× 10,000). e Expression of MMP-9 in the control group and the IA group by immunohistochemical staining (× 200). f Expression of VEGF in the control group and the IA group by immunohistochemical staining (× 200)
The sections of the normal intracranial arterioles tissues and IA tissues were observed by an electron microscope, and it performed that in normal intracranial arterioles tissues, the matrix fibers of the cerebral vascular wall could be seen clearly, and there was no endothelial injury, cell pyknosis, or degeneration. In the IA tissues, obvious endothelial cell injury, cell pyknosis, or vacuole degeneration were observed, the number of middle smooth muscle cells was declined, most of the nucleus pyknosis was appeared, and chromatin aggregation and apoptotic bodies could be seen. Some cells showed swelling of the mitochondria and disappearance of normal internal structure. The extracellular matrix that formed the cytoskeleton was blurred and showed amorphous floc. There were many fragments in the missing parts of the cells (Fig. 2c, d).
Immunohistochemical staining was utilized to test MMP-9 and VEGF expression, and the results revealed that there was no expression of MMP-9 and VEGF in 75 cases of the control group. It existed 60 cases of positive expression of MMP-9 in the 75 cases of IA samples. MMP-9 positive expression appeared in the inner and the outer membranes of IA wall, but the expression was not uniform. The positive expression was mainly characterized by a brownish yellow cytoplasm. The positive expression of VEGF was 66 cases in 75 cases of IA samples. In the wall of IA, there was a high positive expression in the middle and the outer membranes and a low positive expression in the intima. The positive expression was also mainly characterized by a brownish yellow cytoplasm (Fig. 2e, f). The expression of MMP-9 and VEGF in the two groups is shown in Table 4.
Identification of Vascular ECs
The expression of factor VIII and CD31 in ECs were analyzed by immunohistochemical staining. The results reported that vascular ECs reacted positively to factor VIII and CD31-related antigen antibodies, and the positive rate was 95%. In addition, there were a large number of brown particles in the cytoplasm, and the fifth passage of cells of brown staining was dramatically higher than the primary passage of cells (Fig. 3a, b).

Vascular ECs react positively to FVIII and CD31 related antigen antibodies. 一 Identification of ECs by CD31. b Identification of ECs by FVII
Upregulation of miR-133a-3p and Downregulation of PSAT1 Suppress Apoptosis and Advance Proliferation and Migration of ECs in IA
Flow cytometry, RT-qPCR, and western blot analysis were adopted for observing the apoptosis and Bax and Bcl-2 expression in ECs of IA after treated with miR-133a-3p mimic or si-PSAT1. It was indicated that compared to the control group, the apoptosis rate of cells and Bax expression was elevated in the IA group and the Bcl-2 expression was decreased (all P <0.05)。 The cell apoptosis and Bax and Bcl-2 expression in the IA group, mimic NC group, and si-NC group had no significant change (all P> 0.05)。 By comparison with the si-NC group and mimic NC group, the apoptosis rate of cells in the si-PSAT1 group and miR-133a-3p mimic group was suppressed, the Bax expression was declined, and the Bcl-2 expression was raised (all P <0.05)。 Versus the miR-133a-3p mimic group, the apoptosis rate and Bax expression were enhanced, and the Bcl-2 expression was reduced in the miR-133a-3p mimic + oe-PSAT1 group (all P <0.05) (Fig. 4a–e).

Highly expressed miR-133a-3p and lowly expressed PSAT1 inhibit apoptosis and promote proliferation and migration of IA ECs. 一 Detection of apoptosis of ECs by flow cytometry. b Detection of apoptosis rate of ECs in each group. c Bax and Bcl-2 expression in ECs detected by RT-qPCR. d Protein band of Bax and Bcl-2 expression. e Bax and Bcl-2 protein expression in ECs detected by western blot analysis. f MTT assay was used to detect proliferation activity of ECs in each group. g RT-qPCR was used to detect the expression of Ki-67 and CyclinD1 in each group of ECs. h Protein band of Ki-67 and CyclinD1 expression. 我 Ki-67 and CyclinD1 protein expression in ECs detected by western blot analysis. j Detection of the migration of ECs in each group by scratch test. k Statistical results of endothelial cell migration in each group. N =3, *P <0.05 vs. the control group. #P <0.05 vs. the mimic NC group. &P <0.05 vs. the si-NC group. +P <0.05 vs. the miR-133a-3p mimic group. Measurement data were depicted as mean ± standard deviation; data were assessed by one-way analysis of variance followed by Tukey’s post hoc test
MTT assay, RT-qPCR, and western blot analysis were utilized to observe the proliferation and the expression of Ki-67 and CyclinD1 in ECs of IA after treated with miR-133a-3p mimic or si-PSAT1. It was displayed that in contrast to the control group, the proliferation activity and Ki-67 and CyclinD1 expression were reduced in the IA group (all P <0.05)。 There was no significant difference in the proliferation activity and Ki-67 and CyclinD1 expression of the IA group, mimic NC group, and si-NC group (all P> 0.05)。 In relation to the si-NC group and the mimic NC group, the proliferation activity and Ki-67 and CyclinD1 expression were heightened in the si-PSAT1 group and the miR-133a-3p mimic group (all P <0.05)。 In comparison to the miR-133a-3p mimic group, the proliferation activity and Ki-67 and CyclinD1 expression were reduced in the miR-133a-3p mimic + oe-PSAT1 group (all P <0.05) (Fig. 4f, i).
The migration of ECs in each group after treatment with miR-133a-3p mimic or si-PSAT1 for 24 h was observed by scratch test. It was revealed that the migration of cells in the IA group was inhibited relative to that in the control group (P <0.05)。 There was no markedly change in cell migration of the IA group, the si-NC group, and the mimic NC group (all P> 0.05)。 Compared to the si-NC group and the mimic NC group, the cell migration in the si-PSAT1 group and the miR-133a-3p mimic group was elevated (both P <0.05)。 Versus the miR-133a-3p mimic group, the cell migration was declined in the miR-133a-3p mimic + oe-PSAT1 group (P <0.05) (Fig. 4j, k).
Restored miR-133a-3p and Depleted PSAT1 Reduce PSAT1, GSK3β, and β-Catenin Expression in ECs of IA
RT-qPCR was used to detect miR-133a-3p expression in ECs of IA; it was yielded that compared to the control group, miR-133a-3p expression in the IA group was reduced (P <0.05)。 miR-133a-3p expression in the IA group, mimic NC group, and si-NC group did not change markedly (P> 0.05)。 MiR-133a-3p expression in the miR-133a-3p mimic group was enhanced relative to that in the mimic NC group (P <0.05)。 In contrast with the si-NC group, there was no distinct change in miR-133a-3p expression in the si-PSAT1 group (P> 0.05)。 Versus the miR-133a-3p mimic group, miR-133a-3p expression was showed no significant difference in the miR-133a-3p mimic + oe-PSAT1 group (P> 0.05) (Fig. 5a).

Upregulation of miR-133a-3p and downregulation of PSAT1 decrease PSAT1, GSK3β, and β-catenin expression in ECs of IA. 一 miR-133a-3p, PSAT1, GSK3β, and β-catenin expression in ECs detected by RT-qPCR. b Protein bands of PSAT1, GSK3β, and β-catenin. c PSAT1, GSK3β, and β-catenin protein expression in ECs in each group detected by western blot analysis. N =3, *P <0.05 vs. the control group. #P <0.05 vs. the mimic NC group. &P <0.05 vs. the si-NC group. +P <0.05 vs. the miR-133a-3p mimic group. Measurement data were depicted as mean ± standard deviation, and data were assessed by one-way analysis of variance followed by Tukey’s post hoc test
The expression of PSAT1, GSK3β, and β-catenin in ECs of IA was tested by western blot analysis and RT-qPCR. It was indicated that in relation to the control group, PSAT1, GSK3β, and β-catenin expression in the IA group was raised (all P <0.05)。 PSAT1, GSK3β, and β-catenin expression in the IA group, mimic NC group, and si-NC group did not change dramatically (all P> 0.05)。 PSAT1, GSK3β, and β-catenin expression in the miR-133a-3p mimic group and si-PSAT1 group was degraded relative to that in the mimic NC group and si-NC group (all P <0.05)。 In relation to the miR-133a-3p mimics group, PSAT1, GSK3β, and β-catenin expression was elevated in the miR-133a-3p mimic + oe-PSAT1 group (all P <0.05) (Fig. 5a–c).
Upregulating miR-133a-3p and Downregulating PSAT1 Alleviate the Pathological Changes of IA Tissues
By testing the hemodynamic changes of rats after modeling, we monitored the blood flow velocity of rats in each group 3 days before operation and 12 weeks after intervention treatment. It was performed that there was no obvious difference in blood flow velocity in each group 3 days before operation (P> 0.05)。 After 12 weeks of intervention, the blood flow velocity of rats in the IA group depressed relative to that in the normal group (P <0.05)。 There was no distinct difference in the degree of decrease of blood flow velocity in the IA group, mimic NC group, si-NC group, and miR-133a-3p mimic + oe-PSAT1 group (all P> 0.05)。 By comparison with the si-NC group and the mimic NC group, the blood flow velocity was heightened in the miR-133a-3p mimic group and the si-PSAT1 group (both P <0.05)。 In contrast to the miR-133a-3p mimic group, the blood flow velocity was declined in the miR-133a-3p mimic + oe-PSAT1 group (P <0.05) (Fig. 6a).

Upregulated miR-133a-3p and downregulated PSAT1 alleviate the pathological changes of IA tissues. 一 Hemodynamic changes at each time point after successful modeling in rats. b Changes of IA tissue after transfection. n =12, *P <0.05 与正常组相比。 #P <0.05 vs. the mimic NC group. &P <0.05 vs. the si-NC group. +P <0.05 vs. the miR-133a-3p mimic group. Measurement data were depicted as mean ± standard deviation, and data were assessed by one-way analysis of variance followed by Tukey’s post hoc test.
The changes of IA tissues were verified by HE staining. The results displayed that in the normal group, the elastic fibers in the middle layer of intracranial vascular tissue were neat, the normal elastic protein wave-like structure was appeared, and there was no broken and degradation. In relation to the normal group, the lumen of intracranial vascular tissue was enlarged, the normal elastic protein wave-like structure was disappeared, the elastic fiber in the middle layer of local elastic protein vessel was broken, and some of the elastic fibers were completely degraded in the IA group. There was no distinct change in the morphology of IA tissues in the si-NC group, mimic NC group, IA group, and miR-133a-3p mimic + oe-PSAT1 group. In contrast with the si-NC group and the mimic NC group, the wave structure of elastic protein in intracranial vascular tissue of rats in the miR-133a-3p mimic group and the si-PSAT1 group was existed, and the local elastic protein vascular structure was slightly disordered, but there was no fracture and dissolution (Fig. 6b).
Highly Expressed miR-133a-3p and Lowly Expressed PSAT1 Reduce PSAT1, GSK3β, β-Catenin, VEGF, and MMP-9 Expression in IA Tissues in Vivo
The expression of miR-133a-3p in IA tissues in vivo was tested by RT-qPCR, it was suggested that in relation to the normal group, miR-133a-3p expression was declined in the IA group (P <0.05)。 miR-133a-3p expression in the IA group, mimic NC group, and si-NC group did not change obviously (all P> 0.05)。 MiR-133a-3p expression in the miR-133a-3p mimic group was elevated relative to that in the mimic NC group (P <0.05)。 By comparison with the si-NC group, there was no marked change in miR-133a-3p expression in the si-PSAT1 group (P> 0.05)。 Versus the miR-133a-3p mimic group, miR-133a-3p expression showed no significant difference in the miR-133a-3p mimic + oe-PSAT1 group (P> 0.05) (Fig. 7a).

Overexpression of miR-133a-3p and low expression of PSAT1 decrease PSAT1, GSK3β, and β-catenin, VEGF and MMP-9 expression in IA tissues in vivo and PSAT1 is a target gene of miR-133a-3p. 一 Detection of miR-133a-3p, PSAT1, GSK3β, and β-catenin expression in IA tissues of rats in each group by RT-qPCR. b Protein bands of PSAT1, GSK3β, and β-catenin. c Detection of PSAT1, GSK3β, and β-catenin protein expression in IA tissues of rats in each group by western blot analysis. d Protein bands of VEGF and MMP-9. e Detection of VEGF and MMP-9 protein expression in IA tissues of rats in each group by western blot analysis. f Prediction of the target site of PSAT1 binding to the corresponding miR-133a-3p by Target Scan. g Result of dual luciferase reporter gene assay. 一 –e , n =12; f –g , N =3, *P <0.05 vs. the normal group/the Wt + NC group. #P <0.05 vs. the mimic NC group. &P <0.05 vs. the si-NC group. +P <0.05 vs. the miR-133a-3p mimic group. Measurement data were depicted as mean ± standard deviation, and data were assessed by one-way analysis of variance followed by Tukey’s post hoc test
The expression of PSAT1, GSK3β, and β-catenin in IA tissues in vivo was tested by western blot analysis and RT-qPCR. It was appeared that in contrast with the normal group, PSAT1, GSK3β, and β-catenin expression in the IA group was increased (all P <0.05)。 PSAT1, GSK3β, and β-catenin expression in the IA group, mimic NC group, and si-NC group did not change markedly (all P> 0.05)。 PSAT1, GSK3β, and β-catenin expression in the miR-133a-3p mimic group and si-PSAT1 group was decreased compared with that in the mimic NC group and si-NC group (all P <0.05)。 Versus the miR-133a-3p mimic group, PSAT1, GSK3β, and β-catenin expression was enhanced in the miR-133a-3p mimic + oe-PSAT1 group (all P <0.05) (Fig. 7a–c).
Western blot analysis was used to verify the VEGF and MMP-9 expression in IA tissues in vivo; the results perceived that by comparison with the normal group, VEGF and MMP-9 expression in the IA group were enhanced (both P <0.05)。 VEGF and MMP-9 expression in the IA group, mimic NC group, and si-NC group did not change obviously (all P> 0.05)。 In relation to the mimic NC group and si-NC group, VEGF and MMP-9 expression in the miR-133a-3p mimic group and si-PSAT1 group were declined (all P <0.05)。 Versus the miR-133a-3p mimic group, VEGF and MMP-9 expression were elevated in the miR-133a-3p mimic + oe-PSAT1 group (all P <0.05) (Fig. 7d, e).
PSAT1 Is a Target Gene of miR-133a-3p
The online prediction software (https://cm.jefferson.edu/rna22/Precomputed/) was utilized to forecast and analyze the target site of PSAT1 binding to the miR-133a-3p, and the sequence of 3′UTR region combined by PSAT1 and miR-133a-3p. In order to prove that the predicted binding site of miR-133a-3p resulted in a change in the luciferase activity, the mutation sequence and the wild sequence of PSAT1 3′UTR deleting miR-133a-3p binding site were devised. Luciferase activity was verified by co-transfection of miR-133a-3p mimic and WT (Wt-miR-133a-3p/PSAT1) or MUT (Mut-miR-133a-3p/PSAT1) recombinant plasmids in vascular ECs. The results revealed that miR-133a-3p mimic had no distinct effect on luciferase activity in the Mut-miR-133a-3p/PSAT1 group (P> 0.05), while the luciferase activity in the Wt-miR-133a-3p/PSAT1 group was markedly declined (P <0.05) (Fig. 7f, g).
Discussion
IA is an abnormal dilatation of the intracranial artery, which weakens the arterial wall through continuously pushing outwards the vascular wall, which results in a higher risk of aneurysm rupture [17]. In a study conducted by Liu et al., it has shown that some miRNAs are involved in modulating the cell proliferation of vascular smooth muscle cells, which is closely associated with IA [18]. Also, a recent study has provided a proof that circulating miRNAs can be used as a new biomarker to assess the possibility of IA occurred in high-risk individuals [19]. It is customarily considered that PSAT1 may be involved in schizophrenia spectrum conditions and alters serine metabolism [20]. The current study was designed to explore the regulatory role of miR-133a-3p modulated vascular endothelial injury and triggered IA through modulating the PSAT1/GSK3β/β-catenin signaling pathway.
In this present study, the relationship among miR-133a-3p expression and clinicopathological features of IA was analyzed, and the results demonstrated that the expression of miR-133a-3p was not related to age, gender, shape, and position of aneurysm but associated with the number and size of aneurysm. Some scholars considered that the shear stress of regional blood flow in the arterial wall induced the induction of monocyte chemoattractant protein-1 (MCP-1) and macrophage inflammatory protein 1α (MIP-1α) expression by fibroblasts and vascular ECs within the vascular wall. The highly reactive chemotactic factors MCP-1 and MIP-1α made an aggregation of macrophagocyte in the vascular wall and mediated inflammatory response, then, induced the excitation of nuclear transcription factor c-Jun and then regulated the activation of activated protein 1 (AP-1), then activated MMP-9 promoter in its structural domain to raise MMP-9 mRNA expression, and finally induced the dissolution of extracellular matrix of vascular wall, causing the formation of intracranial aneurysm [21,22,23]. Saito et al. [24] found that MMP-9 positive cells were mainly from the middle and the outer membranes of the artery macrophages, which certified that MMP-9 expressed by macrophages mediated the degeneration of the arterial wall, leading to the formation of arterial aneurysm. The above studies have indicated that MMP-9 was linked to the formation of IA. The results of our study revealed that MMP-9 was upregulated in IA; thus, we speculated that mR-133a-3p might be involved in the occurrence and development of IA by regulating the PSAT1/GSK3β/β-catenin pathway and further regulating MMP-9. In our study, we found that restoring miR-133a-3p reduced the expression of PSAT1, GSK3β, β-catenin, and MMP-9 in intracranial aneurysm tissues. We will carry out relevant research in the future study to verify our findings.
Our study has provided substantial evidence in relation to the notion that miR-133a-3p expression was decreased and the PSAT1, GSK3β, and β-catenin was elevated in IA. Emerging evidence has suggested that miR-133a-3p plays a suppressive role in different kinds of tumors. Recent study has presented that miR-133a-3p expression was dramatically degraded in breast cancer tissues in contrast with that in non-cancer tissues [25]. Another study has purported that miR-133a-3p expression is declined in advanced prostate cancer (PCa) tissues relative to that in the adjacent normal tissues or benign prostate lesion tissues, especially in bone metastatic PCa tissues [26]. The promoting effect of PSAT1 in other types of diseases are found in some literatures. It is reported that PSAT1 expression was remarkably heightened in non-small cell lung cancer (NSCLC) and forecasted poor clinical outcome of NSCLC patients [27]. Furthermore, PSAT1 is considered as the highest upregulated gene in CRC tumors as well as highly expressed in chemoresistant disease patients [28]. It has been manifested that GSK3β activity was elevated in cancerous tissues [29]. Moreover, the phosphorylation level of GSK3β as well as the expression of nuclear β-catenin are also enhanced, suggesting that GSK3β/β-catenin pathway may be participated in osteopontin regulation [30].
Other results emerged from our data suggested that upregulation of miR-133a-3p and downregulation of PSAT1 suppressed apoptosis and advanced proliferation and migration of IA ECs, reduced VEGF, and MMP-9 expression in IA tissues. It has been suggested previously that the over-expression of miR-133a-3p retrains the invasion, growth, and mitosis of oral squamous cell carcinoma cells by targeting collagen type I alpha 1 (COL1A1) [31]. It is reported that highly expressed miR-133a-3p can repress the propagation of ESCC cells, advance cell apoptosis, and decline the migration and invasion of ESCC cells by targeting COL1A1 [32]. Another study has verified that transient upregulation of miR-133a-3p suppresses the migration, invasion, and growth abilities of gallbladder carcinoma cells through directly targeting recombination signal-binding protein Jκ [33]. In like manner, this study suggests that miR-133a-3p exerts its role in IA through targeting PSAT1. It is displayed that PSAT1 overexpression boosts ESCC cell growth and matrigel invasion in vitro, and injection of mice with ESCC cells with high expression of PSAT1 induces tumor formation in vivo [14]. Other study also has reported that PSAT1 is highly expressed and forecasts a poor clinical outcome of patients, as well as enhances cell tumorigenesis and proliferation in vivo and in vitro [13]. Prior research generally confirms that PSAT1 advances cell cycle progression, proliferation, and tumorigenesis through loss- and gain-of-function experiments [27]. It has been indicated that MMPs are composed of a series of enzymes which cleaves protein substrates on the basis of a conserved mechanism referring activation of an active site-bound water molecule through a Zn 2+ ion [34]. MMP-9 is a distinct protease which push forward an immense influence on many biological processes [35]. A study has contended that MMP-9 is elevated in the aneurysm groups compared to the control group [36]. Vascular endothelial growth factor-A (VEGF-A) is recognized as the key modulator of endovascular differentiation of trophoblast [37]. A study has revealed that silenced PSAT1 expression suppresses VEGF, β-catenin, and GSK3β phosphorylation expression [10].
Conclusion
To briefly conclude, our study confirms our hypothesis that overexpression of miR-133a-3p or downregulation of PSAT1 restrain endothelial cell damage and advance endothelial cell proliferation via inhibiting the GSK3β/β-catenin pathway in IA. These findings provide a new insight in a novel target therapy for IA. These findings underscore the role of miR-133a-3p in IA in relation the PSAT1/GSK3β/β-catenin pathway. However, a conclusion about the effects of miR-133a-3p and PSAT1 cannot be made clearly due to limited known researches on this. It needs to be monitored rigorously and reported appropriately in the future clinical trials.
数据和材料的可用性
不适用
缩写
- miR-133a-3p:
-
MicroRNA-133a-3p
- IA:
-
Intracranial aneurysm
- PSAT1:
-
Phosphoserine aminotransferase 1
- GSK3:
-
β-glycogen synthase kinase 3β
- SAH:
-
Subarachnoid hemorrhage
- MiRNAs:
-
MicroRNAs
- CRC:
-
Colorectal cancer
- ESCC:
-
Esophageal squamous cell carcinoma
- HE:
-
Hematoxylin-eosin
- PBS:
-
磷酸盐缓冲盐水
- MMP:
-
Matrix metalloprotease
- VEGF:
-
Vascular endothelial growth factor
- NC:
-
Negative control
- DAB:
-
Diaminobenzidine
- FBS:
-
胎牛血清
- UEAI:
-
Ulex europaeus agglutinins I
- PI:
-
Propidium iodide
- FITC:
-
V-fluorescein isothiocyanate
- DMSO:
-
二甲亚砜
- OD:
-
Optical density
- 标准差:
-
斯普拉格-道利
- SPF:
-
Specific pathogen-free
- GAPDH:
-
Glyceraldehyde phosphate dehydrogenase
- BCA:
-
Bicinchoninic acid
- 3′UTR:
-
3′ Untranslated region
- WT:
-
Wild type
- MUT:
-
Mutant
- ANOVA:
-
Analysis of variance
- NSCLC:
-
Non-small cell lung cancer
- VEGF-A:
-
Vascular endothelial growth factor-A
纳米材料
- 共发射极放大器
- 负载 ICA 的 mPEG-ICA 纳米颗粒的制备及其在治疗 LPS 诱导的 H9c2 细胞损伤中的应用
- 青蒿琥酯的纳米颗粒递送通过激活线粒体介导的细胞凋亡来增强抗肿瘤效率
- 通过低温快速热退火工艺控制高均匀度硒化铟 (In2Se3) 纳米线的生长
- 通过蒸发诱导自组装和增强的气敏特性简便合成虫孔状介孔氧化锡
- 通过尺寸、修饰、缺陷和掺杂设计和调整石墨烯功函数:第一性原理理论研究
- 背面有黑硅层的晶体硅太阳能电池的研究
- 通过羟基调节碳纳米管的滑滚运动模式
- 使用双面金字塔光栅进行薄膜硅太阳能电池的有效光吸收
- 石胆酸修饰的金纳米粒子对肝癌细胞的凋亡作用
- 微小的稀土氟化物纳米粒子通过电极性相互作用激活肿瘤细胞生长
- 通过激光辅助方法在玻璃上沉积抗体修饰的上转换纳米颗粒以提高细胞培养性能