

微小的稀土氟化物纳米粒子通过电极性相互作用激活肿瘤细胞生长
摘要
纳米颗粒和跨膜信号受体之间的局部细胞外相互作用可能会很好地激活癌细胞的生长。在此,DMEM+FBS 悬浮液中的微小 LaF3 和 PrF3 纳米颗粒刺激了三种不同人类细胞系(A549、SW837 和 MCF7)中的肿瘤细胞生长。纳米颗粒的尺寸分布、AKT 和 ERK 信号通路的激活以及活力测试表明,通过微小尺寸纳米颗粒 (<10 nm) 整体的协同作用,机械刺激整联蛋白和 EGFR 的配体粘附结合位点。虽然微小尺寸的纳米颗粒可能与 EGFR 的激活密切相关,但整合素与纳米颗粒的相互作用仍然是一个多方面的问题。一个理论主题表明,在必要的 pN 力范围内,每个配体粘附结合位点都可以通过电偶极相互作用被微小尺寸的介电纳米颗粒激活。活性纳米颗粒的大小由配体粘附结合位点和纳米颗粒上的表面电荷量以及它们之间的分离距离决定。电偶极力的极性分量仍然与纳米粒子尺寸的二次方成反比,这表明只有微小尺寸的介电纳米粒子才能通过电偶极相互作用刺激癌细胞生长。该工作有助于识别癌细胞的不同细胞骨架应激模式。
背景
肿瘤发生是一个涉及基因组变化的多维问题。它还被支架和细胞骨架结构之间的细胞 - 细胞外基质 (ECM) 相互作用激活 [1,2,3,4],通过机械传感器的应力表达,类似于整合素,来自能够改变基因组编程的多部分细胞力 [5]。肿瘤微环境与 ECM 支架的相互作用通常会激活细胞的膜黏着蛋白和跨膜信号受体 (TSR)、表皮生长因子受体 (EGFR)、血管内皮生长因子 (VEGFR) 或神经生长因子受体 (NGFR)。机械传感器通过细胞外活性结构域 [6,7,8,9] 和细胞内 F-肌动蛋白丝之间的信号传递,通过触发磷酸化反应的雪崩来调节肿瘤细胞的生长。
蛋白质构象变化和 TSR 通路的激发需要激活力位于 pN 力范围内,当然低于 nN 规格 [10]。除了随机机械应力和活性化学亲和强度之外,纳米颗粒 (NP) 与细胞膜蛋白质之间的结合效率(结合强度)可以通过短程或长程电极或其他类型的分散相互作用进行调节。在 NPs 的有限表面积上,只有一定数量的蛋白质可以附着足够长的时间以具有生物活性 [11],并且与生物环境的空间受限的局部相互作用被认为是导致一组发散细胞功能的原因路线 [12]。因此,来自蛋白质-NPs相互作用的信号传递途径为NPs发出了安全问题的信号[11, 13]。
由于 NPs 细胞对细胞的有利或不利反应是类型特异性的 [11],NPs 与生物标记之间的联系应逐案确定 [14, 15]。
肿瘤细胞暴露于 NPs 的相反结果,无论是消融或肿瘤生长效率还是 NPs 的可变毒性水平 [16, 17],也都出现了安全问题。然而,尽管取得了进展,但今天仍缺乏关于 NPs 与真核细胞相互作用的具体途径的知识,从而无法确定通用的 NP 治疗方法。由于不同大小的纳米颗粒和不同的表面化学通常会转移细胞反应,包括纳米颗粒-膜受体结合和 TSR 活性,纳米颗粒的毒性与表面活性剂的形态、带电状态、蛋白质和纳米材料在 ECM 中的浓度和组成有关[18,19,20,21],最后是纳米颗粒与细胞表型之间的分子键合强度[22]。
先前对暴露于二氧化硅、金纳米粒子和碳纳米管的黑色素瘤和宫颈癌的研究认识到,纳米粒子的大小会选择性地激活肿瘤细胞生长 [23,24,25,26,27]。人 SK-BR-3 癌细胞系中 TSR 信号与修饰的金和银 NPs 大小之间的相关性表明,尽管 2-100 nm 大小的 NPs 重组了信号转导,但当细胞与 40 –50 nm 大小的纳米颗粒 [26]。最近,也有人建议将金 NPs 的大小从 5 nm 改变到 40 nm,可以想象地调整 A549 和 95D 癌细胞系的生长速率。具体而言,5 nm 大小的 NPs 抑制两种细胞类型的任何增殖,而 ~ 10 nm 大小的 NPs 对细胞生长没有任何影响 [27]。同样,暴露于 SiO2 NPs 的 A549 和 THP-1 细胞显示出大小依赖性细胞毒性以及 15 nm 大小的 NPs 也与高细胞毒性水平相关。相反,60 nm 大小的 NPs 表现出较低的毒性。最后,200 nm 大小的 NPs 通过 ERK1/2 激活增加干细胞生长,而 2-4 μm 大小的 NPs 能够激活不同的信号转导途径 [28]。小尺寸纳米颗粒与EGFR结合,开启蛋白激酶B(AKT)和细胞外信号调节激酶(ERK)信号通路,促进细胞生长。
稀土纳米粒子 (RE-NPs) 还可以与特定域相互作用,例如金属离子依赖性粘附位点 (MIDAS)、MIDAS 调节 (ADMIDAS)、协同金属离子结合位点 (SyMBS) 和配体粘附结合位点 (LABS) , 位于 ανβ3 亚基或其他整合素亚基 [29, 30]。
同样,RE-NPs 在肿瘤 NPs 相互作用中需要额外的柔软度 [31,32,33,34]。虽然二氧化铈 NPs(nanoceria)显示出对不同自由基引起的细胞损伤的保护作用 [35],但低浓度的修饰二氧化铈 NPs 通过激活 AKT/ERK 信号通路减少细胞凋亡,高度促进肝癌细胞增殖 [36]。通常,围绕细胞的一组 NPs 容易承受细胞骨架应力,同样能承受化学、纳米热力学(Hill)[37]、NPs 和机械传感器之间的熵或电偶极子相互作用。然而,到目前为止,对NP、TSR和细胞之间相互作用的理解仍然模糊不清。
原则上,稀土化合物的强离子特性应该通过电相互作用刺激细胞的机械传感器。此外,由于稀土离子广泛用于不同的应用,因此必须研究它们对肿瘤细胞生长的潜在贡献,以制定适当的公共卫生保护协议。氟化镧 (LaF3) 和氟化镨 (PrF3) 用于荧光灯、辐射彩色玻璃、光纤、搪瓷应用和电极。 LaF3 在特定类型的玻璃、荧光灯涂层、水处理和催化剂中进行了精心制作。它也是商用氟化物玻璃 (ZBLAN) 的重要组成部分,它与氟化铕混合用于光通信和作为离子选择性氟化物电极中的晶体膜,具有良好的红外透射率。同样,PrF3 也用于电影行业的碳弧灯、演播室照明和投影仪灯。掺镨的氟化物玻璃也用于单模光纤光放大器。
因此,这项工作证明了微小尺寸的RE-NPs具有通过电偶极子相互作用刺激肿瘤细胞生长的潜力。
文章分为三个部分。首先,通过应用动态光散射 (DLS)、原子力显微镜 (AFM)、透射电子显微镜 (TEM)、X 射线衍射 (XRD)、二维快速分析,分析了纳米颗粒的尺寸分布、相互作用和几何形状。傅里叶变换 (2D-FFT) 分析和真空紫外光谱 (VUV 110–180 nm)。接下来,建立了三种不同人类癌细胞系(A549、SW837 和 MCF7)的生长水平与大小分布以及 LaF3 和 PrF3 NPs 浓度之间的相关性。最后,在激活机械传感器和随后的肿瘤细胞生长所需的 1 pN 力限制内,肿瘤细胞的生存能力符合一个 RE-NP 和一个 LABS 之间电偶极相互作用的理论基序。该工作有助于识别和分类不同类型的细胞骨架应力以及纳米颗粒与癌细胞的机械感应之间的相互作用。
结果
NP 的大小和结构
一、DLS、AFM、TEM、XRD、FFT、VUV光谱和t 应用测试统计来提取液体悬浮液中 RE-NP 的尺寸分布(图 1、2、3、4、5、6 和 7)。接下来,通过细胞活力测试和蛋白质印迹 (Wb) 分析来鉴定 RE-NPs 对特定机械传感器的激活。
<图片>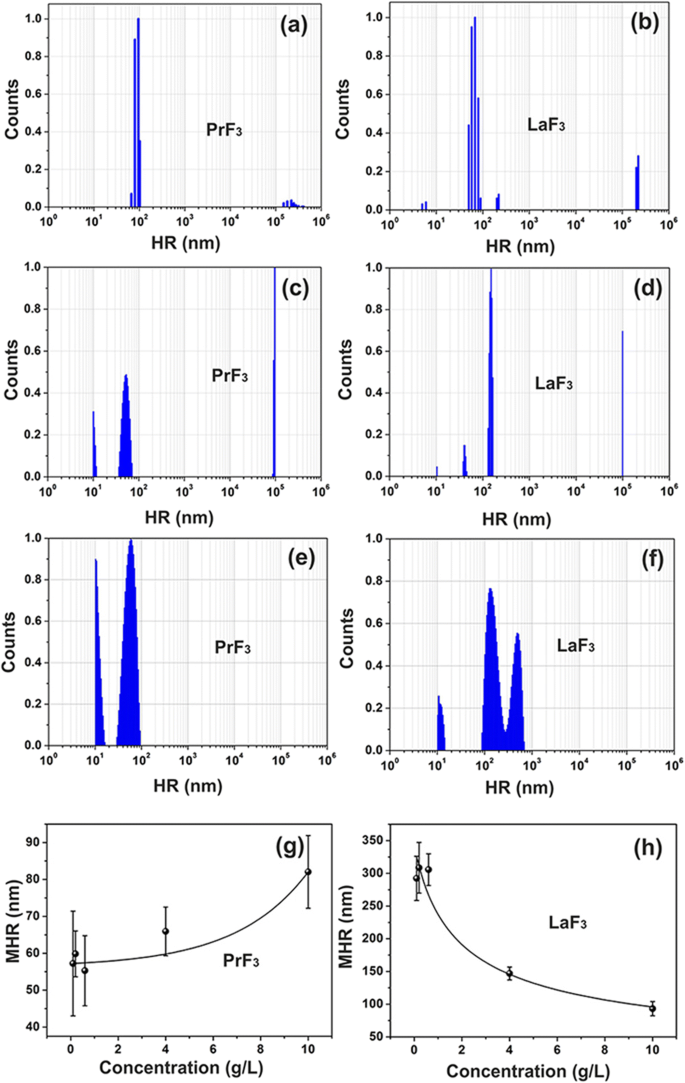
稀土悬浮液的 DLS 尺寸分布光谱。 a, b 水中的 PrF3 和 LaF3 NPs (5 g/L)。 c, d DMEM+FBS 中的 PrF3 和 LaF3 NPs (5 g/L)。 e, f DMEM+FBS 中的 PrF3 和 LaF3 NPs (0.1 g/L)。 g, h 不同浓度DMEM+FBS中PrF3和LaF3纳米颗粒的平均流体动力学半径(MHR)与标准差
<图片>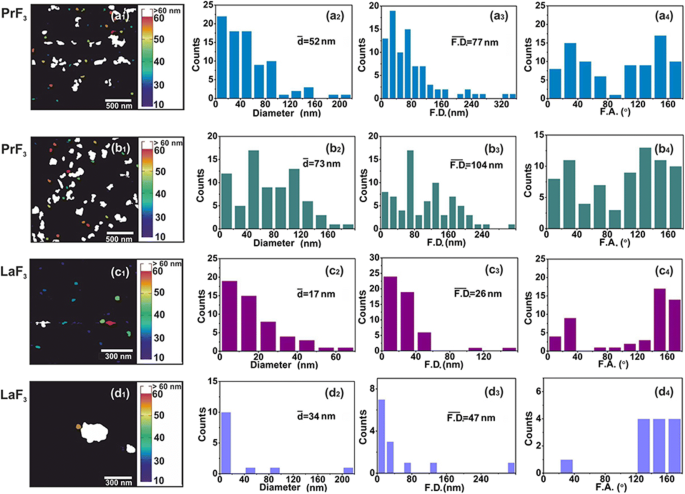
AFM 数字 (x , y ) RE-NP 的大小直方图。 (a1–d1 ) PrF3 (2 × 2 μm 2 ) 和 LaF3 (1 × 1 μm 2 ) DMEM+FBS 悬浮液中的 NP。 (a2–d2 ) (x , y ) RE-NPs 的平均等圆面积直径 \( \left(\overline{d}\right) \) 的大小直方图。 (a3–d3) (x , y ) RE-NPs 的 Feret 区域直径的大小直方图 \( \left(\overline{\ F.D.}\right) \)。 (a4–d4 ) 相对于 x 的费雷特角 (F.A.) 直方图 -轴。 RE-NPs沿±(44-60°)之间的两个主要方向取向
<图片>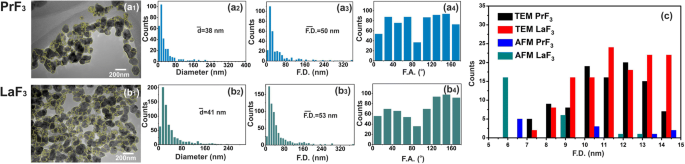
TEM 数字 (x , y ) RE-NP 的大小直方图。 (a1, b1 ) RE-NPs 的 TEM 图像。黄线表示 RE-NP 之间的二维边界。 (a2, b2 ) (x , y ) RE-NPs 的平均等圆面积直径 \( \left(\overline{d}\right) \) 的大小直方图。 (a3, b3 ) (x , y ) RE-NP 的 Feret 区域直径 \( \left(\overline{\ F.D.}\right) \) 的大小直方图。 (a4, b4 ) 相对于 x 的费雷特角 (F.A.) 直方图 -轴,优先方向为 ±(44–60°)。 (c ) 从 AFM 和 TEM 图像中提取的 4 μm 2 小尺寸和微小尺寸 RE-NPs 的 Feret 直径尺寸直方图 区域
<图片>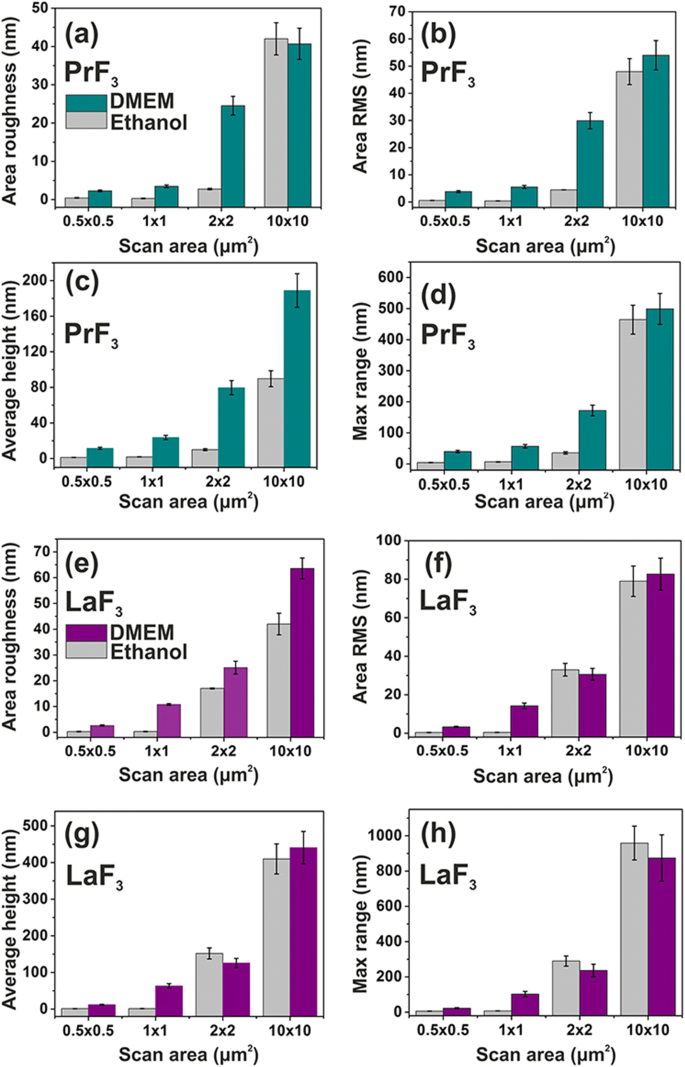
不同扫描区域的 DMEM+FBS 和乙醇中玻璃基板上 PrF3 和 LaF3 RE-NP 的表面参数直方图(z 高度)。 一 , e 区域粗糙度。 b , f 面积 RMS。 c , g 平均身高。 d , h 最大 z -范围
<图片>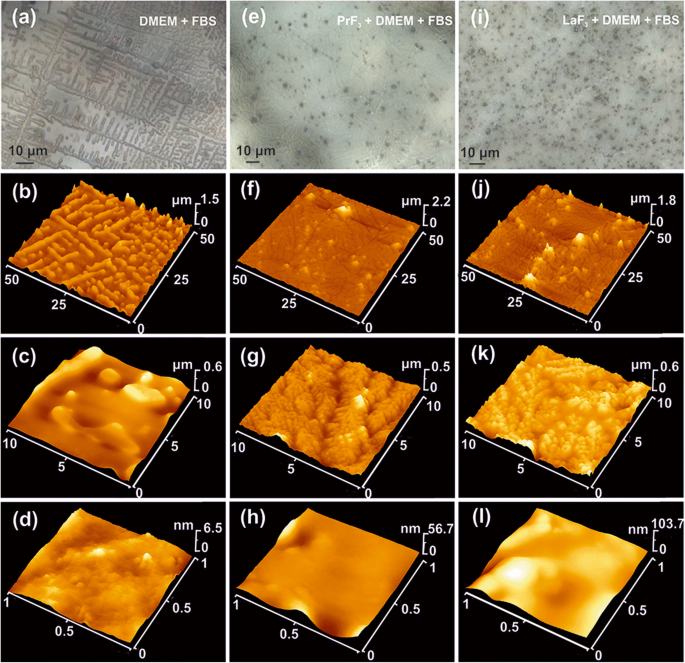
DMEM+FBS 中干燥 RE-NPs 的 AFM 和光学图像。 一 –d 光学 (a ) 和 AFM 图像 (b –d ) 的 DMEM+FBS 显示 5 μm 自组装结构。 e –h CCD (e ) 和 AFM 图像 (f –h ) DMEM+FBS 介质中的 PrF3 NPs,显示 500 nm 枝晶自组装结构。 我 –l CCD (i ) 和不同放大倍数的 AFM 图像 (j –l ) DMEM+FBS 中 LaF3 NPs 显示 100 nm 枝晶自组装结构
<图片>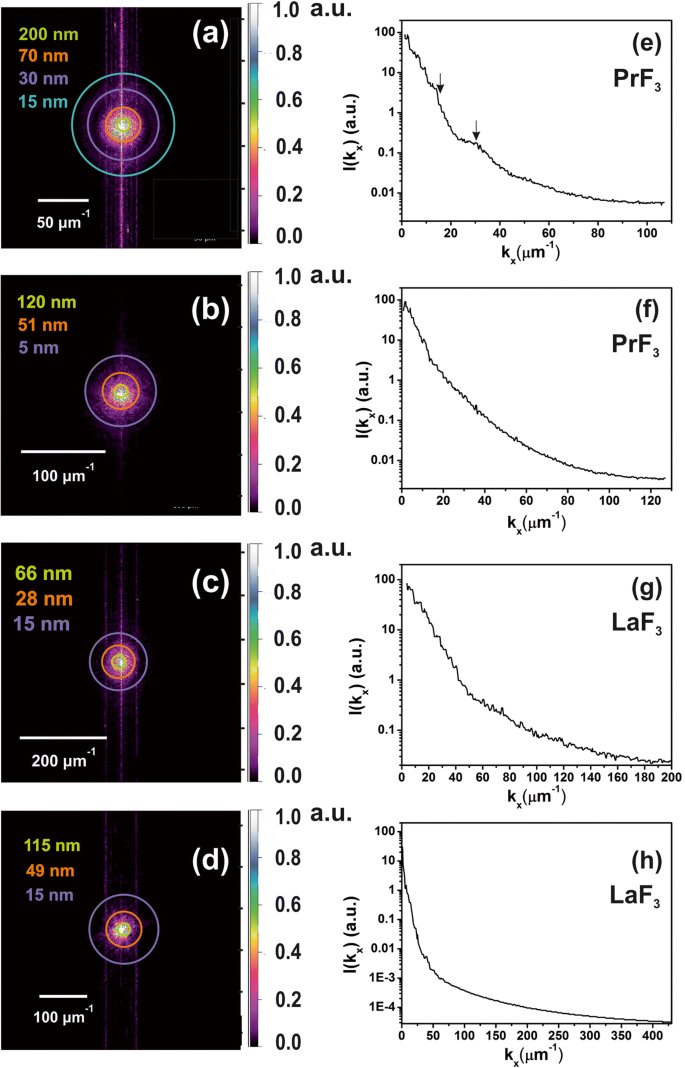
z 的二维 FFT 谱 -DMEM+FBS 培养基中干燥 RE-NPs 的高度分布,表明液体悬浮液中存在小尺寸 NPs。 一 , b 来自 AFM 图像的 PrF3 NPs 的 z 高度分布,图 2(a1,b1)。小z -高度特征(~ 5 nm)在(b )。 c , d 来自 AFM 图像的 LaF3 NPs 的 z 高度分布,图 2(c1,d1)。 e , f z 的功率谱 -PrF3 NPs 沿 x 的高度波矢量 -轴。 g , h z 的功率谱 -LaF3 NPs 沿 x 的高度波矢 -轴
<图片>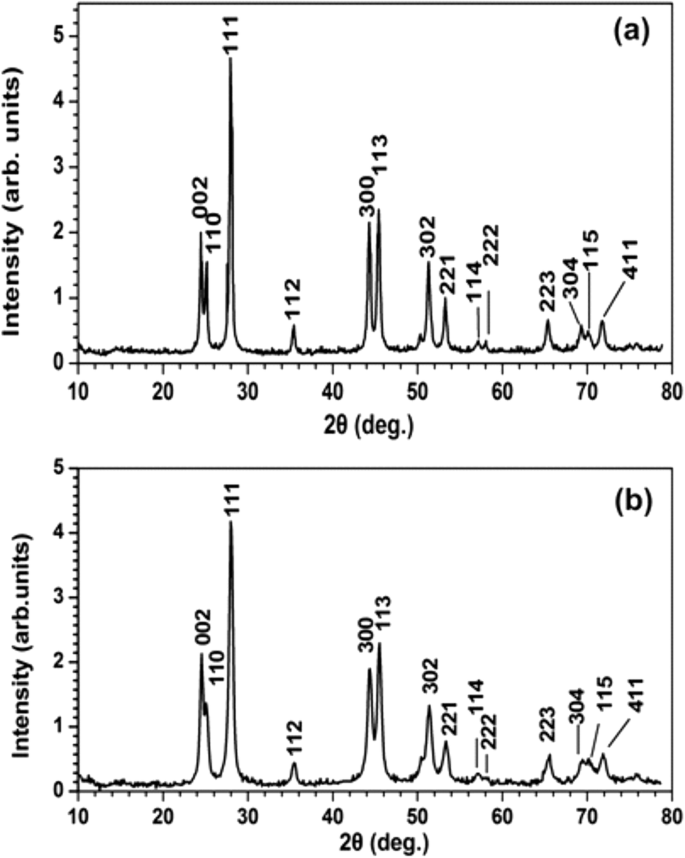
a的XRD谱 PrF3 和 b LaF3 NP。 PrF3和LaF3纳米颗粒的平均表面积直径分别为~ 23 ± 4和~ 15 ± 4 nm
DLS
混浊的异质混合物最初是通过在细胞培养基中添加 RE-NPs 形成的,这证明了液体悬浮液中 RE-NPs 之间相互作用的复杂性。 PrF3 和 LaF3 可溶物均鉴定出微小 (<10 nm)、小 (> 10 和 <20 nm) 和大尺寸 (> 20 nm) 的 RE-NP 结构(图 1a-d)。
大尺寸 RE-NPs 的平均流体动力学半径 (MHR) 值(PrF3 为 55-83 nm,LaF3 为 99-296 nm)与 NPs 的浓度水平(0.1-10 kg m )成正比并成反比。 −3 ) 在含有胎牛血清 (DMEM+FBS) 的液体 Dulbecco's 改良 Eagle's 中,图 1g,h。此外,小尺寸 LaF3 和 PrF3 NPs 的 MHR 保持恒定,分别为 10.66 ± 0.74 nm 和 10.64 ± 0.40 nm,在不同的 RE-NP 浓度水平下。 RE-NPs 的 MHR 保持不变至少 6 天。干燥稀土纳米颗粒悬浮液后,稀土粉末不可能再次溶解,因为强相互作用迫使沉淀稳定了大尺寸的团聚体。
RE-NPs 的 AFM 和 TEM 成像和表面分析
用于 DMEM+FBS 中 0.1 kg m −3 中小尺寸 RE-NP 的可靠尺寸分布和统计 AFM(扫描区域 1 × 1 和 2 × 2 μm 2 )和 TEM 成像也被应用(图 2(a1-d1)和图 3(a1,b1))。将 DMEM+FBS 中 RE-NPs 的液滴转移到玻璃基板后,从 NPs 的平均尺寸和平均 Feret 直径中识别出相对大量的非聚集微小 RE-NPs [38]。图2(a2-d2,a3-d3)和图3(a2,b2,a3,b3))。此外,AFM 和 TEM Feret 直径的角度分布直方图(对于 NPs 的较大尺寸)表明两个 RE-NPs 优先沿 ± (44–62 o ),相对于 x -轴(图2(a4-d4)和图3(a4,b4))。
尽管 z - NPs 的高度分布没有提供关于整体 NPs 大小分布的任何直接信息,它是第一次估计 (x , y ) 大小分布,因为 z 高度和 (x , y ) 分布保持相互关联 [38]。
不同 AFM 扫描区域的干燥悬浮液中 PrF3 和 LaF3 的平均表面参数也显示在图 4 中。小的 z -height 值表示非常均匀的 z -两个 RE-NP 的高度分布对于小 1 × 1 μm 2 扫描区域。相反,对于 RE-NPs 和更大的扫描区域,z -高度分布明显更广。低 z -小扫描区域的高度分布值反映了液体悬浮液中小尺寸 RE-NP 的存在。 DMEM+FBS 培养基中的表面参数值平均大于乙醇,表明蛋白质和 RE-NP 之间存在复杂的反应状态,与图 5 的多面结构和 2D-FFT 数据(图 6)一致)。总体而言,LaF3 NPs 在干燥悬浮液中表现出有趣的响应,并且比 PrF3 NPs 具有更广泛的表面粗糙度参数。
FFT
在 2D-FFT 光谱中的选定半径中添加了彩色环(图 6a-d)。循环代表欧几里德空间中不同的 NPs 尺寸分布,从等于像素大小(1.9-3.9 nm)的微小尺寸到~ 2 μm 的相当大的尺寸,这是 AFM 尖端在 z -轴(图6e-h)。 z 的解卷积 -带有 AFM 尖端半径的高度值提供了 z 中的实际分辨率 -~ 5 nm 的高度分布。由于 z -RE-NPs 的高度为 ~ 44 nm。由于 2D-FFT 光谱中发现的多分散宽小尺寸结构,FFT 图案呈现出逐渐模糊的光晕结构。由于两个 2D-FFT 光谱中只有光晕出现在光谱中而没有任何衍射图案,因此缺少规则的自组装结构。从PrF3和LaF3的环状2D-FFT模式获得的特征相关长度分别为~ 51、70 nm和28、49 nm,与从DLS光谱中提取的MHR值一致。
XRD
XRD 光谱表征了晶体结构并提供了关于 PrF3 和 LaF3 NPs 尺寸的补充信息(图 7)。与两种 RE-NP 的标准六方相结构相对应的尖锐衍射峰揭示了团聚相的高结晶状态。通过使用 Scherrer 公式 (\( \tau =\frac{0.9\lambda }{\beta \cos \left(\theta \right)}\Big) \),平均等积圆直径 (MEAC) τ PrF3 和 LaF3 NPs 的估计分别为~ 23 ± 4 和~ 15 ± 4 nm。
真空紫外光谱
沉积在 CaF2 衬底上的吸湿性 PrF3 NPs 层的 VUV 透射光谱,从 125 nm(~ 10 eV)到 190 nm(~ 6.5 eV)如图 8 所示。VUV 峰值在 140-170 nm 之前归因于Pr 3+ 的转换 来自地面的三价离子4f 4f5d 的 Stark 组件的电子状态配置 YF3、LaF3、KY3F10和LiLuF4单晶基体内的电子构型与水VUV吸收带重叠,表明PrF3和LaF3晶体中存在结合水分子。
<图片>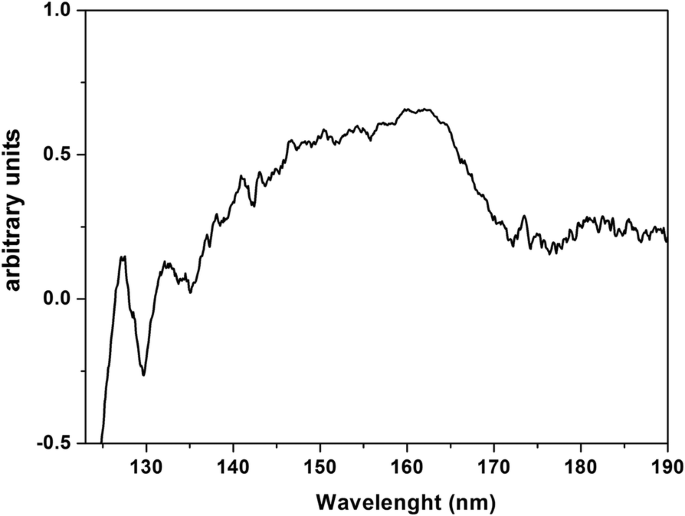
PrF3 NPs 在沉积在干燥 CaF2 基材上的水悬浮液中的 VUV 透射光谱。光谱表明PrF3 NPs内的水附着和捕获
可行性测试
在对 RE-NPs 进行尺寸分布分析和统计后,使用水溶性四唑盐 (WST) 活力测试来监测 PrF3 和 LaF3 NPs 对三种人类癌细胞系的毒性,A549 来源于肺癌,SW837 来源于结肠癌和源自乳腺癌的 MCF7。使用 DMEM+FBS(A549、SW837)和 Roswell Park Memorial Institute 培养基(含胎牛血清(RPMI+FBS)(MCF7))中三种不同浓度的 RE-NPs 悬浮液(0.5、1 和 5 mM)。细胞系最初放置在 96 孔板上,放置过夜。为了在细胞生长的线性区域内并避免一天后饱和(图 9a),添加含有 PrF3 和 LaF3 悬浮液的新鲜培养基,并在添加 RE-NP 后 24 和 48 小时进行活力测试,或细胞铺板初始时刻后 48 和 72 小时。然而,对于三个浓度和三个培养细胞系,检测到过度生长的差异,前提是没有更换培养基并且没有在培养物中添加额外的 RE-NP,这些做法会改变实验的初始条件。此外,不可能将细胞浓度低于~ 5 × 10 4 细胞每孔,因为三个细胞系的汇合太小,无法保证可测量的细胞生长。最佳实验设置为~ 5 × 10 4 每孔细胞。
<图片>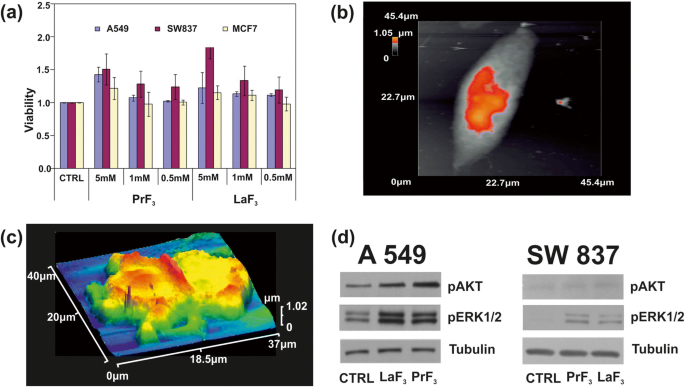
一 在生物培养基中用不同浓度的 PrF3 和 LaF3 NPs 处理的三种不同癌细胞系(A549、SW837、MCF7)的 WST 活力测定直方图。 b 单个 A549 癌细胞的 AFM 图像。 c DMEM+FMS 中 RE-NPs 中分裂的 A549 癌细胞的 AFM 图像。 d AKT和ERK通路A549、SW837细胞Wb磷酸化分析
在较高浓度 (5 mM) 下,对于两种 RE 悬浮液,所有细胞系均获得上升生长(图 9b、c)。其中,增长值最高的是 SW837 系(86%,LaF3)。对于 5 mM MCF7 细胞系,注意到不太明显但仍然相关的细胞过度生长 (15%)。 t 测试统计分析 (p 和费舍尔 F 值)的肿瘤细胞活力表明,肿瘤细胞的生长在 24 小时时不饱和;它遵循一个未知的物理定律,将 RE-NPs 的活力和浓度联系起来(附加文件 1)。
磷酸化分析
还测试了两种蛋白质的磷酸化状态(图 9d)。在 A549 和 SW837 细胞系中使用特异性抗体和 Wb 测定在含有 5 mM LaF3 和 PrF3 NPs 的 DMEM+FBS 中生长 24 小时,与对照细胞相比,处理细胞中 ERK1/2 和 AKT 的磷酸化活性高(CTRL ), 获得。
讨论
在两种 RE-NP 的较高浓度水平下,癌细胞的相对生长率都在上升(图 9a)。然而,DMEM+FBS 中 RE-NPs 的 MHR 值与 0.1–10 kg m −3 的 RE-NPs 浓度成正比(PrF3)和成反比(LaF3) (图1g,h)。因此,平均粒径在~ 55 nm以上的RE-NPs应该不会对细胞生长产生任何影响,只有微小粒径的纳米颗粒才能真正参与肿瘤生长。
RE-NP 的大小和结构
微小 RE-NP 的识别
从实验数据中,提取了 RE-NPs 的平均大小、分布和统计参数。通过应用 t 干燥 PrF3 和 DMEM+FBS 悬浮液中 NP 的“平均等面积圆”的“零假设”的检验统计数据,p 两个随机选择的 AFM 图像之间的 NP 直径值为 ~ 0.001(附加文件 2)。从 AFM 数据中可靠地提取出 MEAC 直径值(63 nm),这与 DLS 数据中的 MHR 值相当(图 1g)。
相反,来自随机选择的 LaF3 样品的 MEAC 直径值显示平均 MEAC 直径为 26 nm,具有更高的拒绝概率值 (p =0.07),表明 LaF3 在液体悬浮液中的发散行为。 MEAC 直径与来自 DLS(296 nm)(图 1)的 MHR 之间的差异再次归因于 LaF3 悬浮液中相互作用的复杂性。事实上,对于 2 × 2 μm 2 AFM尖端扫描面积,平均z -高度为 ~ 140 nm,显示存在大尺寸 LaF3 NPs,从基板上的液体悬浮液转移(图 4)。对于“随机选择的 TEM 样品的 MEAC 直径值相等”的“零假设”,p 值也很小 (p =0.001)。对于这两种 RE-NP,从 PrF3 和 LaF3 的 TEM 和 XRD 组合数据中提取的平均 MEAC 直径值表明 p 值,p =0.29 和 0.06 分别,不允许因此在 TEM 和 XRD 数据之间存在任何相关性。只有 TEM、AFM (PrF3) 和 DLS 数据足以可靠地提取 MEAC 直径和核壳值(附加文件 2)。
此外,Feret 直径的非各向同性角分布表明 PrF3 和 LaF3 结构都是高度极化的电介质,因为各向异性角分布表明纳米晶体之间存在强极性相互作用。 LaF3 的不同极化状态降低了悬浮液中团聚状态的相对效率,并增加了干燥样品的表面粗糙度参数。
5 μL 浓度为 0.1 kg m −3 的随机 AFM 图像的软件粒子分析 鉴定了一些~ 22和~ 11个尺寸小于15nm和10nm的RE-NP(p =0.001),以及来自 TEM 图像的 ~ 60 个 RE-NPs (p =0.001) 在 ~ 4 μm 2 的区域 ,从而证实了 DLS 未检测到的悬浮液中存在微小尺寸的 RE-NP(图 3(c),附加文件 2)。
RE-NP 的结构和几何形状
RE-NPs 的大小分布在乙醇和 DMEM+FBS 悬浮液中是不同的(图 4)。这种多样性是由于吸附的蛋白质、碳水化合物、电解质和 RE-NPs 表面之间的不同分子相互作用,导致形成高度复杂的有机斗篷(电晕),从而调节 RE-NPs 与细胞的特异性相互作用。 DMEM+FBS培养基。
吸湿性 RE-NPs 中的水分子与 DMEM+FBS 之间的相互作用对于核壳形成也至关重要。在制备的初始阶段,它还对中间相互作用中的蛋白质和构象变化产生了深远的影响。随着 NPs 在悬浮液中的表面积与体积比变得很高,RE-NPs 的有效稳定性和物理化学、机械和流动特性,包括吸收蛋白质的能力,发生了极大的变化 [39,40,41] .
通过 AFM 和 TEM 比较液体 (DLS) 和固化悬浮液中 RE-NPs 的尺寸分布表明,RE-NPs 被封装在有机形状内,形成核壳介电结构,其中蛋白质壳围绕着 RE 核。从沉积在玻璃基板上的 DMEM+FBS 悬浮液中固化的 RE-NP 成像的 AFM 也指向多面 RE-NP 和蛋白质电晕复合物的形成(图 5)。虽然干燥的介质形成了晶体结构的规则自组装图案(图 5a-d),但干燥的 RE-NPs 悬浮液显示出具有几个黑点的无定形层状结构,即使使用 AFM 的数码相机也可见(图 5e-l) .在更高的光学放大倍数下,DMEM+FBS 中的两种 RE-NPs 以及枝晶型结构都检测到球状的离散团聚,比单独在介质中的要小,两者都显示了相互作用的复杂性,与表面参数结果(图 4)。即使使用最高的 AFM 分辨率(1 × 1 μm 2 区域),在图 5 的最后一条泳道,在分辨率限制 ~ 5 nm 内,在两种 RE-NP 的干燥结构中都没有发现孤立的 RE-NP 聚集。光学图像中显示的黑色球形菌丝体,1-2 μm 长,是核壳 RE-NP 的大团聚形成。 RE-NPs与DMEM+FBS之间反应的复杂性通过将纯DMEM+FBS中的长期自组装细长结构转化为枝晶结构来可视化。
结果指向封装在蛋白质壳内的单个 RE-NP 核心结构的图片。这些结构无法检测到,因为它们被有机物质和电解质包围,两者都与 RE-NP 发生交叉反应。 PrF3 的 VUV 光谱显示了 140 到 170 nm 之间的一些光谱峰(图 8)。离子跃迁与 VUV 吸水带重叠,从 145 到 180 nm,最大值 在 168 纳米。只有 4f6s 的光谱特征 具有最大值的电子配置 在 132 和 127 nm 处出现在光谱中。然而,这些带可能表明高吸湿性 PrF3 悬浮液中存在水。水在以 122 nm 为中心的 VUV 光谱范围内具有丰富的结构化吸收带,表明核壳纳米颗粒中存在水分子。
机械传感器的激活
外力激活整合素
除了 TSR 的 3D 结构性质外,RE-NPs [24] 对致癌途径的激活基于一些自然进化原理,以维持细胞的活力。 First, upon binding a specific external ligand in a LABS, conformational changes along the entire TSR spectrum underline a series of cascading pathways, triggering tumour cell growth (Fig. 9c, d). The transmission of signals advances through the plasma membrane via various protein chains. Signal transduction was via conformational transformations of integrins responding to a high affinity external force (Fig. 10a, b).

Simplified layout of integrin activation by NPs and signal transaction pathways. 一 Structure and conformational geometries of integrins at a low (A), medium (B) and high-affinity strengths (C). b AKT and ERK1/2 signal transaction pathways activated by RE-NPs via external integrin stimulation
Because of “life sustainability” and “survival laws” that prevents cancer cell growth by random “noise”, it is required that the strength of the external force should be within a bounded range of values and also the external strength stimulus should apply for a long period on a large number of mechanosensors in a cancer cell. The external strength that stimulates cancer must be slightly larger than the strength of the interatomic molecular forces under normal conditions. For a thermal energy of a ligand at room temperature (kT = 0.025 eV, T = 298 K), and for a regular thermal stress of molecular bonds of ~ 0.05 nm, the mean thermal force acting on the LABS stays for 1.2 × 10 −12 N. In principle, a force above ~ 10 × 10 −12 N acting coherently on the whole set of mechanosensors on a cell should activate signal transduction in tumour cells. Consequently, ignoring any thermal and mechanical stressing in the ECM normal conditions, integrin activation via electrical polar interactions between LABS and NPs has the potency to start signal transduction in cancer cells and to initiate tumorigenesis.
Integrin Structure and Geometry
An integrin receptor in the upright conformation state extends ∼ 20 nm upwards from the cell membrane [42] (Fig. 10a). For no contacts between the two α- and β-subunits, other than those in the headpiece near the ligand-binding pocket, the α- and β-subunits are well separated with their cytoplasmic tails extended out up to ∼ 8 nm [42]. A conic projection geometry (20 nm slant height, 5–10 nm diameter of its circular base), bounded by the α- and β-subunits, defines a projected area on the surface of cell’s membrane between ~ 19 and ~ 80 nm 2 , for a typical mean radius of a tumour cell R c ≈ 5 μm (equivalent surface area of a spherical cell \( {S}_c=4\pi {R}_c^2=3.14\ \mathrm{x}\ {10}^8\ {\mathrm{nm}}^2 \)). By dividing the area S c of a spherical tumour cell surface with the projected area of an integrin on a cell surface, an upper limit of the number of integrin receptors for these projected areas was n int = 1.6 x 10 7 and 3.9 × 10 6 分别。 These numbers are compared with the mean number of integrins on a cell \( {\overline{N}}_{int}\approx 2\ \mathrm{x}\ {10}^5 \) and for an average interspacing of 45 nm between adjacent integrin receptors [43]. Nevertheless, \( {\overline{N}}_{int} \) might be larger because of an uneven surface structure, different separating distances between integrins and variable size of tumour cells (Fig. 9c), but the number of integrins on a cell membrane stand between n int and \( {\overline{N}}_{int} \).
Interaction of Mechanosensors with RE-NPs
ERK ½ and AKT Activation
The TEM images and the elemental mapping of F, La and Pr showed that RE-NPs were unable to penetrate inside the cell. They gathered around the A549 cell membrane (Fig. 11), confirming that an external force can stimulate cell growth because of TSRs activation [44]. The Pr atoms were distributed around the boundaries of the cell’s membrane. The small numbers of F, La and Pr identifications inside the cell were not associated with endocytosis of RE-NPs, but they were images of RE-NPs from the projections of the two cells hemispheres on cell’s equatorial cycle.

TEM images and elemental analysis of RE-NPs at the surface boundaries of A549 cells. 一 TEM image of small size LaF3 NPs surrounding the A549 cells. b Elemental analysis of F atoms in RE-NPs distributed around the cell. c Elemental analysis of La atoms. The low concentration of La atoms was associated with a rather small scattering efficiency of the X-rays. d –f The same as for (a –c ) for PrF3 RE-NPs
It was also evident that both RE-NPs were able to enhance AKT phosphorylation, especially in A549 cells (Fig. 9d), where the steady-state level of AKT pathway activity was higher for the SW837 cell line. The phosphorylation level for the MCF7 cell line was below the detection limit, in agreement with the relatively low levels of growth. High phosphorylation levels of ERK1/2 [36] and AKT were detected in A549 and SW837 cell lines. Cell growth was started once NPs with a proper size interact with the mechanosensors of the cells to provide the correct force for initiating cell growth [45, 46]. ERK and AKT pathways were frequently active in several cancer cell types via extracellular springing, as they were stimulated by the TSRs, upon a selective binding with various mitogenic ligands, or via the activation of the mechanosensory group. The interaction was responsible for a continuous intracellular stimulation that, according to the cell’s phenotype, driven the cancer cells to uncontrolled and endless growth. Viability tests were also run for 48 and 72 h, but the growth of all cell lines was saturated at 48 and 72 h after the initial moment of Cell plating.
Interaction of Cells with Ions
Likewise, as fluoride anions are the most reactive electronegative elements and, the mean radii extension of the unscreened 4f electronic configuration of La and Pr trivalent ions are relatively large, high electric surface charges could be developed via electric dipole interactions [47].
One crucial question stands whether a single ion binding on a specific site can activate tumour cell growth. Because the projected area of the 4f electronic configuration of a single RE ion is S 4f = 0.040 and 0.043 nm 2 (for an approximated spherical geometry of the 4f electronic configuration and a 4f mean orbital radii ~ r 4f =0.113 and 0.117 nm for Pr and La ions, respectively), a typical upper limit number of single RE ions, or other equivalent size ions, over the whole area of the cell membrane was ~ Sc/ S 4f = N 4f ~7.9 × 10 9 RE ions; a number which is at least two orders of magnitude above the upper limit of the mean number of integrins on a tumour cell. As the relative overgrowth of cells was ascending with rising concentration (Fig. 9a), it is unlikely that tumour cell growth is triggered by a specific binding of single trivalent RE ions [48] on the ligand sites [49,50,51]. Indeed, the large number of RE ions should have saturated the cell’s growth and thus the viability of cells should have remain independent from the concentration of the RE ions.
Interaction of Integrins with RE-NPs
Within the requisite force range of few pN, and for efficient activation of integrins from NPs, the interaction between NPs and LABS should activate a large fraction of integrins of the cell for a long time. In the most extreme favoured case for cell growth, the number of NPs had to remain equal with the number of integrins on the cell’s surface, and the interactive force between LABS and NPs has to be attractive for obtaining a constant (long-term) action. A thin spherical shell of spherical NPs surrounding a tumour cell occupied a volume\( {V}_{sc}\approx 4\uppi {R}_c^2x \), where R c = 5 μm is the cell radius and x ≈ 20 nm is half the separating distance between adjacent integrin receptors and V sc ≈ 6.3 x 10 9 nm 3 . For justifying the requirement that each integrin receptor interacts only with one NP, a first estimation of the size of NPs to meet the above requirements for the whole set of integrins on a cell is obtained by dividing the volume of the spherical shell V sc with the number of integrins. A simple calculation for a cell radius 5 μm shows that the limits of radii of NPs activating the whole set of integrins within the spherical shell volume V sc ≈ 6.3 x 10 9 nm 3 covering the cell is obtained by divided the volume V sc with the number of integrins \( {\overline{N}}_{int}\approx 2\ \mathrm{x}\ {10}^5 \) and n int ≈ 1.6 x 10 7 . The volume of the spherical NPs stands for 3.15 × 10 4 and 3.93 × 10 2 nm 3 分别。 Therefore, the radii of the NPs interacting with an integrin lay between ~ 20 and 5 nm. Allowing for one order of magnitude variations in the number of integrins \( {\overline{N}}_{int} \), the radii of the NPs interacting with integrins is between ~ 27 and ~ 3 nm respectively.
By also applying similar simple calculations and within the experimental limits of concentration levels of RE-NPs (0.1–10 kg m −3 ), the maximum numbers of PrF3 with MHR 55–83 nm and LaF3 with MHR 296–100 nm NPs (Fig. 1g, h) covering the surface of a tumour cell V sc stood for 4.1 × 10 4 –2.1 × 10 4 and 17.1 × 10 2 –1.5 × 10 4 NPs. These values are placed well below the number of integrins on the cell surface. For rising concentrations of PrF3 and LaF3 from 0.1 and 10 kg m −3 , the number of PrF3 and LaF3 NPs in the suspensions must go up for either descending or ascending size of NPs. As viabilities of cancer cells are raised at higher concentration levels, it is unlikely that 55–296 nm sized RE-NPs are responsible for cancer cell mitosis under the current experimental configuration.
Also, from the DLS data, the size of both RE-NPs between 10 and 20 nm remained constant (10.6 nm) at different RE concentrations. The number of RE-NPs with this size covering the cell surface is between 3.7 × 10 5 and 1.5 × 10 6 . This number is comparable with the mean number of integrins \( {\overline{N}}_{int}\approx 2\ \mathrm{x}\ {10}^5 \) on a cell surface. Therefore, only small size RE-NPs have the potency to stimulate cancer cell growth by stimulating all the integrins on a cell surface, in agreement with the experimental observations (Figs. 1g, h and 9a).
The number of tiny sizes RE-NPs with MEAC diameter (TEM) from 2 to 10 and 10 to 15 nm on the cell surface (S c = 314 μm 2 ) stands for 1.3 × 10 4 and 1.8 × 10 4 RE-NPs, respectively. Those values stayed one order of magnitude below \( {\overline{N}}_{int}\approx 2\ \mathrm{x}\ {10}^5 \) and therefore tiny size RE-NPs had also the potency to justify the experimental results of rising viability values with concentration (Fig. 9a). Also, the rough surface of tumour cell (Fig. 9c) is able to form cavities, where small size RE-NPs are trapped, triggering thus cell’s mechanosensors. Most important, only tiny size RE-NPs have the potency to activate integrin receptors via electrical dipole interactions (vide infra).
Interaction of EGFR with RE-NPs
An upper limit of small size NPs capable of stimulating cell’s overgrowth via the EGFR was set previously to 14 nm [52], but a realistic size of NPs stimulating the EGFR should be < 5 nm [53] (Fig. 12). The area number density of EGFR on the surface of tumour cells stands for ~ 1.4 × 10 −4 nm −2 and the total number of EGFR on the surface S c of cells remains between ~ 4.2 x 10 4 and 10 5 [54,55,56]. RE-NPs with 5–10 nm size stayed for a number of 34 NPs (Fig. 3). Extrapolating this number to the surface of a cell S c , the total number of RE-NPs remained at ~ 10 4 NPs, a number which matches the number of EGFR receptors on a A549 cell. Therefore, the EGFR have the potency to be activated synergistically also by a number of tiny size RE-NPs.

AKT and ERK1/2 signal transduction pathways activated by RE-NPs via EGFR stimulation. EGFR is activated only by tiny size ~ 5 nm NPs
Electric Dipole Interaction Between RE-NPs and LABS
The above experimental results are supported by the hypothesis of cancer cell growth from LABS stimulation by tiny size core-shell RE-NPs via electrical dipole interactions, Appendix.
Indeed, the mean electrical dipole force \( \left\langle {\overrightarrow{F}}_{V_2}\right\rangle \)acting on LABS from a core-shell RE-NP includes two terms (Fig. 13d and Appendix, Eq. A22). The first radial term is inversely proportional to the forth power of separating distance r 1 between the RE-NPs and LABS and is also proportional to the size of NP. The second polar term is inversely proportional to both the separating distance r 1 and the square power of the size of NP,
$$ \left\langle {\overrightarrow{F}}_{V_2}\right\rangle =-\frac{G_1{N}_2{N}_1\ d{e}^2}{4{\varepsilon}_0\ {r}_1\ }\theta \left(\ 3G\frac{b}{r_1^3}{\widehat{r}}_1+\frac{\theta }{2{b}^2}{\widehat{\theta}}_1\right)\kern0.75em (1) $$
一 Electrical dipole interaction between one core-shell RE-NP and one LABS. b , c RE core-shell NP near a MIDAS (b ) and ADMIDAS (c ) adhesion sites. d Locus area (green) of the size of RE-NPs and separating distance between a LABS and a core-shell RE-NP for two electrical charging states
在方程式中。 1, G and G 1 are the geometrical factors of NPs, describing either core-shell or core spherical structures, Appendix, Eqs. A6 and A14; N 1, N 2 are the numbers of surface electrons on the a RE-NPs and LABS surfaces; d and b are the effective characteristic spatial extension of atomic orbitals of LABS, ~ 0.1 nm, and the radius of RE-NP; e and ε 0 are the electron charge and the vacuum permittivity and \( \theta =\frac{d}{r_1}<0.01\ rad \). Because the core of the RE-NPs is a crystalline semiconductive material, an inherent large number of surface and volume defective sites were accountable for a high density of pseudo-electron energy levels that allowed the electrons to move freely within the core volume [46]. Consequently, a core-shell structure had the potency to be highly polarised. Therefore, LABS can be activated efficiently by core-shell RE-NPs via electrical dipole interactions at close separating distances. The high polarised efficiency of the core nucleus was confirmed experimentally via the selective orientation of NPs along two distinct directions (Fig. 2(a4–d4) and Fig. 3(a4, b4)).
The polar interaction force is also proportional to the geometrical factor G 1, Appendix, Eq. A14. Typical values of dielectric constants of the culture media, shell configuration and RE core components stand for ε 1 = 78, ε 2 = 10 and ε 3 = 15. When the ratio of core-shell to core radii b/a sets within 1 and 50, the geometrical factors G , G 1 retain almost constant values (G = 0.2, G 1 = 0.01) and they are self-same for both a spherical core (b/a = 1) and a spherical core-shell. Any permanent or induced polarisation of an open or closed a-I-MIDAS domain forming the LABS domain has its origin on six coordinated water oxygen atomic orbitals with Mn 2+ or Mg 2+ ions, arranged in a spherical geometric configuration [7] (Fig. 12a–c).
As the electrical dipole force in Eq. 1 stands for the vector sum of a radial (first term) and a polar component (second term), the last term prevails over the first one provided that
$$ {r}_1>\sqrt[3]{6G}b\sim b\kern0.75em (2) $$In this case, a LABS is activated from the polar force component for all (b/a) ratios and, most important this term is inversely proportional to the second power of the size of NPs, in agreement with the experimental results that only tiny or small size LaF3 NPs activated cancer cell proliferation.
The prevailed polar force term for different r 1 and b values and for different Ν 1, Ν 2 charging states activating the LABS/MIDAS stay within the limits [57,58,59,60].
$$ {10}^{-12}N<\frac{G_1{N}_2{N}_1\ d{e}^2}{8{\varepsilon}_0\ {r}_1{b}^2\ }{\theta}^2<{10}^{-9}N\kern1em (3) $$Inequality 3 relates the size b of the RE core-shell NPs, the separating distance r 1 and the number of the bound or free electrons Ν 2, Ν 1 on the surface of the two dipoles. The locus of points (r 1, b ) satisfying the inequality 3 for different surface charge states Ν 1, Ν 2 is bounded by the black, red and blue lines (Fig. 13c). As there was no specific assumptions for the type of RE-NP, results can be equally applied for any type of polarised NPs.
When the algebraic product of the number of the surface electrons N 1 and N 2 (bound or free) on the LABS and the RE-NP, respectively, was N 1N 2 = 2, the locus of RE-NPs size and separating distance for integrin activation was < 1 nm. At higher charging states, N 1N 2 = 10 4 , the locus area spans a wider RE-NPs size and separating distance area set of values, from 0.5 nm–19 nm to 2.5–15 nm, respectively.
From the above analysis, it is found that only tiny or small size NPs can activate LABS at a certain separating distance r 1 and the electrical dipole interaction strength decays inversely proportional to the second power of the size of NPs. From Fig. 13c and for a charging state with N 1 N 2 = 5 x 10 4 , the size of NPs capable to activate LABS is bounded by the limits
$$ 2.5\ \mathrm{nm}Conclusions
Cancer is a complex disease. Tumours are highly heterogeneous, and cell growth, among other factors, depends on dynamical interactions between cells and the continually changing extracellular matrix. Besides random genomic mutations, signal transductions in cells, activating cell growth can be triggered by mechanical, thermodynamic and electrical polar interactions between the microenvironment of the extracellular cell matrix and the membrane’s mechanosensors. Here, we demonstrated that tumour cell proliferation in three different human cancer cell lines (A549, SW837, MCF7) had the potency to be activated by a synchronised and synergetic activation of EGFR or via electrical dipole interactions between tiny size RE-NPs and the LABS of integrins on a cell.
Because the prerequisite force for integrin activation should stand between 10 −12 and 10 −9 N, the size of the active RE-NPs causing cell growth should be within certain limits. Cancer activation is specified by both the electrical surface charges on the LABS and the NPs and by their separating distance. This electric dipole activating force follows an inversely proportional square power law of the radius of NPs, evidencing that only tiny or small size RE-NPs have the potency to stimulate cancer cell growth via electrical dipole interactions, in agreement with the experimental results.
Methods
Synthesis of RE-NPs
PrF3 NPs were synthesised via co-precipitation. Briefly, 4 g of Pr2O3 were added to 110 mL of 10% nitric acid in a polypropylene glass beaker together with 3 g of NaF under stirring. The mixture was heated to 50 °С and stirred for 45 min until a clear light-green solution appeared. Then it was filtered. The pH of the mixture adjusted to 4 by adding 25% of ammonium hydrate. Next, the mixture was stirred again for 20 min. Finally, the precipitated NPs washed with distilled water by centrifugation.
LaF3 NPs were also synthesised by applying the same protocol in a mixture of La2O3 (4 g) and NaF (3 g). From both preparations, an aliquot of the suspensions containing NPs was air-dried for structural analysis and the remaining part kept as water suspension for the biological studies.
The suspensions of NPs were prepared in complete DMEM+FBS cell culture medium by adding water suspended NPs directly to the medium to a final concentration of 5 mM. Then, starting from the 5 mM stock solution, some subsequent dilutions using DMEM as a solvent were prepared to a final NPs concentration of 1 mM and 0.5 mM, respectively.
Size Distribution of RE-NPs
XRD
The crystal structure and the size of PrF3 and LaF3 NPs were characterised by XRD spectroscopy, with an X-ray diffractometer (Shimadzu XRD-7000S) in the 2θ range from 10° to 80° using the graphite monochromatised Cu-Ka radiation (1.5406 Å). The weighted average of τ for all peaks was used in the statistics. Weighting, besides β, took into account the relative intensity of every peak of the XRD spectra. The corresponding errors incorporate the reading error (0.3 mrad) and the standard error of the mean (se = σ / √ Ν ).
DLS
The size distribution and the MHR of RE-NPs in water and DMEM+FBS suspension were determined for comparison by DLS at 632.8 nm and right angles at 37 °C with a multi-angle dynamic and static light scattering instrument (PHOTOCOR-FC). The values of the MHR (Stokes radius) and the size distribution of NPs were calculated from the autocorrelation spectra and the Stokes-Einstein relation with the DynaLS software. Because the intensity of scattered light in pure DMEM+FBS was 20 times lower than with RE-NPs additives, the level of aggregating proteins in pure DMEM+FBS was negligible compared with mixed suspensions of RE-NPs in DMEM+FBS medium. MHR and RE-NPs size distribution and size errors were obtained by fitting and processing the data from the DLS instrument with the DynaLS software that allows the MHR to be calculated in different spectral domains of the main size distributions, from 10–10 2 to 10 2 –10 3 nm, Additional file 2.
AFM
Because size distribution below 15 nm was close to the low limit range of DLS, AFM was also applied to evaluate small size distribution. At low concentration of RE-NPs in liquid suspensions and slow drying rates of droplets on glass substrates, the deposits reflected the size distribution in the liquid suspensions [37]. Following the dispersion of RE-NPs in ethanol or DMEM+FBS, a drop of suspension was placed on a clean glass substrate using a micropipette, and then it was dried in air at room temperature for AFM imaging and analysis (diInnova, Bruker). AFM was performed in the tapping mode, in ambient conditions with a phosphorus-(n)-doped silicon cantilever (Bruker, RTESPA-CP), having a nominal spring constant of 40 nN/nm and operating at a resonance frequency of 300 kHz. Surface areas of various sizes (0.5 × 0.5–50 × 50 μm 2 ) were imaged with high spatial resolution (512 px × 512 px) at a scanning rate of 0.2 Hz to identify domains with different size distributions via “scan area filtering” [37]. From the morphological analysis by the SPM LabAnalysis V7 software, the particle’s size distribution, shape and aggregation stage were determined.
The size of NPs for different scanning areas was also noticeable by the particle analysis chromatic bar (Fiji integrated ROI colour coder based on MEAC diameter) (Fig. 2(a1–d1)). The AFM image was transformed into a binary image using an appropriate z -height threshold. Every pixel of the processed image contained information not only for the z -height in the pixel area but also for the presence of particles in the pixel area. The x -histograms of MEAC and Ferret diameter (Fig. 2(a2–d2, a3–d3)) were extracted by using the “Image J 1.51n Fiji distribution software”, with the correct z -height threshold values. The size resolution per pixel was 3.9 and 1.9 nm for PrF3 and LaF3 respectively.
The particle identification, the noise extraction and the particle area data were processed by the “Particle Analyser function” of Fiji software (Fig. 2(a1–d1)). The particle diameter histograms were also analysed. Both the equal area circle diameter (Fig. 2(a2–d2)) and Feret diameter or “calliper diameter” (maximum diameter of a particle among all directions) (Fig. 2(a3–d3)), whose direction was the Feret angle (Fig. 2(a4–d4)), were analysed. The mean equal area circle diameter and the mean Feret diameter were calculated taking into account all particles identified. The associated errors incorporated the actual pixel size in every AFM image and the standard error of the mean (se = σ / √ Ν ).
A t test was performed for every set of AFM images based in the “null hypothesis” that the mean particle diameter was the same for all the AFM images between randomly selected figures (Fig. 2(a1–b1, c1, d1)). p value (probability that the null hypothesis based on t distribution is not valid) is shown in Additional file 2.
TEM
The same technique was followed for calculating the above parameters in TEM imaging (Fig. 3(a1–b4)). Atomic resolution TEM (Hitachi HT7700 Exalens) imaged either extracellular or intracellular RE-NPs attachment on the A549 cells fixed in glutaraldehyde. Elemental analysis of F, La and Pr were also carried out (Oxford Instruments X-Max 80T).
2D-FFT
Additional information on the NPs size distribution in the (x , y ) plane was also extracted from the 2-D Fourier transform of AFM images of NPs using the relation
$$ I\left({k}_x,{k}_y\ \right)=\iint f\left(x,y\right)\exp \left(i{k}_xx\right)\exp \left(i{k}_yy\right) dxdy $$其中 f (x , y ) is a size function at a point (x, y ), k x , k 是 are the associated wavevectors in the inverse Eukledian space at the same point and I (k x , k 是 ) is the “spectral density” of the function f (x , y ) at the point k x , k 是 . For most applications, f (x , y ) is the z -height of the NPs at the point (x, y ) and z =f (x , y ).
For a set of discrete data, such as the digitised AFM images, the 2D-FFT was used instead of 2D Fourier transform in the continuous space. For a m × n X-matrix (pixels of an AFM image), the 2D-FFT transform takes the form
$$ \kern1em {Y}_{p+1,q+1}=\sum \limits_{j=0}^{m-1}\sum \limits_{k=0}^{n-1}{\omega}_m^{jp}{\omega}_n^{kq}{X}_{j+1,k+1\kern1.25em } $$where \( {\omega}_m^{jp}={e}^{2 pi/m},{\omega}_n^{kq}={e}^{2 pi/n} \) are the associated frequencies. Then, an appropriate shift along the y -axis was performed and the integers m, n, p, q, k were translated into lengths and inverse lengths respectively by a multiplication with the pixel’s size of the image.
Water Trapping in RE-NPs
VUV Spectroscopy
To appraise the state of water in RE-NP’s complexes during the initial stage of suspension preparation, the adsorption of water molecules on the surface of the hygroscopic PrF3 NPs was identified with a laboratory-made VUV (110–180 nm) absorption spectrometer. It consists of a hydrogen lamp operating in a longitudinal stabilised discharge mode at 10 kV, a stainless steel vacuum chamber and a VUV monochromator (Acton VM502), equipped with a solar blind photomultiplier (Thorn EMI 9412 CsTe) and a laboratory-made data collection system. Thin layers of PrF3 NPs suspensions in water were prepared and dried on 1-mm-thick VUV-grade CaF2 substrates by applying the “drop-casting method”. Then, the CaF2 substrates were placed in the optical path between the hydrogen lamp and the VUV monochromator in a vacuum. The stainless steel 316 vacuum chamber was evacuated initially to 10 − 7 mbar using two turbomolecular pumps at a differential pumping configuration (Edwards EXT 100/200, pumping speed 150 ls −1 )。 However, a high outgassing rate of PrF3 sets an upper limit to the background pressure in the vacuum chamber ~ 8.5 × 10 −5 mbar. The relatively low background pressure of both compounds irreversibly damages the VUV optics and the turbomolecular pump after few hours of operation and therefore it sets certain experimental constraints, preventing an equivalent registration of LaF3 spectrum because of high outgassing rates and a low background operating pressure (< 10 −4 mbar). The experimental data (light transmitted through the sample film on CaF2 window) were fitted to a logarithmic response for calculating the transmittance.
Cell Culture and Growth Assay
Cell Growth
The A549 and SW837 cell lines were maintained in DMEM+FBS, whereas the MCF7 lines were in RPMI+FBS. Both media supplemented with 10% fetal bovine serum (FBS), 1 × penicillin, 1 × streptomycin and 2 mM l-glutamine. Cells were incubated at 37 °C, 5% CO2 in a humidified atmosphere.
The WST viability test was used to monitor the intrinsic toxicity of PrF3 and LaF3 NPs for three human cancer cell lines, A549, SW837 and MCF7. For the viability assay, three different concentrations of RE solubles (0.5, 1 and 5 mM) in DMEM+FBS (A549, SW837) and RPMI+FBS (MCF7) were used. The initial number of cells seeded in the 96-well plates was ~ 5 × 10 4 细胞/孔。 This amount of cells was plated 24 h prior to the RE-NPs treatment of cells in order to allow enough time for the cells to attach properly to the plate (wells) and to attain the optimum growing conditions. Subsequently, the viability test was performed 24 h after RE-NPs addition, or 48 h after the initial cell cultures were placed in the wells. As we did not observe any cell reduction, but on the contrary cell-overgrowth, especially with the SW620 cell line at 5 mM, the cell confluence quickly reached 80–90% of its initial value after 24 h of the addition of RE-NPs or 48 h from the initial plating.
Five microliters of WST solution was added to each well and the plate was incubated for 1 h during the growth state. The absorbance at 450 nm of each well was measured using a microplate reader (Biorad, x Mark). Each experimental point for each cell line and each RE suspension was extracted from two samples and triplicated every 2 days (total of 108 samples).
F test was used for every set of cell viability measurements. Here, the “null hypothesis” was that the relative to the CTRL “mean viability value was the same at different concentrations within the same cell line”. With this null hypothesis, an unknown law connecting tumour cell viability and RE-NPs concentration was identified. p value (probability the null hypothesis to be rejected) was also tested from the F distribution Additional file 1.
Western Blotting and Antibodies
Total proteins were extracted with 60 μL of radioimmunoprecipitation assay (RIPA) lysis buffer (20 mM Tris-HCl (pH 7.5); 150 mM NaCl, 1 mM Na2EDTA; 1 mM EGTA; 1% NP-40; 1% sodium deoxycholate; 2.5 mM sodium pyrophosphate; supplemented with proteases inhibitors 1 mM β-glycerophosphate; 1 mM Na3VO4 1 μg/ml; leupeptin) and the Wb assay was performed according to standard protocols (Fig. 9b). Briefly, total proteins (50 μg) were separated by SDS-polyacrylamide gel electrophoresis (SDS-PAGE) and transferred to nitrocellulose membrane. Blots were incubated overnight at 4 °C with appropriate primary antibodies. The antibodies used were tubulin code sc-8035, from Santa Cruz (final concentration 1:1000 in blocking buffer); p-ERK (E-4) code sc-7383, from Santa Cruz (final concentration 1:500 in blocking buffer); and p-AKT (Thr308) code 9275S, from Cell Signaling (final concentration 1:1000 in blocking buffer).
Wb bands are collected from different blots showing quality control of antibodies specificity. Numbers at the top of the phosphorylation images show grey scale levels from 0 (black) to 168 (grey) (maximum value ), indicating activation at a non-saturated mode.
缩写
- 2D-FFT:
-
Two-dimensional fast Fourier transform
- ADMIDAS:
-
Adjacent MIDAS
- 原子力显微镜:
-
原子力显微镜
- AKT:
-
Protein kinase B
- CTRL:
-
Control cells
- DLS:
-
动态光散射
- DMEM:
-
Dulbecco改良Eagle培养基
- ECM:
-
Cell-extracellular matrix
- EGFR:
-
Epidermal growth factor receptors
- ERK:
-
Extracellular signal-regulated kinase
- F.A.:
-
Feret angle
- F.D.:
-
Feret area diameters
- FBS:
-
胎牛血清
- LABS:
-
Ligand adhesion binding site
- MEAC:
-
Mean equal area circle
- MHR:
-
Mean hydrodynamic radius
- MIDAS:
-
Metal ion-dependent adhesion sites
- NGFR:
-
Nerve growth factor receptor
- NP:
-
纳米粒子
- RE-NPs:
-
Rare-earth nanoparticles
- RIPA:
-
Radioimmunoprecipitation assay
- RMS:
-
均方根
- RPMI:
-
Roswell Park Memorial Institute medium
- SDS-PAGE:
-
Sodium dodecyl sulfate-polyacrylamide gel electrophoresis
- SyMBS:
-
Synergistic metal ion binding sites
- TEM:
-
透射电子显微镜
- TSR:
-
Transmembrane signal receptors
- VEGFR:
-
Vascular endothelial growth factor
- VUV:
-
Vacuum ultraviolet
- Wb:
-
Western blot assays
- WST:
-
Water-soluble tetrazolium salts
- XRD:
-
X射线衍射
纳米材料
- 关于半导体纳米粒子
- 生物相容性 FePO4 纳米颗粒:药物递送、RNA 稳定和功能活性
- Au 纳米颗粒对 HT29 和 SPEV 细胞系影响的体外研究
- 改性超支化聚甘油作为分散剂,用于控制和稳定碳氢化合物中的金纳米粒子
- 用 6-巯基嘌呤和神经元穿透肽修饰的金纳米颗粒促进 SH-SY5Y 细胞生长
- 磁赤铁矿纳米颗粒作为纳米酶,改善甘蓝型油菜的生长和非生物胁迫耐受性
- 用于细胞成像的近红外发射 Cr3+/Eu3+ 共掺杂锌镓锗酸盐持久性发光纳米颗粒
- 用银纳米粒子作为抗菌剂装饰的基于氧化石墨烯的纳米复合材料
- 圆形金纳米粒子:粒径和浓度对拟南芥根系生长的影响
- 通过反应射频 (RF) 热等离子体原位合成双金属钨铜纳米粒子
- 聚(γ-谷氨酸)促进 Fe-Pd 纳米颗粒对对氯苯酚的增强脱氯
- 石胆酸修饰的金纳米粒子对肝癌细胞的凋亡作用