

PdO 纳米颗粒修饰的棒状纳米多孔 CeO2 用于 CO 氧化和甲烷燃烧,具有高催化活性和耐水性
摘要
通过将Al-Ce-Pd合金带的脱合金与煅烧相结合,制备了具有棒状纳米多孔骨架结构的PdO/CeO2复合材料。对于 CO 氧化和 CH4 燃烧,纳米多孔 PdO/CeO2 复合材料表现出优异的催化活性,CO 和 CH4 的完全反应温度分别为 80 °C 和 380 °C。此外,该复合材料具有优异的循环稳定性、CO2毒性和耐水性,在水蒸气(2×10 5 ppm)。一系列表征结果表明,催化活性的增强可归因于 PdO 纳米粒子的良好分散性、大比表面积、强氧化还原能力、PdO 与 CeO2 之间的相互作用以及 PdO 上更多的表面活性氧。表征和实验的结果还表明,脱合金和煅烧相结合制备的 PdO 纳米颗粒比 Pd 纳米颗粒具有更强的催化活性。最后,使用一个简单的模型来总结 PdO/CeO2 复合材料的催化机理。希望这项工作能够为高活性催化剂的开发提供见解。
背景
目前,越来越多的人开始关注环境问题,并着眼于减缓废气排放和全球变暖等几个重要的环境问题[1, 2]。特别是,消除有毒 CO 和温室气体 CH4 是大量研究的重点。在这些研究中,低温催化已被证明是消除这些污染气体的有效方法[3,4,5,6]。
虽然许多研究证明廉价金属及其金属氧化物(如过渡金属和氧化物,以及稀土金属和氧化物)可以作为CO氧化和CH4燃烧的催化剂,但不可否认的是,贵金属的使用通常会显着提高催化性能 [7, 8]。近年来,Pd 和 PdO 催化剂得到了广泛的研究,被认为是一些最有效的 CO 氧化和 CH4 燃烧催化剂。它们不仅在高温下表现出低挥发性,而且在低温下表现出高催化活性[9, 10]。
然而,从应用的角度来看,由于地球中贵金属的丰度相对较低,实际工业应用中普遍使用的Pd和PdO催化剂负载在金属氧化物、沸石、碳材料、金属有机骨架。这种配置也符合通过保护贵金属和利用载体-贵金属相互作用来提高催化活性来发展可持续催化的趋势[11, 12]。在载体类型中,CeO2 被认为是一种很有前途的载体,因为它具有很强的氧储存/释放性能和优异的热稳定性。例如,麦克拉克兰等人。使用初湿浸渍和表面辅助还原的组合来制备纳米结构的 PdO/CeO2 复合材料,该复合材料在煅烧后作为甲烷燃烧的催化剂表现出良好的活性 [13]。罗等人。报道了溶液燃烧法制备PdO-CeO2催化剂,证明PdO和CeO2的协同作用是催化活性增强的原因[14]。
尽管取得了许多良好的成果,但仍存在一些挑战。例如,许多有机化学品或表面活性剂可能会污染纳米材料,导致催化活性不足,这在湿化学中很常见[15]。此外,基于液体前驱体老化法制备催化剂工艺复杂,收率低[16]。因此,开发无污染、高产率、高催化活性的材料仍然是一个挑战。
在这项工作中,我们开发了一种通过对 Al-Ce-Pd 合金带进行脱合金然后煅烧来制备 PdO/CeO2 复合材料的方法。制备方法简单,材料结构易于控制,不需要有机试剂[17, 18],特别适合大规模工业化生产和可持续发展的未来[19, 20]。然而,据我们所知,目前还没有关于使用脱合金制备甲烷燃烧催化剂的文献报道。因此,希望这项工作能够为纳米材料的合成和制备提供见解和帮助。
方法
材料
所有化学品和金属均按分析纯原样使用,无需进一步纯化。纯Al(99.90 wt%)、纯Ce(99.90 wt%)和纯Pd(99.90 wt%)来自中铂金属有限公司。颗粒NaOH(AR)来自上海阿拉丁生化科技有限公司. 高纯氩气来自西安嘉禾有限公司
PdO/CeO2 复合材料的合成
Al92-X Ce8PdX (X =0、0.1、0.3、0.5、0.7、0.9 和 1.1) 前体合金是通过在氩气气氛下电弧熔化纯 Al、纯 Ce 和纯 Pd 制备的。获得的Al-Ce-Pd前驱体合金在氩气保护下在石英管中通过高频感应加热重新熔化。将熔融合金用氩气吹到高速旋转的铜辊上进行快速凝固,得到宽度约3~4 mm、厚度约20~30 μm的Al-Ce-Pd合金薄带。
将制备好的Al-Ce-Pd合金带置于20 wt%氢氧化钠溶液中,在室温下脱合金2 h,然后加热到80 ℃,脱合金10 h。脱合金样品用去离子水反复冲洗并在室温下在空气中干燥。干燥后的样品在O2中在200~600 °C下煅烧2 h,O2的流速为18 mL min -1 . PdO/CeO2复合材料的制备方法和结构演变如图1所示。
<图片>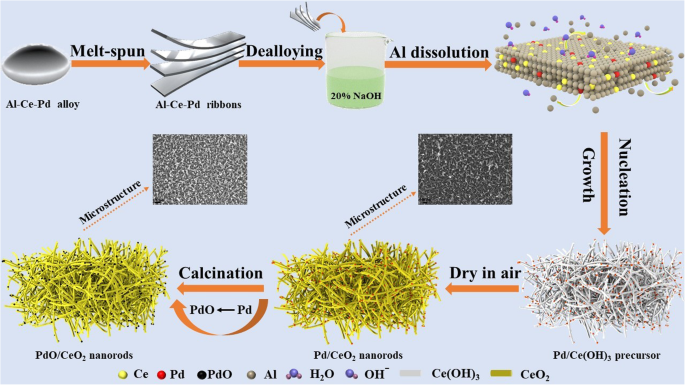
棒状纳米多孔PdO/CeO2复合材料的制备示意图
样本表征
X 射线衍射 (XRD) 图案是使用 Shimadzu XRD-6100 衍射仪以 Cu Kα 辐射(20 kV 和 40 mA)获得的。样品的形态和元素组成是从 JSM-7000F 扫描电子显微镜 (SEM) 和 INCA X-Sight 牛津能谱仪 (EDS) 获得的。透射电子显微镜 (TEM) 图像、高分辨率透射电子显微镜 (HRTEM) 图像和扫描透射电子显微镜图像与能量色散 X 射线光谱 (STEM-EDX) 结合在 JEOL JEM-200 电子显微镜上记录。比表面积(S BET)、孔径 (D p) 和孔体积 (V 样品的 p) 用 Micromeritics ASAP 2020 仪器在 77.4 K 下测定。X 射线光电子能谱 (XPS) 分析用多功能光谱仪型号 Axis Ultra Kratos 进行。氢气程序升温还原 (H2-TPR) 在 Quantachrome Autosorb-iQC-TPX 上进行,其中将 50-mg 样品以 10 °C/min 的升温速率从 50 加热到 800 °C,在 10 vol 中% H2/Ar 混合气体以 40 mL min -1 的速度流动 .
催化剂测试
通过CO氧化和CH4燃烧评估样品的催化活性。将催化剂(100 mg)装入不锈钢管式反应器中,反应器置于管式炉中,温度控制精确。由 1 vol% CO、10 vol% O2 和 89 vol% N2 或 1 vol% CH4、10 vol% O2 和 89 vol% N2 组成的进料气以 50 mL 的总流速引入反应器min −1 (空间速度 =30000 h −1 ),反应气体的流速由质量流量计(Brooks 5850E)控制和调节。有关使用 20 vol% H2O 制备原料气的详细信息,请参见附加文件 1:图 S1。加热过程中的 CO 和 CH4 浓度通过配备火焰离子化检测器 (FID) 的 Agilent GC-7890B 气相色谱仪进行在线分析。 CO 和 CH4 的转化率按公式计算。 (1):
$$ X=\frac{C_{\mathrm{in}}-{C}_{\mathrm{out}}}{C_{\mathrm{in}}}\times 100\% $$ (1)其中 X 代表 CO 或 CH4 的转化,C in 代表 CO 或 CH4 的入口浓度,C out表示CO或CH4的出口浓度。
CO 和 CH4 的反应速率使用方程式计算。 (2) [14, 21]:
$$ {r}_{\mathrm{CO}/{\mathrm{CH}}_4}=\frac{C_{\mathrm{CO}/{\mathrm{CH}}_4}\cdot {X}_{ \mathrm{CO}/{\mathrm{CH}}_4}\cdot P\cdot V}{m_{\mathrm{cat}}\cdot {W}_{\mathrm{Pd}}\cdot R\cdot T }\left(\mathrm{mol}\cdot {\mathrm{s}}^{-1}\cdot {\mathrm{g}}_{\mathrm{Pd}}^{-1}\right) $$ (2)其中 r CO/CH4代表CO或CH4的反应速率; CO或CH4的浓度表示为C 原料气中的CO/CH4; CO或CH4的转化率表示为X CO/CH4; P 是大气压力,即 101.3 KPa; V 是总流量; 米 cat 是反应器中催化剂的质量; W Pd 是 Pd 的负载量; R 是摩尔气体常数,即 8.314 Pa m 3 mol −1 K −1 ;和 T 是环境温度 (293 K)。
结果与讨论
催化剂表征
样品的 XRD 谱如图 2 所示。检测到一组清晰的 CeO2 (JCPDS NO.34-0394) 衍射峰,如图 2a 所示,但未检测到与 Pd 相关的衍射峰所有在 400 °C 下煅烧的脱合金样品。脱合金的 Al91.3Ce8Pd0.7 合金在不同温度下煅烧,如图 2b 所示。随着温度的逐渐升高,CeO2的衍射峰逐渐变尖变窄;然而,即使在 800 °C 煅烧后,也无法检测到与 Pd 相关的衍射峰。该结果可能是由于样品中 Pd 的浓度相对较低,Pd 可能以非晶相或小晶粒的形式高度分散在样品中。在任何样品的 XRD 谱中均未观察到与 Al 相关的衍射峰,表明脱合金后样品中残留的 Al 含量非常低或 Al 以非晶形式存在。
<图片>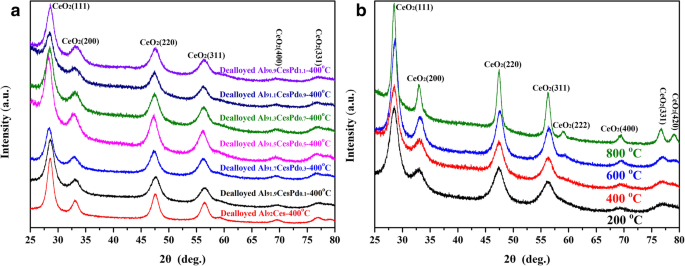
Al92-X的XRD图谱 Ce8PdX (X =0.1、0.3、0.5、0.7、0.9 和 1.1) 在 400 °C (a ) 和在不同温度下煅烧的脱合金 Al91.3Ce8Pd0.7 合金的 XRD 图 (b )
在 400 °C 下煅烧的脱合金 Al91.3Ce8Pd0.7 的 EDS 结果和显微组织如图 3 所示。脱合金后,样品中的 Ce 和 Pd 含量非常接近前驱体合金中的含量,如图 3 所示。图 3a,表明在脱合金过程中 Ce 和 Pd 的损失很小。在 400 °C 煅烧的脱合金 Al91.3Ce8Pd0.7 合金中残留的 Al 非常低,仅为 2.73%,这与 XRD 结果一致。图3b和c为样品的表面SEM图像,样品呈现出由无数直径约10 nm的纳米棒组成的均匀、无序、编织的多孔结构;纳米棒相互堆叠,形成几个微孔和中孔。样品的横截面SEM图像如图3d所示,纳米棒相互连接形成三维骨架结构,通过大接触面积促进纳米颗粒的稳定,从而产生更多的纳米级相互作用接口。
<图片>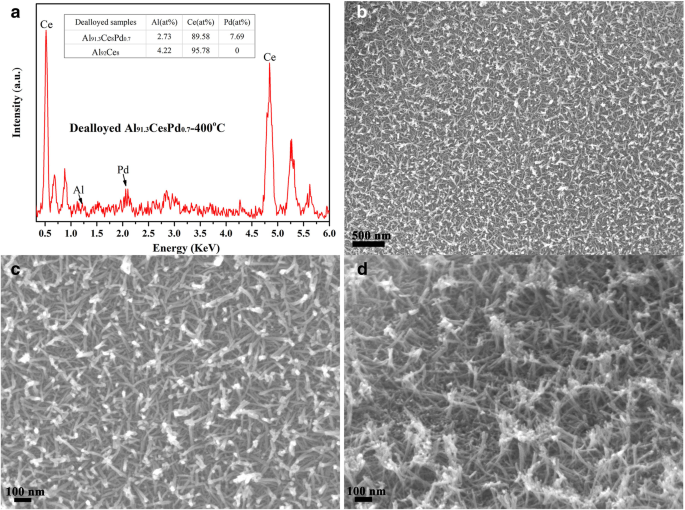
EDS 模式 (a ), 表面 SEM 图像 (b , c ) 和横截面 SEM 图像 (d )在400 °C下煅烧的脱合金Al91.3Ce8Pd0.7合金
TEM 图像和 TEM-EDX 映射进一步用于表征样品的结构和颗粒分布,如图 4 所示。在 400 °C 下煅烧的脱合金 Al91.3Ce8Pd0.7 由许多纳米棒组成,如图 4 所示。如图 4a 所示,纳米棒相互堆叠形成许多微孔和中孔,这与 SEM 结果一致。纳米棒表面分布着几个较暗的颗粒,如图 4a 中的红色框所示。图 4b 显示了样品的 HRTEM 图像。纳米棒的晶格间距值大约为 0.314 nm 和 0.193 nm,分别对应于 CeO2 的(111)和(220)面。图 4b 中的红色框是图 4a 中较暗颗粒的 HRTEM 图像,其直径约为 5 nm,分布在 CeO2 纳米棒的表面。然而,较暗的粒子(0.201 nm)的晶格间距值与CeO2(0.193 nm)的(220)面的晶格间距值相似,难以区分。进行 TEM-EDX 映射表征以识别这些颗粒。如图所示。如图4c和d所示,分布在CeO2纳米棒上的颗粒与Pd有关,考虑到0.201 nm的晶格间距值,较暗的颗粒被确定为均匀分散在CeO2纳米棒表面的PdO纳米颗粒(图4d) ),形成多个粗糙的界面。
<图片>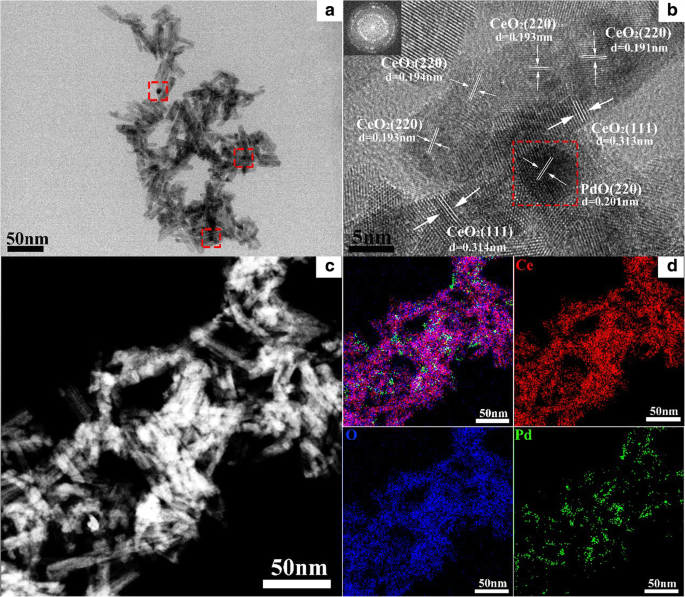
透射电镜 (a ), HRTEM (b ) 和 TEM-EDS 映射 (c , d ) 在 400 °C 下煅烧的脱合金 Al91.3Ce8Pd0.7 合金的图像
在不同温度下煅烧的脱合金 Al91.3Ce8Pd0.7 进行 BET 和 BJH 测试,相应的结果如图 5 和表 1 所示。所有样品均表现出具有 H2 和 H3 滞后回线的 IV 型等温线,如图所示图 5a。该结果表明样品为介孔结构,与SEM和TEM结果一致。此外,图5b所示的孔径分布曲线进一步证明所有样品都具有介孔结构,煅烧样品表现出同样窄的孔径分布,平均孔径约为12~14 nm。比表面积(S BET)、孔径 (D p) 和孔体积 (V p) 在相应煅烧温度下的样品列于表 1 中。 400 °C 煅烧的样品表现出最大的比表面积和最大的孔体积,约为 102 m 2 g −1 和 0.362 cm 3 g −1 , 分别。随着煅烧温度的不断升高,比表面积略有下降;然而,即使在 600 °C 煅烧后,样品的比表面积仍为 84 m 2 g −1 .这些结果表明棒状纳米多孔 CeO2 骨架结构具有优异的抗烧结能力。附加文件 1:表 S1 中的晶体尺寸和附加文件 1:图 S2 中的 SEM 和 TEM 图像也验证了该结论。
<图片>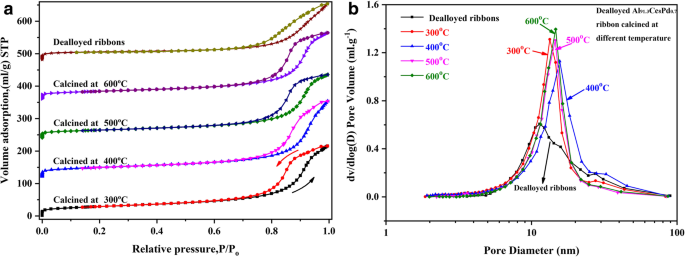
氮吸附-解吸等温线(a ) 和孔径分布曲线 (b )不同温度煅烧的脱合金Al91.3Ce8Pd0.7带
脱合金 Al91.3Ce8Pd0.7 样品和煅烧脱合金 Al91.3Ce8Pd0.7 样品的 XPS 光谱如图 6 所示,以进一步表征样品表面元素的价组成。 Ce 3d的XPS光谱如图6a所示,其中U代表Ce 4+ V代表Ce 3+ [22]。一般情况下,Ce 3+ 的存在 与氧空位密切相关。计算结果表明,Ce 3+ 脱合金 Al91.3Ce8Pd0.7 样品和煅烧脱合金 Al91.3Ce8Pd0.7 样品分别为 21.15% 和 23.33%,差异不大,如表 2 所示。该结果表明煅烧几乎不影响表面氧空位。为了了解 PdO 负载对样品氧空位浓度的影响,在 400 °C(纯 CeO2)下煅烧的脱合金 Al92Ce8 样品的 XPS 光谱显示在附加文件 1:图 S3 中。 Ce 3+ 经计算,浓度约为 14.27%,远低于负载 PdO 的样品。这一现象表明PdO和CeO2之间存在相互作用,PdO的存在可以改变CeO2表面元素的价态,增加表面氧空位的浓度。
<图片>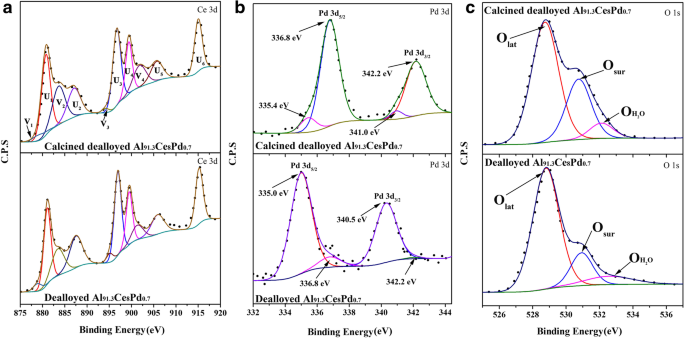
Ce 3d (a ), Pd 3d (b ) 和 O 1s (c ) 脱合金 Al91.3Ce8Pd0.7 样品和脱合金 Al91.3Ce8Pd0.7 样品在 400 °C 下煅烧的区域
为了进一步研究煅烧对表面 PdO 纳米颗粒的影响,脱合金 Al91.3Ce8Pd0.7 样品和煅烧脱合金 Al91.3Ce8Pd0.7 样品的 Pd 3d XPS 光谱如图 6b 所示。煅烧后的脱合金Al91.3Ce8Pd0.7薄带中有两种形式的Pd; 336.8 eV 和 342.2 eV 处的强峰可归因于 PdO (Pd 2+ ) [23],在 335.4 eV 和 341.0 eV 处的弱峰可归因于金属 Pd (Pd 0 ) [24]。表 2 表明 Pd 2+ 和 Pd 0 分别约为 91.25% 和 8.75%。而脱合金Al91.3Ce8Pd0.7样品的分析结果则相反,Pd 2+ 和 Pd 0 分别约为 6.45% 和 93.55%。这一发现表明Pd在脱合金样品中以金属Pd的形式存在,而煅烧后Pd被氧化成PdO并均匀分散在CeO2表面,这与HRTEM图像的结果一致。
众所周知,表面活性氧(Osur)通常是催化反应的活性氧物质。图 6c 显示了两种催化剂的 O 1s XPS 光谱。对于煅烧的脱合金 Al91.3Ce8Pd0.7 样品,528.9 eV、530.6 eV 和 532.1 eV 的峰值分别对应于晶格氧 (Olat)、表面活性氧 (Osur) 和弱吸附 H2O (OH25O) , 26]。计算出 Osur 的比率 (Osur/(Olat + Osur + OH2O)) 并列于表 2 中。脱合金 Al91.3Ce8Pd0.7 样品和煅烧脱合金 Al91.3Ce8Pd0.7 样品的 Osur 比率约为 16.2 % 和 29.3%,分别表明在煅烧的脱合金 Al91.3Ce8Pd0.7 样品中存在更多的表面活性氧物质。 Ce 3+ 的浓度 这两种催化剂中的 相似(图 6a),表明 PdO 比金属 Pd 纳米粒子具有更强的吸附和活化 O2 的能力。为了消除热活化对实验结果的干扰,设计了单独的实验(附加文件1),如附加文件1:图S4所示,所得结果也支持上述结论。
为比较煅烧前后样品还原性的差异,采用H2-TPR对煅烧后的脱合金Al91.3Ce8Pd0.7样品和脱合金Al91.3Ce8Pd0.7样品进行测试,结果如图4所示。 7. 两条TPR曲线有3个主峰,但强度和位置不同。在高温范围 (> 300 °C) 中的两组峰 P2, P2' 和 P3, P3' 分别归因于表面 CeO2 和本体 CeO2 的还原 [27],而 P1 和 P1 ' 在低温范围 (<300 °C) 的峰值归因于 PdO 物种和 Pd 2+ -O-Ce 4+ 结构 [28]。 P1 峰的面积明显大于 P1' 峰的面积,说明煅烧后的脱合金样品含有更多的 PdO 物种,这与 XPS 的结果一致。 P1峰面积大于P1'峰的事实也表明对于煅烧脱合金样品,更多的Ce 4+ 与 PdO 物种连接的离子可以在低温下被还原,这有利于催化氧化反应。位于 470 °C 附近的 P2 和 P2' 峰也证明了这一猜想。 P2'峰的面积明显大于P2峰的面积,说明对于煅烧脱合金样品,只能在高温下还原的表面CeO2物种浓度低于脱合金样品;换句话说,Ce 4+ 的一部分 连接到 PdO 的离子在低温下被还原。结合XPS分析,PdO/CeO2复合材料的氧化还原能力高于Pd/CeO2,表明PdO/CeO2复合材料表现出更高的催化性能。
<图片>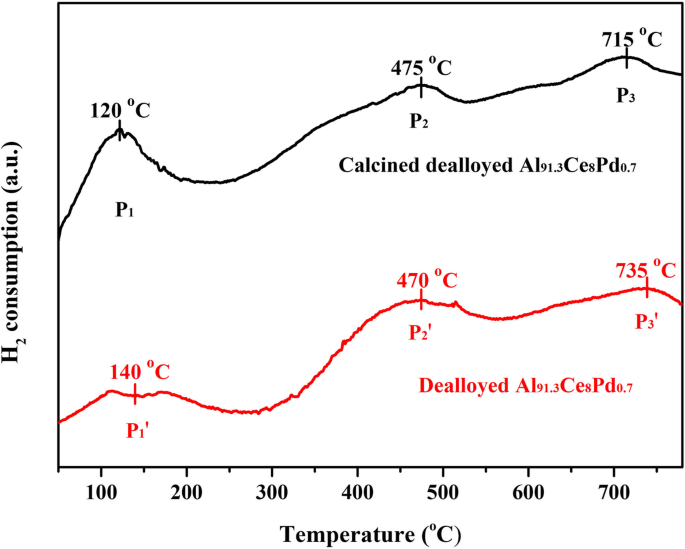
脱合金Al91.3Ce8Pd0.7带和400 ℃煅烧Al91.3Ce8Pd0.7带的H2-TPR曲线
基于上述表征结果,提出了 PdO/CeO2 复合材料的可能形成机制(图 1)。首先,在NaOH溶液中,Al溶解,Ce与OH − 反应 由于 Ce(OH)3 生长的各向异性,在 80 °C 下形成棒状纳米多孔 Ce(OH)3 骨架结构。同时,Pd 原子扩散到 Ce(OH)3 纳米棒的表面。由于Ce(OH)3极不稳定,在空气中干燥时容易脱水氧化成CeO2。在 O2 下煅烧后,CeO2 纳米棒表面的大部分 Pd 纳米粒子被氧化形成 PdO(图 6b),并在高温下部分嵌入 CeO2 纳米棒(图 4)中以产生强金属-氧化物-载体相互作用。结果形成了PdO/CeO2复合材料。
催化活性测试
前驱体中 Pd 的含量与催化剂催化活性的关系见图 1。 8 a 和 b。如图 8a 所示,CeO2 纳米棒对 CO 的氧化表现出较差的催化活性(插图),并且 T 99(转化率为99%时对应的反应温度)高达280 ℃。由于负载 PdO,CO 氧化的催化活性显着提高。脱合金Al91.3Ce8Pd0.7样品表现出最好的CO催化活性,T 50(转化率为50%时对应的反应温度)和T 99 个分别为 15 °C 和 80 °C。起燃温度也低于- 20 °C。然而,当前驱体中Pd含量进一步增加时,催化活性略有降低。图 8b 显示了由不同 Pd 含量的前驱体产生的催化剂对 CH4 燃烧的催化活性 与 CO 氧化类似,纯 CeO2 纳米棒对 CH4 燃烧的催化活性很差,并且在 600 °C 下的转化率仅为 65%。添加PdO后,催化活性大大提高。同样,脱合金的 Al91.3Ce8Pd0.7 样品对 CH4 燃烧表现出最好的催化活性,起燃温度约为 250 °C,T 50 和 T 99 个分别为 305 °C 和 380 °C。
<图片>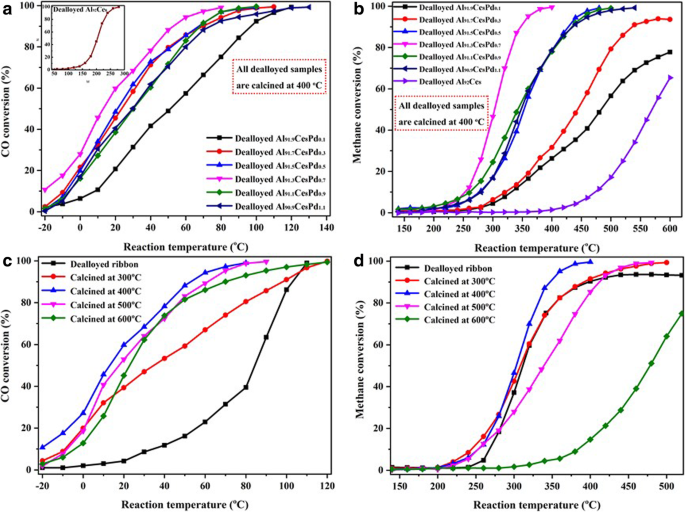
CO 转化率 (a ) 和 CH4 转换 (b ) 作为在 400 °C 下煅烧的具有不同 Pd 含量的脱合金 Al90Ce10 带和脱合金 Al-Ce-Pd 带的反应温度的函数。 CO 转化率 (c ) 和 CH4 转换 (d ) 作为在不同温度下煅烧的脱合金 Al91.3Ce8Pd0.7 的反应温度的函数
在不同温度下煅烧的脱合金 Al91.3Ce8Pd0.7 带上,作为反应温度函数的 CO 和 CH4 转化率如图 8c 和 d 所示。与煅烧样品相比,脱合金带(未煅烧)表现出较差的 CO 催化活性,如图 8c 所示。结合 XPS 分析,这些结果表明负载在 CeO2 纳米棒上的 PdO 表现出比 Pd 更好的 CO 催化活性,这与 H2-TPR 分析一致。在400 °C以下,对CO的催化活性随着煅烧温度的升高而逐渐增加;然而,当在高于 400 °C 的温度下煅烧时,对 CO 的催化活性随着煅烧温度的升高而降低。对于 CH4 燃烧,类似地,在 400 °C 下煅烧的样品表现出最好的催化活性,如图 8d 所示。然而,脱合金带表现出起燃温度和 T 50 与煅烧样品相似,CH4 的转化率始终低于 93%。根据脱合金薄带和煅烧脱合金薄带在不同O2气氛下的催化活性的实验结果和分析(附加文件1:图S5),造成这种现象的原因可能是CH4的起燃温度高(> 240 °C),部分 Pd 已被氧化成 PdO;因此,样品表现出良好的 CH4 催化活性。然而,由于复合材料不是在纯 O2 气氛中煅烧,氧化不够到不能完全转化 CH4 的程度。对于在不同温度下煅烧的脱合金Al91.3Ce8Pd0.7,对CH4的催化活性顺序如下:脱合金样品(未煅烧)<600 °C煅烧<500 °C煅烧<300 °C煅烧<煅烧在 400 °C。实验结果表明,煅烧温度对样品的催化活性有重要影响。
还对在 400 °C 下煅烧的脱合金 Al91.3Ce8Pd0.7 带材进行了循环稳定性测试,如图 3 和图 5 所示。 9a 和 b。无论是CO的氧化还是CH4的燃烧,结果表明这三个连续的活性测试都可以获得相似的曲线,并且催化剂稳定且未失活。该结果表明脱合金Al91.3Ce8Pd0.7带在400 ℃下煅烧得到的催化剂具有实际应用价值,可多次重复使用。
<图片>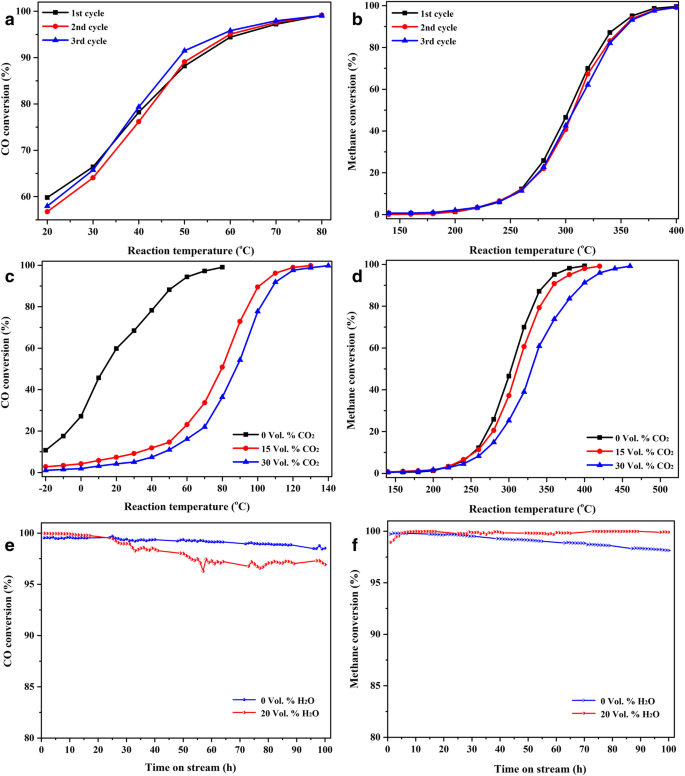
循环稳定性测试 (a , b ),抗 CO2 毒性测试 (c , d ) 和防水测试 (e , f ) 在 400 °C 下煅烧的脱合金 Al91.3Ce8Pd0.7 带
一般来说,具有实际应用价值的催化剂,必须在CO2和H2O存在下稳定。将含有 CO2 或 H2O 的反应气体通过催化剂,以检查在 400 °C 下煅烧的脱合金 Al91.3Ce8Pd0.7 带的 CO2 和 H2O 耐受性,如图 1 和图 3 所示。 9c-f。与反应气体中不存在 CO2 时的响应相比,添加 15 vol% CO2 降低了催化剂对 CO 氧化的活性,如图 9c 所示,具有 T 50 和 T 分别为 80 °C 和 130 °C 中的 99。然而,当 CO2 进一步增加到 30 vol% 时,催化剂对 CO 氧化的活性仅略有降低,T 50 和 T 99 分别是 88 °C 和 140 °C。对于甲烷燃烧,反应气中 15 vol% CO2 的存在对催化活性影响不大,T 50 和 T 与不存在 CO2 的情况相比,99 分别仅增加了 5 °C 和 30 °C,如图 9d 所示。当 CO2 浓度增加一倍(30 vol% CO2)时,催化活性继续降低,T 50 和 T 分别为 350 °C 和 460 °C 中的 99。因此,在反应物浓度恒定的情况下,增加 CO2 产物的浓度将与 CO 和 CH4 形成强烈的竞争关系,以吸附在 PdO 纳米颗粒上及其界面,从而减少单位吸附的 CO 或 CH4 量时间,因此,转换率。 However, due to the higher reaction temperature required for methane combustion, the desorption of CO2 is enhanced such that the CO2 effect on methane combustion seems to be weaker than the effect on CO oxidation.
The long-term stability and water resistance tests of the catalyst are shown in Figs. 9e and f. For CO oxidation, the catalytic activity hardly decreases after 100 h of testing, regardless of the presence or absence of a high concentration of water vapour (20 vol%), indicating that the catalyst has excellent long-term stability and water resistance for CO oxidation. For methane combustion at high conversion (99%), the catalyst possesses similar properties with respect to CO oxidation. At the same time, the effect of water vapour on methane combustion at low conversion (30%, 50%, and 85%) is also discussed in Additional file 1:Figure S6. The effect of water vapour on the catalytic activity at low conversion is greater than that at high conversion. Detailed descriptions and discussions are presented in Additional file 1:Figure S6. The conclusions obtained are similar to those reported by Burch et al. [29]。 By comparison with the water resistance of some recently reported Pd-based catalysts for methane combustion (Additional file 1:Table S2), the PdO/CeO2 catalyst prepared in this study retains a relatively excellent catalytic activity after a higher water vapour concentration (20 vol%) and a longer reaction time (100 h), which is very helpful to further the practical application of methane combustion.
The flow rate of the reaction gas and the concentration of O2 are known to have an important influence on the catalytic activity of a catalyst. Here, the effect of the flow rate on the catalytic performance of the dealloyed Al91.3Ce8Pd0.7 ribbons calcined at 400 °C was first studied, as shown in Figs. 10a and b. As shown in Fig. 10a, for CO oxidation, when the total flow rate was increased from 20 mL min −1 (space velocity 12,000 h −1 ) to 100 mL min −1 (space velocity 60,000 h −1 ), the conversion of CO gradually decreased from the initial 78 to 31%. However, it is worth noting that although the conversion of CO decreased with increasing flow rate, the reaction rate (r CO) gradually increased. This phenomenon was caused by a decrease in the contact time of the gases with the active sites when the gas flow rate was increased, causing a decrease in the conversion; however, the actual amount of the reactant flowing over the active sites per unit time was increased, thereby resulting in the increased reaction rate. A similar phenomenon was observed for methane combustion. However, it appears that the flow rate had a slightly smaller effect on the conversion of CH4 than on the conversion of CO. As the flow rate increased from 20 to 100 mL min −1 , the conversion of methane decreased from an initial value of 84 to 53%. Moreover, the reaction rate of methane combustion (r CH4) exhibited a linear increase with the flow rate, rather than tending to remain stable, similar to that seen for r CO. This indicates that the catalyst has a wider flow rate range for methane combustion than for CO oxidation. In this study, the calculated values of r CO and r CH4 under different test conditions were in the range of 1.40~2.87 \( \left(\times {10}^{-5}\mathrm{mol}\cdotp {\mathrm{g}}_{\mathrm{Pd}}^{-1}\cdotp {\mathrm{s}}^{-1}\right) \)and 1.51~4.70 \( \left(\times {10}^{-5}\mathrm{mol}\cdotp {\mathrm{g}}_{\mathrm{Pd}}^{-1}\cdotp {\mathrm{s}}^{-1}\right) \), respectively.

Catalytic activity and reaction rate of the dealloyed Al91.3Ce8Pd0.7 ribbons calcined at 400 °C for CO oxidation with different flow rates at 20 °C (a ) and for methane combustion with different flow rates at 320 °C (b ) (reaction gas 1 vol% CO/CH4, 10 vol% O2, and 89% vol% N2.). The catalytic activity of the dealloyed Al91.3Ce8Pd0.7 ribbons calcined at 400 °C for CO oxidation in the presence of different O2 concentrations at 80 °C (c ) and for methane combustion in the presence of different O2 concentrations at 380 °C (d )
Next, the effect of the O2 concentration in the reaction gas on the catalytic activity of the catalyst was investigated. For CO oxidation, as shown in Fig. 10c, when under oxygen-rich conditions (10 vol% O2), the CO conversion was maintained at 99%, and as the O2 concentration suddenly decreased to 0 (anaerobic conditions), the CO conversion decreased rapidly before eventually stabilizing at approximately 12%. The reason for this phenomenon was that the surface lattice oxygen participated in the oxidation reaction of CO. Generally, the CO oxidation pathway involving lattice oxygen on the surface of the support is slow and inefficient compared to the direct adsorption activation of the O2 molecule [30]. Therefore, the CO conversion remained at a lower level under the anaerobic conditions in this study. This result also indicated that the CeO2 carrier has a strong ability to store/release oxygen. Subsequently, 0.5% O2 was introduced into the reaction gas, and the CO conversion rapidly recovered to 90%. As the O2 concentration continues to increase, the CO conversion eventually reached the initial 99%, and a new steady state was established. For methane combustion (Fig. 10d), a similar result to that of CO oxidation was observed but with two different points. The first point was that when in an anaerobic environment, the conversion of CH4 finally stabilized at 25%, higher than that of the anaerobic conversion of CO, which indicated that a high reaction temperature could accelerate the migration of surface lattice oxygen thereby improving the conversion efficiency. The second point was that as the O2 concentration increased, the increasing rate of CH4 conversion and the final establishment of a steady state were slower than those in the CO conversion, which may be due to the incomplete combustion of methane under oxygen-poor conditions (0.5~2 vol% O2). This result also shows that methane combustion is a more complicated and difficult reaction compared to CO oxidation.
Based on the results of the characterization and experiments, a simple mechanism for CO oxidation and methane combustion is proposed, as shown in Fig. 11.

Schematic illustration of CO oxidation and methane combustion over the rod-like nanoporous PdO/CeO2 catalysts
First, the CO and CH4 molecules in the reaction gas are adsorbed onto the surface of PdO, reacting rapidly with the adsorbed and activated oxygen on the surface of PdO, and then CO2 and H2O are produced and desorbed. The active sites become available again, and a high reaction rate for CO oxidation and CH4 combustion is maintained. It is worth noting that the catalytic oxidation reaction can still proceed slowly under anaerobic conditions, which is shown to be related to the participation of the surface lattice oxygen of the nanorods in the catalytic reaction (Figs. 10c, d), as shown in Fig. 11.
A large number of experimental results indicated that the PdO/CeO2 catalyst prepared by dealloying combined with calcination exhibited excellent catalytic activities towards CO oxidation and methane combustion and possesses outstanding cycle stability, resistance to CO2 toxicity, and water resistance. In addition to its inherent simplicity, the “green” preparation method of dealloying can effectively avoid the contamination of nanomaterials by organic chemicals and other surfactants, which are common to wet chemical synthesis methods. In addition, the PdO/CeO2 catalyst prepared by dealloying combined with calcination exhibits excellent reproducibility, and the repeated experiments detailed in Additional file 1:Figures S7–S10, Tables S3 and S4 proved this point very well. Therefore, this work can provide insight into the preparation of other new catalysts.
结论
In summary, a simple method of dealloying an Al-Ce-Pd ribbon combined with calcination has been developed for the preparation of a PdO/CeO2 rod-like nanoporous composite. The experimental results indicate that the sample prepared by the dealloying of an Al91.3Ce8Pd0.7 ribbon in 20 wt% solution and then calcining at 400 °C showed the best catalytic activities towards CO oxidation and methane combustion, and the reaction temperatures for the complete conversions of CO and CH4 are 80 °C and 380 °C, respectively. The high catalytic activities could be attributed to the good dispersion of the PdO nanoparticles (having a large specific surface area of 102 m 2 g −1 ), a strong redox capacity, the interaction between PdO and CeO2, and more surface active oxygen on PdO. In addition, the catalyst also exhibited excellent cycle stability, resistance to CO2 toxicity, and water resistance, where after 100 h of testing, the catalytic activity hardly decreased in the presence of H2O. Furthermore, the catalytic reactions can occur even under anaerobic conditions. These results demonstrate the feasibility of the combined dealloying calcination method for the preparation of new catalysts. It is expected that the method can be applied to the preparation of similar composite materials.
数据和材料的可用性
The datasets supporting the conclusions of this article are included within the article.
缩写
- CH4 :
-
Methane
- CO:
-
一氧化碳
- D p :
-
Pore size
- EDS:
-
Energy dispersive spectrometer
- EDX:
-
Energy-dispersive X-ray spectra
- FID:
-
Flame ionization detector
- H2-TPR:
-
Hydrogen temperature-programmed reduction
- S BET :
-
Specific surface areas
- SEM:
-
扫描电子显微镜
- TEM:
-
透射电子显微镜
- V p :
-
Pore volume
- XPS:
-
X射线光电子能谱
- XRD:
-
X射线衍射
纳米材料
- 用于癌症治疗的纳米粒子:当前的进展和挑战
- Sb/坡缕石 (PAL) 纳米颗粒的制备和增强催化氢化活性
- 加载白藜芦醇的白蛋白纳米颗粒具有延长血液循环和改善生物相容性的高效靶向胰腺肿瘤治疗
- 改性超支化聚甘油作为分散剂,用于控制和稳定碳氢化合物中的金纳米粒子
- Ag 纳米颗粒/BiV1-xMoxO4 与增强的光催化活性的协同效应
- 用 6-巯基嘌呤和神经元穿透肽修饰的金纳米颗粒促进 SH-SY5Y 细胞生长
- 用 Au 纳米粒子定制的二氧化硅硅藻壳可以对用于生物、安全和环境应用的分子进行灵敏分析
- 纳米粒子和超声波控制的水过冷
- 氧化锌纳米粒子的特性及其对微生物的活性
- 使用极浓缩锌源在水/甘油中制备纳米级氧化锌的简便方法
- 具有疏水修饰的普鲁兰多糖纳米颗粒的米托蒽醌新型递送抑制膀胱癌细胞以及纳米药物大小对抑制效率的影响
- 纳米杂化物的材料、异质结构和取向对光催化活性的影响