

受表面电荷影响的基于支链淀粉的纳米粒子-HSA 复合物的形成和药物释放
摘要
纳米粒子的纳米材料组成及其在血液中的蛋白质吸附对载药纳米粒子的设计具有重要意义。为了探索纳米颗粒 (NPs) 不同表面成分与蛋白质之间的相互作用,我们合成了三种支链淀粉 NP 聚合物:胆甾型疏水 (CH) 改性支链淀粉 (CHP)、CH 改性的活性支链淀粉 (CHAP) 和 CH 改性的支链淀粉。羧化支链淀粉 (CHSP)。通过透析法制备普鲁兰多糖纳米粒。动态光散射用于确定三个 NPs 的电荷和大小。当聚合物含有相同程度的胆固醇取代时,NPs 的大小会因电荷基团的数量而改变。 CHAP、CHSP 和 CHP 的 zeta 电位分别为 + 12.9、- 15.4 和 - 0.698 mV,尺寸分别为 116.9、156.9 和 73.1 nm。采用等温滴定量热法测定具有不同表面电荷的纳米颗粒的热力学变化,研究人血清白蛋白(HSA)对滴定的影响。焓和熵的变化表明NPs和HSA之间存在相互作用;绑定常数 (K b) 对于 CHSP、CHP 和 CHAP 分别为 1.41、27.7 和 412 × 10 4 M −1 ,分别为 CHAP-HSA 带正电荷,CHP-HSA 不带电荷,CHSP-HSA 复合物带负电荷。荧光和圆二色光谱用于确定NPs与HSA复合后蛋白质结构的变化。 NP和HSA复合是一个复杂的过程,由蛋白质α-螺旋含量降低和肽链延伸组成; CHP NPs 的 HSA α-螺旋含量降低幅度最大。 48 小时后,NP 和 HSA 的所有化合物的药物释放速率均显着低于游离药物和载药 NP 的药物释放速率。分别在 CHSP-HSA 和 CHP-HSA 中观察到最高和最低的比率。 HSA对NPs的吸附显着影响药物释放,NPs的尺寸和表面电荷在该过程中起重要作用。
背景
纳米药物递送系统,例如负载小分子抗肿瘤药物的纳米颗粒(NPs),具有持续和受控的药物释放特性以及靶向作用。 NPs靶向治疗已成为治疗肿瘤的热点,因为它们可以显着降低药物的副作用,提高药效[1,2,3]。
载药纳米粒需要通过三种途径才能到达靶点,即血液循环、组织到细胞途径和细胞内运动[4,5,6]。它们还需要克服血管屏障才能到达目标组织,然后是细胞膜屏障才能到达目标细胞 [7, 8]。蛋白质吸附和交换涉及所有 NPs 的途径。最后,蛋白质吸附的纳米颗粒到达靶细胞并释放药物[1, 9]。
人血清白蛋白(HSA)、脂蛋白和球蛋白等高丰度蛋白质通常吸附在载药纳米颗粒的表面,从而改变纳米颗粒的体内释放行为和靶向位点[10]。吸附蛋白质的数量和类型与血浆中蛋白质的浓度和纳米颗粒的亲和力密切相关[11]。血浆蛋白浓度越大,NP 的表面吸附越大[12]。亲和性高的蛋白质可以代替亲和性弱的蛋白质[13]。因此,NP的表面被高浓度、强亲和力的蛋白质占据,形成纳米蛋白质冠[14]。纳米蛋白冠对于 NPs 的体内功能是必不可少的 [15]。例如,如果表面用聚山梨醇酯修饰,NPs 可以将药物通过血脑屏障输送到脑组织 [16];疏水改性多糖纳米材料可以与体内的HSA相互作用,从而增强对药物释放的控制[17]。
细胞对纳米颗粒的吸收受多种因素的影响,如纳米颗粒的理化性质、纳米药物浓度、蛋白质吸附和细胞粘附等[18]。蛋白质吸附的类型和数量影响 NPs 的功能,包括药物释放控制和靶向。同样,NPs 的物理和化学性质,如粒径、电荷和表面疏水性,会影响蛋白质的吸附 [19]。 NP 的性质决定了其在体内过程中的命运 [20]。疏水改性多糖聚合物等两亲性高分子材料可以自组装成纳米级颗粒。 NP的大小在其靶向和药物释放控制功能中起着重要作用[21]。聚合物中的疏水基团是形成NP核结构的驱动力。疏水基团的取代度越大,NP越小[22]。具有羧基、氨基及其衍生物的聚合物材料参与 NP 自组装,因此它们会影响 NP 的大小并提供表面电荷以方便地附着在具有相反电荷的蛋白质上 [23]。具有不同表面电荷的纳米颗粒具有不同的蛋白质吸附能力和不同的生物学功能[24]。因此,我们需要探索纳米颗粒表面不同成分与蛋白质之间的相互作用。
HSA 是血液中含量最丰富的蛋白质。它对于外来和内源性物质的运输、分配和代谢至关重要。许多小分子药物进入体内,在血液运输中形成HSA-药物吸附剂,从而改变药物的药理作用[25]。载药NPs进入体内后与HSA结合;由于NPs的复杂结构,吸附特性不同于小分子HSA组合[26]。例如,小分子药物对 HSA 分子的吸附很快;然而,HSA对NPs的吸附缓慢且复杂[27]。
CHP纳米粒子作为药物载体的研究已经进行了很长时间,已经显示出优异的纳米材料用于药物递送[28, 29]。在之前的实验中,我们研究了HSA与不同胆固醇取代度的支链淀粉NPs、胆甾型疏水(CH)改性支链淀粉(CHP)之间的相互作用,发现主要有两个过程:HSA快速附着在NP表面,然后缓慢插入NPs 的疏水核心 [30]。疏水相互作用在 CHP-HSA 复合物的形成中起主要作用 [31]。颗粒的疏水性和壳核结构是NP和HSA相互作用过程中白蛋白构象变化的主要原因[30]。
在这项研究中,我们制造了三个 NP,CHP、CH 改性的活性普鲁兰多糖 (CHAP) 和 CH 改性的羧化普鲁兰多糖 (CHSP)。它们的结构和性质通过傅里叶变换红外 (FTIR) 和核磁共振进行表征,它们的尺寸和电位通过动态光散射 (DLS) 确定。采用等温滴定量热法(ITC)和荧光光谱法研究了NP-HSA配合物的相互作用特征以及三种NPs对HSA结构的影响。我们揭示了NP-HSA复合物对药物释放的影响,这对药物递送系统的未来应用至关重要。
方法
材料
HSA 购自 Sigma Aldrich(美国密苏里州圣路易斯)。 N ,N -咪唑来自上海原液生物技术(上海)。乙二胺丁二酸酐由天津之星化学试剂(天津)提供。其他化学试剂均为分析纯,来自长沙汇诚有限公司(中国长沙)。
CHP、CHSP 和 CHAP 的合成
CHP的合成
胆固醇琥珀酸酯 (CHS) 的合成方法如前所述 [32]。将 2 g 支链淀粉多糖溶解在 10 mL 脱水二甲基亚砜 (DMSO) 溶液中。然后,将1.06 g CHS、0.505 g EDC•HCl和0.268 g DMAP溶解在适量的DMSO溶液中。将上述两组试剂混合并在室温下活化1小时,然后在50℃的加热油浴中温育48小时。反应停止,冷却至室温后,加入适量的无水乙醇,搅拌析出白色固体,反复抽滤得白色固体。产物用适量的无水乙醇、乙醚和四氢呋喃洗涤,然后在鼓风干燥机中50℃干燥成白色固体(图1)。
<图片>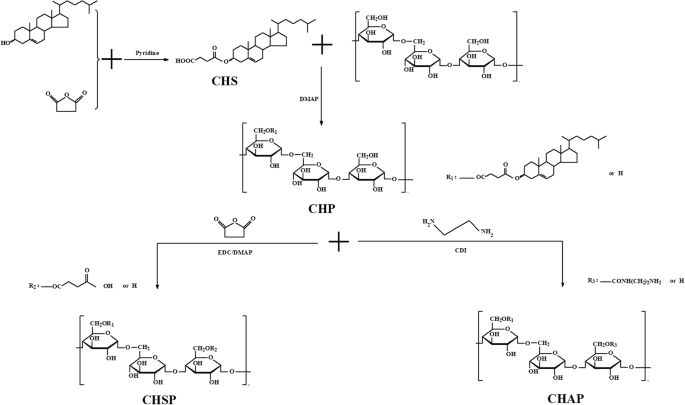
CHP、CHSP和CHAP聚合物的合成
CHAP的合成
1.80 克 CHP 和 1.00 克 N ,N -二咪唑溶解在100mL DMSO中。在50℃油浴中加热搅拌4h后,加入3.60g乙二胺,继续加热搅拌24h。待反应液冷却至室温后,在4000截留透析袋中用双蒸水透析1天,然后冻干得到淡黄色固体,为疏水改性活性支链淀粉产物。
CHSP的合成
将 1.80 g CHP 溶解在 100 mL 脱水 DMSO 中,然后将 0.5 g 琥珀酸酐和 0.05 g 4-二甲氨基吡啶 (DMAP) 溶解在 10 mL DMSO 中活化 1 h;在 50 ℃油浴中加热搅拌 20 h 后停止反应。待反应液冷却至室温后,加入适量无水乙醇中搅拌,析出白色固体。白色固体用适量的无水乙醇、乙醚和四氢呋喃洗涤数次,在鼓风干燥机中50℃干燥。所得产物为疏水改性羧化支链淀粉多糖。
FTIR 和 NMR 光谱
CHP、CHSP 和 CHAP 的 FTIR 光谱是作为 KBr 颗粒获得的,用于 FTIR 光谱(Nicolet NEXUS 470-ESP,Thermo Fisher Scientific,Waltham,MA,USA)。 CHP、CHSP和CHAP的化学结构经500 MHz确认 1 H-NMR,以DMSO-d6为溶剂。 CHP聚合物中胆固醇的取代度由α-1,4和α-1,6糖苷键和亚甲基峰面积决定。
纳米颗粒的制备和表征
CHP、CHSP 和 CHAP NPs 是通过透析方法制备的 [33]。简而言之,将 CHP、CHSP 和 CHAP 溶解在 10 mL DMSO 中。为了形成 NP,将混合溶液注入透析袋 24 小时以去除 DMSO。 CHP、CHSP 和 CHAP NP 的溶液用膜过滤器(孔径 0.45 m,Millipore,波士顿,马萨诸塞州,美国)进行筛选,以去除较大的聚合 CHP、CHSP 和 CHAP NP。通过DLS(Zetasizer 3000 HS,Malvern Instruments,Malvern,UK)在11.4 V / cm,13.0 mA下测定所得颗粒的尺寸分布和zeta电位。
ITC
将一定浓度的 HSA 溶液滴在 CHP、CHSP 和 CHAP NP 溶液上,并通过 ITC(VP-ITC,Microcal,Northampton,MA,USA)测量热量的变化。将0.9 mM HSA注入0.01 mM CHP、CHSP和CHAP NP滴定池中,滴定20次。首滴2 μL,反应时间180 s;剩余滴量为每滴 10 μL,反应时间为 210 s,温度设定为 25 °C。滴定28次得到热力学参数和连接曲线。
荧光光谱
HSA 和 CHP NPs 以 HSA 与 CHP 的分子比为 3.6:1 混合,以制备 CHP-HSA、CHSP-HSA 和 CHAP-HSA 混合物。将所得混合物置于 2 mL EP 管中,并在 25°C 下以 20 rpm 的速度振荡 24 小时。通过荧光分光光度法(Shimadzu RF-4500,Japan)记录游离HSA和NP结合HSA的荧光光谱和荧光强度(FI)。 HSA 分子中的色氨酸发色团在 280 nm 处被激发,并在 290 至 450 nm 处记录发射光谱。激发和发射狭缝宽度分别为5和12 nm。
将 7 种不同浓度的 NP 溶液与 HSA 溶液混合。将混合溶液转移到 2 mL EP 管中进行 9 小时反应。收集获得的样品以测量波长 290-450 nm 的荧光光谱。根据 Stern-Volmer 分析,纯 HSA 溶液的荧光光谱用作参考以确定结合常数。利用改进的Stern-Volmer方程[34]分析荧光猝灭数据:
$$ {F}_0/\left({F}_0-F\right)=1/{f}_{\mathrm{a}}+1/\left({f}_{\mathrm{a}} {K}_{\mathrm{q}}\left[Q\right]\right) $$其中 K q 是 Stern–Volmer 的猝灭常数,F 0 和 F 是不存在和存在猝灭剂时 342 nm 处的荧光强度,和 [Q ]是猝灭剂的浓度。
圆二色性分析
CHP-HSA 复合物通过两种不同的方式制备。第一个(复合物 I)是通过简单地混合 HSA 和 CHP 溶液制备的。第二个(复合物 II)保存在 2 mL EP 管中,将其置于 25°C 下以 20 rpm 的振动台放置 12 小时。使用 CD 光谱仪(JASCO J-810,日本)在 37 °C 下使用 0.1 cm 比色皿在 200-250 nm 波长处记录添加到蛋白质中的游离 HSA 和 NP 的圆二色性(CD)光谱。所有样品中 HSA 的浓度均为 1.0 mg/mL。 HSA中的相对α-螺旋含量计算如下[35]:
$$ \left[{\theta}_{208}\right]=\frac{\theta M}{10 CL{N}_{\mathrm{r}}} $$其中 θ 208 是平均残差椭圆度 (deg cm −2 dmol −1 ) 在 208 nm, θ 是椭圆度,M 是 HSA 的分子量,C 是 HSA 的浓度 (mg/mL), L 是比色皿的长度 (cm),N r 为 HSA 分子中的氨基酸数目。
药物体外释放
负载米托蒽醌 (MTO) 的 NPs 是通过透析方法制备的 [36]。通过紫外分光光度法获得米托蒽醌的标准曲线。如[33]所述计算载药量和包封率。通过在磷酸盐缓冲盐水中透析在体外研究了 MTO 的释放。简而言之,将装载 MTO 的 NPs (2 mg/mL) 溶液放入 Visking 透析管中,并在 37 °C 下在空气浴振荡器中以 50 rpm 对释放介质进行透析。在预定义的时间,收集释放介质并添加新的释放介质。 MTO 的释放量通过紫外分光光度法(UV-384 plus,Molecular Devices,USA)在 608 nm 处测定。累积释放百分比 (Q %) 的计算方法如前所述 [37]。在透析管中加入一定量的HSA溶液(0.1 mg/mL),测定3种NPs的药物释放。
结果
CHP、CHSP 和 CHAP 聚合物的表征
FTIR 光谱
图 2 显示了 CHP、CHSP 和 CHAP 的 FTIR 光谱。 CHP 光谱的数据为 1731 cm -1 (–C=O 伸缩振动峰) 和 1161 cm -1 (–C=O 伸缩振动峰)。该结果表明在支链淀粉上形成了酯键,表明CHP已成功合成。
<图片>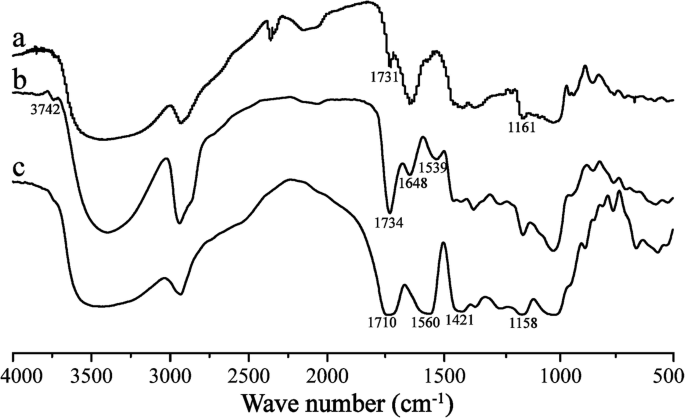
CHP (a)、CHAP (b)和CHSP (c)的FTIR光谱
与 CHP 光谱相比,CHAP 光谱的数据为 1648 cm -1 (–C=O 振动吸收峰), 1734 cm -1 (–C=O 振动吸收峰), 1539 cm -1 (–N–H 弯曲振动峰值), 和 3742 cm -1 (–NH2 伸缩振动峰)。根据这些特征峰,CHP上存在酰胺键,通过酯化反应成功合成了CHAP。
与 CHP 光谱相比,CHSP 光谱的数据为 1710 cm -1 (-C=O伸缩振动峰), 1158 cm -1 (-C=O伸缩振动峰), 1560 cm -1 (双-C=O耦合振动峰), 1421 cm -1 (–O–H 弯曲振动峰值)。这说明CHP上有羧基,部分变成了盐。
1 核磁共振
图 3 显示了 1 CHP、CHSP 和 CHAP 的 H NMR 光谱。总共有 0 到 2.40 ppm 属于胆固醇的氢信号,这表明 CHP 合成成功。 DMSO-d6的特征峰 和亚甲基 (–CH2CH2–) 分别在 2.49 和 2.53 ppm 处显示信号。与 CHP 相比,CHAP 在 8-9 ppm 处显示信号,属于氨基,证明乙二胺接枝到 CHP 上。 CHP中每100个葡萄糖单位的胆固醇取代度可以通过亚甲基质子与糖质子的比值计算得出[38]:
$$ \mathrm{DS}=\frac{A_{\partial 2.53}}{4\left({A}_{\partial 4.74}+{A}_{\partial 5.01}\right)} $$ <图片>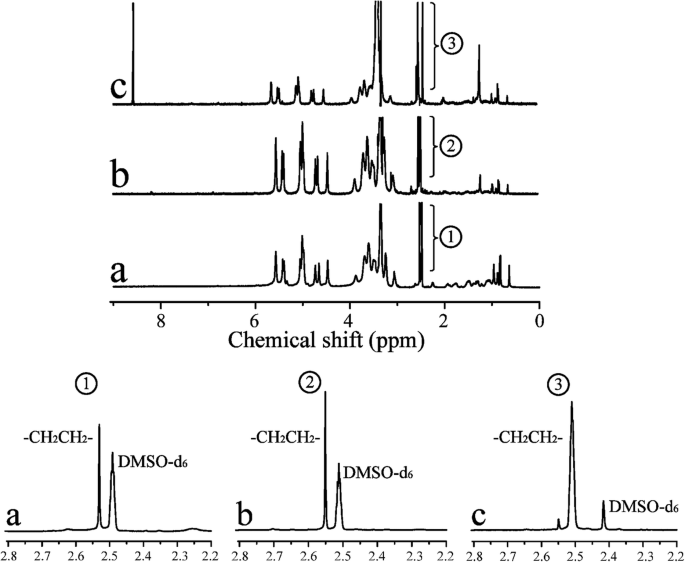
1 CHP (a)、CHSP (b) 和 CHAP (c) NPs 的 HNMR 谱
其中 A δ2.53为亚甲基(氢)特征吸收峰下的光谱面积,A δ4.74 和 A δ5.01分别为α-1,6和α-1,4糖苷键特征吸收峰下的光谱面积。
从 1 CHP中的H NMR谱,胆固醇琥珀酸酯(CHS)的取代度为4.50%。对于 CHSP NPs,亚甲基 (–CH2CH2–) 包括两个方面:琥珀酸酐和 CHS。亚甲基 (–CH2CH2–) 的取代度为 12.34%,羧基的取代度为 7.84%。对于 CHAP NPs,亚甲基 (–CH2CH2–) 包括两个方面:乙二胺和 CHS。亚甲基(-CH2CH2-)的取代度为18.6%,氨基的取代度为14.1%。
CHP、CHSP 和 CHAP NP 的属性
两亲聚合物可以通过透析自组装形成具有亲水壳和疏水核的核壳纳米颗粒,其可以负载抗癌药物形成负载药物的纳米颗粒。 NP 特性,如表面电荷和尺寸,对作为药物载体的治疗效果起着至关重要的影响 [39, 40]。 DLS 测量的 CHP、CHSP 和 CHAP NP 的尺寸分布和 zeta 电位如图 4 所示。对于 CHP、CHAP 和 CHSP,NP 的平均尺寸分别为 73.1、116.9 和 156.9 nm。 zeta电位分别为- 0.698、+ 12.9和- 15.4 mV(表1)。
<图片>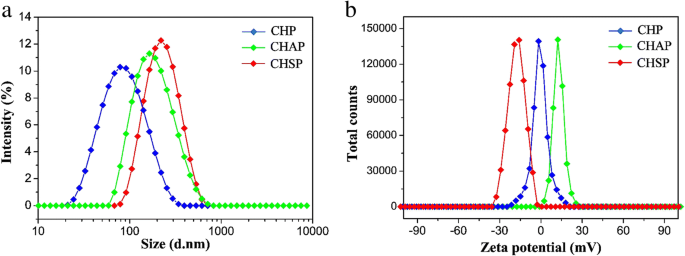
Zeta 电位 (a ) 和大小分布 (b ) 的 CHP NPs (  ), CHAP NPs (
  ) 和 CHSP NPs (
  )
)
对于具有相同疏水基团的支链淀粉 NP,带负电的 CHSP 和带正电的 CHAP 的尺寸大于中性 CHP NP。因此,带电基团会干扰 NPs 的自组装行为,在水溶液中形成具有松散结构的较大尺寸的 NPs。 CHP NPs、CHAP 和CHSP NPs 的zeta 电位分别为- 0.698 mV、+ 12.9 mV 和- 15.4 mV。因此,聚合物中的氨基和羧基可以产生具有不同表面电荷的纳米颗粒,从而改变表面性质。
热力学分析
使用 ITC 进行热力学分析,HSA 滴定到 CHP、CHSP 和 CHAP NP 溶液。在HSA滴定不同电荷的支链淀粉NP溶液时,我们测定了热量的变化,拟合了三种材料的连接性质、分子连接数和连接数。等温滴定温度计的原始光谱反映了热量的变化。向上的峰表示放热反应,向下的峰表示吸热反应[41, 42]。当 CHP、CHAP 和 CHSP NP 用 HSA 滴定时,组合释放的热量随时间逐渐减少(图 5)。总的来说,26 滴 HSA 溶液滴定到 CHP NP 溶液中,光谱峰向上,表明反应的放热性质。当 HSA 溶液滴定到 CHSP NP 溶液中时,观察到相同的现象。然而,当 HSA 溶液滴定到 CHAP NP 溶液中时,前四滴的光谱峰向上,而从第五滴开始,峰转向向下,表明吸热反应。 CHP 和 CHSP NPs 的 HSA 吸收是放热的,因此反应是自发的。 CHAP NPs的HSA吸收部分吸热部分放热,这可能与CHAP带正电荷有关。
<图片>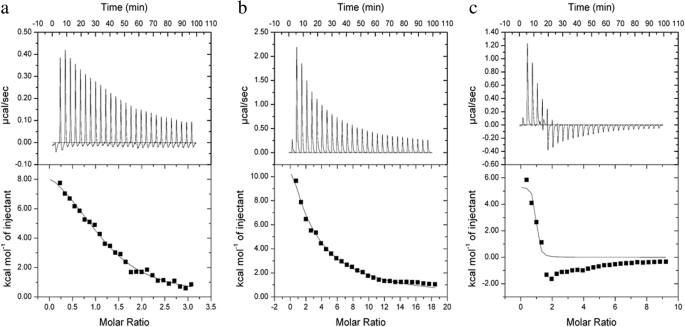
HSA滴定成a的等温滴定量热数据 热电联产,b CHSP 和 c CHAP NPs 在 25 °C。细胞 (250 μL) 中的 NP 浓度为 12 μM,注射器中的蛋白质浓度为 230 μM。上图显示原始数据,下图显示积分热量
焓值反映了 HSA 和 NPs 结合释放的热量。 HSA 对 CHP、CHSP 和 CHAP NPs 的焓变分别为 42.827、80.3712 和 22.3951 KJ/mol(表 2)。结合焓变、放热反应、两亲NPs的化学结构以及HSA的负电荷,疏水相互作用可能主要驱动HSA与CHP和CHSP NPs的相互作用。值得注意的是,在 CHAP 的 HSA 滴定中,热量包括一个负值。 HSA 分子包含一个疏水口袋,可以与 NP 的疏水中心结合 [43],因此由前四滴 HSA 和 CHAP 触发的相互作用主要由疏水力驱动。虽然HSA带负电而CHAP带正电,但从第五滴开始,由于反应的吸热性质,HSA和CHAP之间也存在电荷力。
熵变的值可以反映HSA与NPs反应的难易程度。 HSA 和 CHP、CHSP 和 CHAP NPs 的熵分别为 0.251、2.775 和 0.201 KJ/mol K(表 2),因此 CHP 和 CHAP NPs 更容易与 HSA 结合,而 CHSP NPs 更难结合绑定到 HSA。
HSA 和 CHP、CHSP 和 CHAP NP 的覆盖率分别为 1.17、0.404 和 0.845。 NPs 的浓度是根据聚合物的浓度而不是粒子数计算的。我们不知道有多少单个聚合物颗粒含有单个 NP,因此我们无法准确确定每个 NP 中有多少被 HSA 吸附,但根据覆盖率值,我们可以得出结论,CHP NPs 对 HSA 的吸附量最高。
在之前的实验中,我们表明亲和力值 K A,反映了NPs和HSA之间结合力的强弱[32]。 CHP NPs 的疏水性越强,亲和力越强[44]。 HSA与CHP的结合常数为27.7 × 10 4 M −1 , HSA 和 CHSP 为 1.41 × 10 4 M −1 ,HSA 和 CHAP 为 412 × 10 4 M −1 .因此,HSA 和带正电的 CHAP 的组合最强,其次是带中性电的 CHP 和带负电的 CHSP。 HSA 和 CHAP 的最强组合可能归因于疏水力、电荷力的相互吸引以及 HSA 和 CHSP 之间可能相互排斥的电荷。
荧光光谱
通过荧光光谱,我们研究了 HSA 与三种不同表面电荷的 NPs 之间的相互作用。 HSA 含有 585 个氨基酸残基,在 214(Trp214)处只有一个 Trp 残基,其荧光光谱在 UV 区域占主导地位。当其他分子与 HSA 相互作用时,Trp 的荧光光谱可能会发生变化,这取决于 HSA 与其他分子之间的相互作用。当三种纳米颗粒与HSA混合时,HSA荧光光谱的最大发射峰没有发生化学位移;只有强度在一定程度上减弱(图6A)。当HSA与CHAP NPs结合时,观察到HSA的最大发射峰。
<图片>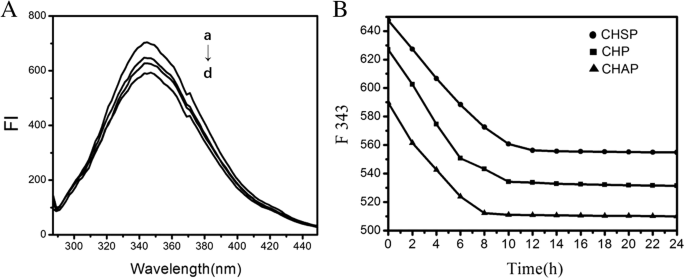
A HSA 的荧光光谱 (1.5 × 10 − 5 mol/L) 没有 (a) 和 (b) CHSP, (c) CHP 和 (d) CHAP NPs 具有相同的浓度 (4.2 × 10 − 6 摩尔/升)。 B 343 nm 处 CHSP、CHP 和 CHAP NPs 的 HSA 发射强度随时间变化
实验研究表明,结合 HSA 和支链淀粉 NPs 显示出一个复杂的过程 [45]。我们将三种 NPs 添加到 HSA 溶液中,发现三种 NP-HSA 复合物的荧光强度逐渐降低(图 6B)。 12 小时后 HSA-CHSP 在 556.3 nm 处达到平衡,10 小时后 CHP-HSA 在 534.3 nm 处达到平衡,8 小时后 CHAP-HSA 在 512.3 nm 处达到平衡。不同NP-HSA复合物荧光强度平衡所需的时间与NP携带的电荷有关。在带负电的 CHSP-HSA 上观察到达到平衡所需的最长时间,其次是不带电的 CHP-HSA。
三种 NP-HSA 复合物的初始荧光强度迅速降低(如图 6A 所示)是由于 NPs 和 HSA 的快速吸附。由于 NPs 与 HSA 的相互作用是一个缓慢的结合过程,因此随后的荧光强度显示出缓慢下降到恒定状态。恒定的荧光强度反映了络合的饱和状态。三种带不同电荷的 NPs 与 HSA 之间的相互作用经历了早期的快速重组过程和后期的缓慢重组过程。与不带电的 CHP 相比,带负电的 HSA 与带负电的 CHSP 的组合需要更长的时间来实现复杂的饱和。带负电的HSA结合带正电的CHAP需要最短的时间达到复合饱和。
图 7A-C 显示了 HSA 与不同浓度的 CHSP、CHP 和 CHAP NP 结合形成 NP-HSA 复合物的光谱。随着NPs浓度的增加,NP-HSA复合物的最大吸收峰降低,呈负相关。
<图片>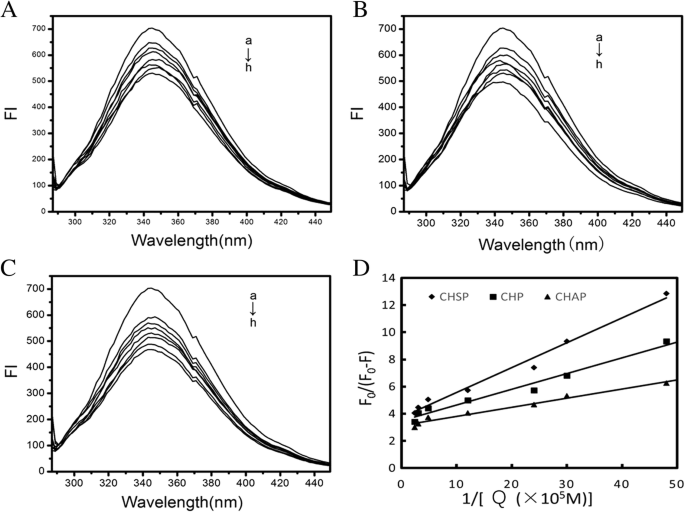
HSA的荧光光谱(1.5 × 10 − 5 mol/L) 与 CHSP (A ), 热电联产 (B ) 和 CHAP (C ) 不同浓度 (a) 0, (b) 2.07 × 10 −7 , (c) 3.31 × 10 −7 , (d) 4.14 × 10 −7 , (e) 8.28 × 10 −7 , (f) 20.7 × 10 −7 , (g) 33.1 × 10 −7 , 和 (h) 41.4 × 10 −7 摩尔/升。 D 绘图 (n =7) 对于 F 0/(F 0 − F) vs 1/[Q ], 问 分别是CHSP(–◆–)、CHP(–■–)和CHAP(–▲–)的浓度
带正电荷的CHAP-HSA达到平衡的时间最短。
我们使用修正的 Stern-Volmer 方程来分析荧光猝灭数据:
$$ {F}_0/\left({F}_0-F\right)=1/{f}_{\mathrm{a}}+1/\left({f}_{\mathrm{a}} {K}_{\mathrm{q}}\left[Q\right]\right) $$其中 f a 是荧光物质与猝灭剂的接触分数,K q 是 Stern-Volmer 猝灭常数,F 0 是没有淬灭剂时 342 nm 处的荧光强度,F 是淬灭剂在 342 nm 处的荧光强度,[Q ]是猝灭剂的浓度。
来自F的功能图 0/(F 0 − F ) 对 1/[Q ],我们可以得到f的值 a 和 K q 来自斜率和截距(图 7D)。 Assuming that the observed fluorescence intensity changes mainly due to the interaction between NPs and HSA, the quenching constant can be seen as a binding constant for the formation of complexes. The binding constants for HSA and CHSP, CHP, and CHAP molecules were 2.02, 2.99, 4.72 × 10 5 M −1 , 分别。 In the previous study, we discussed the interaction between HSA and CHP NPs with different hydrophobicity substitutions [30]. The hydrophobic interaction between HSA molecules and CHP cholesterol played an important role in the formation of CHP–HSA. The greater the hydrophobic substitution of CHP, the greater the binding constant of CHP and HSA.
In the present study, we found that the value of the binding constant (K b) is related to the electrical properties of the NP. A surface with a positive charge, such as CHAP, has the largest K b, and a surface without a charge, such as CHP, has the second largest K 湾The K b for CHSP, with a negative charge, was the lowest. Therefore, in addition to the hydrophobic interaction between NPs and HSA, the electrostatic interaction between them also plays an essential part in the formation of NP–HSA complexes.
In addition, the f a values for CHSP, CHP, and CHAP NPs were 0.269, 0.288, 0.38, respectively, so part of the Trp residue was involved in this reaction. Furthermore, the amount of HSA was too much at a given NP/HSA concentration, so free HSA molecules presented in the reaction system.
CD Spectrum Analysis
Figure 8A shows the CD spectra (a) free HSA, (b) CHSP–HSA, (c) CHAP–HSA, and (d) CHP–HSA in solution at 25 °C. The samples were complex I. There are two negative bands at 208 and 222 nm of the UV region in HSA spectra, which are the characteristic peaks of the α -helical structure. The α -helical content of free HSA was 55%. At the beginning of the complex, with the recombination of HSA and CHSP, CHAP, and CHP NPs, the α -helical content of HSA was reduced to 52.0%, 48.57%, and 48.0%, respectively.

A CD spectra for (a) free HSA, (b) CHSP–HSA, (c) CHAP–HSA, and (d) CHP–HSA in solution at 25 °C. The samples were complex I. B CD spectra for (a) free HSA, (b) CHSP–HSA, (c) CHAP–HSA, and (d) CHP–HSA in solution at 25 °C. The samples were complex II. C Ellipticity at 208 nm for HSA interacting with CHSP (–▲–), CHAP (–●–) and CHP (–■–) over time
Figure 8C shows that the ellipticity changes of the three samples at 208 nm over time. The ellipticity of HSA combined with CHAP and CHP NPs increased from 0 to 12 h and leveled off at 12 h, but that of HSA with CHSP NPs increased faster, i.e., the ellipticity increased from 0 to 9 h and leveled off at 9 h. Therefore, the ellipticity of the three samples gradually increased over time and the α-helical content gradually decreased; when the ellipticity maintained constant, the recombination of the sample and HSA was completed.
Figure 8C illustrates that the fastest surface absorption rate was presented on the combination of CHSP and HSA. The size, charge, and hydrophobicity of NPs can influence the migration rate of HSA to the center of NPs. The surface of CHP is not charged, the surface of CHSP is negatively charged, and the surface of CHAP is positively charged. Owing to the presence of the negative-charge mutual exclusion between CHSP and HSA, the resistance of HSA migrating to the CHSP NP center becomes larger. The traction of NPs on HSA is driven by the hydrophobic interaction forces. The traction of the three NPs on HSA is identical, so the lowest velocity of HSA migrating to the center of NPs was observed on the combination of HSA and CHSP NPs. Because the particle size is in the order of CHSP> CHAP> CHP, the particle density displays a reverse order, i.e., CHSP
The ITC results show that the amount of HSA migrating toward the center of CHSP NPs is the smallest but with the fastest speed compared with other types of NPs. Table 3 shows that the α-helix content of HSA migrating toward the center of CHP NPs was the lowest. The more the secondary structure of HSA was damaged, the faster the HSA migrated toward the center. The fastest speed was observed on HSA migrating to the center of CHSP NPs (Fig. 8C).
Figure 8B shows CD spectra for (a) free HSA, (b) CHSP–HSA, (c) CHAP–HSA, and (d) CHP–HSA in solution at 25 °C. The samples were complex II. After the complexation is completed, the α -helical content of HSA recombined with CHSP, CHAP, and CHP was reduced to 46.27%, 44.55%, and 42.91%, respectively (Table 3). With the increase in interaction time, the secondary structure of HSA was changed and the α -helical content was reduced during the process of complexation with NPs.
We measured the drug release rate of MTO with the three kinds of drug-loaded NPs and drug-loaded NP–HSA complexes. The drug release for free MTO was about 99.8% at 4 h (Fig. 9). The release rate in 48 h for CHP, CHAP, and CHSP NPs was 53.68%, 58.54%, and 63.24%, respectively. The drug release from all NPs was fast in the first 8 h, which was a burst release process, and the drug release remained stable after 12 h, which was a sustained release process. In vitro drug release from NPs is not affected by gastrointestinal pH and enzymes, and the dissolution of nanomaterials results in little drug release. The release is mainly determined by dissolution and diffusion [46]. The 48-h drug release rate was in the order of CHSP> CHAP> CHP, corresponding to the size of NPs. The fastest release rate was found on CHSP, which was negatively charged with the largest size. The second fast drug release rate was found on which was positively charged with the size smaller than CHSP. CHP was electrically neutral, and its drug release rate was minimal. Hence, the polymer surface groups involved in the formation of NPs affect the size of NPs and ultimately the drug release of NPs.
Mitoxantrone (MTO) release of pullulan NPs in phosphate-buffered saline (PBS) at 37 °C in vitro (□:free mitoxantrone, ○:CHP, △:CHAP, ▽:CHSP, ◁:CHAP–HSA,◇:CHP–HSA, ▷:CHSP–HSA)
The drug release rate from the combinations of HSA and CHAP, CHP, and CHSP in 48 h was 32.45%, 33.86%, and 35.76%, respectively. After the combination of NPs and HSA, the drug release in 48 h was significantly decreased as compared with HSA-free NPs, which was mainly attributed to the resistive effect and adsorption effect of HSA. At 48 h, the drug release of the compounds was in the order of CHSP–HSA> CHP–HSA> CHAP–HSA, while the drug release of HSA-free NPs was in the order of CHSP> CHAP> CHP. Although NP–HSA compounds showed significantly slow drug release, the total release of CHP-HSA decreased by 21.23% in 48 h, whereas the total release of CHAP-HSA decreased by 25.68% and that of CHSP-HSA by 28.48%. The drug release of the NPs is related to the size of the NPs and the polymer hydrophobic groups on NP surface. The adsorption of HSA can lead to significant slowdown in drug release, which is related to the hydrophobicity of NPs and also to the surface charge of NPs [46]. The adsorption of HSA is closely related to the size of the NPs and the degree of substitution of the hydrophobic groups of the polymer during the self-assembly process. Nevertheless, the drug release of the NPs is ultimately determined by the properties of the NP itself.Drug Release

Discussion
As shown in Fig. 10, the formation of the NP–HSA complex is driven by a hydrophobic force between cholesterol groups of the particle core and the aromatic amino acid of the hydrophobic domain of HSA. After mixing, HSA interacts with the surface cholesterol unit and is rapidly adsorbed to the NP surface. Then, the adsorbed HSA on the NP surface is processed because of the hydrophobic forces derived from the cholesteric unit in the particle core. When overcoming the steric hindrance of polysaccharide chains in the NP shell, the adsorbed HSA gradually migrates to the core. After the hydrophobic interaction and resistance of the hydrophilic polysaccharide chain are balanced, the HSA molecule enters the particle core to become hydrophobically bound to cholesterol groups to form the NP–HSA complex.

Adsorption of HSA to NPs
For CHAP and CHSP NPs, the recombination of HSA is a complex process also subjected to the charge interaction with HSA under the traction of the hydrophobic driving force. The binding constants of the three kinds of NPs with the same hydrophobic substitution and different surface charge were in the order of CHAP> CHP> CHSP. The electrical properties also play a major part in the formation of NP–HSA. In this process, the formation of the CHSP–HSA complex was blocked by the structure of the NP shell and the repulsive force between the negative charges, which led to their loose connection. During the rapid adsorption and slow recombination, the degree of spiraling of HSA is lower for CHSP NPs than CHP NPs and CHAP NPs. Therefore, the surface charge of NPs not only changes the nature of the particles themselves but also affects the protein complex.
In the current study, we investigated the effect of NP surface charge on the interaction between NPs and proteins (Fig. 10). Three different charges of pullulan NPs with HSA adsorption still showed rapid adsorption and slow recombination. The number of HSA molecules with positively charged CHAP complex was the most, including rapid adsorption of NP–HSA by hydrophobic forces, HSA molecule migration to the center, and the HSA molecules adsorbed on the surface of NPs by charge action. CHP- and CHSP-adsorbed HSA molecules were mainly distributed in the hydrophobic center of NPs, with CHSP adsorbing fewer HSA molecules. The adsorbed number of HSA molecules is related to the hydrophobicity of NPs. The greater the degree of substitution of hydrophobicity, the more HSA is adsorbed [41]. The cholesterol substitutions of the three NPs were the same, and the number of HSA molecules adsorbed by positively charged NPs was the highest, so the adsorption of NPs and HSA was related to the hydrophobicity and surface charge of the NPs.
The surface adsorption capacity between NPs and HSA is also related to the hydrophobicity and charge of NPs. The binding force between HSA and NPs is determined by the hydrophobicity, surface charge, size, and structure of NPs. The α-helicity was decreased most at the beginning of adsorption and the complete CHP–HSA complex. CHP NP has the smallest size and highest density. The CHP NPs migrated toward the center by the hydrophobic traction; the sugar chain of the CHP NP shell was larger to inhibit the migration toward the center. The extension of the peptide chain of HSA is larger, with the α -helix decreased the most. Although CHAP NPs have hydrophobic and charge forces, they possess relatively large size, loose structure, small resistance in the periphery, small extension of the peptide chain, and small content of the α -helix. Some HSAs remained on the surface of NPs through the charge force of adsorbing, and the α -helical content is also smaller in this part of the HSA. The α -helix content of CHAP decreased less than that of CHP, mainly due to the peptide chain extension-induced central pulling force which led to α-helix content decline. During the process of the CHSP and HSA complexation, the role of the central pulling force has a reverse direction of the charge force, thereby resulting in weakening the center of the migration force. CHSP NPs are larger than CHAP NPs, and the structure of CHAP NPs is loose. Because the adsorbed number of HSA on CHAP is higher than that on CHSP, the decrease of α -helicity in CHSP is less than that in CHAP NPs. Therefore, the interaction between NPs and HSA and the decrease in α -helicity are all related to the size, density, hydrophobicity of substitution, surface charge of the NPs, and number of HSA connections.
After the NPs enter into the blood, protein adsorption affects the functions of NPs, such as the slow and controlled drug release, the travel from the blood circulation passing through the vascular barrier, targeting tissue, and entering cells. NPs interact with the HSA in the body and affect the in vivo behavior of NPs. The number of adsorbed proteins is closely related to the properties of the NPs. HSA adsorbs NPs, which affects the distribution in organs and removal of NPs, thereby altering the concentration of the drug in the body and the efficacy of the drug.
Finally, the properties of NPs, such as size, hydrophobicity, and surface charge, affect the drug release of NPs in vivo. We can design specific materials to perform specific functions with specific protein adsorption.
Conclusions
In this study, three kinds of nano-drug carriers were constructed, CHP, CHSP, and CHAP. The size, charge, drug loading properties of NPs, interaction between NPs and HSA, and drug release were all closely related to charge amount and charge type of nanomaterials. With the same degree of substitution of hydrophobicity, CHAP NPs with larger amino substitutions were the largest, CHSP NPs the second largest, and CHP NPs the smallest. The size and surface charge of the NPs were essential to the coverage of HSA, the binding constant, and the slow drug release. The positively charged CHAP binding constant was the strongest, showing the fastest drug release, and CHP NPs had the highest coverage. The combination of HSA further retarded the drug release of NPs. CHAP NPs adsorbed HSA had the slowest drug release rate.
缩写
- CH:
-
Cholesteric hydrophobically
- CHAP:
-
CH-modified animated pullulan
- CHP:
-
Cholesteric hydrophobically (CH) modified pullulan
- CHSP:
-
CH-modified carboxylated pullulan
- DMSO:
-
Dehydrated dimethyl sulfoxide
- HSA:
-
人血清白蛋白
- K b :
-
The binding constant
- MTO:
-
Mitoxantrone
- NP:
-
纳米粒子
纳米材料
- 复杂的电压和电流计算
- 用于增强药物递送的纳米纤维和细丝
- 生物相容性 FePO4 纳米颗粒:药物递送、RNA 稳定和功能活性
- 通过镀金和等离子处理调整聚醚醚酮的表面化学
- 基于苯基三甲氧基硅烷改性氧化铝纳米颗粒的 Al2O3:SiOC 纳米复合材料的形成和发光特性
- 通过界面层设计调整 ZnO 薄膜的表面形貌和特性
- 通过控制表面润湿性和湿度在绝缘基材上电纺
- 超材料中表面等离子体激元和磁偶极子共振的耦合效应
- 5-氨基乙酰丙酸-角鲨烯纳米组件用于肿瘤光检测和治疗:体外研究
- 弹性刚度和表面附着力对纳米粒子弹跳的影响
- 纳米粒子毒性对其物理和化学性质的依赖性
- 水-癸烷-二氧化硅体系中的油接触角:表面电荷的影响